|
|||||||||||||||||||||||||||||||||||||||||||||||||||||||||||||||||||||||||||||||||||||||||||||||||||||||||||||||||||||||||||||||||||||||||||||||||||||||||||||||||||||||||||||||||||||||||||||||||||||||||||||||||||||||||||||||||||||||||||||||||||||||||||||||||||||||||||||||||||||||||||||||||||||||||||||||||||||||||||||||||||||||||||||||||||||||||||||||||||||||||||||||||||||||||||||
| |
| Phenotypic Information (metabolism pathway, cancer, disease, phenome) |
| |
| |
| Gene-Gene Network Information: Co-Expression Network, Interacting Genes & KEGG |
| |
|


| Gene Summary for DBH |
| Basic gene info. | Gene symbol | DBH |
| Gene name | dopamine beta-hydroxylase (dopamine beta-monooxygenase) | |
| Synonyms | DBM | |
| Cytomap | UCSC genome browser: 9q34 | |
| Genomic location | chr9 :136501484-136524466 | |
| Type of gene | protein-coding | |
| RefGenes | NM_000787.3, | |
| Ensembl id | ENSG00000123454 | |
| Description | dopamine beta-hydroxylase | |
| Modification date | 20141222 | |
| dbXrefs | MIM : 609312 | |
| HGNC : HGNC | ||
| Ensembl : ENSG00000123454 | ||
| HPRD : 01963 | ||
| Vega : OTTHUMG00000020878 | ||
| Protein | UniProt: go to UniProt's Cross Reference DB Table | |
| Expression | CleanEX: HS_DBH | |
| BioGPS: 1621 | ||
| Gene Expression Atlas: ENSG00000123454 | ||
| The Human Protein Atlas: ENSG00000123454 | ||
| Pathway | NCI Pathway Interaction Database: DBH | |
| KEGG: DBH | ||
| REACTOME: DBH | ||
| ConsensusPathDB | ||
| Pathway Commons: DBH | ||
| Metabolism | MetaCyc: DBH | |
| HUMANCyc: DBH | ||
| Regulation | Ensembl's Regulation: ENSG00000123454 | |
| miRBase: chr9 :136,501,484-136,524,466 | ||
| TargetScan: NM_000787 | ||
| cisRED: ENSG00000123454 | ||
| Context | iHOP: DBH | |
| cancer metabolism search in PubMed: DBH | ||
| UCL Cancer Institute: DBH | ||
| Assigned class in ccmGDB | C | |
| Top |
| Phenotypic Information for DBH(metabolism pathway, cancer, disease, phenome) |
| Cancer | CGAP: DBH |
| Familial Cancer Database: DBH | |
| * This gene is included in those cancer gene databases. |
|
|
|
|
|
| . | |||||||||||||||||||||||||||||||||||||||||||||||||||||||||||||||||||||||||||||||||||||||||||||||||||||||||||||||||||||||||||||||||||||||||||||||||||||||||||||||||||||||||||||||||||||||||||||||||||||||||||||||||||||||||||||||||||||||||||||||||||||||||||||||||||||||||||||||||||||||||||||||||||||||||||||||||||||||||||||||||||||||||||||||||||||||||||||||||||||||||||||||||||||||
Oncogene 1 | Significant driver gene in | ||||||||||||||||||||||||||||||||||||||||||||||||||||||||||||||||||||||||||||||||||||||||||||||||||||||||||||||||||||||||||||||||||||||||||||||||||||||||||||||||||||||||||||||||||||||||||||||||||||||||||||||||||||||||||||||||||||||||||||||||||||||||||||||||||||||||||||||||||||||||||||||||||||||||||||||||||||||||||||||||||||||||||||||||||||||||||||||||||||||||||||||||||||||||||||
| cf) number; DB name 1 Oncogene; http://nar.oxfordjournals.org/content/35/suppl_1/D721.long, 2 Tumor Suppressor gene; https://bioinfo.uth.edu/TSGene/, 3 Cancer Gene Census; http://www.nature.com/nrc/journal/v4/n3/abs/nrc1299.html, 4 CancerGenes; http://nar.oxfordjournals.org/content/35/suppl_1/D721.long, 5 Network of Cancer Gene; http://ncg.kcl.ac.uk/index.php, 1Therapeutic Vulnerabilities in Cancer; http://cbio.mskcc.org/cancergenomics/statius/ |
| KEGG_TYROSINE_METABOLISM REACTOME_METABOLISM_OF_AMINO_ACIDS_AND_DERIVATIVES | |
| OMIM | |
| Orphanet | |
| Disease | KEGG Disease: DBH |
| MedGen: DBH (Human Medical Genetics with Condition) | |
| ClinVar: DBH | |
| Phenotype | MGI: DBH (International Mouse Phenotyping Consortium) |
| PhenomicDB: DBH | |
| Mutations for DBH |
| * Under tables are showing count per each tissue to give us broad intuition about tissue specific mutation patterns.You can go to the detailed page for each mutation database's web site. |
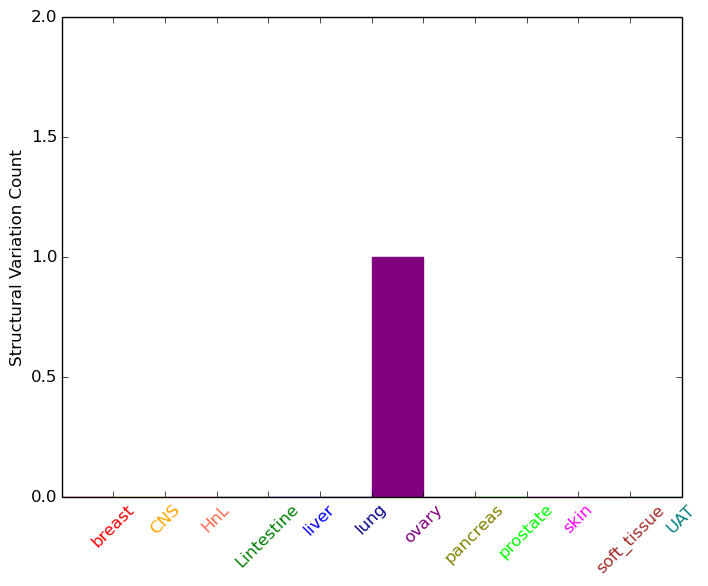
| - Statistics for Tissue and Mutation type | Top |
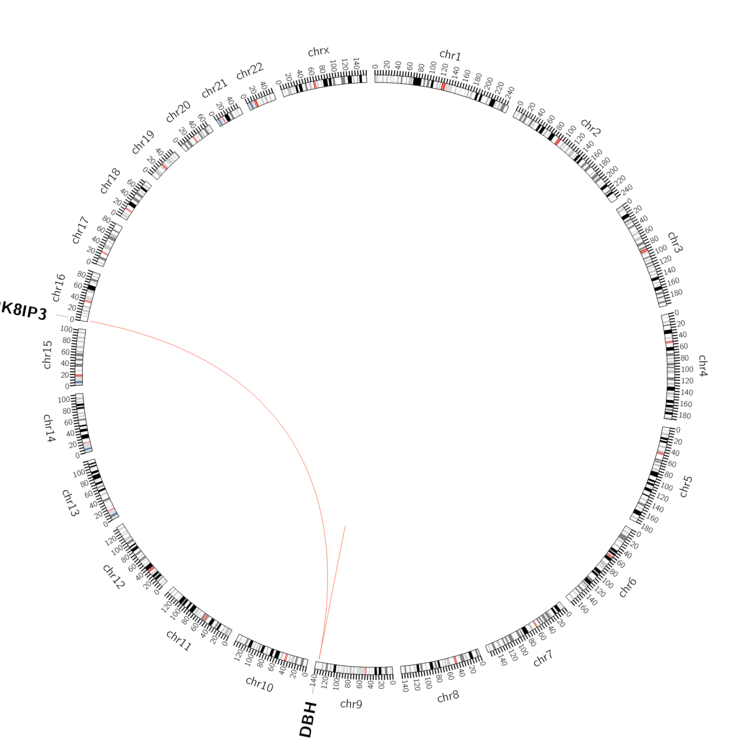 |
| - For Inter-chromosomal Variations |
| * Inter-chromosomal variantions includes 'interchromosomal amplicon to amplicon', 'interchromosomal amplicon to non-amplified dna', 'interchromosomal insertion', 'Interchromosomal unknown type'. |
 |
| - For Intra-chromosomal Variations |
| * Intra-chromosomal variantions includes 'intrachromosomal amplicon to amplicon', 'intrachromosomal amplicon to non-amplified dna', 'intrachromosomal deletion', 'intrachromosomal fold-back inversion', 'intrachromosomal inversion', 'intrachromosomal tandem duplication', 'Intrachromosomal unknown type', 'intrachromosomal with inverted orientation', 'intrachromosomal with non-inverted orientation'. |
 |
| Sample | Symbol_a | Chr_a | Start_a | End_a | Symbol_b | Chr_b | Start_b | End_b |
| ovary | DBH | chr9 | 136508337 | 136508357 | DBH | chr9 | 136508545 | 136508565 |
| ovary | DBH | chr9 | 136521852 | 136521872 | MAPK8IP3 | chr16 | 1820216 | 1820236 |
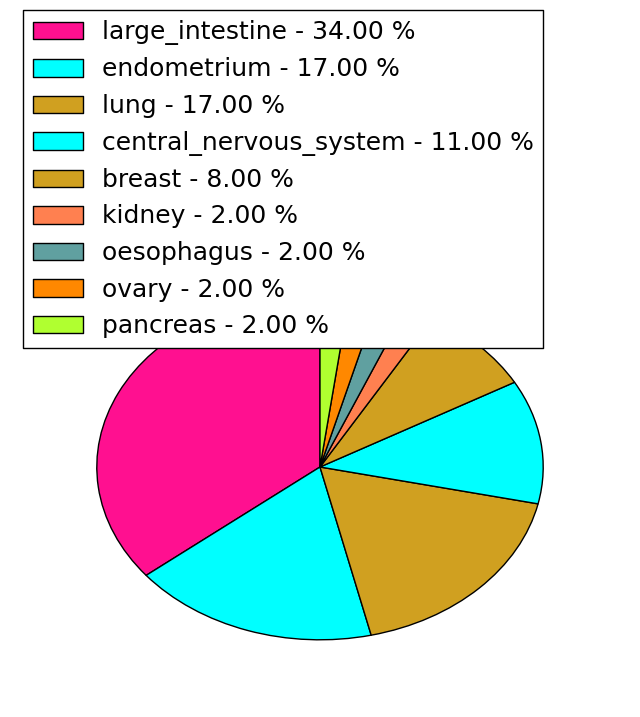
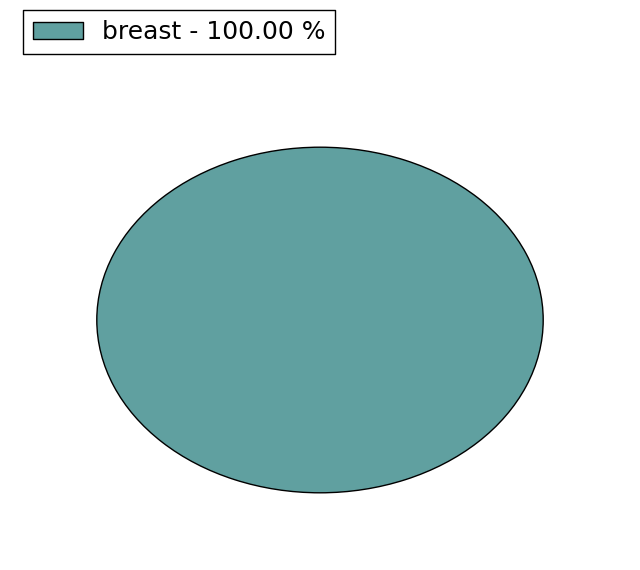
| cf) Tissue number; Tissue name (1;Breast, 2;Central_nervous_system, 3;Haematopoietic_and_lymphoid_tissue, 4;Large_intestine, 5;Liver, 6;Lung, 7;Ovary, 8;Pancreas, 9;Prostate, 10;Skin, 11;Soft_tissue, 12;Upper_aerodigestive_tract) |
| * From mRNA Sanger sequences, Chitars2.0 arranged chimeric transcripts. This table shows DBH related fusion information. |
| ID | Head Gene | Tail Gene | Accession | Gene_a | qStart_a | qEnd_a | Chromosome_a | tStart_a | tEnd_a | Gene_a | qStart_a | qEnd_a | Chromosome_a | tStart_a | tEnd_a |
| Top |
| Mutation type/ Tissue ID | brca | cns | cerv | endome | haematopo | kidn | Lintest | liver | lung | ns | ovary | pancre | prost | skin | stoma | thyro | urina | |||
| Total # sample | 1 | 1 | ||||||||||||||||||
| GAIN (# sample) | 1 | 1 | ||||||||||||||||||
| LOSS (# sample) |
| cf) Tissue ID; Tissue type (1; Breast, 2; Central_nervous_system, 3; Cervix, 4; Endometrium, 5; Haematopoietic_and_lymphoid_tissue, 6; Kidney, 7; Large_intestine, 8; Liver, 9; Lung, 10; NS, 11; Ovary, 12; Pancreas, 13; Prostate, 14; Skin, 15; Stomach, 16; Thyroid, 17; Urinary_tract) |
| Top |
|
 |
| Top |
| Stat. for Non-Synonymous SNVs (# total SNVs=63) | (# total SNVs=35) |
 |  |
(# total SNVs=0) | (# total SNVs=1) |
 |
| Top |
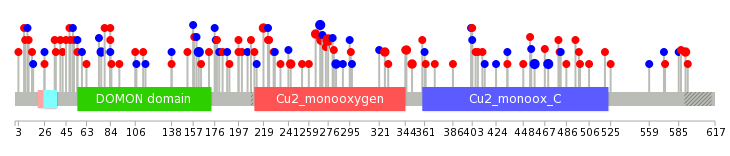
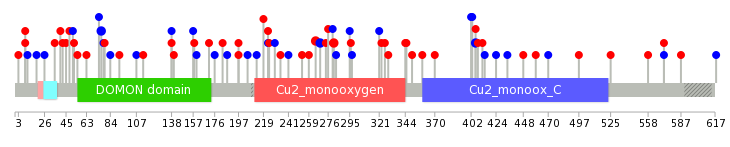
| * When you move the cursor on each content, you can see more deailed mutation information on the Tooltip. Those are primary_site,primary_histology,mutation(aa),pubmedID. |
| GRCh37 position | Mutation(aa) | Unique sampleID count |
| chr9:136508616-136508616 | p.V276I | 6 |
| chr9:136517406-136517406 | p.P458P | 3 |
| chr9:136518097-136518097 | p.T470T | 3 |
| chr9:136508597-136508597 | p.C269C | 3 |
| chr9:136508598-136508598 | p.A270T | 3 |
| chr9:136505114-136505114 | p.E162E | 3 |
| chr9:136523486-136523486 | p.E591K | 2 |
| chr9:136512976-136512976 | p.D345N | 2 |
| chr9:136501721-136501721 | p.L76L | 2 |
| chr9:136512992-136512992 | p.R350H | 2 |
| Top |
|
 |
| Point Mutation/ Tissue ID | 1 | 2 | 3 | 4 | 5 | 6 | 7 | 8 | 9 | 10 | 11 | 12 | 13 | 14 | 15 | 16 | 17 | 18 | 19 | 20 |
| # sample | 2 | 3 | 1 | 13 | 5 | 4 | 2 | 7 | 2 | 5 | 1 | 18 | 9 | 12 | ||||||
| # mutation | 2 | 3 | 1 | 12 | 4 | 4 | 2 | 7 | 2 | 5 | 1 | 17 | 10 | 15 | ||||||
| nonsynonymous SNV | 2 | 2 | 6 | 1 | 3 | 2 | 5 | 2 | 4 | 1 | 9 | 4 | 9 | |||||||
| synonymous SNV | 1 | 1 | 6 | 3 | 1 | 2 | 1 | 8 | 6 | 6 |
| cf) Tissue ID; Tissue type (1; BLCA[Bladder Urothelial Carcinoma], 2; BRCA[Breast invasive carcinoma], 3; CESC[Cervical squamous cell carcinoma and endocervical adenocarcinoma], 4; COAD[Colon adenocarcinoma], 5; GBM[Glioblastoma multiforme], 6; Glioma Low Grade, 7; HNSC[Head and Neck squamous cell carcinoma], 8; KICH[Kidney Chromophobe], 9; KIRC[Kidney renal clear cell carcinoma], 10; KIRP[Kidney renal papillary cell carcinoma], 11; LAML[Acute Myeloid Leukemia], 12; LUAD[Lung adenocarcinoma], 13; LUSC[Lung squamous cell carcinoma], 14; OV[Ovarian serous cystadenocarcinoma ], 15; PAAD[Pancreatic adenocarcinoma], 16; PRAD[Prostate adenocarcinoma], 17; SKCM[Skin Cutaneous Melanoma], 18:STAD[Stomach adenocarcinoma], 19:THCA[Thyroid carcinoma], 20:UCEC[Uterine Corpus Endometrial Carcinoma]) |
| Top |
| * We represented just top 10 SNVs. When you move the cursor on each content, you can see more deailed mutation information on the Tooltip. Those are primary_site, primary_histology, mutation(aa), pubmedID. |
| Genomic Position | Mutation(aa) | Unique sampleID count |
| chr9:136508583 | p.C269C | 2 |
| chr9:136516782 | p.L76L | 2 |
| chr9:136508597 | p.G281R | 2 |
| chr9:136501721 | p.I406I | 2 |
| chr9:136508631 | p.E265K | 2 |
| chr9:136517375 | p.R359C | 1 |
| chr9:136501635 | p.F558L | 1 |
| chr9:136507542 | p.F74F | 1 |
| chr9:136508675 | p.I183M | 1 |
| chr9:136501814 | p.D274N | 1 |
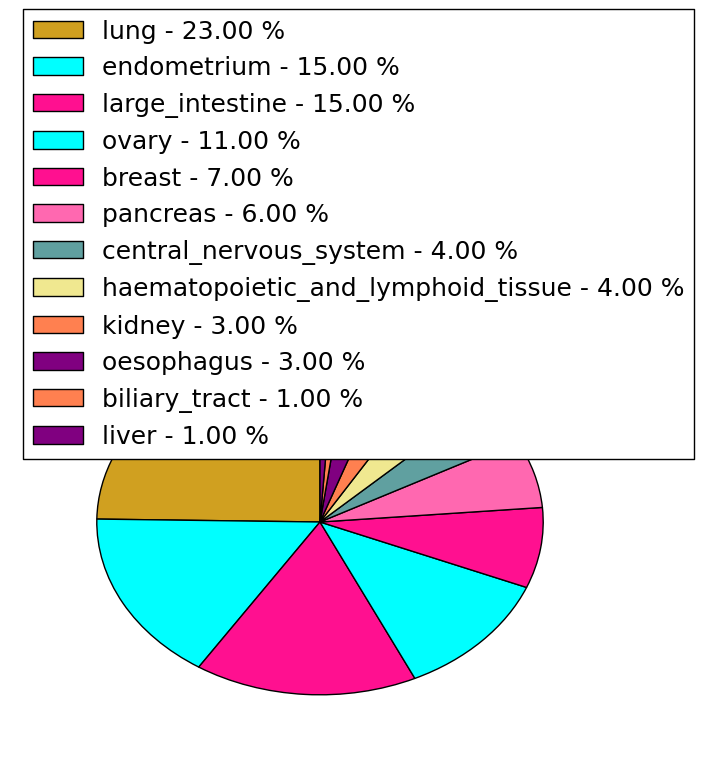
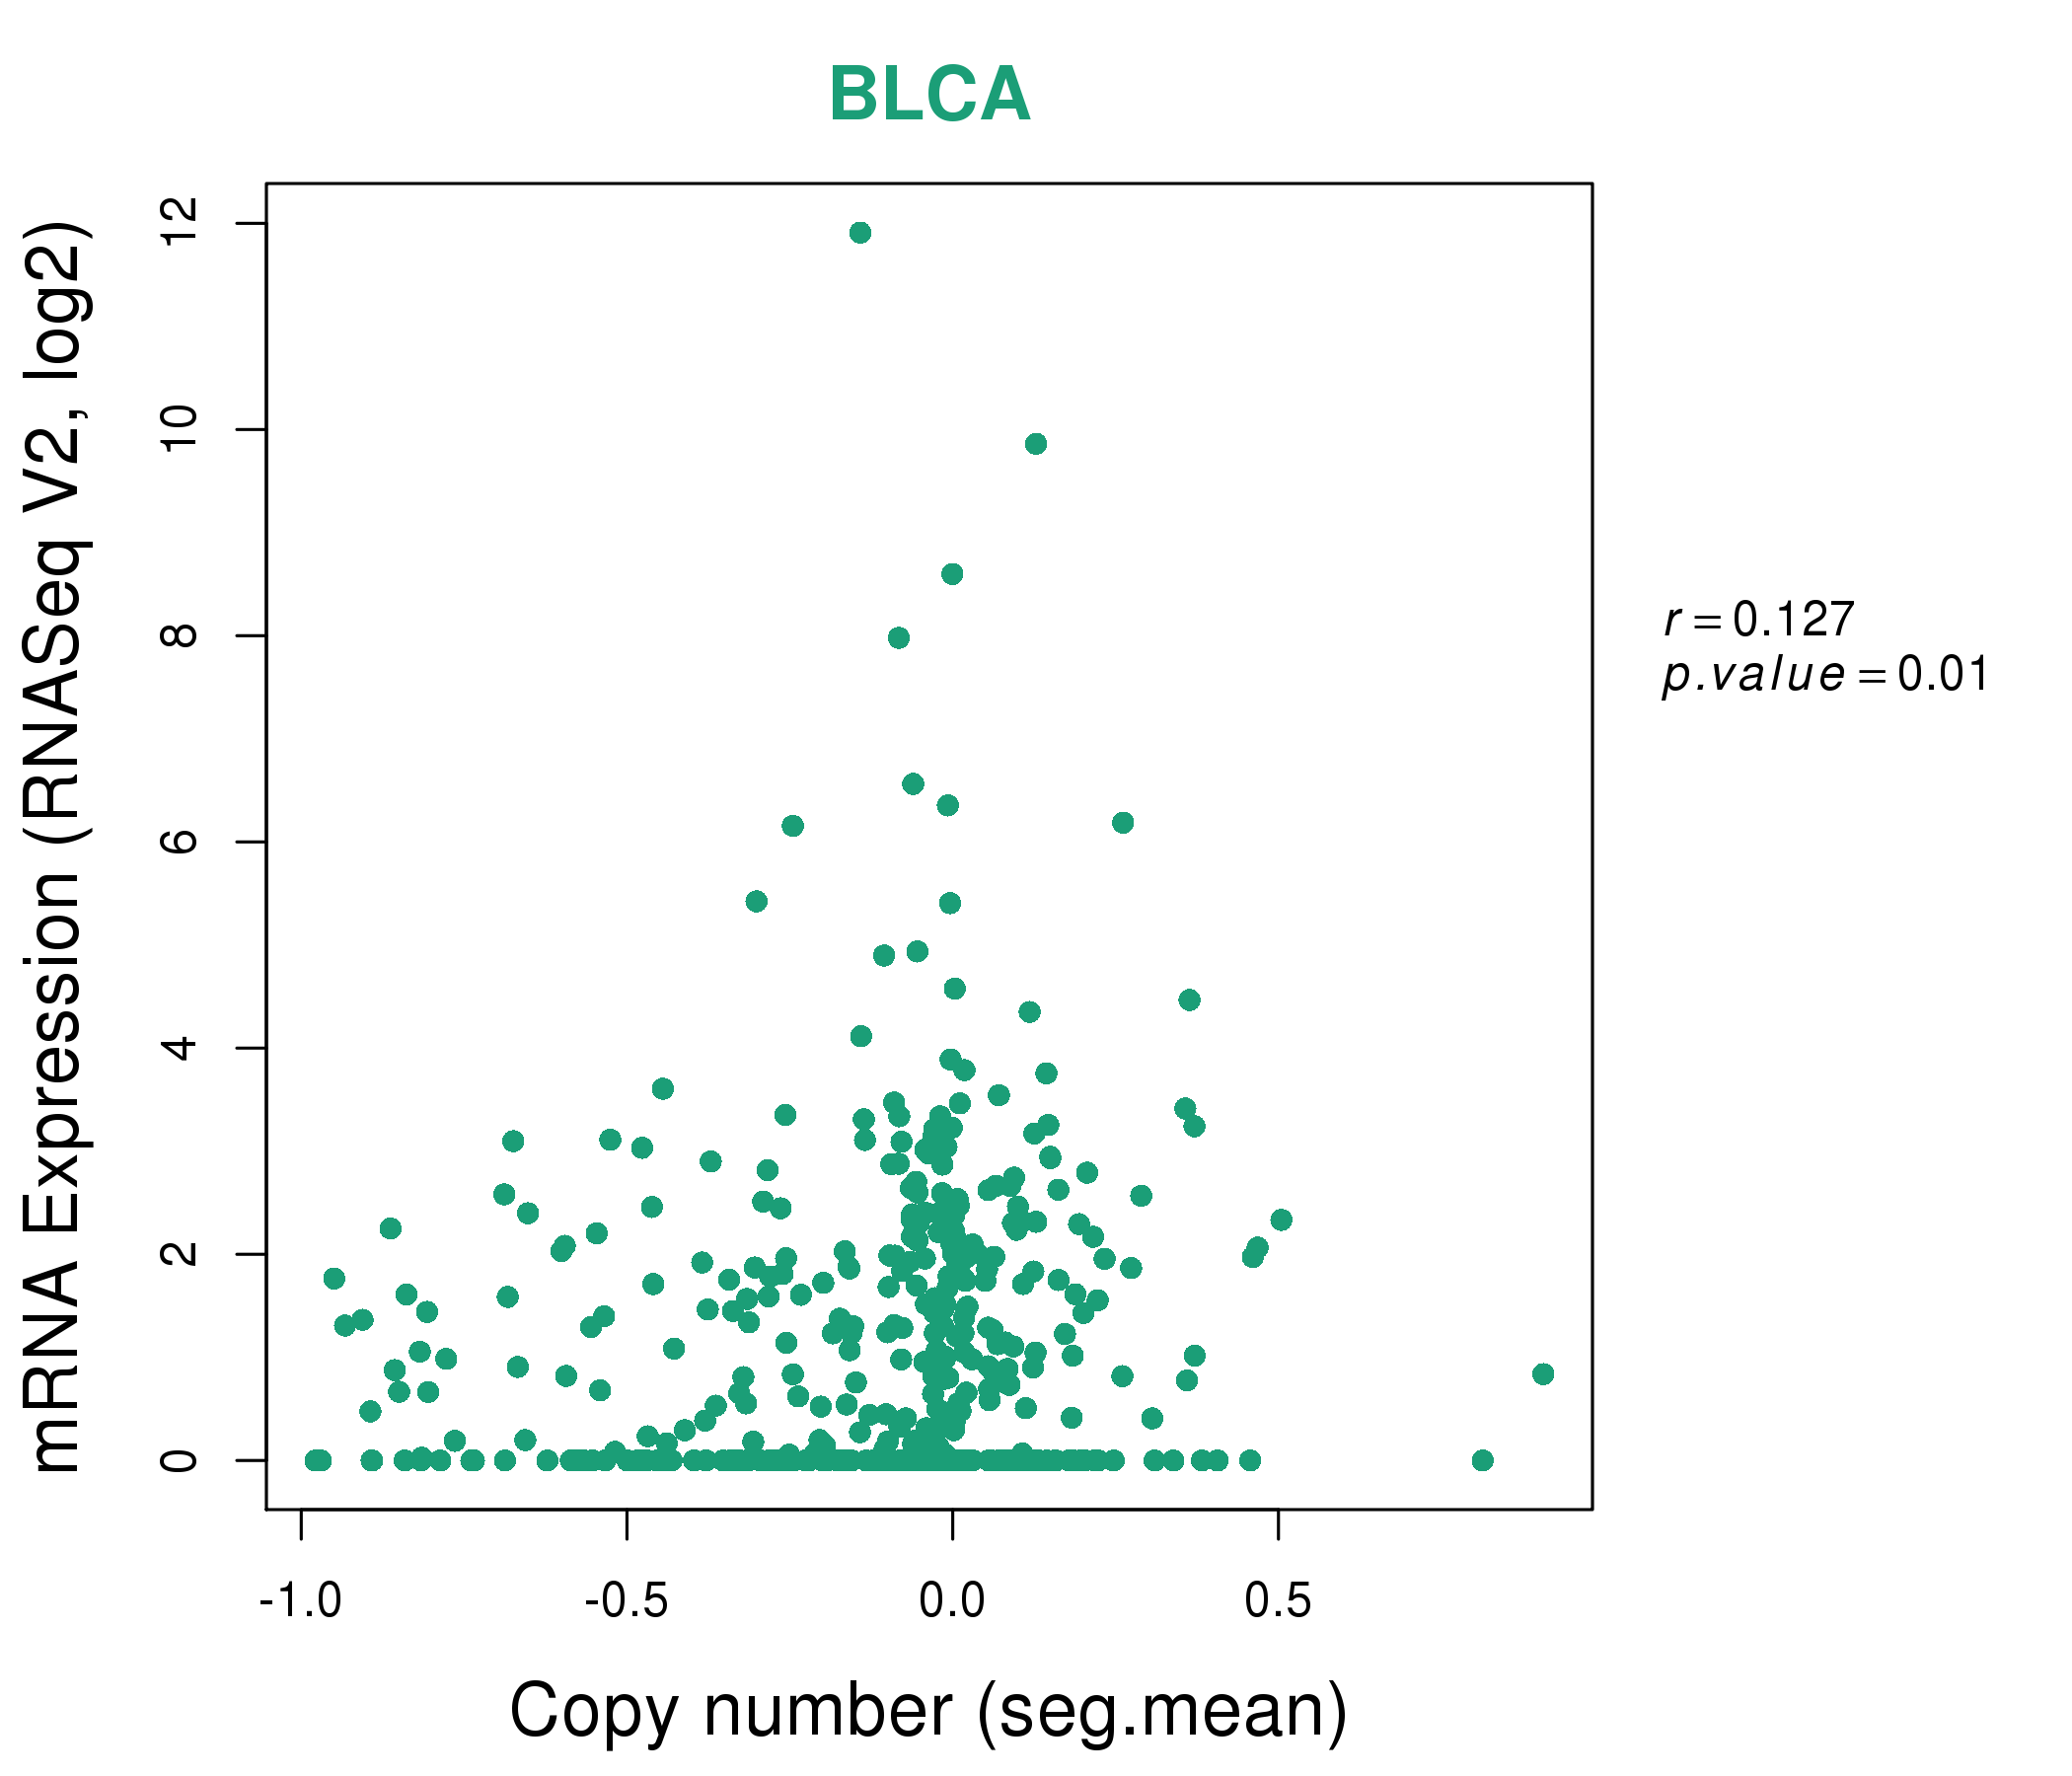
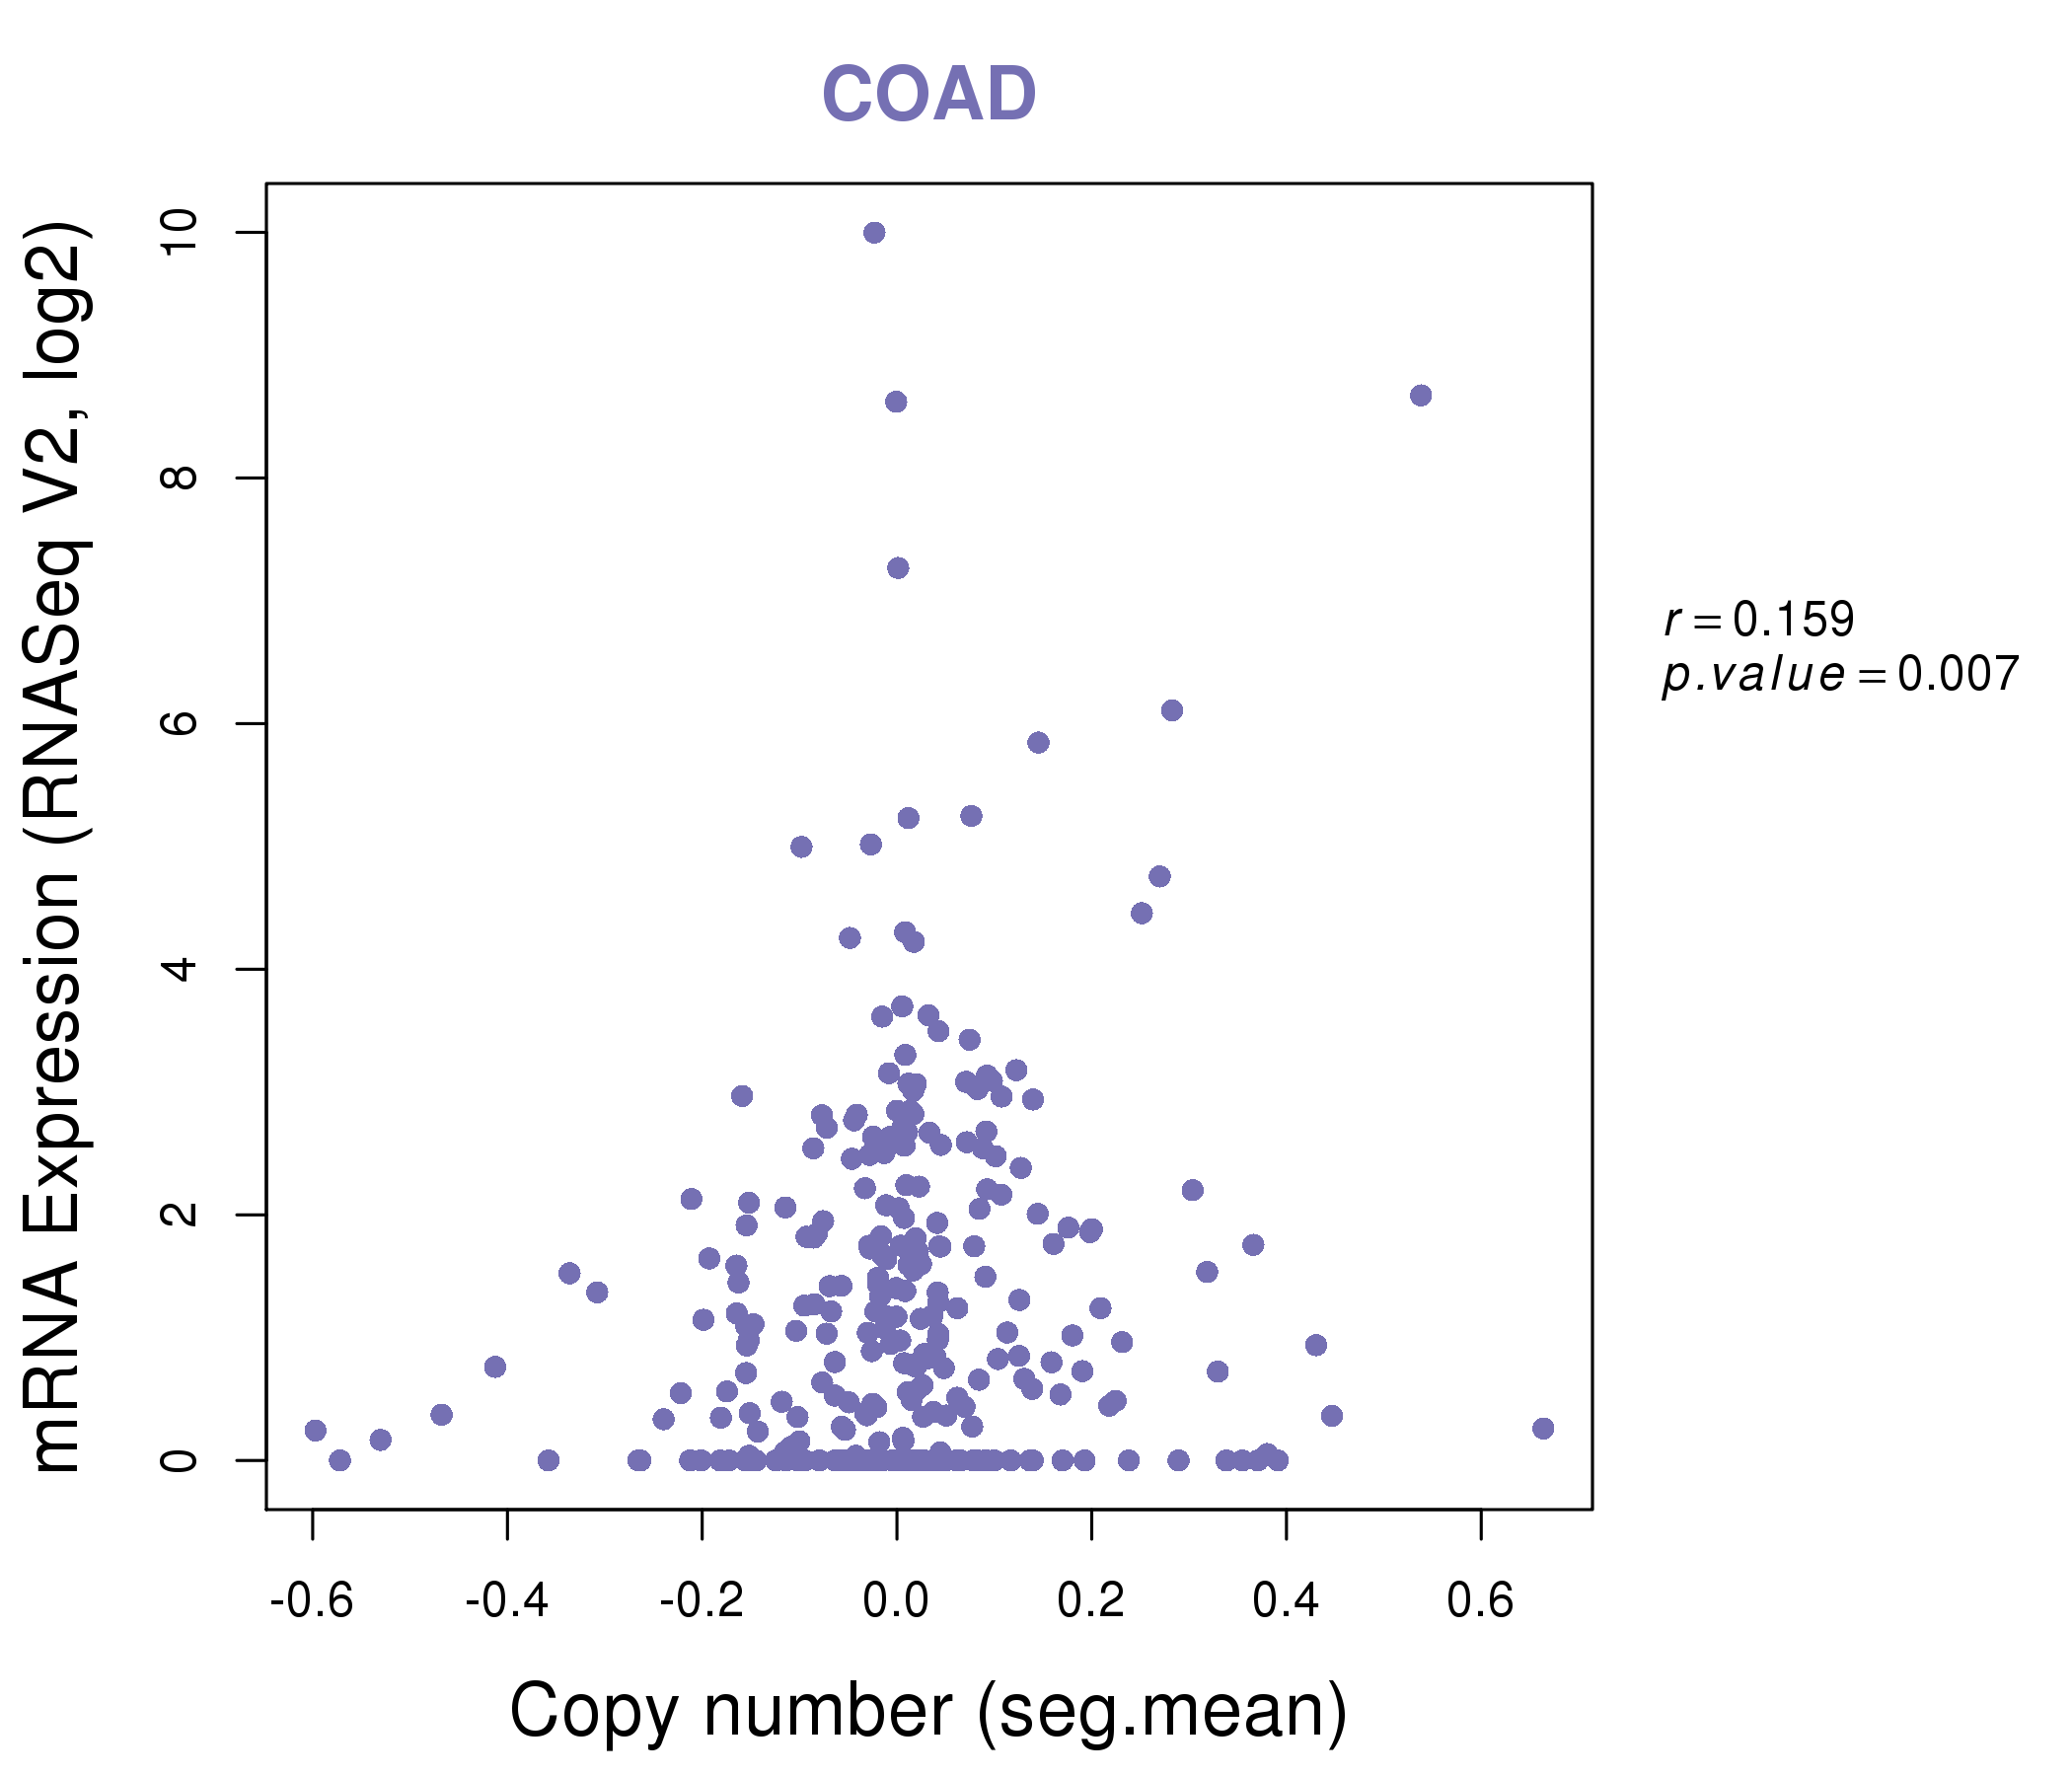
| * Copy number data were extracted from TCGA using R package TCGA-Assembler. The URLs of all public data files on TCGA DCC data server were gathered on Jan-05-2015. Function ProcessCNAData in TCGA-Assembler package was used to obtain gene-level copy number value which is calculated as the average copy number of the genomic region of a gene. |
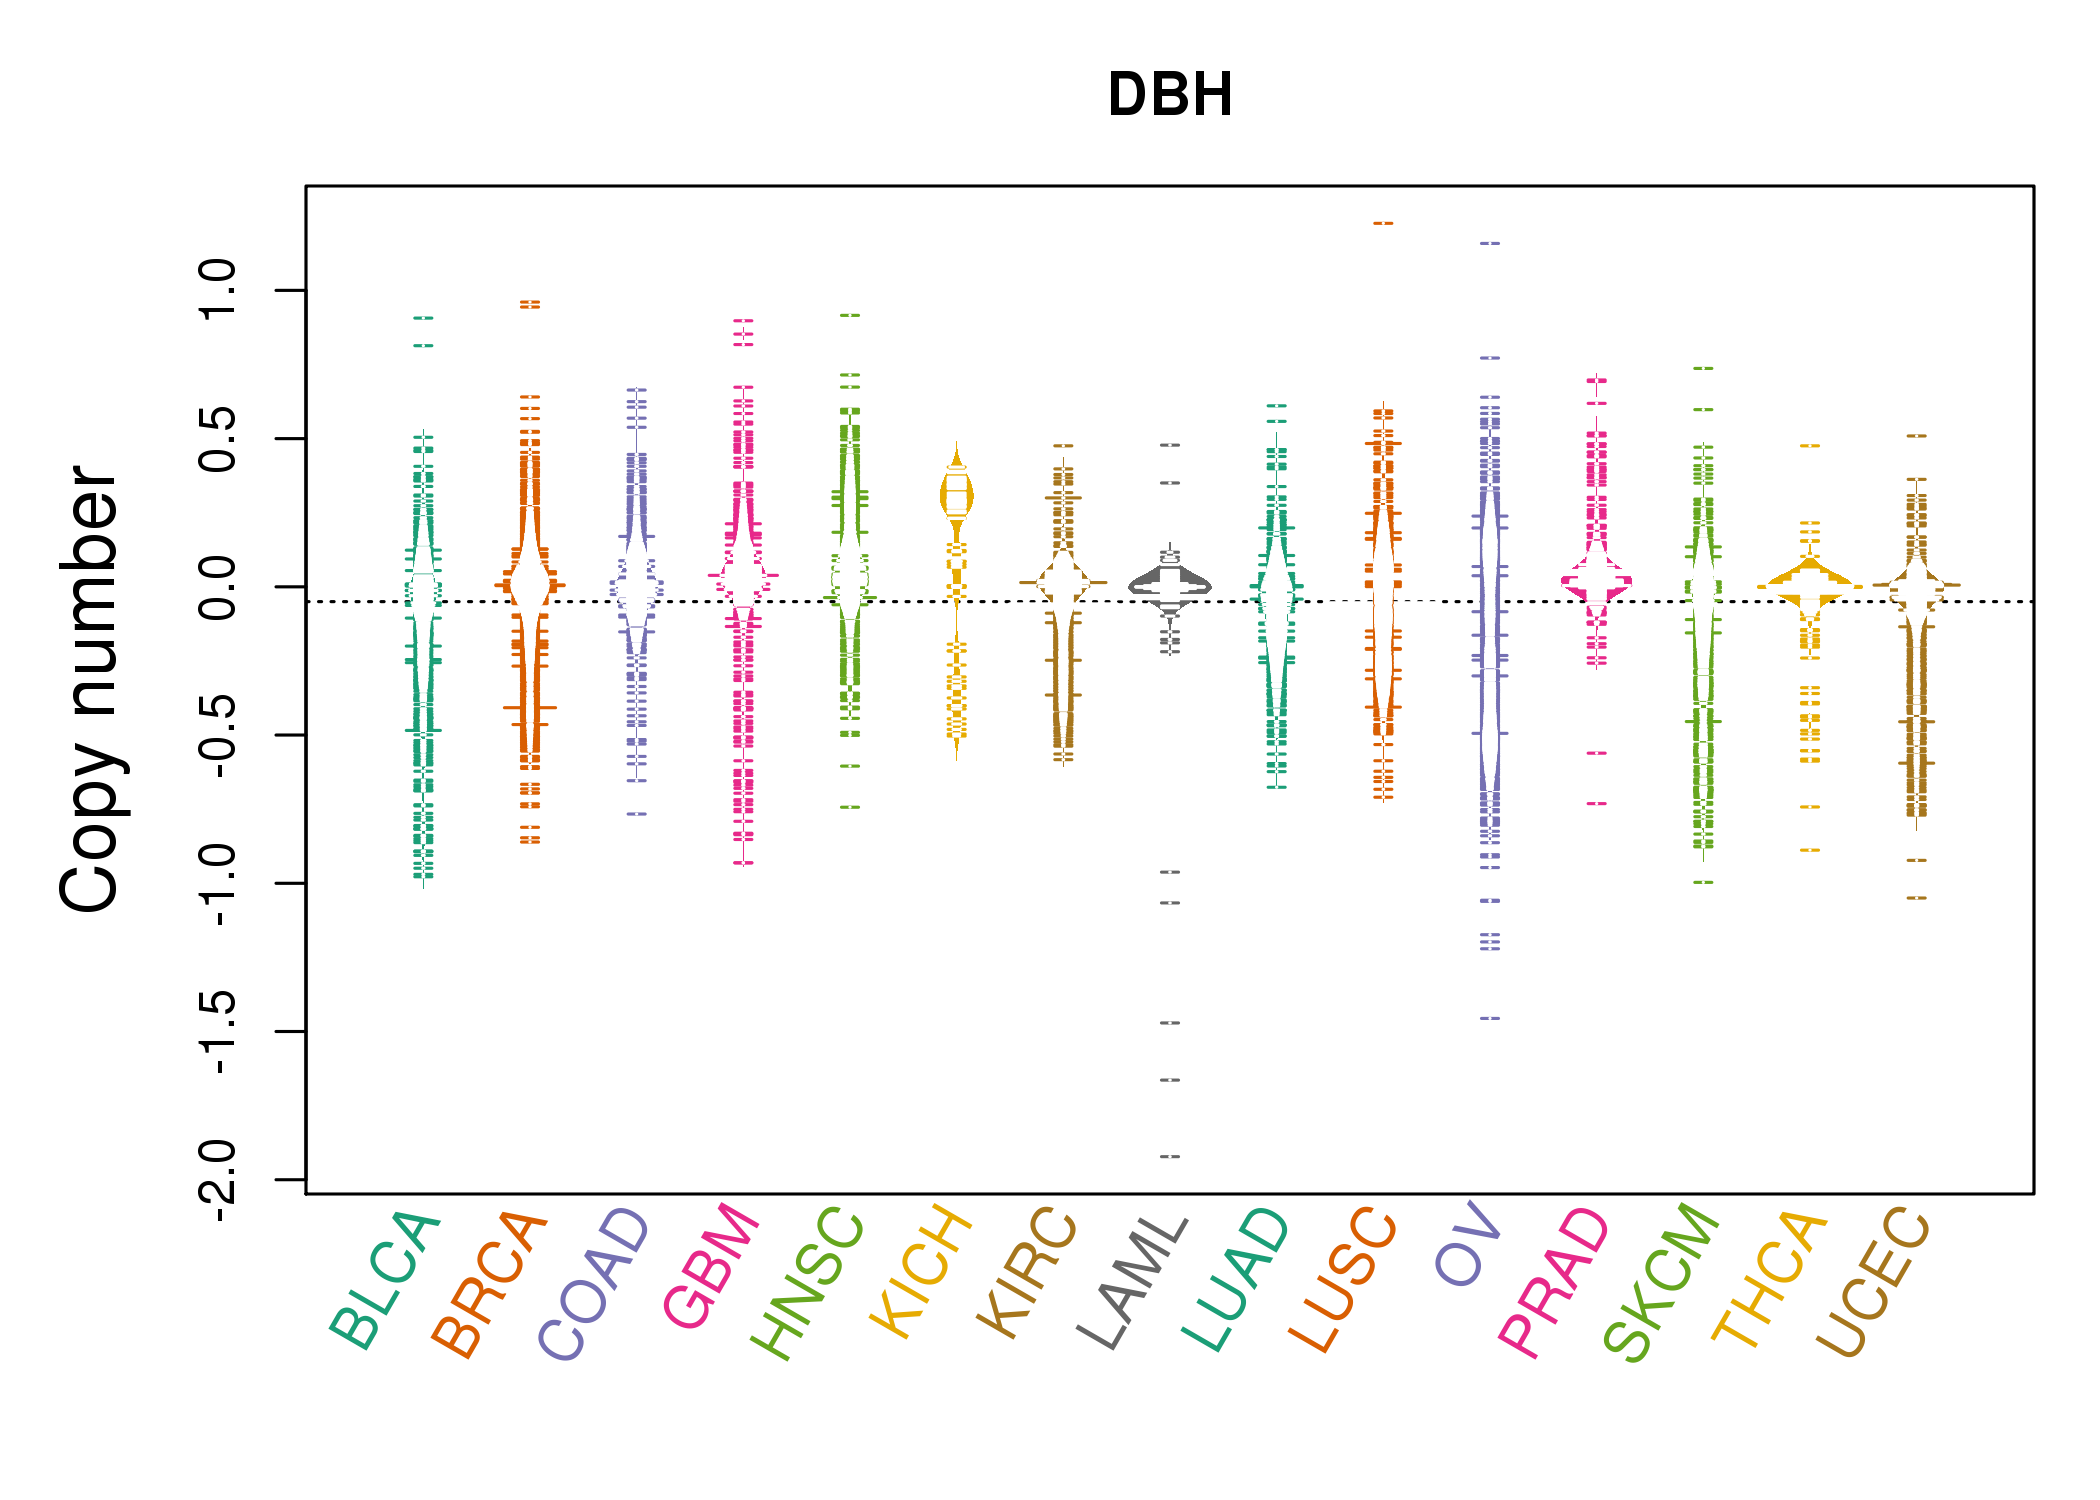 |
| cf) Tissue ID[Tissue type]: BLCA[Bladder Urothelial Carcinoma], BRCA[Breast invasive carcinoma], CESC[Cervical squamous cell carcinoma and endocervical adenocarcinoma], COAD[Colon adenocarcinoma], GBM[Glioblastoma multiforme], Glioma Low Grade, HNSC[Head and Neck squamous cell carcinoma], KICH[Kidney Chromophobe], KIRC[Kidney renal clear cell carcinoma], KIRP[Kidney renal papillary cell carcinoma], LAML[Acute Myeloid Leukemia], LUAD[Lung adenocarcinoma], LUSC[Lung squamous cell carcinoma], OV[Ovarian serous cystadenocarcinoma ], PAAD[Pancreatic adenocarcinoma], PRAD[Prostate adenocarcinoma], SKCM[Skin Cutaneous Melanoma], STAD[Stomach adenocarcinoma], THCA[Thyroid carcinoma], UCEC[Uterine Corpus Endometrial Carcinoma] |
| Top |
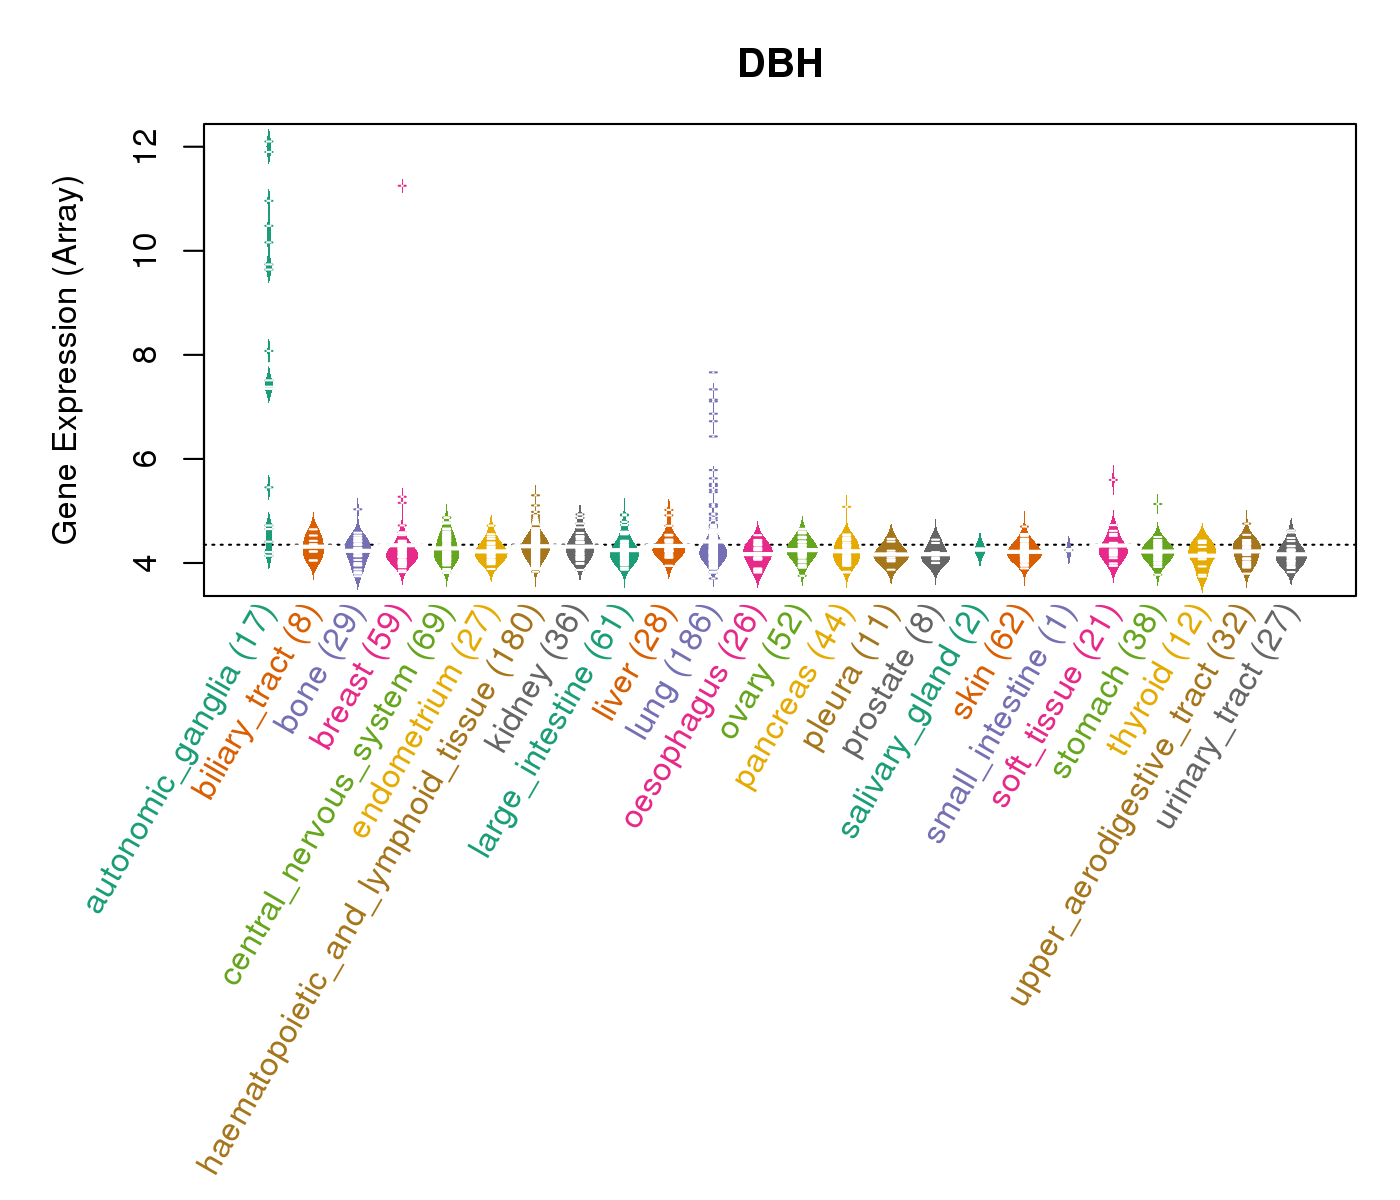
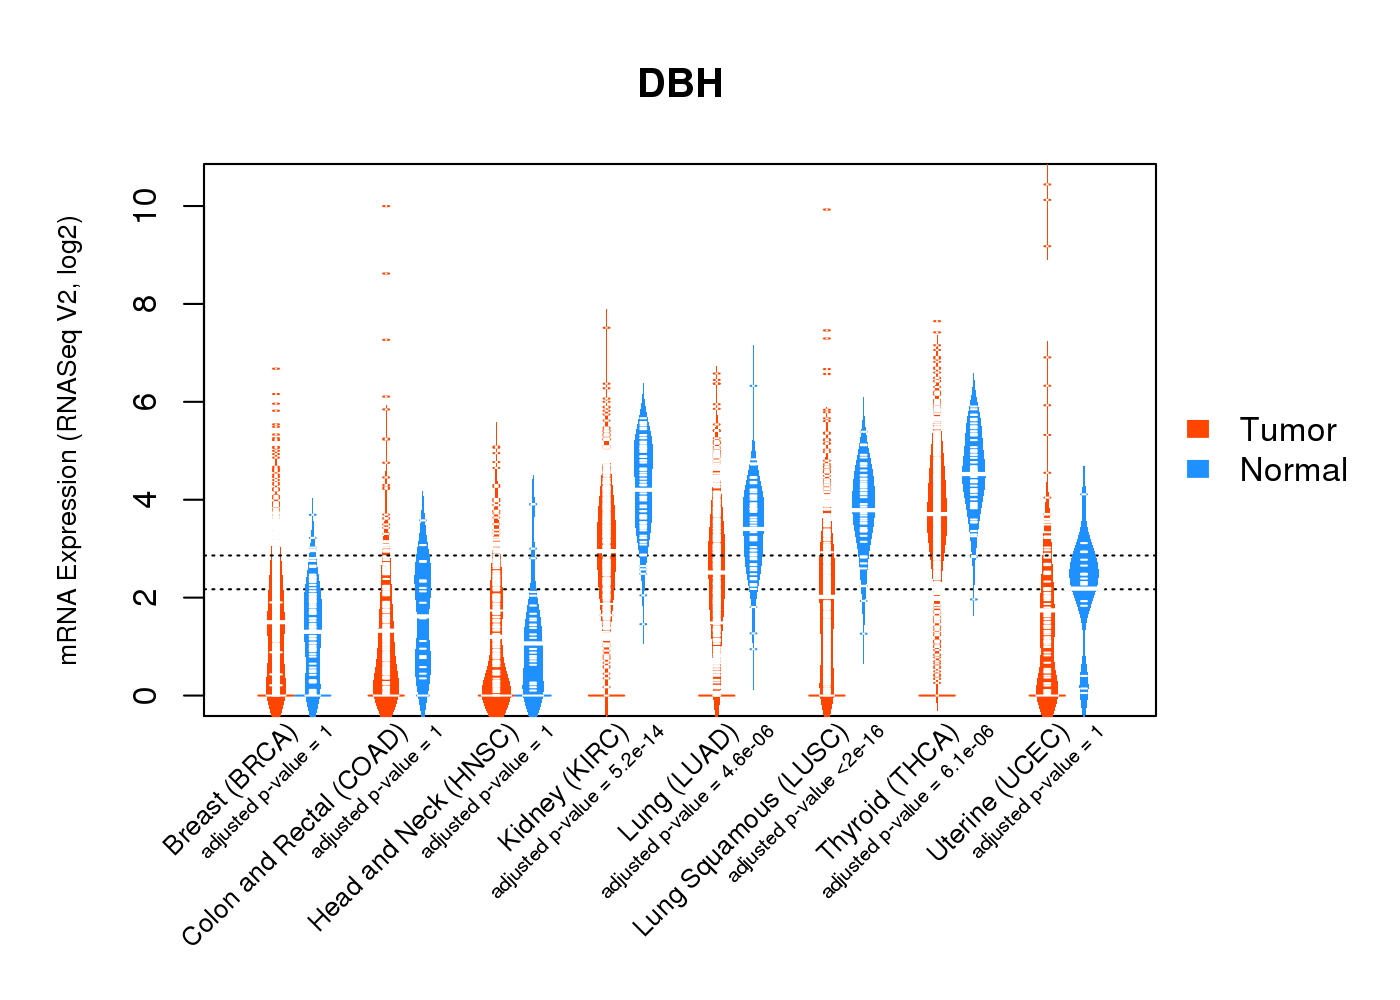
| Gene Expression for DBH |
| * CCLE gene expression data were extracted from CCLE_Expression_Entrez_2012-10-18.res: Gene-centric RMA-normalized mRNA expression data. |
 |
| * Normalized gene expression data of RNASeqV2 was extracted from TCGA using R package TCGA-Assembler. The URLs of all public data files on TCGA DCC data server were gathered at Jan-05-2015. Only eight cancer types have enough normal control samples for differential expression analysis. (t test, adjusted p<0.05 (using Benjamini-Hochberg FDR)) |
 |
| Top |
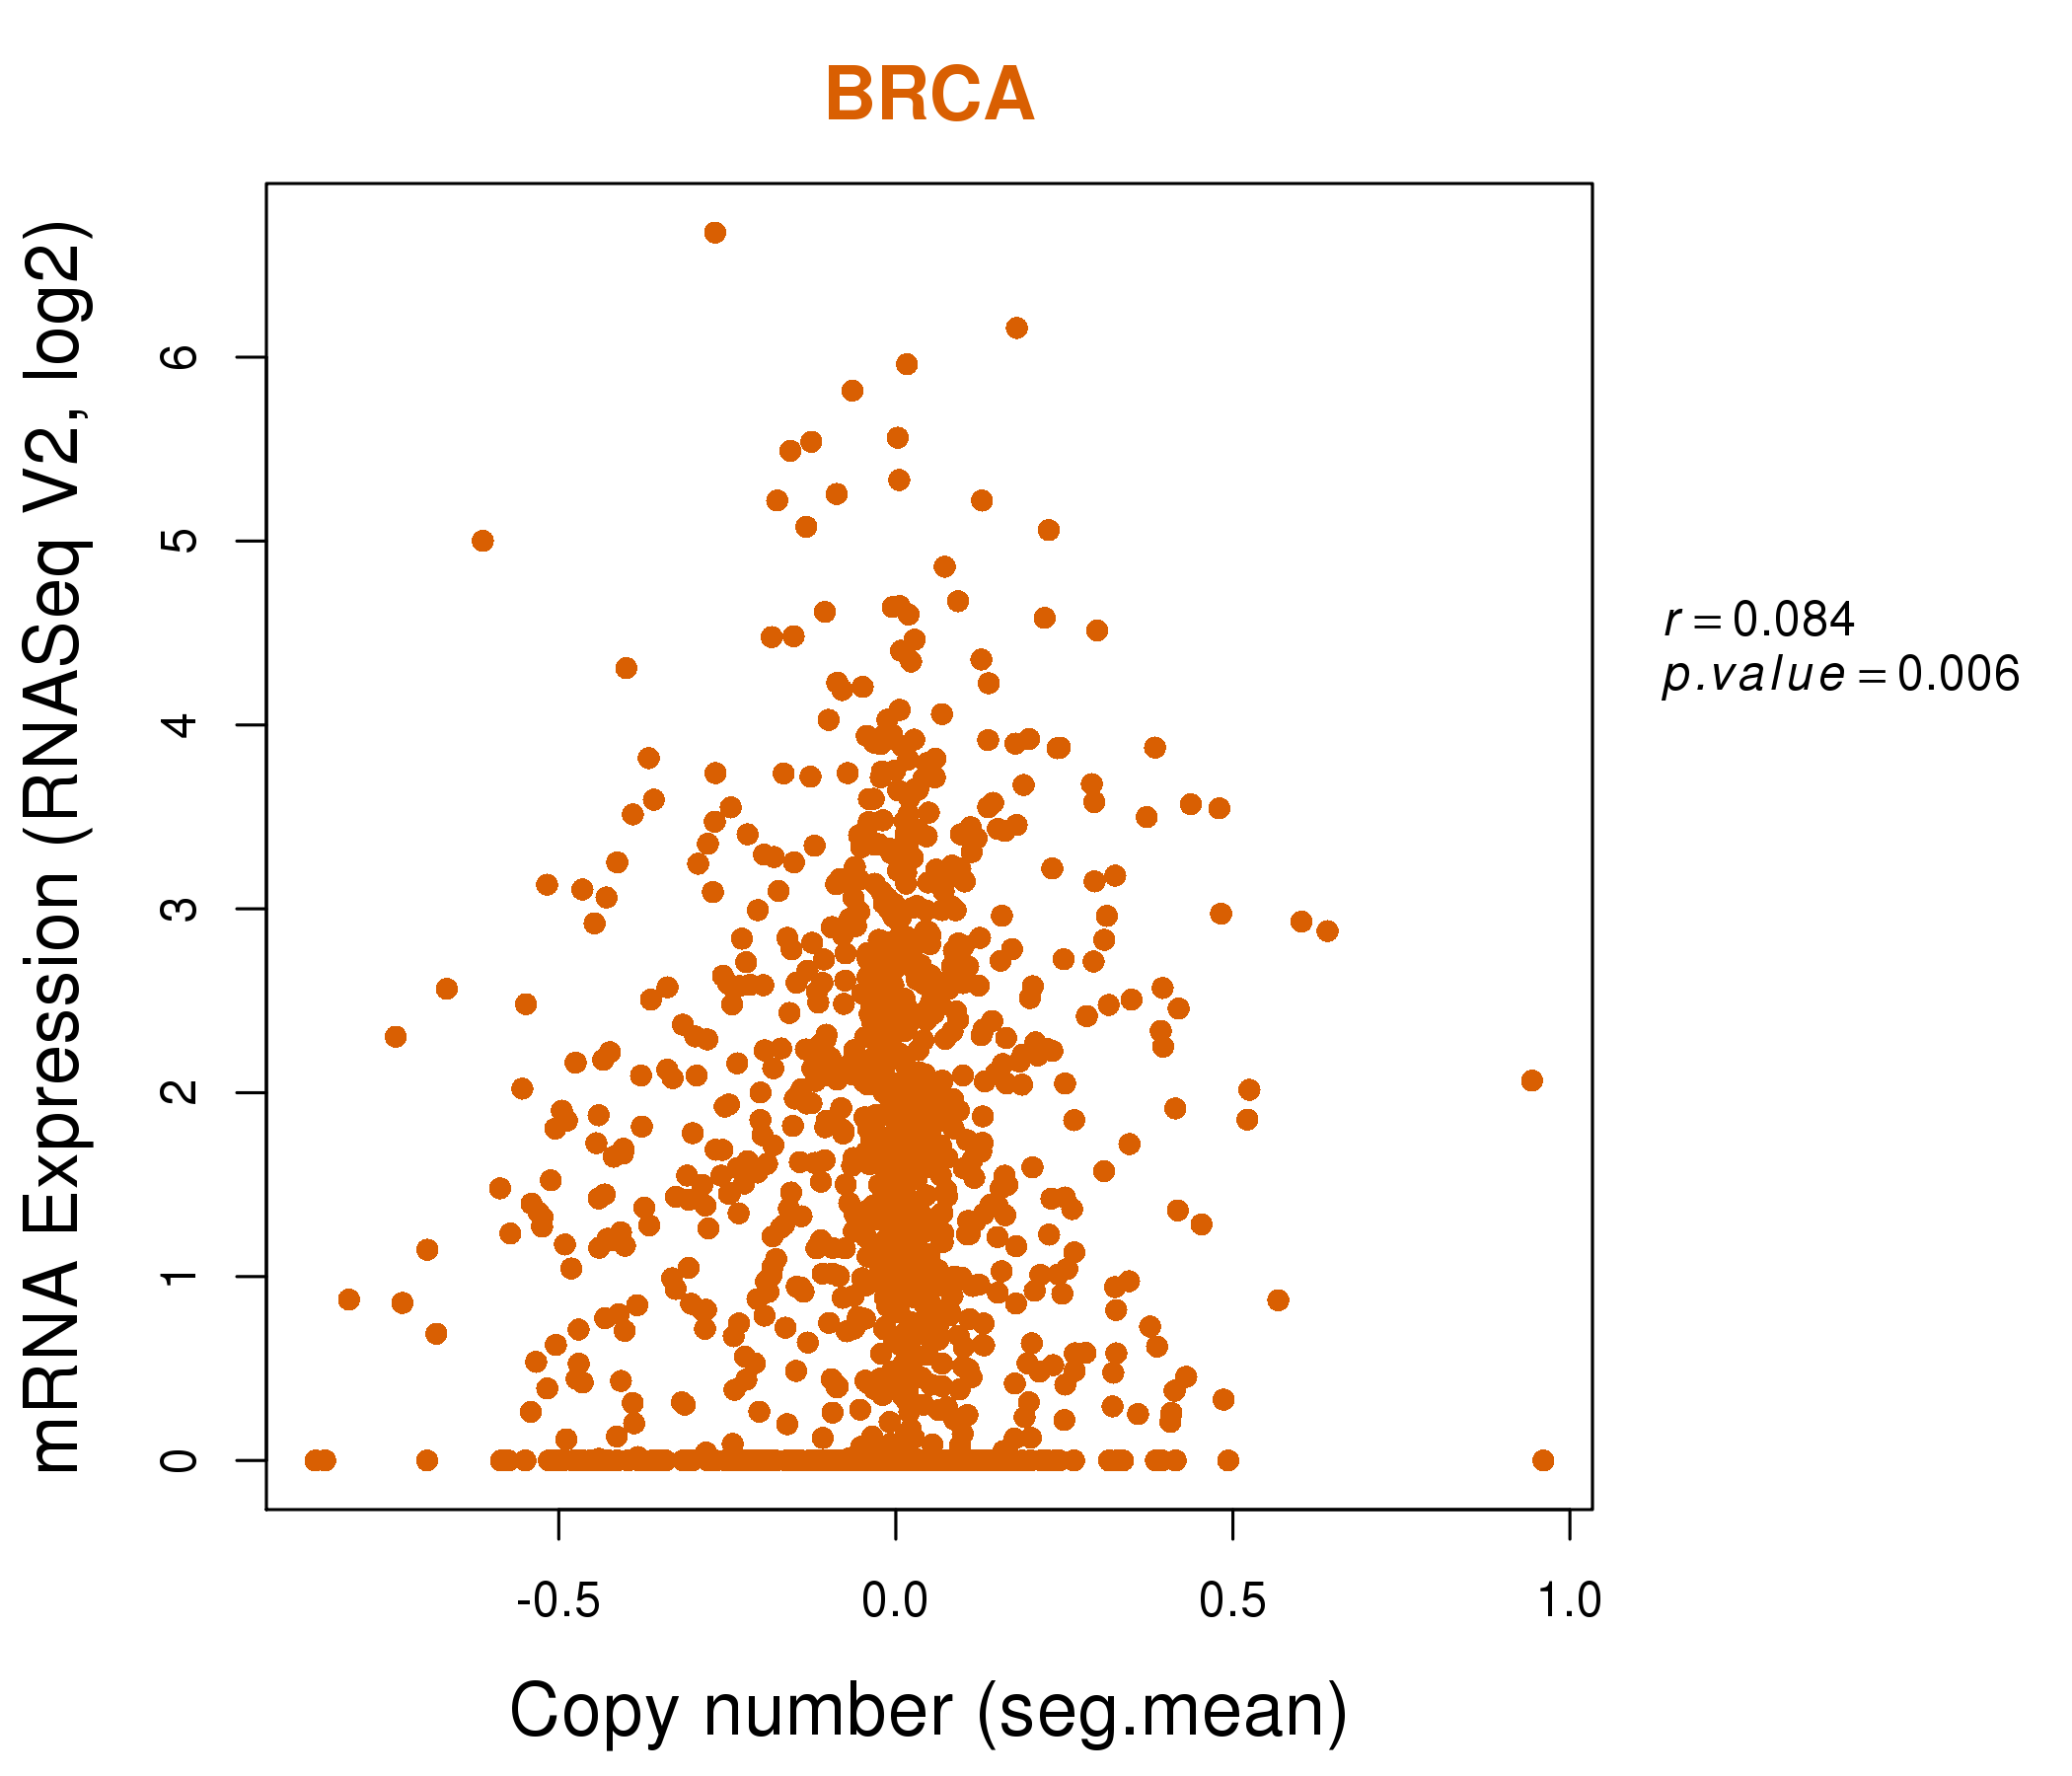
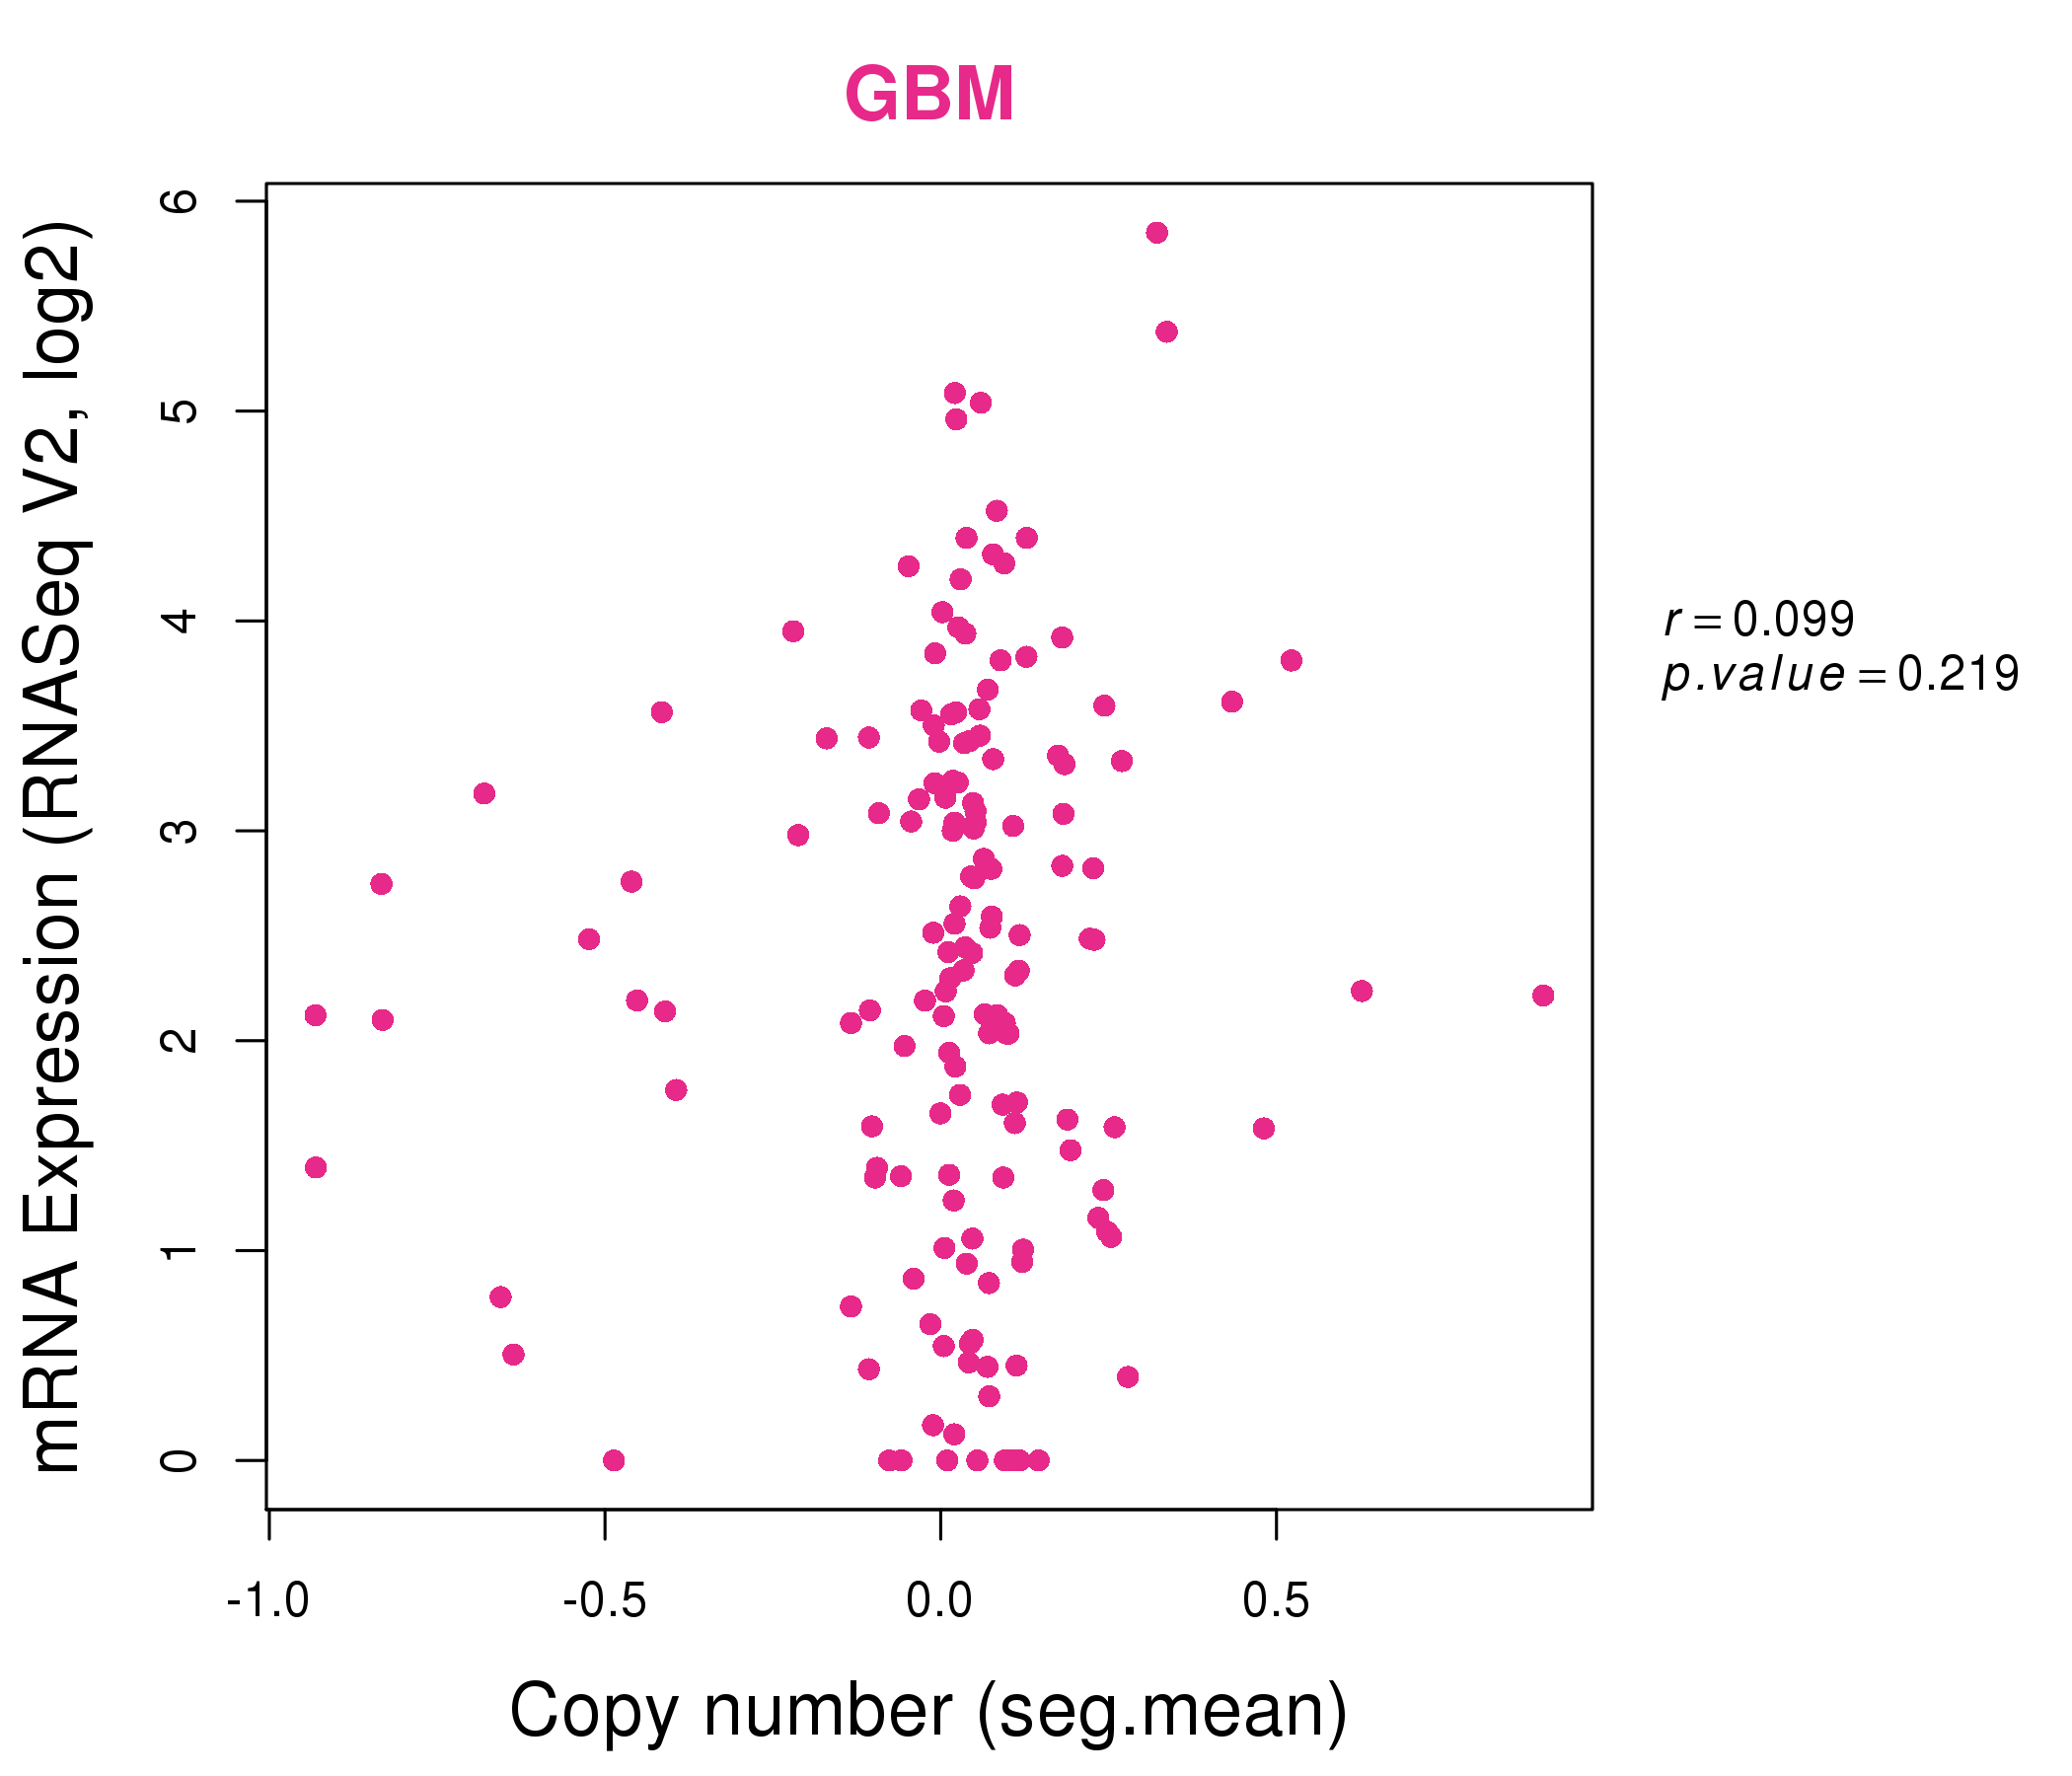
| * This plots show the correlation between CNV and gene expression. |
: Open all plots for all cancer types
 |
|
 |
|
| Top |
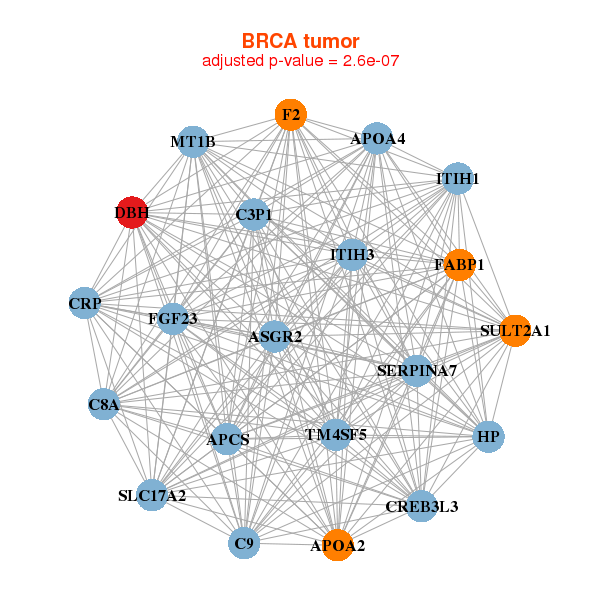
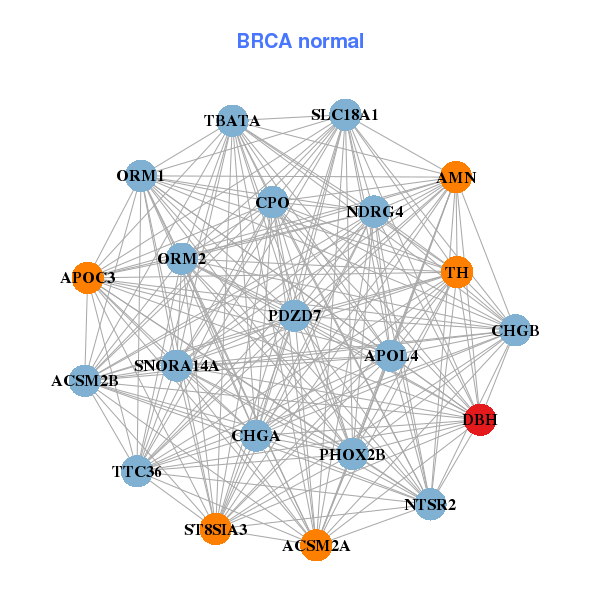
| Gene-Gene Network Information |
| * Co-Expression network figures were drawn using R package igraph. Only the top 20 genes with the highest correlations were shown. Red circle: input gene, orange circle: cell metabolism gene, sky circle: other gene |
: Open all plots for all cancer types
 |
| ||||
| APCS,APOA2,APOA4,ASGR2,C3P1,C8A,C9, CREB3L3,CRP,DBH,F2,FABP1,FGF23,HP, ITIH1,ITIH3,MT1B,SERPINA7,SLC17A2,SULT2A1,TM4SF5 | ACSM2A,ACSM2B,AMN,APOC3,APOL4,TBATA,CHGA, CHGB,CPO,DBH,NDRG4,NTSR2,ORM1,ORM2, PDZD7,PHOX2B,SLC18A1,SNORA14A,ST8SIA3,TH,TTC36 | ||||
 |
| ||||
| AMBN,CACNA1S,CALML3,CST5,DBH,ENTPD3,FGF8, KLK14,KRT31,LIPM,MUCL1,NELL2,RPTN,S100A3, SERPINI1,SEZ6L,SNAP91,SPAG6,SST,TCHHL1,TULP2 | ATM,C3orf62,CDYL2,CNTRL,DBH,EML6,GRAPL, KCNMB3,KDM2B,LOC100131691,LTB4R,LTB4R2,NFATC2,QSOX2, RBM6,RPL32P3,SLC4A8,THRAP3,TTN,USP49,ZNF335 |
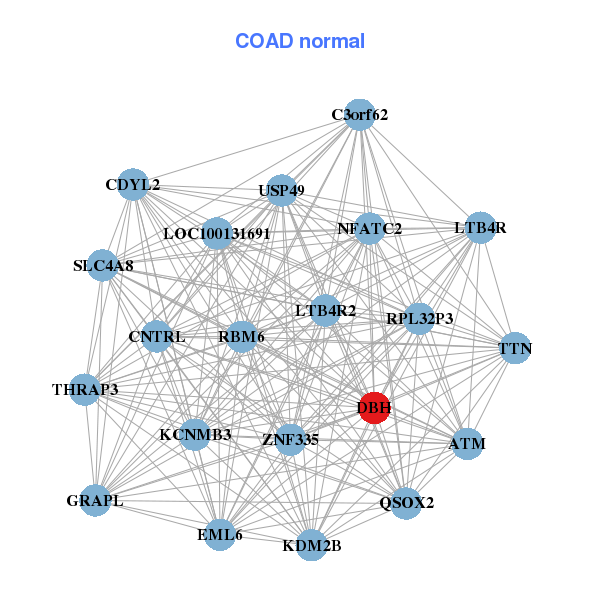
| * Co-Expression network figures were drawn using R package igraph. Only the top 20 genes with the highest correlations were shown. Red circle: input gene, orange circle: cell metabolism gene, sky circle: other gene |
: Open all plots for all cancer types
| Top |
: Open all interacting genes' information including KEGG pathway for all interacting genes from DAVID
| Top |
| Pharmacological Information for DBH |
| DB Category | DB Name | DB's ID and Url link |
| * Gene Centered Interaction Network. |
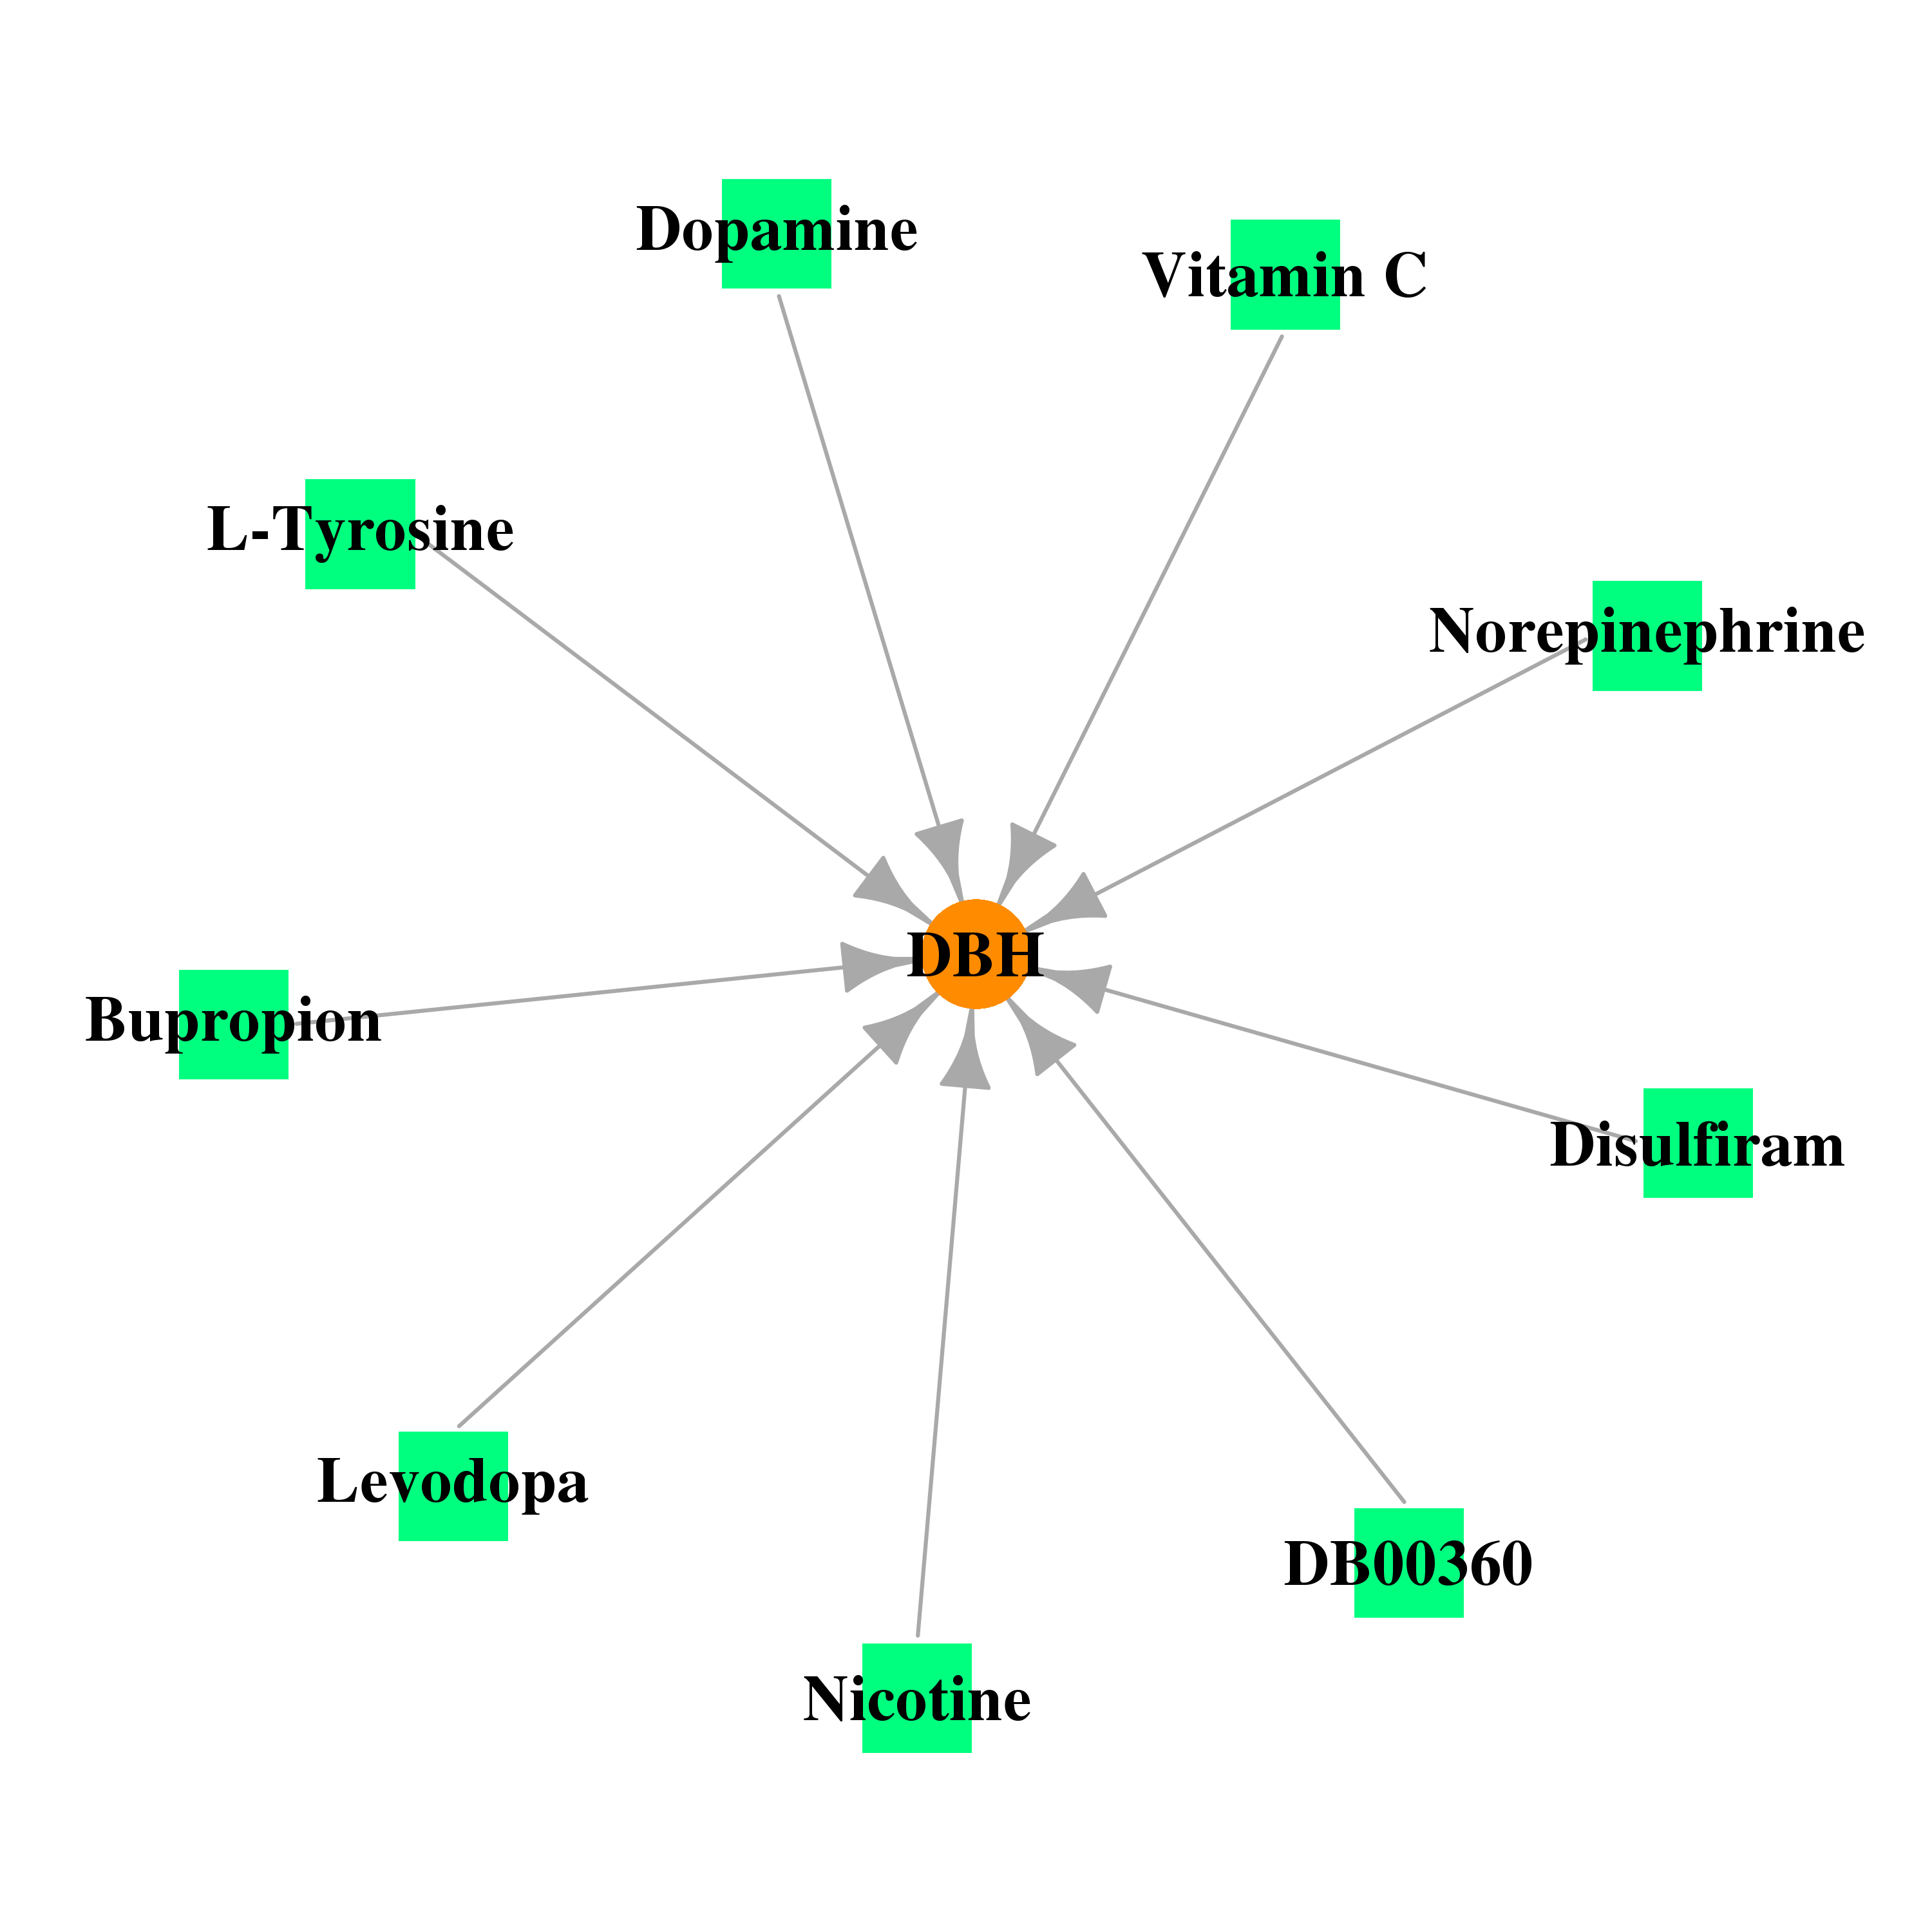 |
| * Drug Centered Interaction Network. |
| DrugBank ID | Target Name | Drug Groups | Generic Name | Drug Centered Network | Drug Structure |
| DB00126 | dopamine beta-hydroxylase (dopamine beta-monooxygenase) | approved; nutraceutical | Vitamin C | 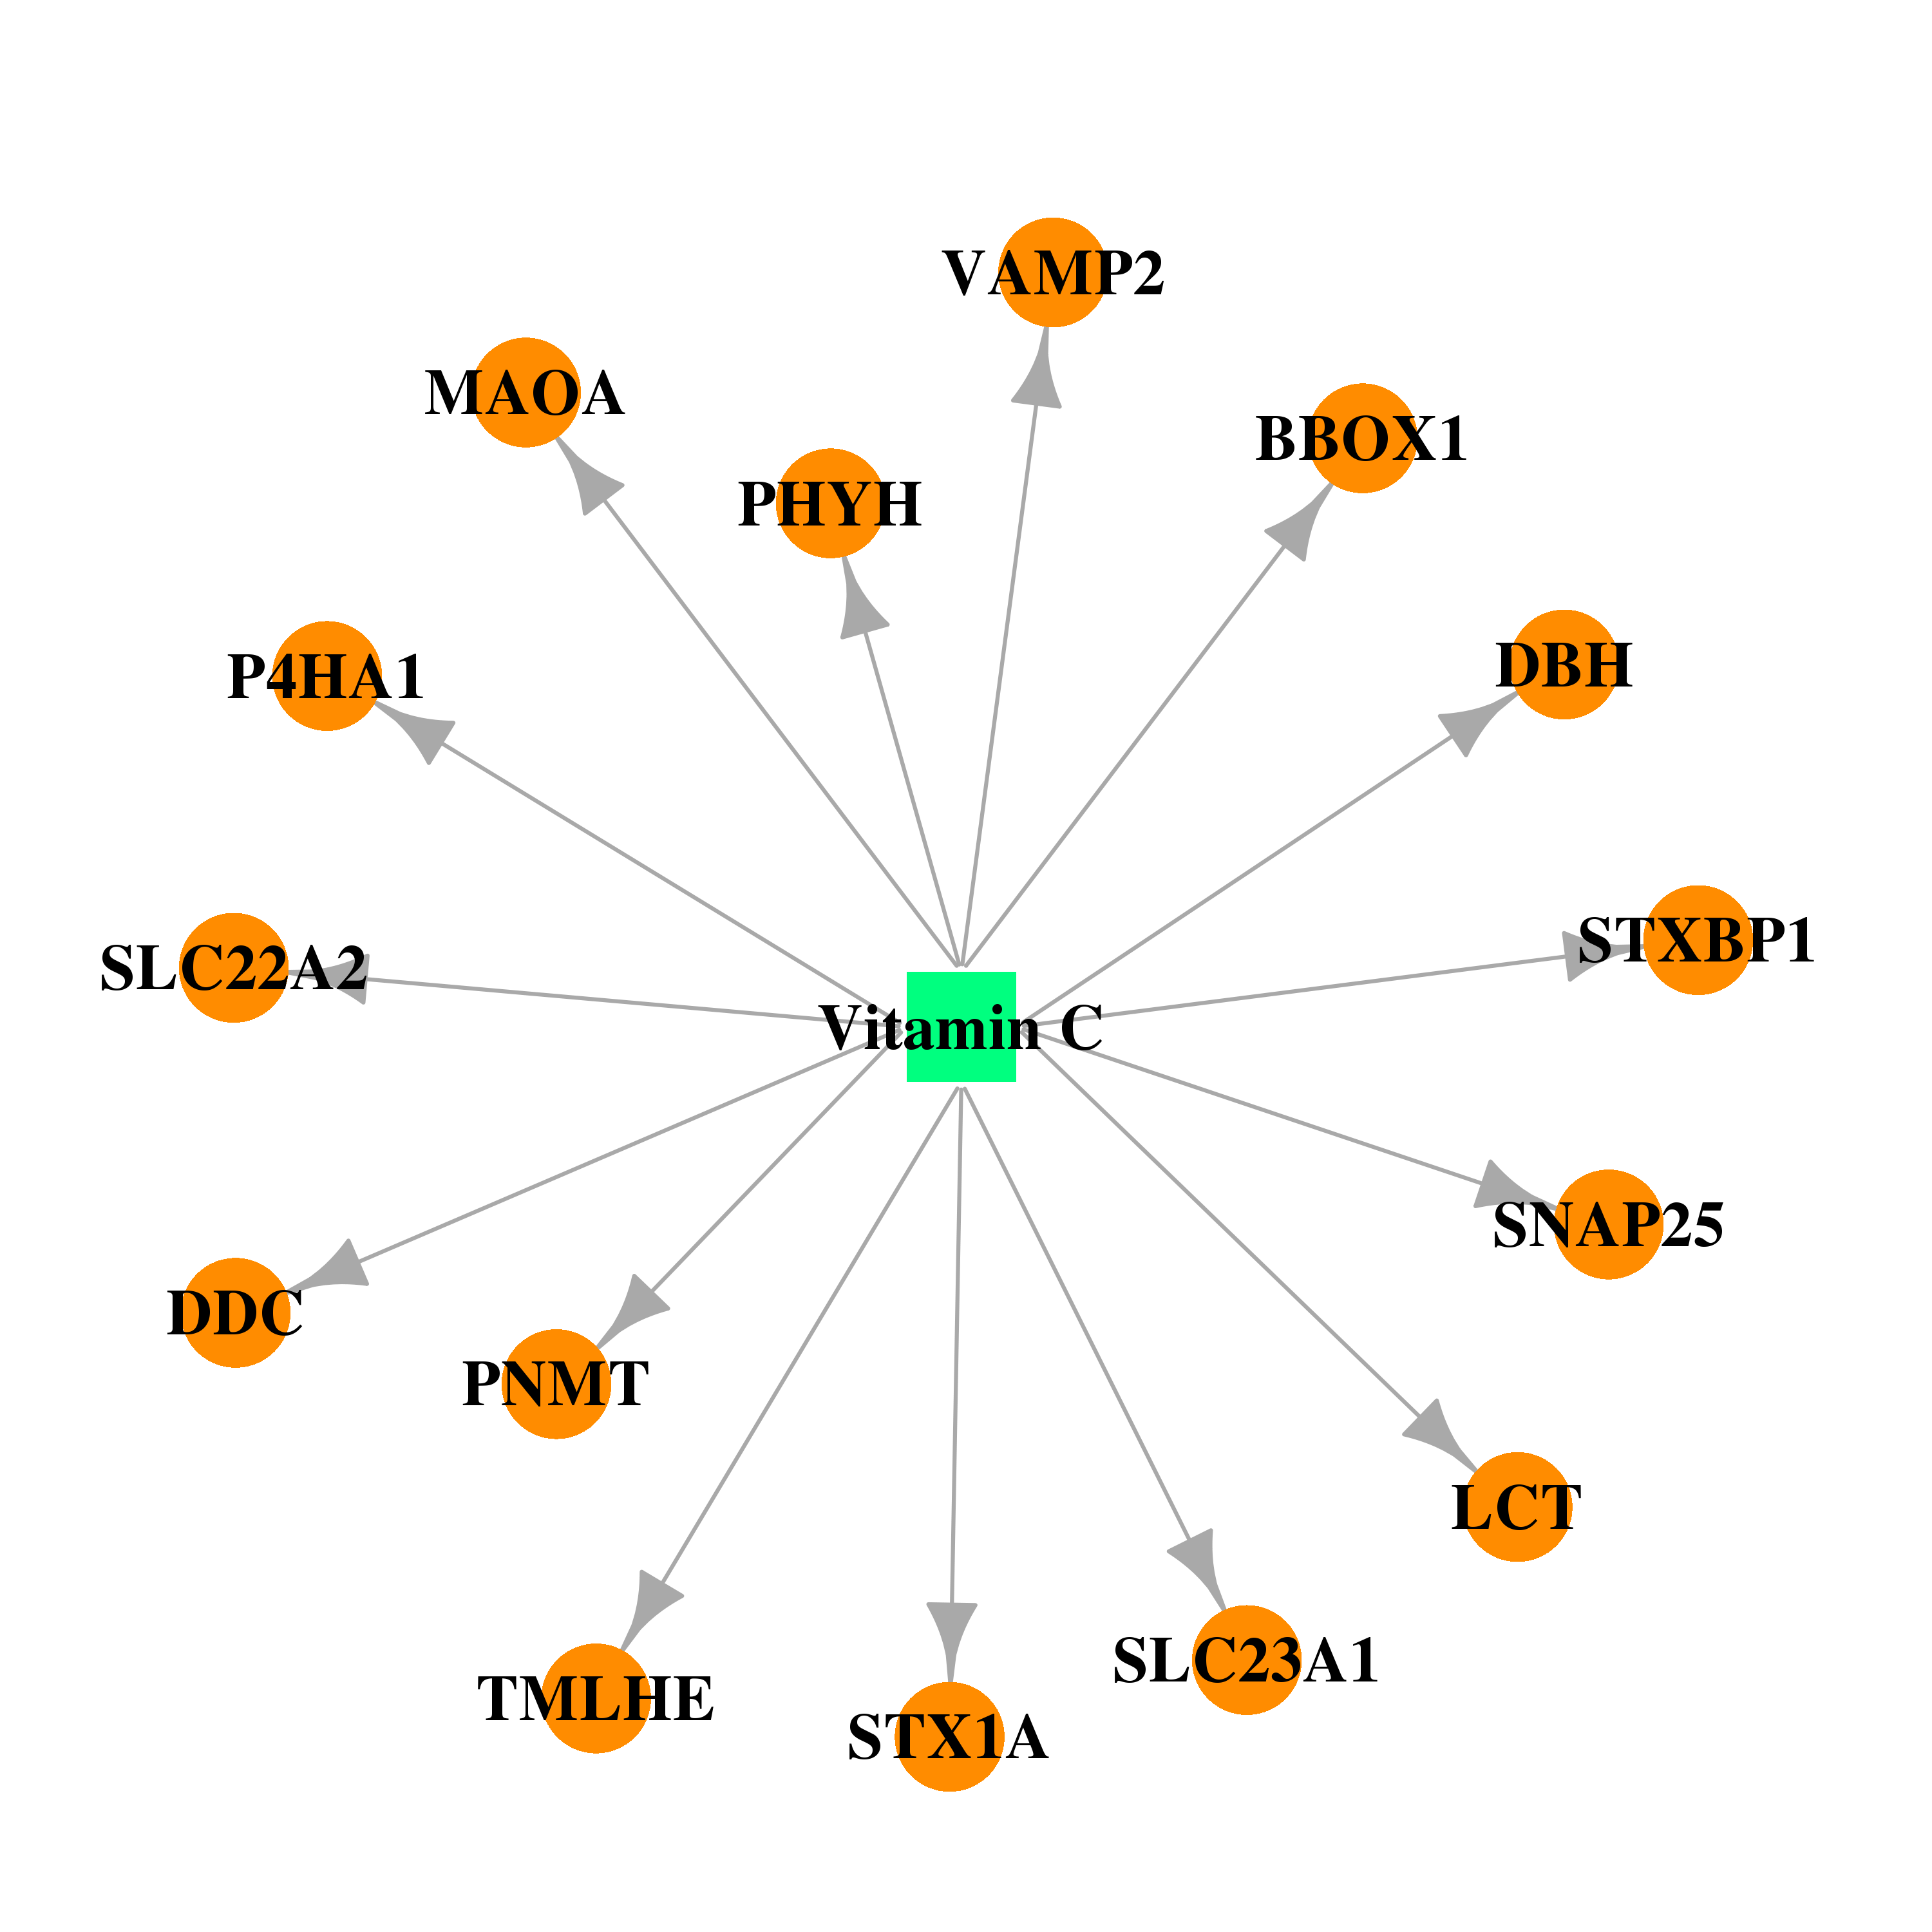 | 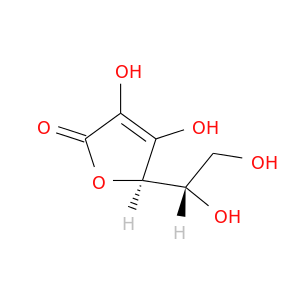 |
| DB00822 | dopamine beta-hydroxylase (dopamine beta-monooxygenase) | approved | Disulfiram | 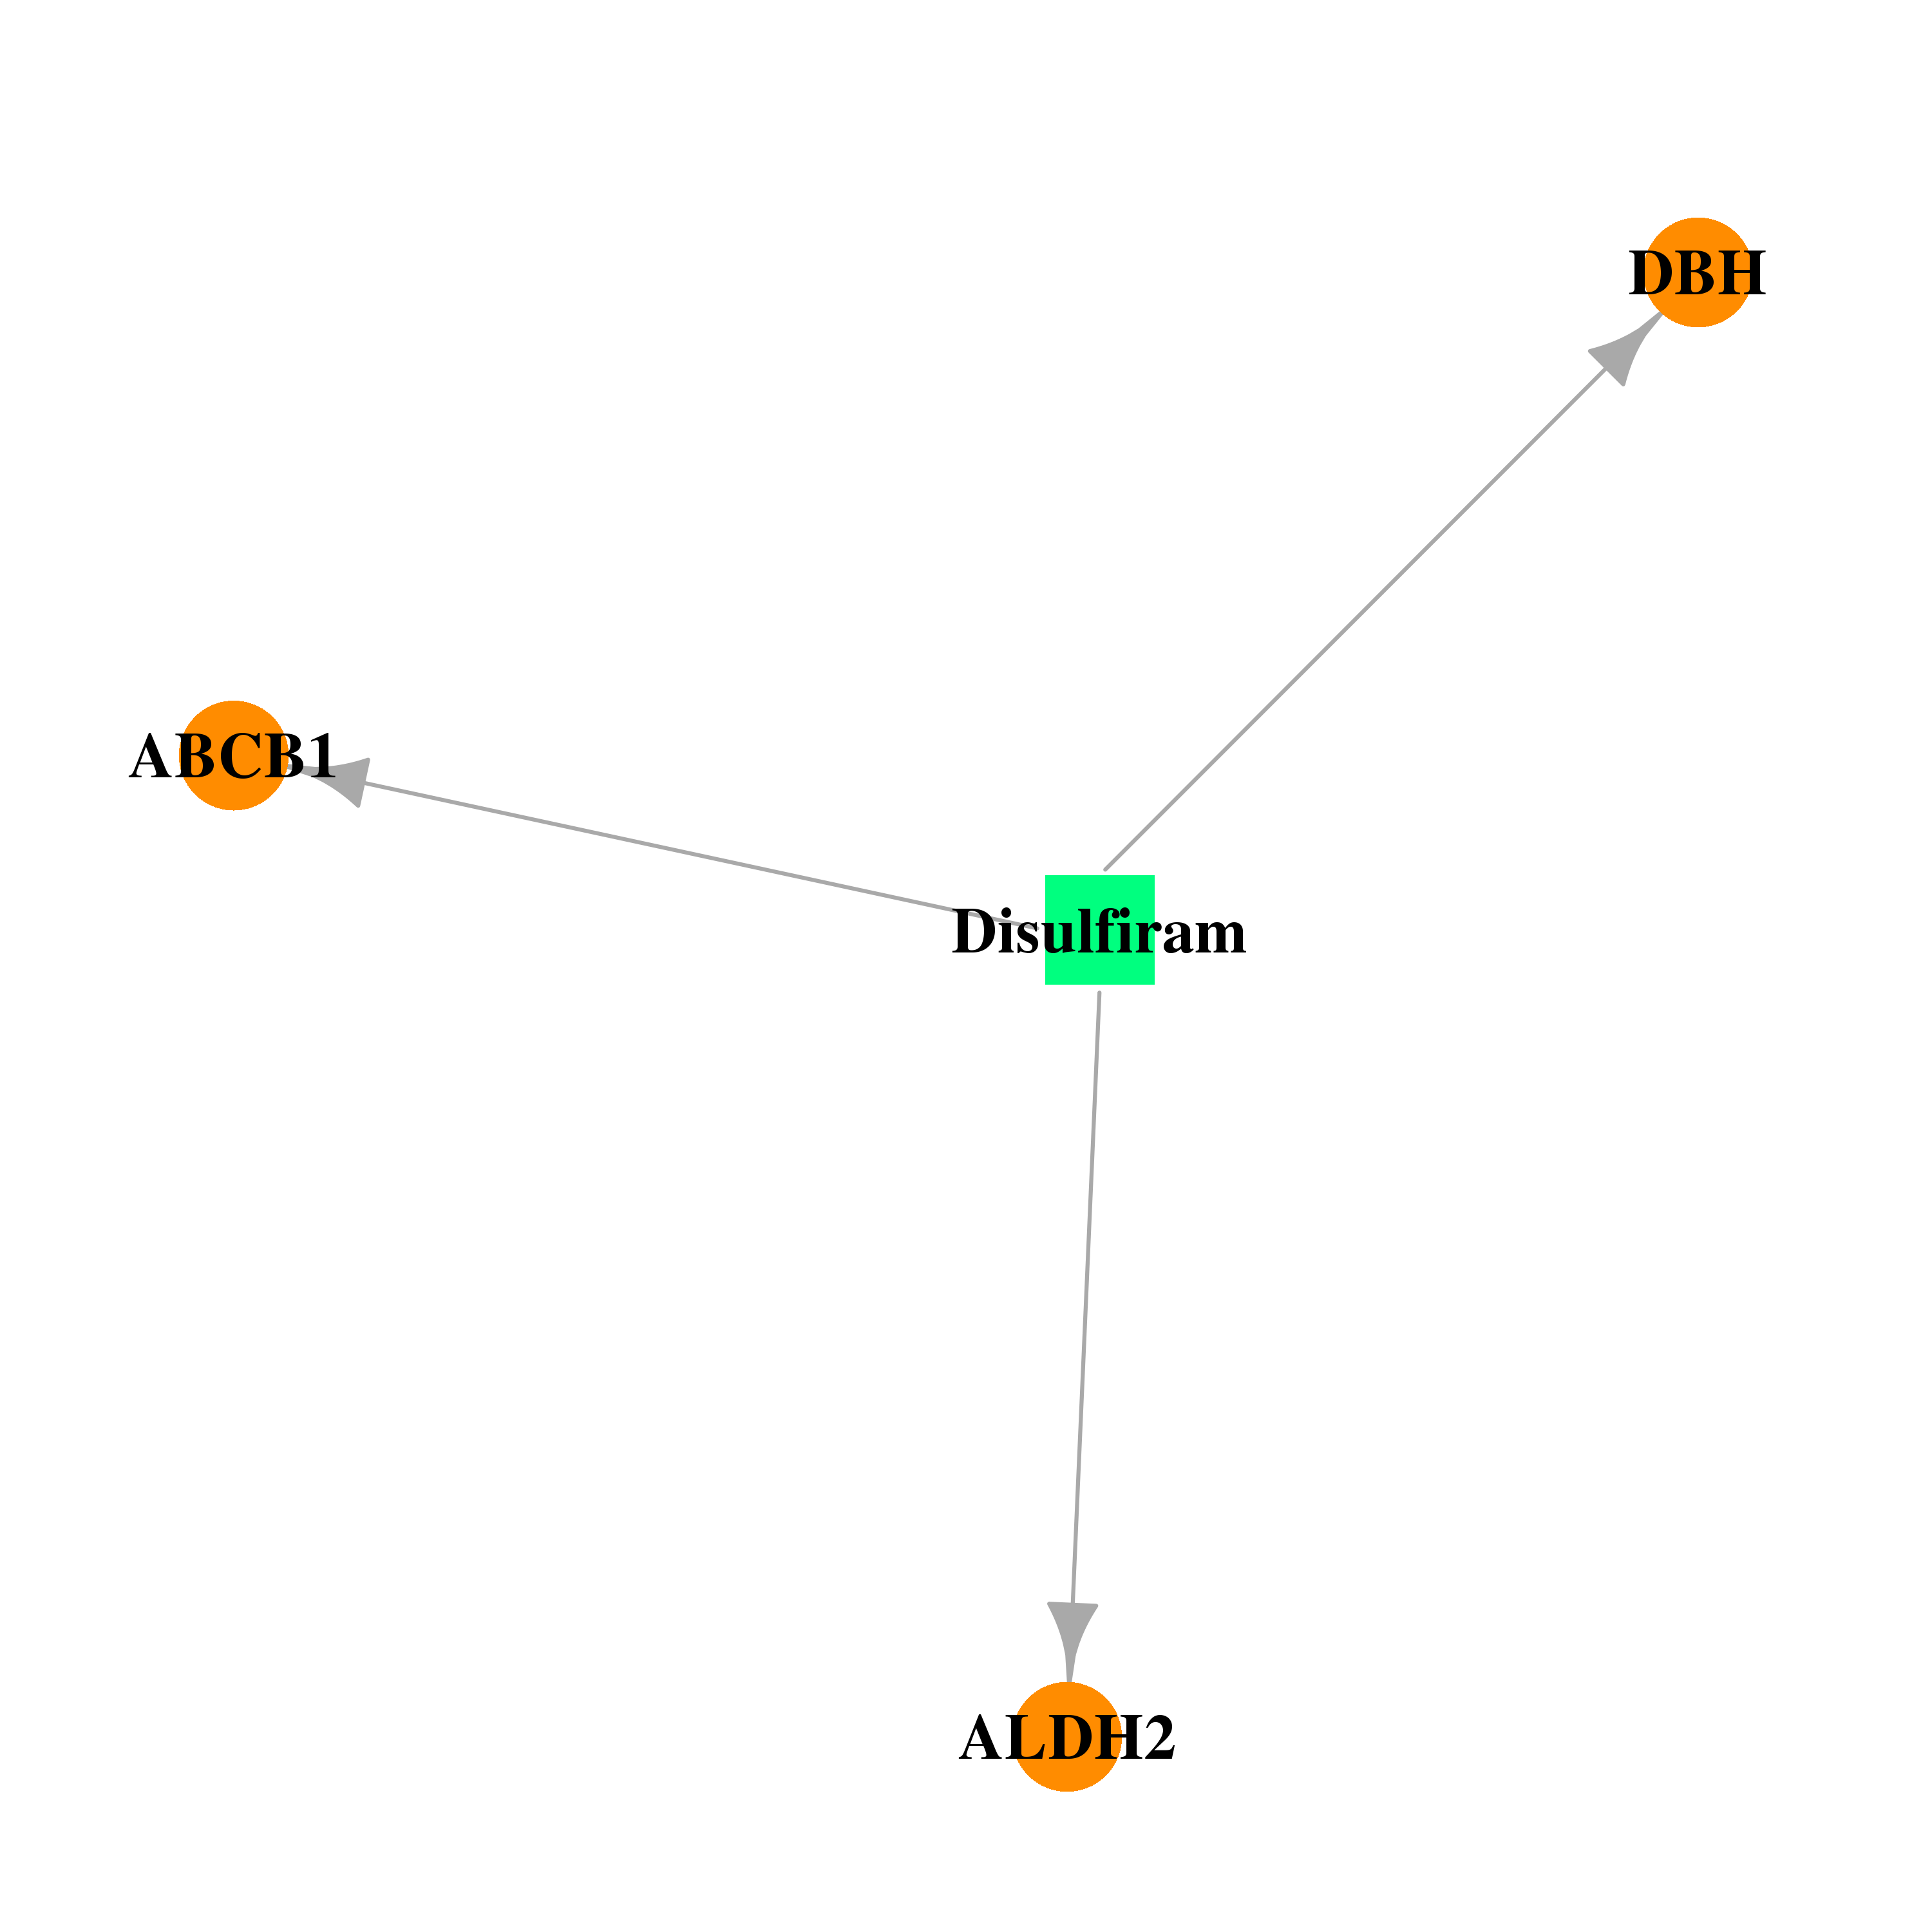 | 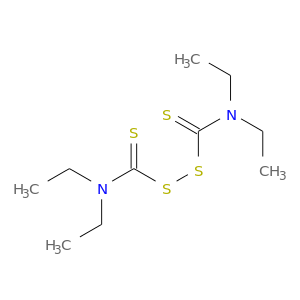 |
| DB00988 | dopamine beta-hydroxylase (dopamine beta-monooxygenase) | approved | Dopamine | 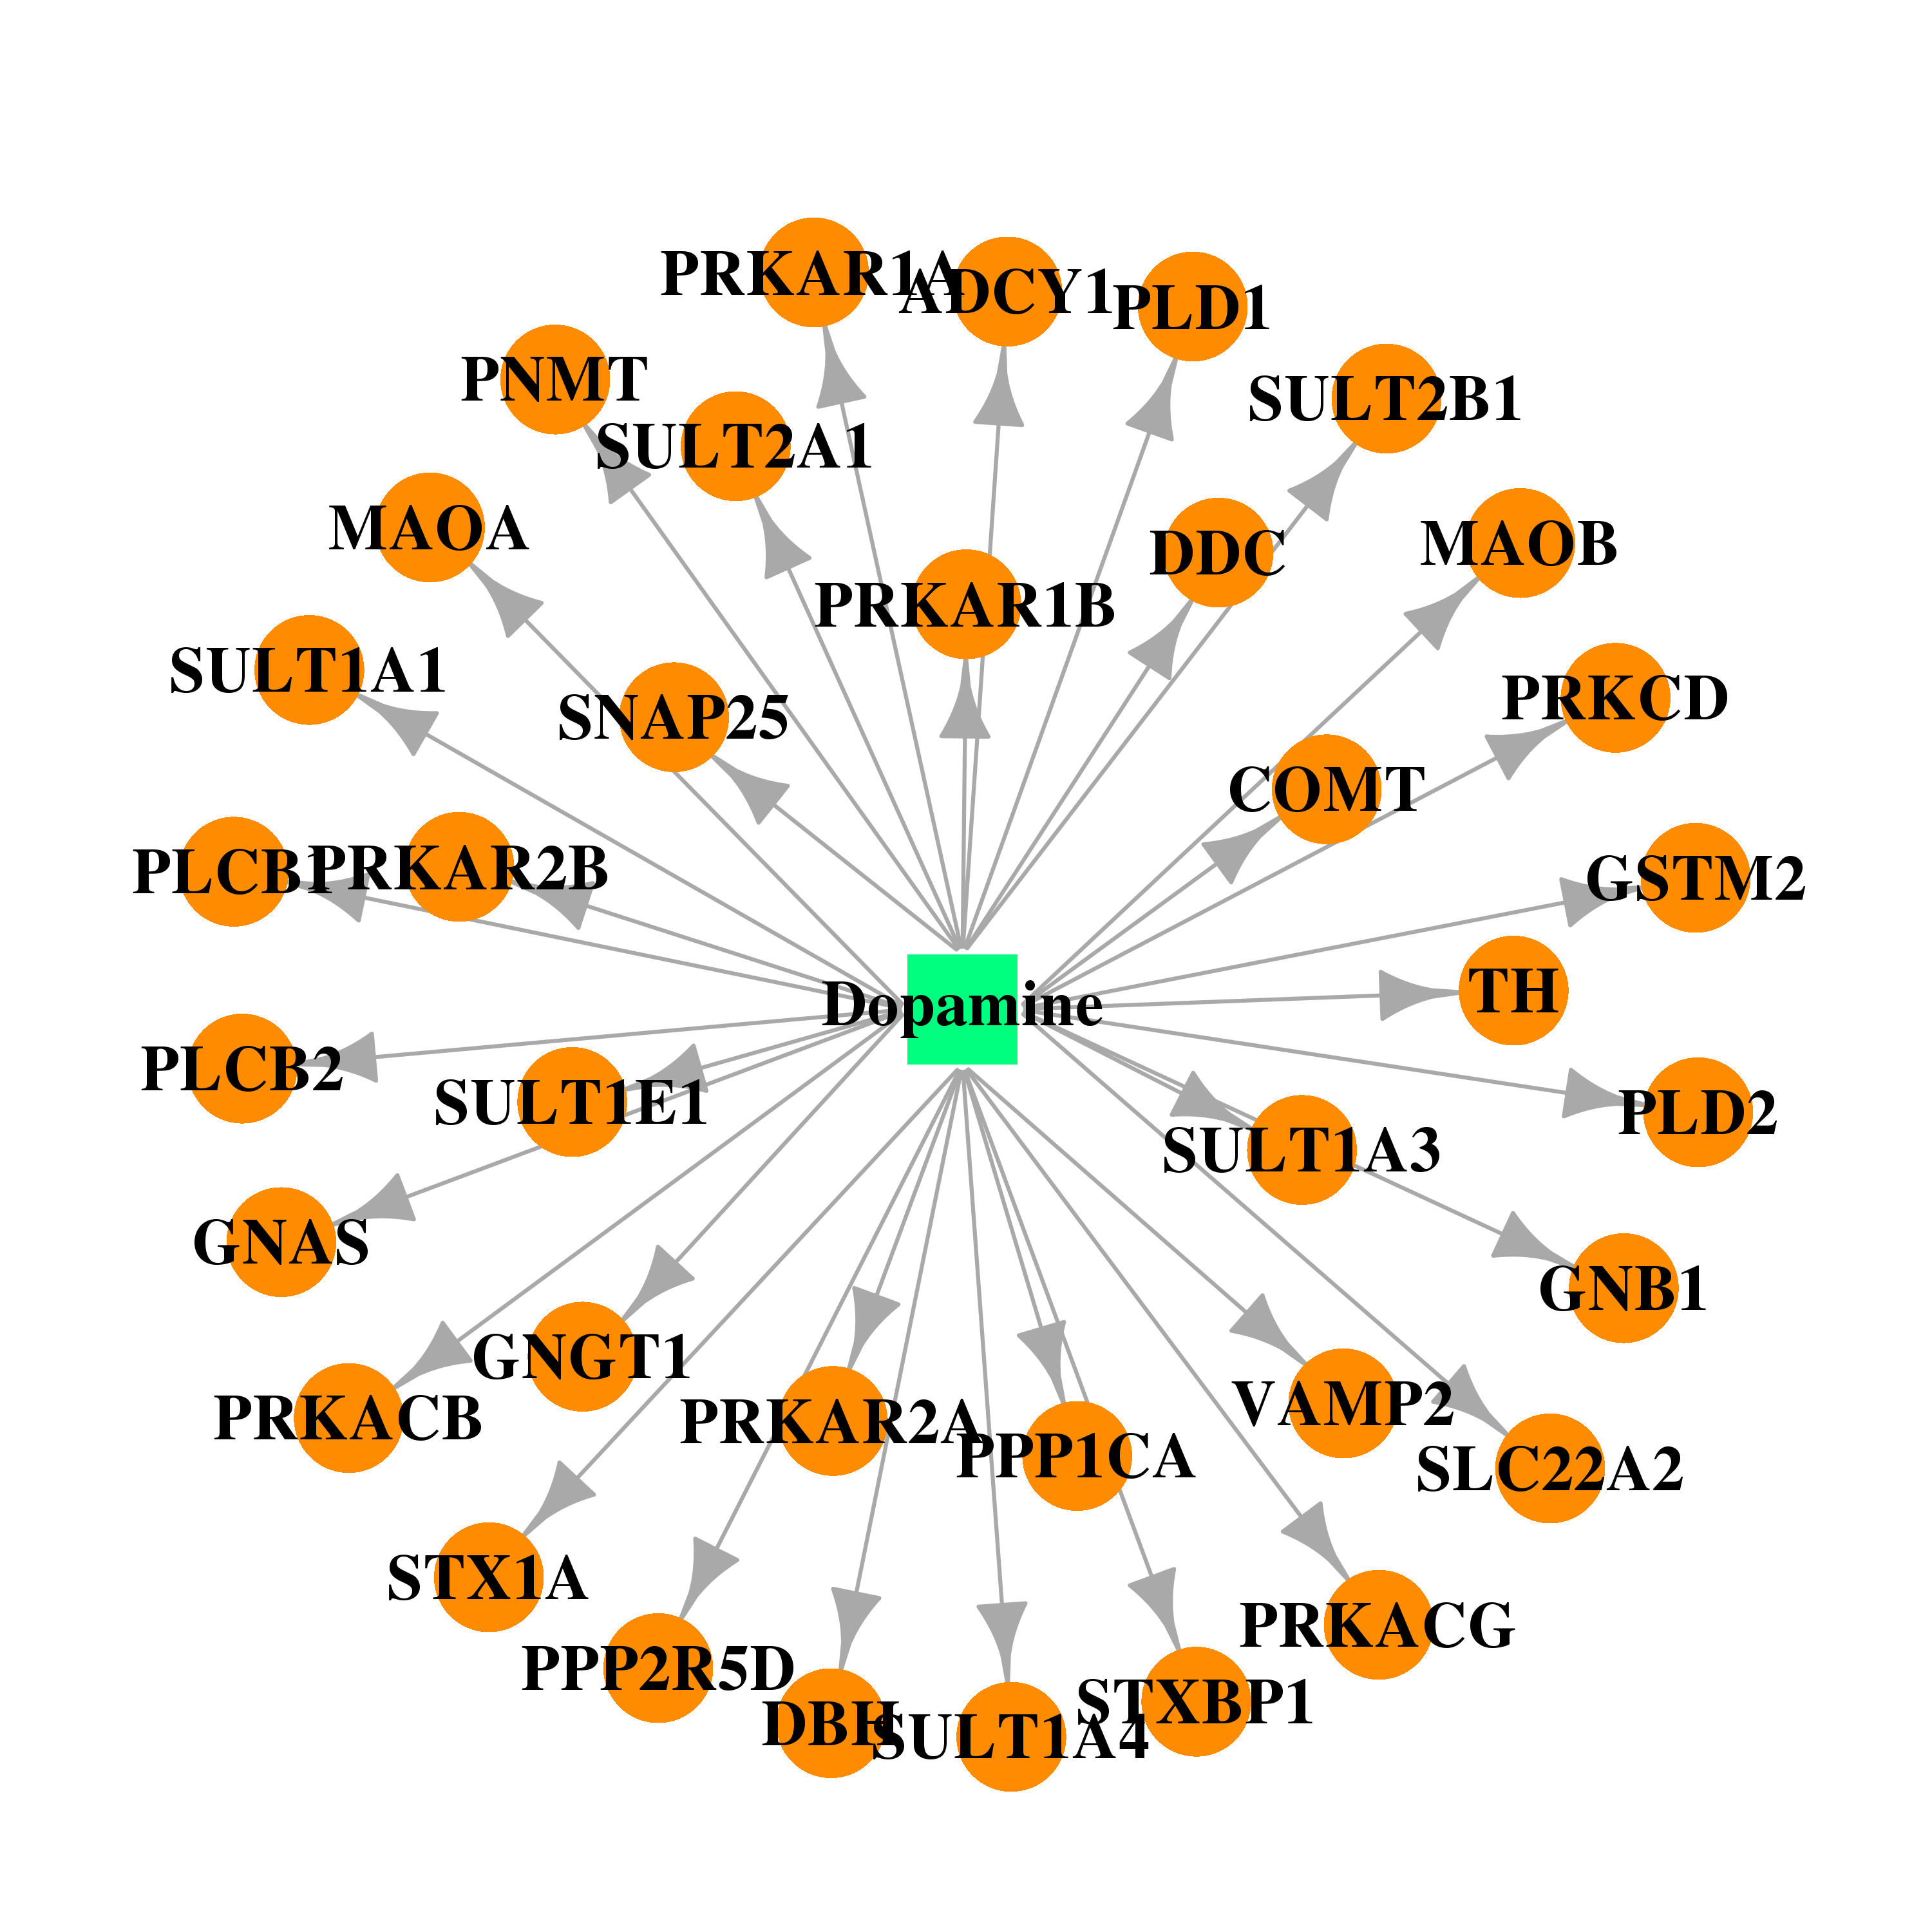 | 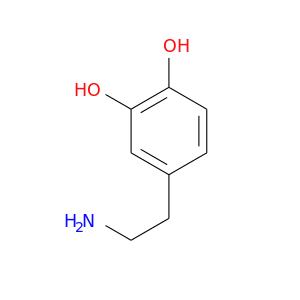 |
| DB00184 | dopamine beta-hydroxylase (dopamine beta-monooxygenase) | approved | Nicotine |  | 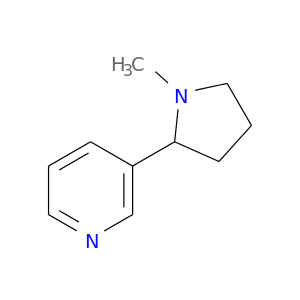 |
| DB00135 | dopamine beta-hydroxylase (dopamine beta-monooxygenase) | approved; nutraceutical | L-Tyrosine |  | 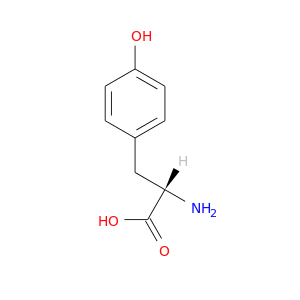 |
| DB00360 | dopamine beta-hydroxylase (dopamine beta-monooxygenase) | approved; investigational | Tetrahydrobiopterin | 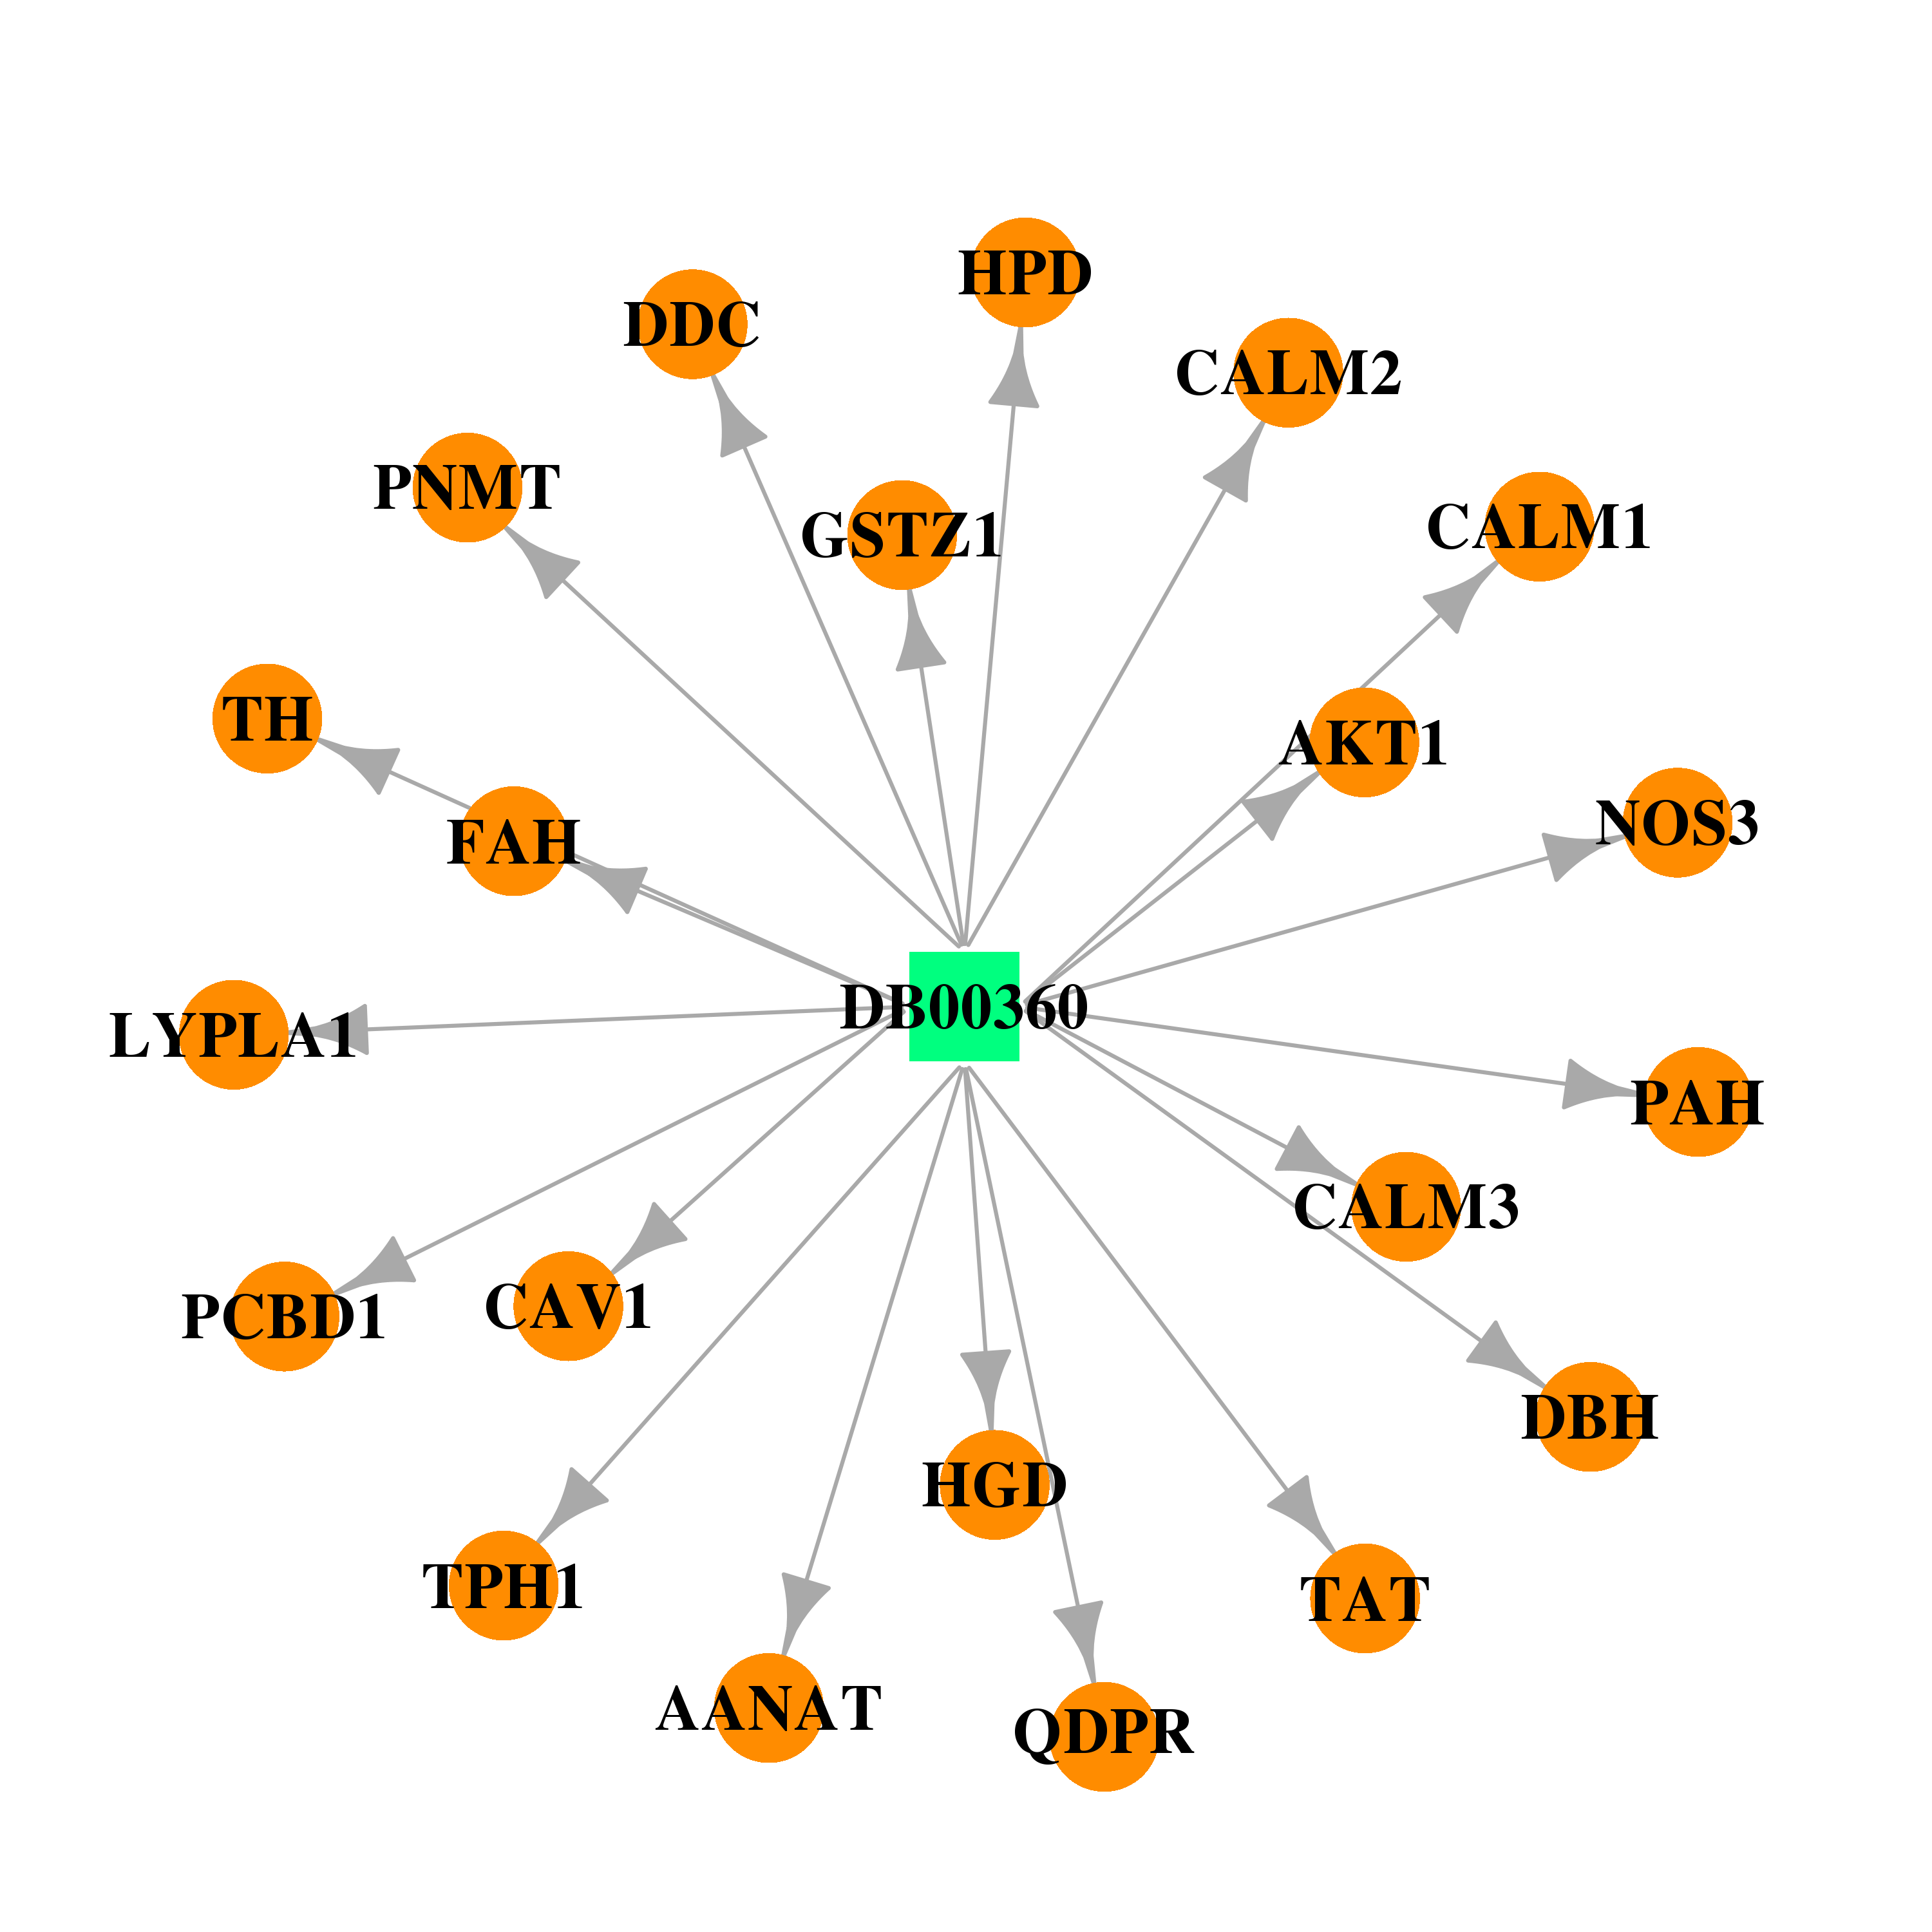 | 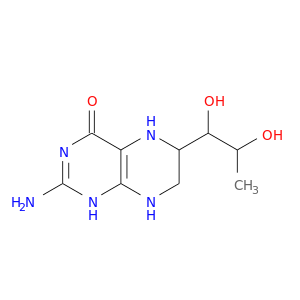 |
| DB00368 | dopamine beta-hydroxylase (dopamine beta-monooxygenase) | approved | Norepinephrine | 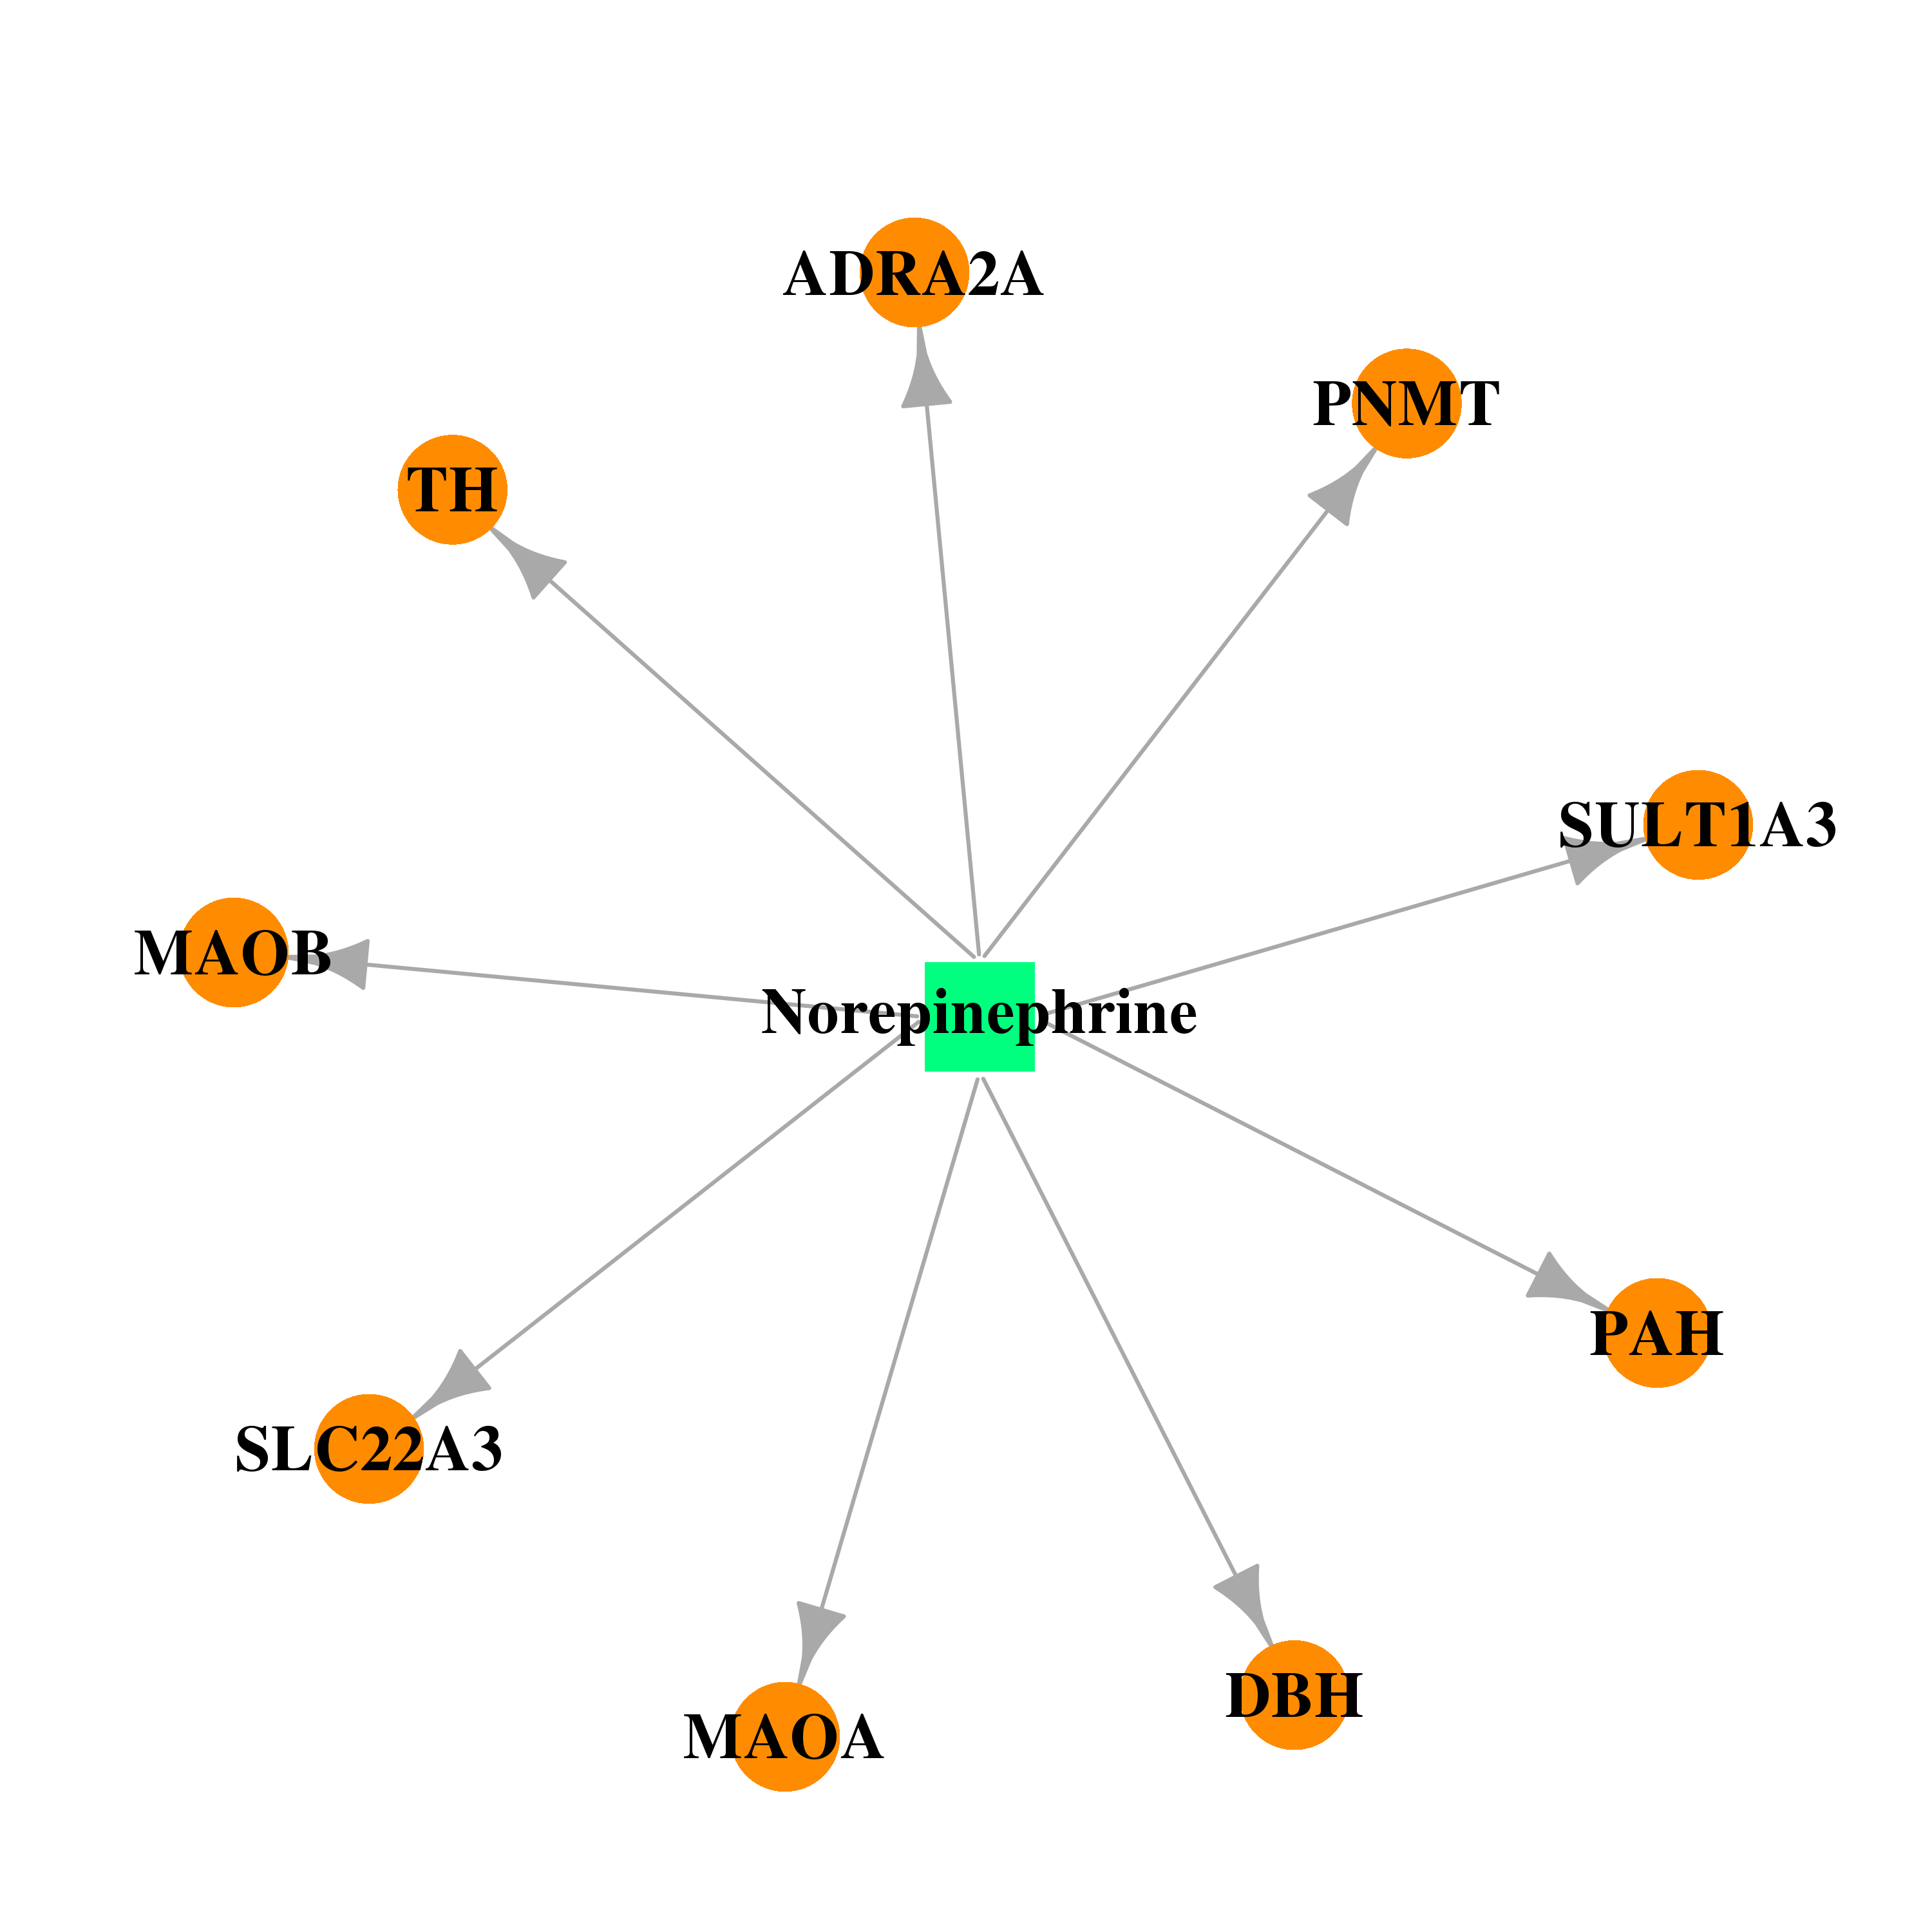 |  |
| DB01235 | dopamine beta-hydroxylase (dopamine beta-monooxygenase) | approved | Levodopa | 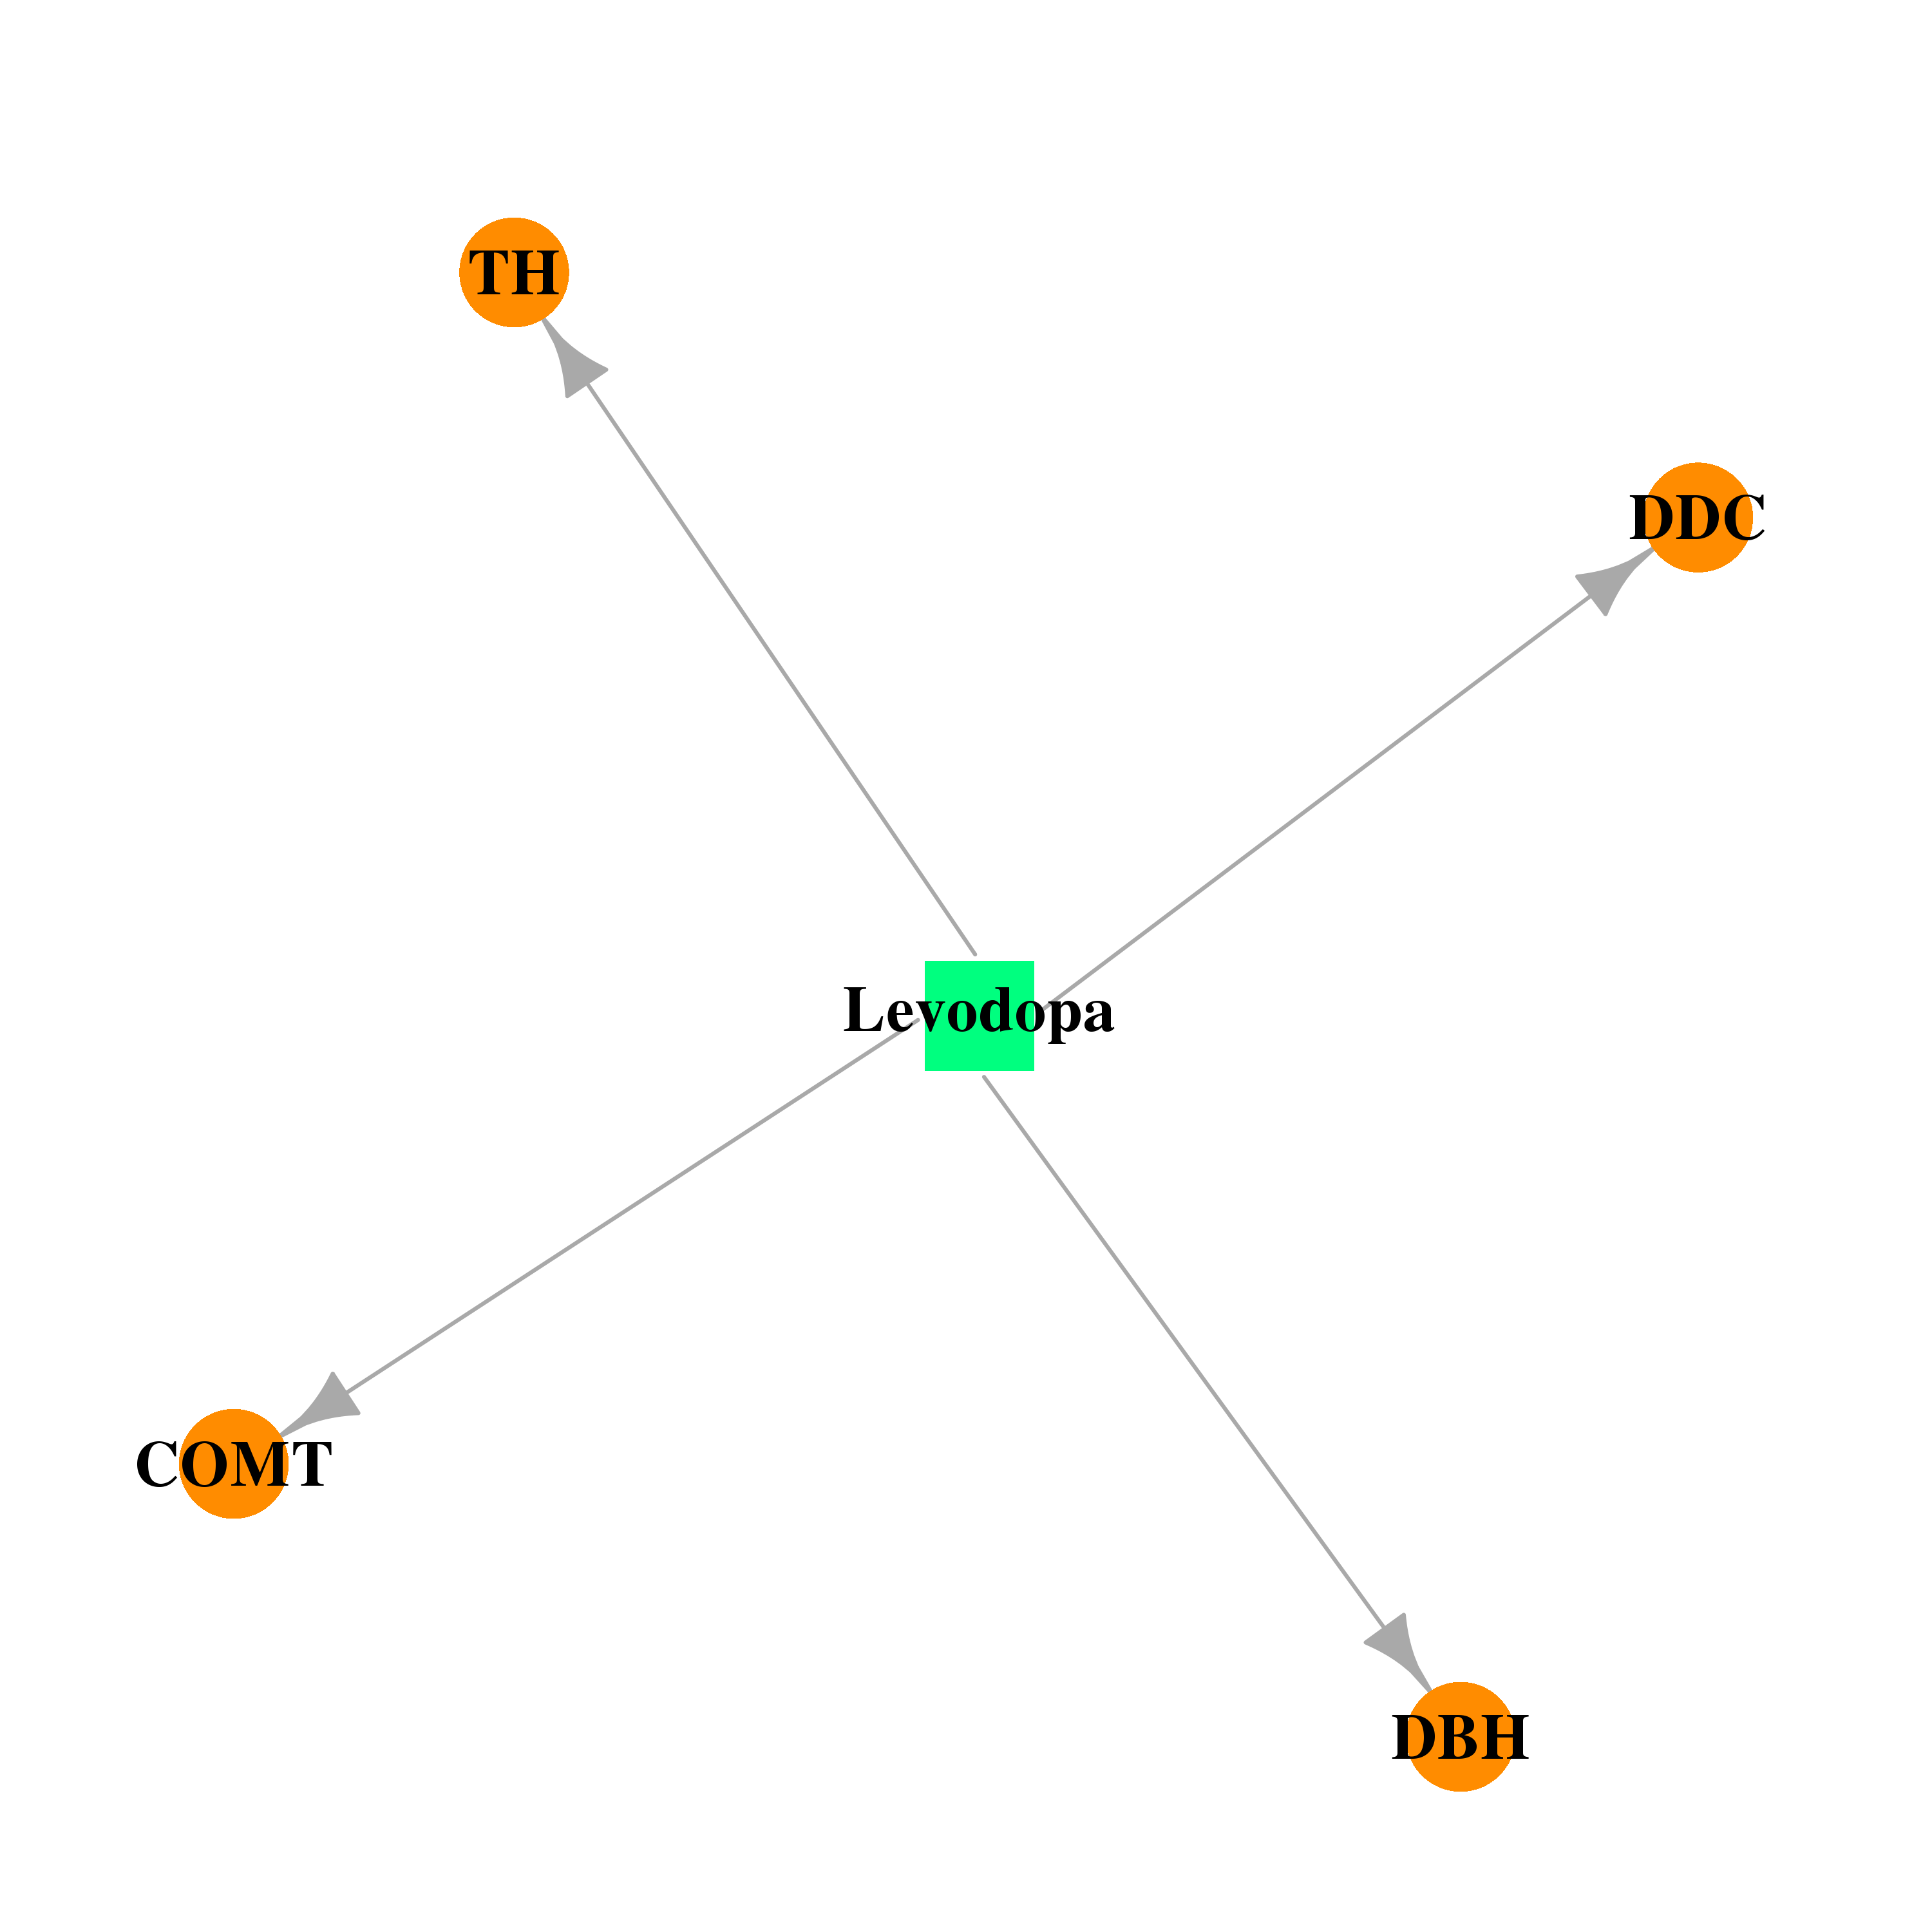 | 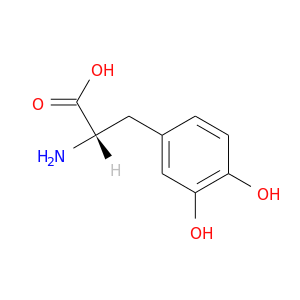 |
| DB01156 | dopamine beta-hydroxylase (dopamine beta-monooxygenase) | approved | Bupropion | 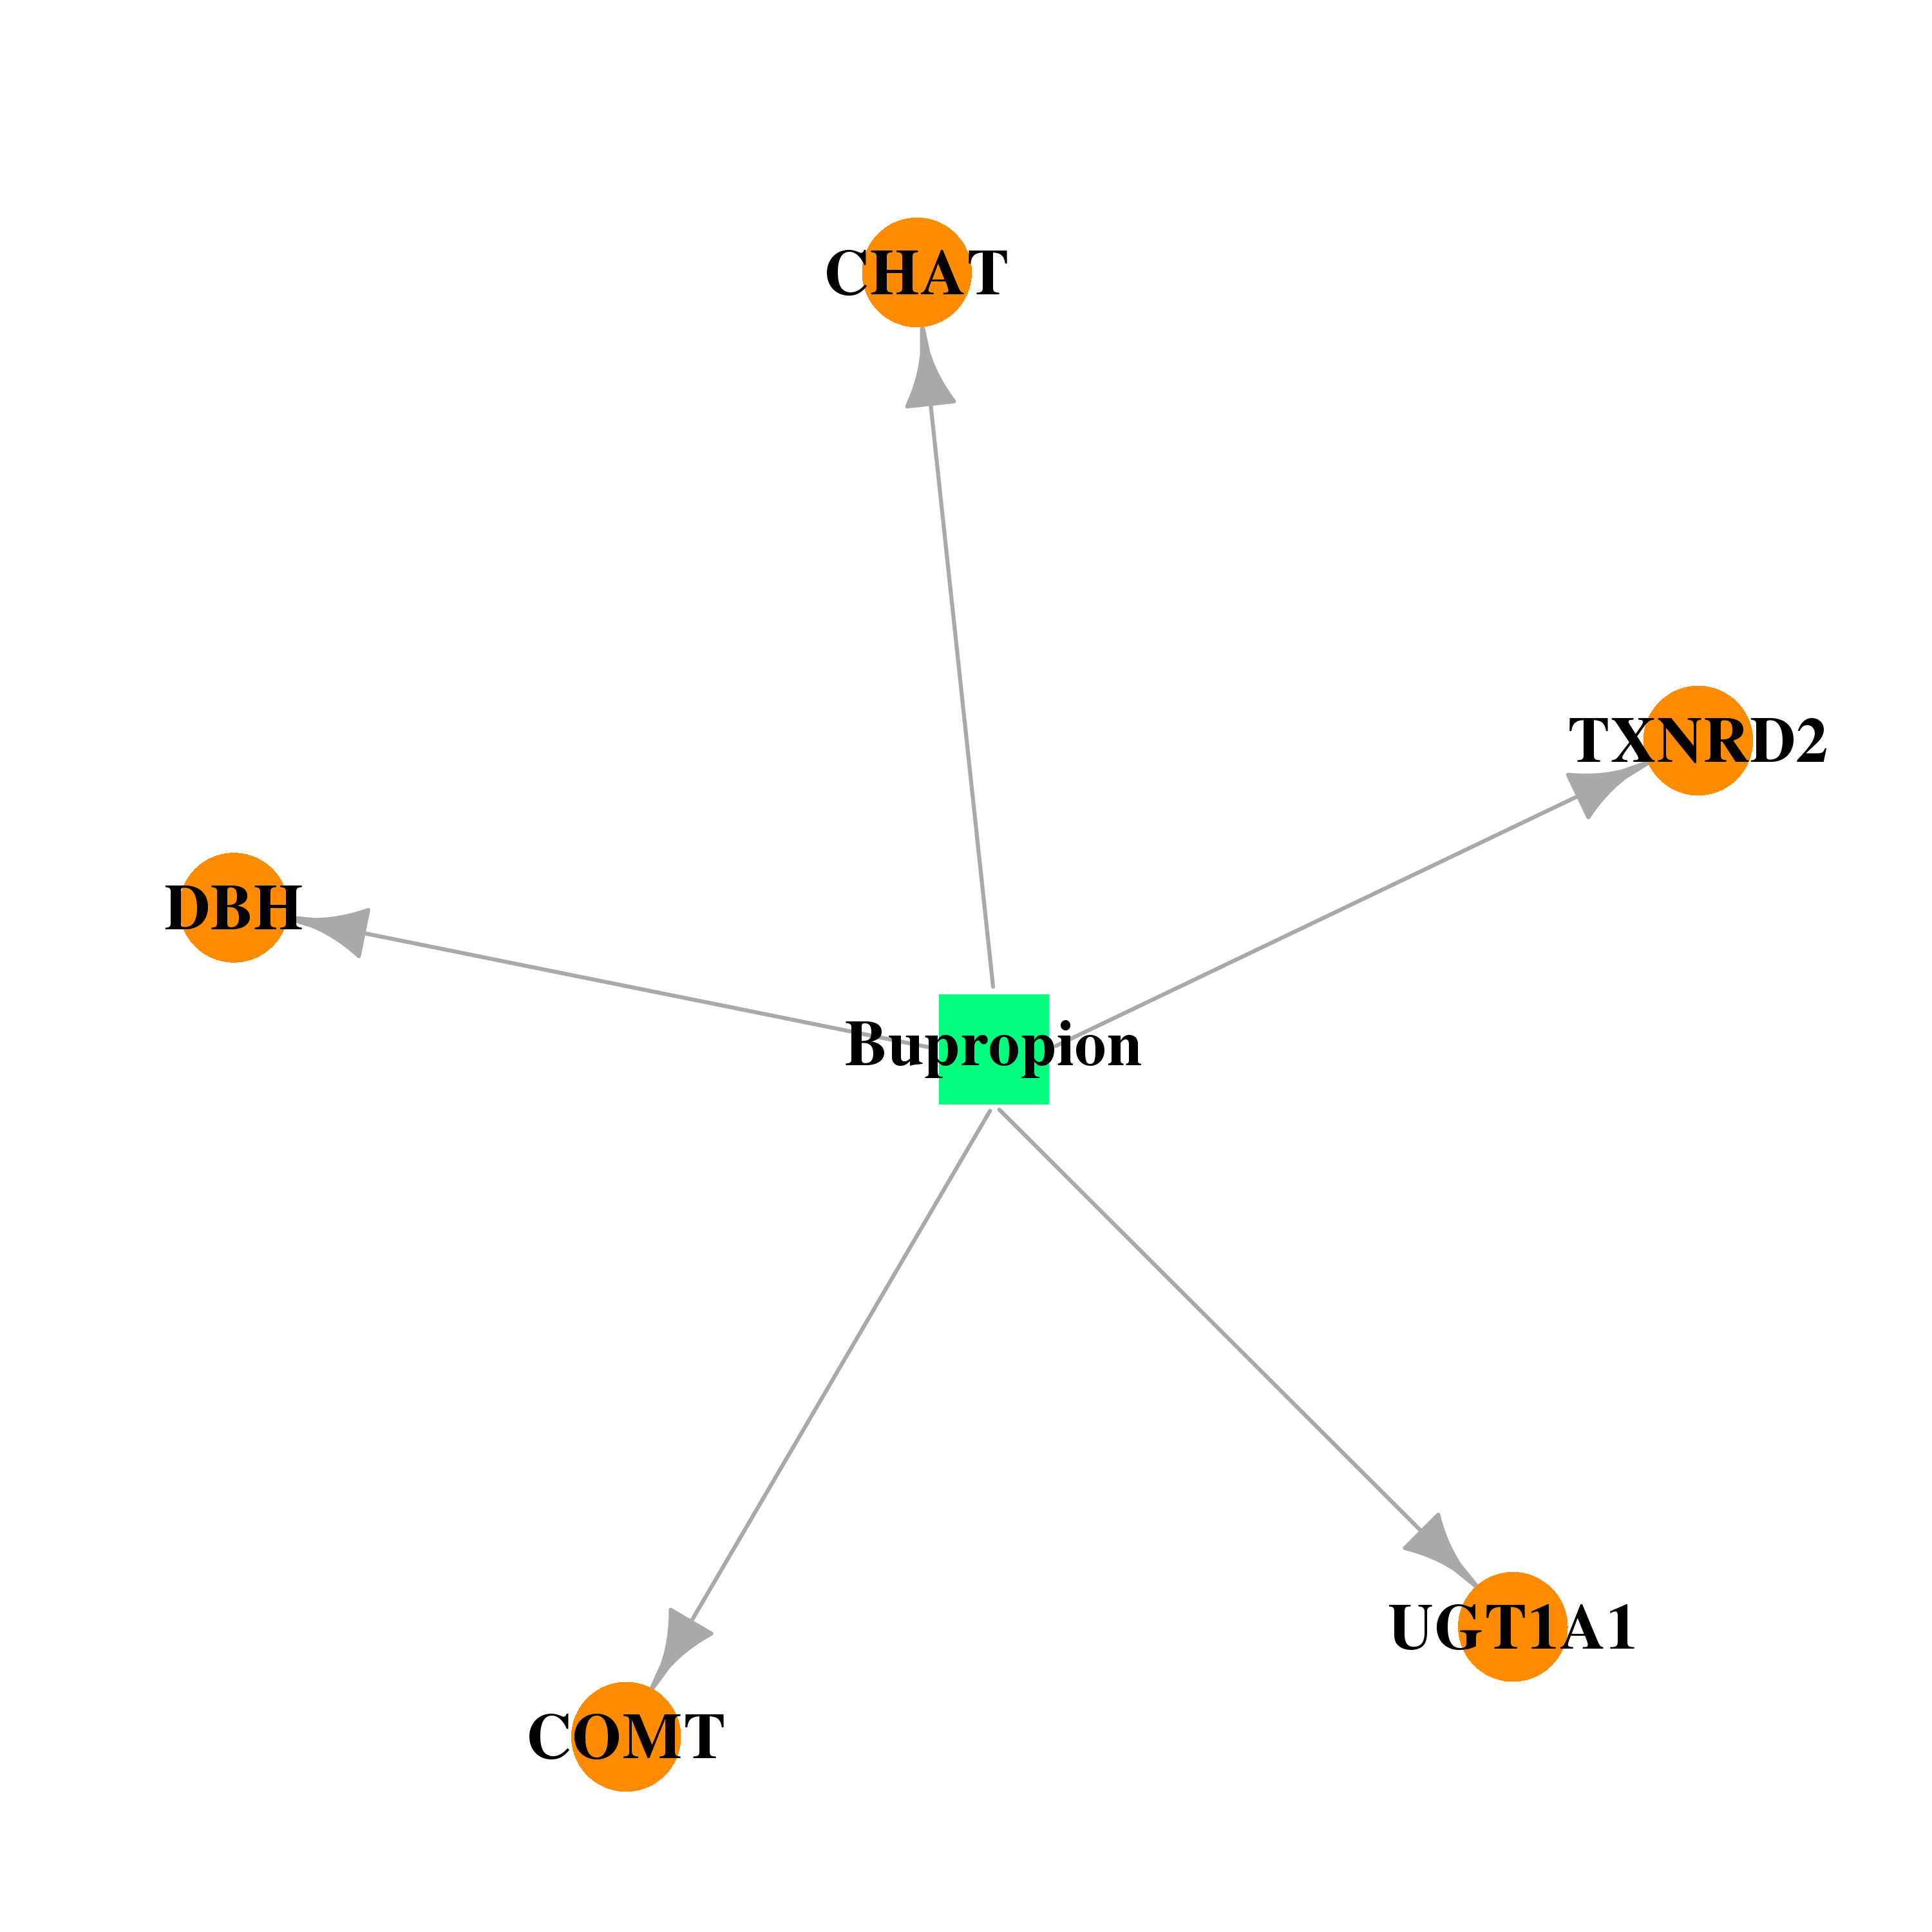 | 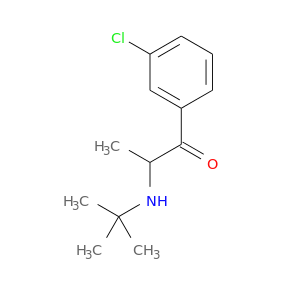 |
| Top |
| Cross referenced IDs for DBH |
| * We obtained these cross-references from Uniprot database. It covers 150 different DBs, 18 categories. http://www.uniprot.org/help/cross_references_section |
: Open all cross reference information
|
Copyright © 2016-Present - The Univsersity of Texas Health Science Center at Houston @ |