|
||||||||||||||||||||
| |
| Phenotypic Information (metabolism pathway, cancer, disease, phenome) |
| |
| |
| Gene-Gene Network Information: Co-Expression Network, Interacting Genes & KEGG |
| |
|


| Gene Summary for NAGS |
| Basic gene info. | Gene symbol | NAGS |
| Gene name | N-acetylglutamate synthase | |
| Synonyms | AGAS|ARGA | |
| Cytomap | UCSC genome browser: 17q21.31 | |
| Genomic location | chr17 :42082031-42086436 | |
| Type of gene | protein-coding | |
| RefGenes | NM_153006.2, | |
| Ensembl id | ENSG00000161653 | |
| Description | N-acetylglutamate synthase, mitochondrialamino-acid acetyltransferase | |
| Modification date | 20141207 | |
| dbXrefs | MIM : 608300 | |
| HGNC : HGNC | ||
| Ensembl : ENSG00000161653 | ||
| HPRD : 10510 | ||
| Vega : OTTHUMG00000181802 | ||
| Protein | UniProt: go to UniProt's Cross Reference DB Table | |
| Expression | CleanEX: HS_NAGS | |
| BioGPS: 162417 | ||
| Gene Expression Atlas: ENSG00000161653 | ||
| The Human Protein Atlas: ENSG00000161653 | ||
| Pathway | NCI Pathway Interaction Database: NAGS | |
| KEGG: NAGS | ||
| REACTOME: NAGS | ||
| ConsensusPathDB | ||
| Pathway Commons: NAGS | ||
| Metabolism | MetaCyc: NAGS | |
| HUMANCyc: NAGS | ||
| Regulation | Ensembl's Regulation: ENSG00000161653 | |
| miRBase: chr17 :42,082,031-42,086,436 | ||
| TargetScan: NM_153006 | ||
| cisRED: ENSG00000161653 | ||
| Context | iHOP: NAGS | |
| cancer metabolism search in PubMed: NAGS | ||
| UCL Cancer Institute: NAGS | ||
| Assigned class in ccmGDB | C | |
| Top |
| Phenotypic Information for NAGS(metabolism pathway, cancer, disease, phenome) |
| Cancer | CGAP: NAGS |
| Familial Cancer Database: NAGS | |
| * This gene is included in those cancer gene databases. |
|
|
|
|
|
| . | ||||||||||||||
Oncogene 1 | Significant driver gene in | |||||||||||||||||||
| cf) number; DB name 1 Oncogene; http://nar.oxfordjournals.org/content/35/suppl_1/D721.long, 2 Tumor Suppressor gene; https://bioinfo.uth.edu/TSGene/, 3 Cancer Gene Census; http://www.nature.com/nrc/journal/v4/n3/abs/nrc1299.html, 4 CancerGenes; http://nar.oxfordjournals.org/content/35/suppl_1/D721.long, 5 Network of Cancer Gene; http://ncg.kcl.ac.uk/index.php, 1Therapeutic Vulnerabilities in Cancer; http://cbio.mskcc.org/cancergenomics/statius/ |
| KEGG_ARGININE_AND_PROLINE_METABOLISM REACTOME_METABOLISM_OF_AMINO_ACIDS_AND_DERIVATIVES | |
| OMIM | |
| Orphanet | |
| Disease | KEGG Disease: NAGS |
| MedGen: NAGS (Human Medical Genetics with Condition) | |
| ClinVar: NAGS | |
| Phenotype | MGI: NAGS (International Mouse Phenotyping Consortium) |
| PhenomicDB: NAGS | |
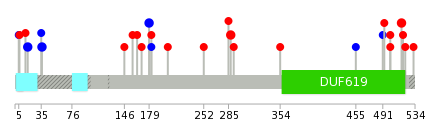
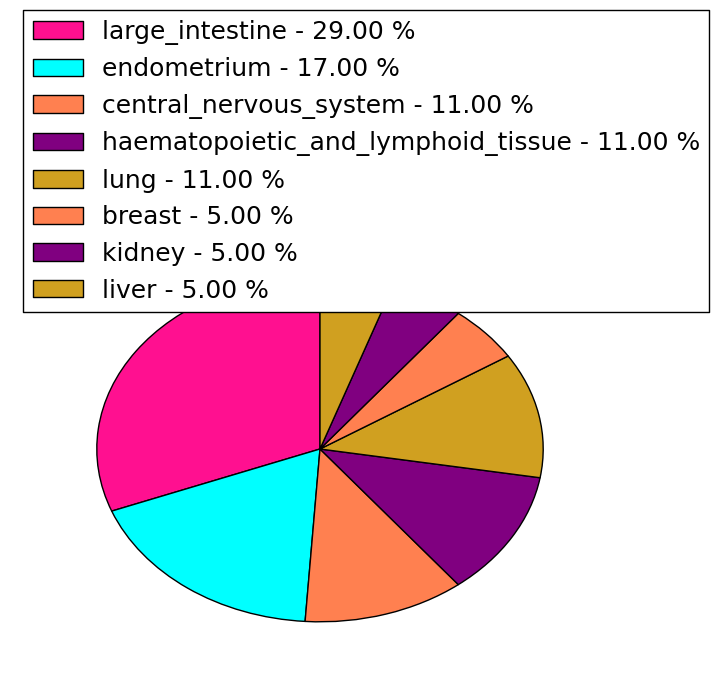
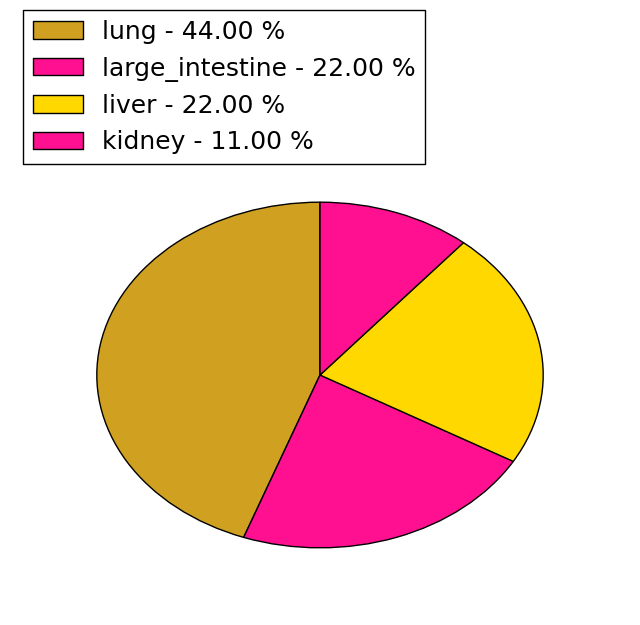
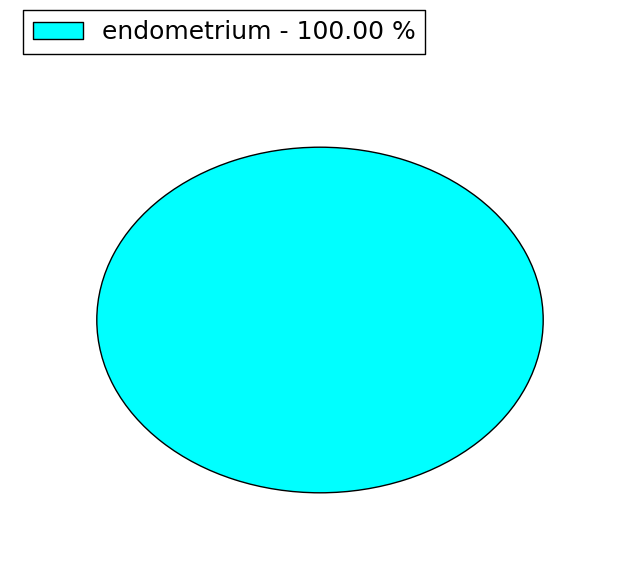
| Mutations for NAGS |
| * Under tables are showing count per each tissue to give us broad intuition about tissue specific mutation patterns.You can go to the detailed page for each mutation database's web site. |
| There's no structural variation information in COSMIC data for this gene. |
| * From mRNA Sanger sequences, Chitars2.0 arranged chimeric transcripts. This table shows NAGS related fusion information. |
| ID | Head Gene | Tail Gene | Accession | Gene_a | qStart_a | qEnd_a | Chromosome_a | tStart_a | tEnd_a | Gene_a | qStart_a | qEnd_a | Chromosome_a | tStart_a | tEnd_a |
| R97030 | NAGS | 1 | 95 | 17 | 42086332 | 42086426 | LIN54 | 85 | 374 | 4 | 83868820 | 83869103 | |
| Top |
| There's no copy number variation information in COSMIC data for this gene. |
| Top |
|
 |
| Top |
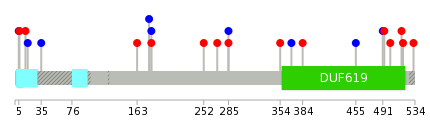
| Stat. for Non-Synonymous SNVs (# total SNVs=17) | (# total SNVs=9) |
 |  |
(# total SNVs=1) | (# total SNVs=0) |
 |
| Top |
| * When you move the cursor on each content, you can see more deailed mutation information on the Tooltip. Those are primary_site,primary_histology,mutation(aa),pubmedID. |
| GRCh37 position | Mutation(aa) | Unique sampleID count |
| chr17:42083115-42083115 | p.A179A | 2 |
| chr17:42082082-42082082 | p.P17P | 2 |
| chr17:42085912-42085912 | p.N516K | 2 |
| chr17:42082139-42082139 | p.R36R | 2 |
| chr17:42083553-42083553 | p.T288I | 2 |
| chr17:42083083-42083083 | p.M169L | 1 |
| chr17:42085808-42085808 | p.? | 1 |
| chr17:42085837-42085837 | p.G491G | 1 |
| chr17:42082046-42082046 | p.L5L | 1 |
| chr17:42083122-42083122 | p.A182T | 1 |
| Top |
|
 |
| Point Mutation/ Tissue ID | 1 | 2 | 3 | 4 | 5 | 6 | 7 | 8 | 9 | 10 | 11 | 12 | 13 | 14 | 15 | 16 | 17 | 18 | 19 | 20 |
| # sample | 6 | 1 | 3 | 1 | 1 | 3 | 1 | 1 | 3 | 3 | ||||||||||
| # mutation | 6 | 1 | 3 | 1 | 1 | 3 | 1 | 1 | 3 | 3 | ||||||||||
| nonsynonymous SNV | 5 | 1 | 2 | 1 | 1 | 1 | 3 | |||||||||||||
| synonymous SNV | 1 | 1 | 1 | 3 | 1 | 2 |
| cf) Tissue ID; Tissue type (1; BLCA[Bladder Urothelial Carcinoma], 2; BRCA[Breast invasive carcinoma], 3; CESC[Cervical squamous cell carcinoma and endocervical adenocarcinoma], 4; COAD[Colon adenocarcinoma], 5; GBM[Glioblastoma multiforme], 6; Glioma Low Grade, 7; HNSC[Head and Neck squamous cell carcinoma], 8; KICH[Kidney Chromophobe], 9; KIRC[Kidney renal clear cell carcinoma], 10; KIRP[Kidney renal papillary cell carcinoma], 11; LAML[Acute Myeloid Leukemia], 12; LUAD[Lung adenocarcinoma], 13; LUSC[Lung squamous cell carcinoma], 14; OV[Ovarian serous cystadenocarcinoma ], 15; PAAD[Pancreatic adenocarcinoma], 16; PRAD[Prostate adenocarcinoma], 17; SKCM[Skin Cutaneous Melanoma], 18:STAD[Stomach adenocarcinoma], 19:THCA[Thyroid carcinoma], 20:UCEC[Uterine Corpus Endometrial Carcinoma]) |
| Top |
| * We represented just top 10 SNVs. When you move the cursor on each content, you can see more deailed mutation information on the Tooltip. Those are primary_site, primary_histology, mutation(aa), pubmedID. |
| Genomic Position | Mutation(aa) | Unique sampleID count |
| chr17:42083122 | p.A182T | 1 |
| chr17:42085843 | p.A182A | 1 |
| chr17:42083124 | p.S252L | 1 |
| chr17:42085865 | p.V270E | 1 |
| chr17:42083445 | p.L285P | 1 |
| chr17:42085912 | p.L285L | 1 |
| chr17:42083499 | p.A354T | 1 |
| chr17:42085916 | p.T369T | 1 |
| chr17:42082046 | p.D384E | 1 |
| chr17:42083544 | p.L5L | 1 |
| * Copy number data were extracted from TCGA using R package TCGA-Assembler. The URLs of all public data files on TCGA DCC data server were gathered on Jan-05-2015. Function ProcessCNAData in TCGA-Assembler package was used to obtain gene-level copy number value which is calculated as the average copy number of the genomic region of a gene. |
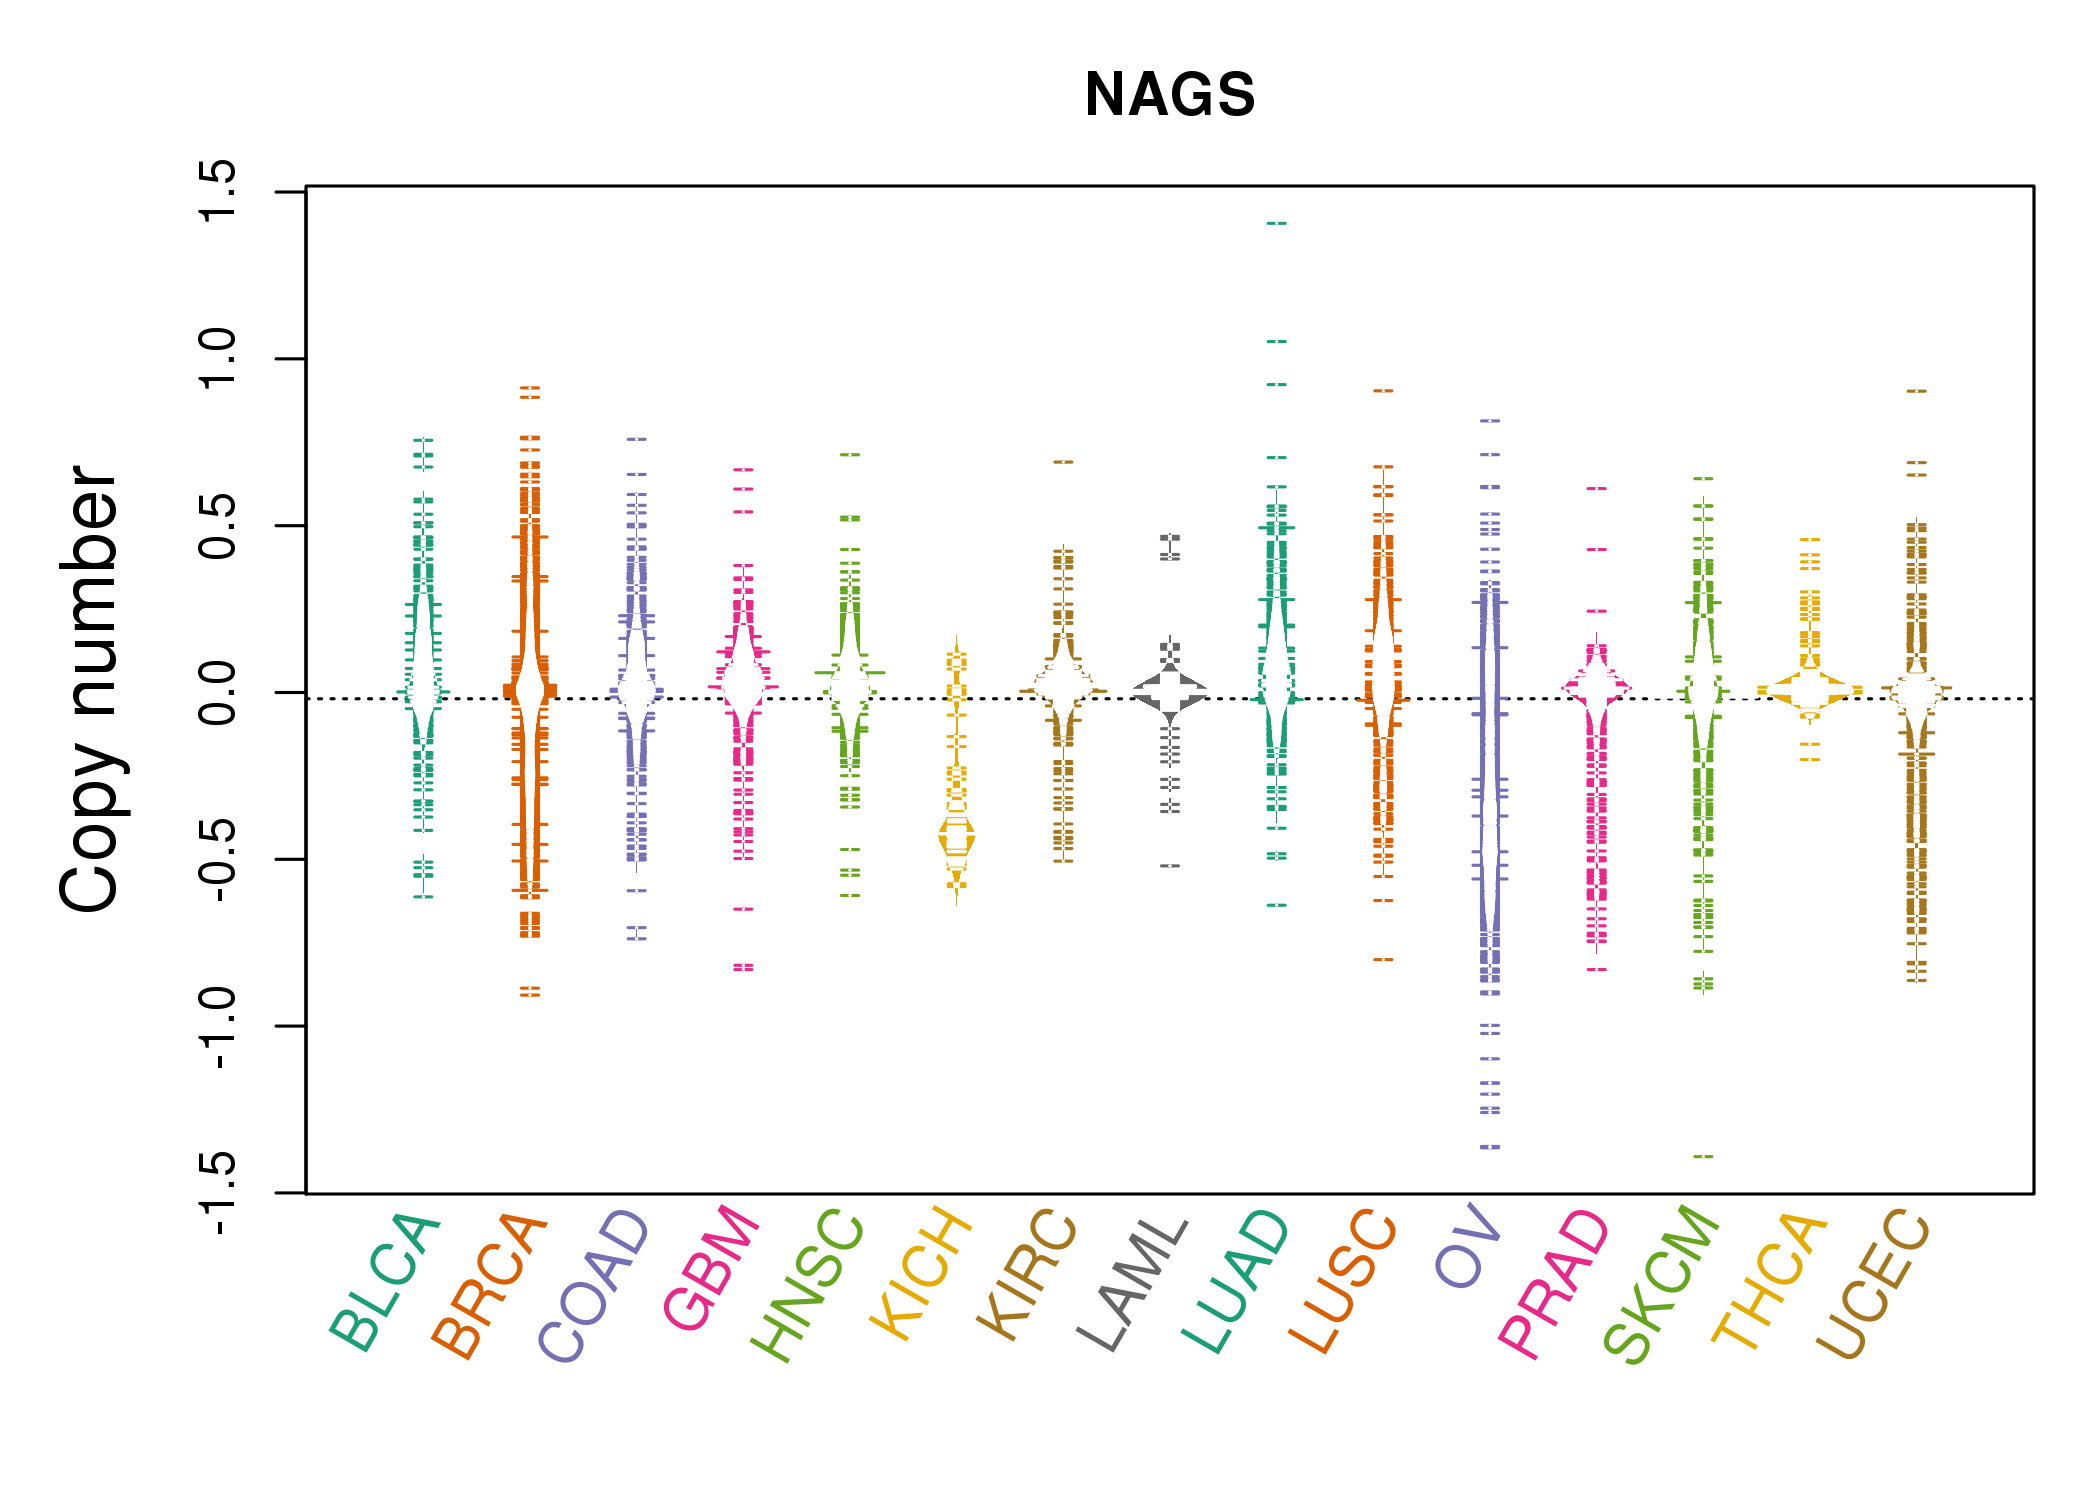 |
| cf) Tissue ID[Tissue type]: BLCA[Bladder Urothelial Carcinoma], BRCA[Breast invasive carcinoma], CESC[Cervical squamous cell carcinoma and endocervical adenocarcinoma], COAD[Colon adenocarcinoma], GBM[Glioblastoma multiforme], Glioma Low Grade, HNSC[Head and Neck squamous cell carcinoma], KICH[Kidney Chromophobe], KIRC[Kidney renal clear cell carcinoma], KIRP[Kidney renal papillary cell carcinoma], LAML[Acute Myeloid Leukemia], LUAD[Lung adenocarcinoma], LUSC[Lung squamous cell carcinoma], OV[Ovarian serous cystadenocarcinoma ], PAAD[Pancreatic adenocarcinoma], PRAD[Prostate adenocarcinoma], SKCM[Skin Cutaneous Melanoma], STAD[Stomach adenocarcinoma], THCA[Thyroid carcinoma], UCEC[Uterine Corpus Endometrial Carcinoma] |
| Top |
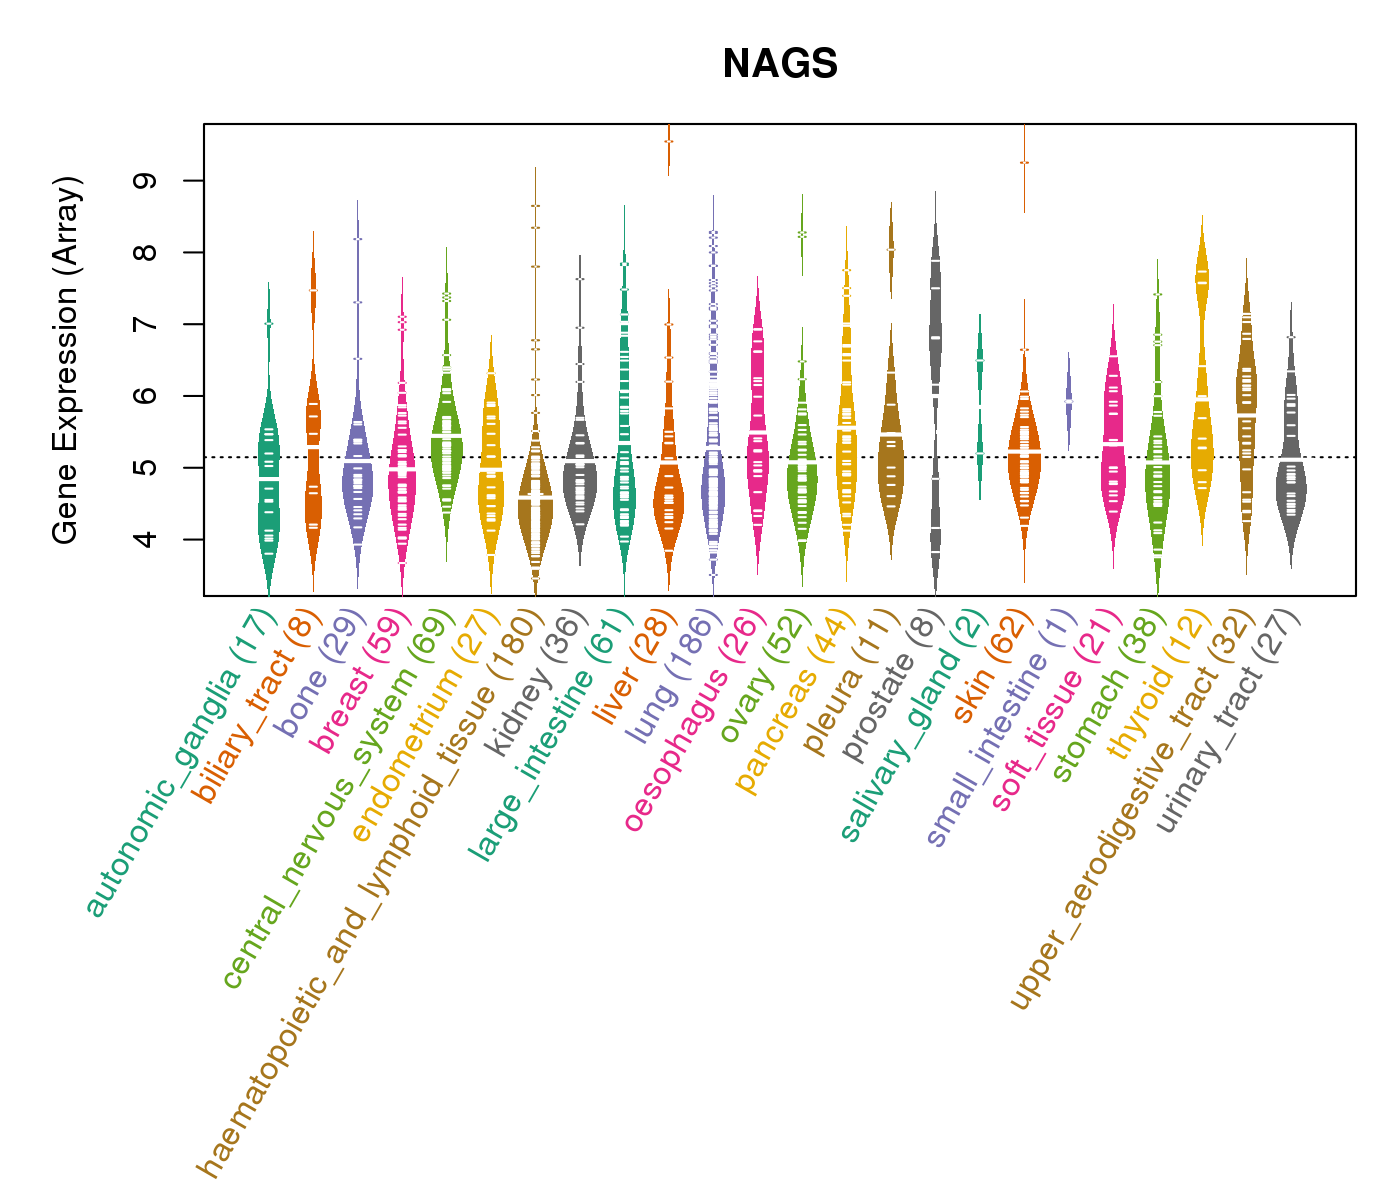
| Gene Expression for NAGS |
| * CCLE gene expression data were extracted from CCLE_Expression_Entrez_2012-10-18.res: Gene-centric RMA-normalized mRNA expression data. |
 |
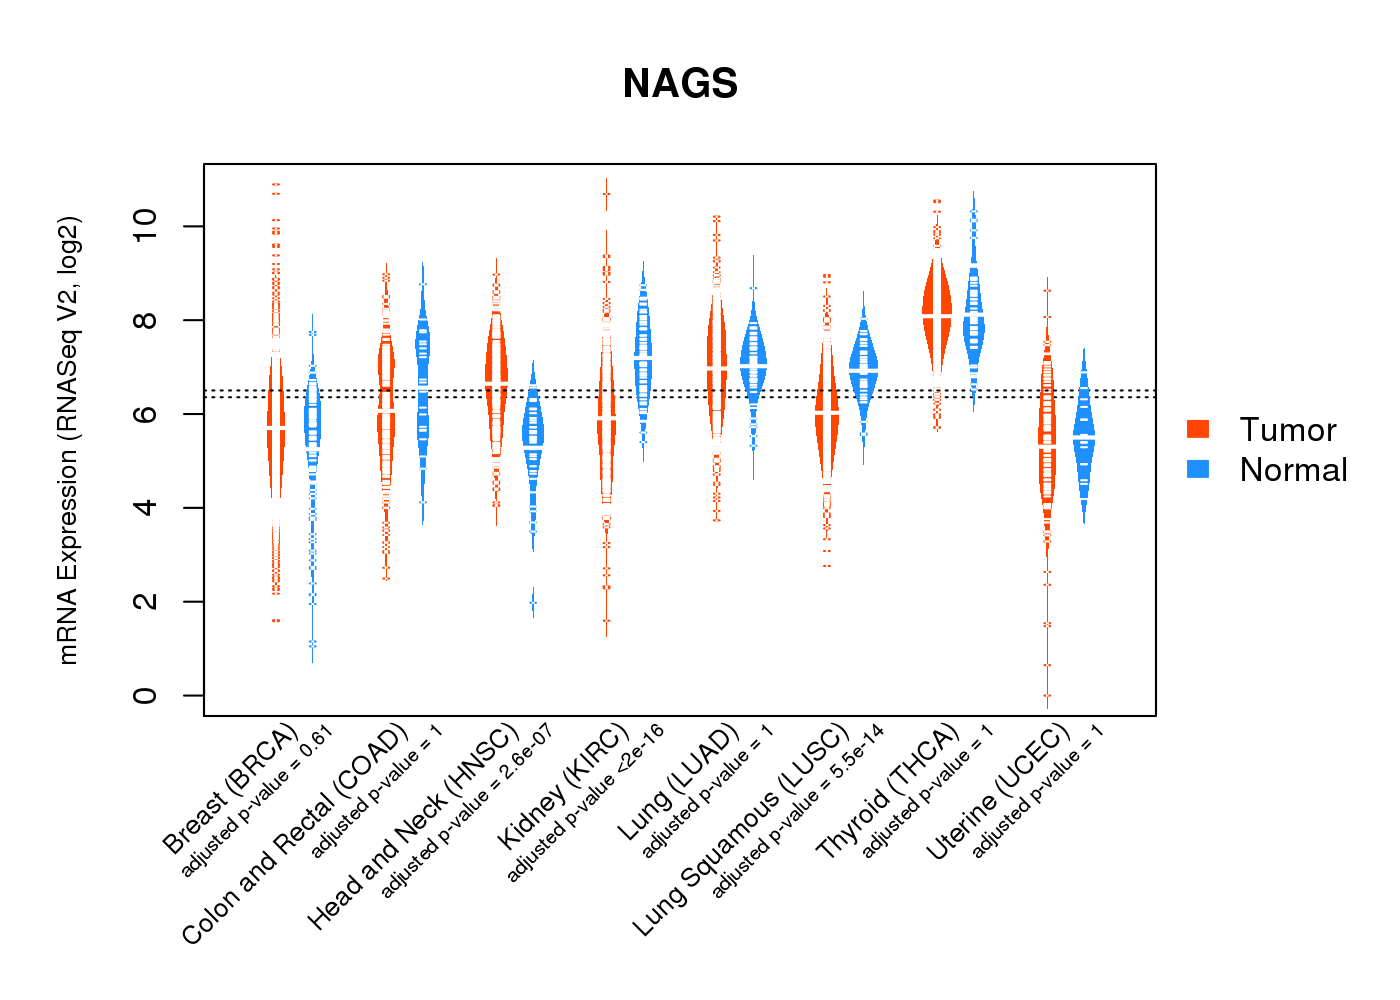
| * Normalized gene expression data of RNASeqV2 was extracted from TCGA using R package TCGA-Assembler. The URLs of all public data files on TCGA DCC data server were gathered at Jan-05-2015. Only eight cancer types have enough normal control samples for differential expression analysis. (t test, adjusted p<0.05 (using Benjamini-Hochberg FDR)) |
 |
| Top |
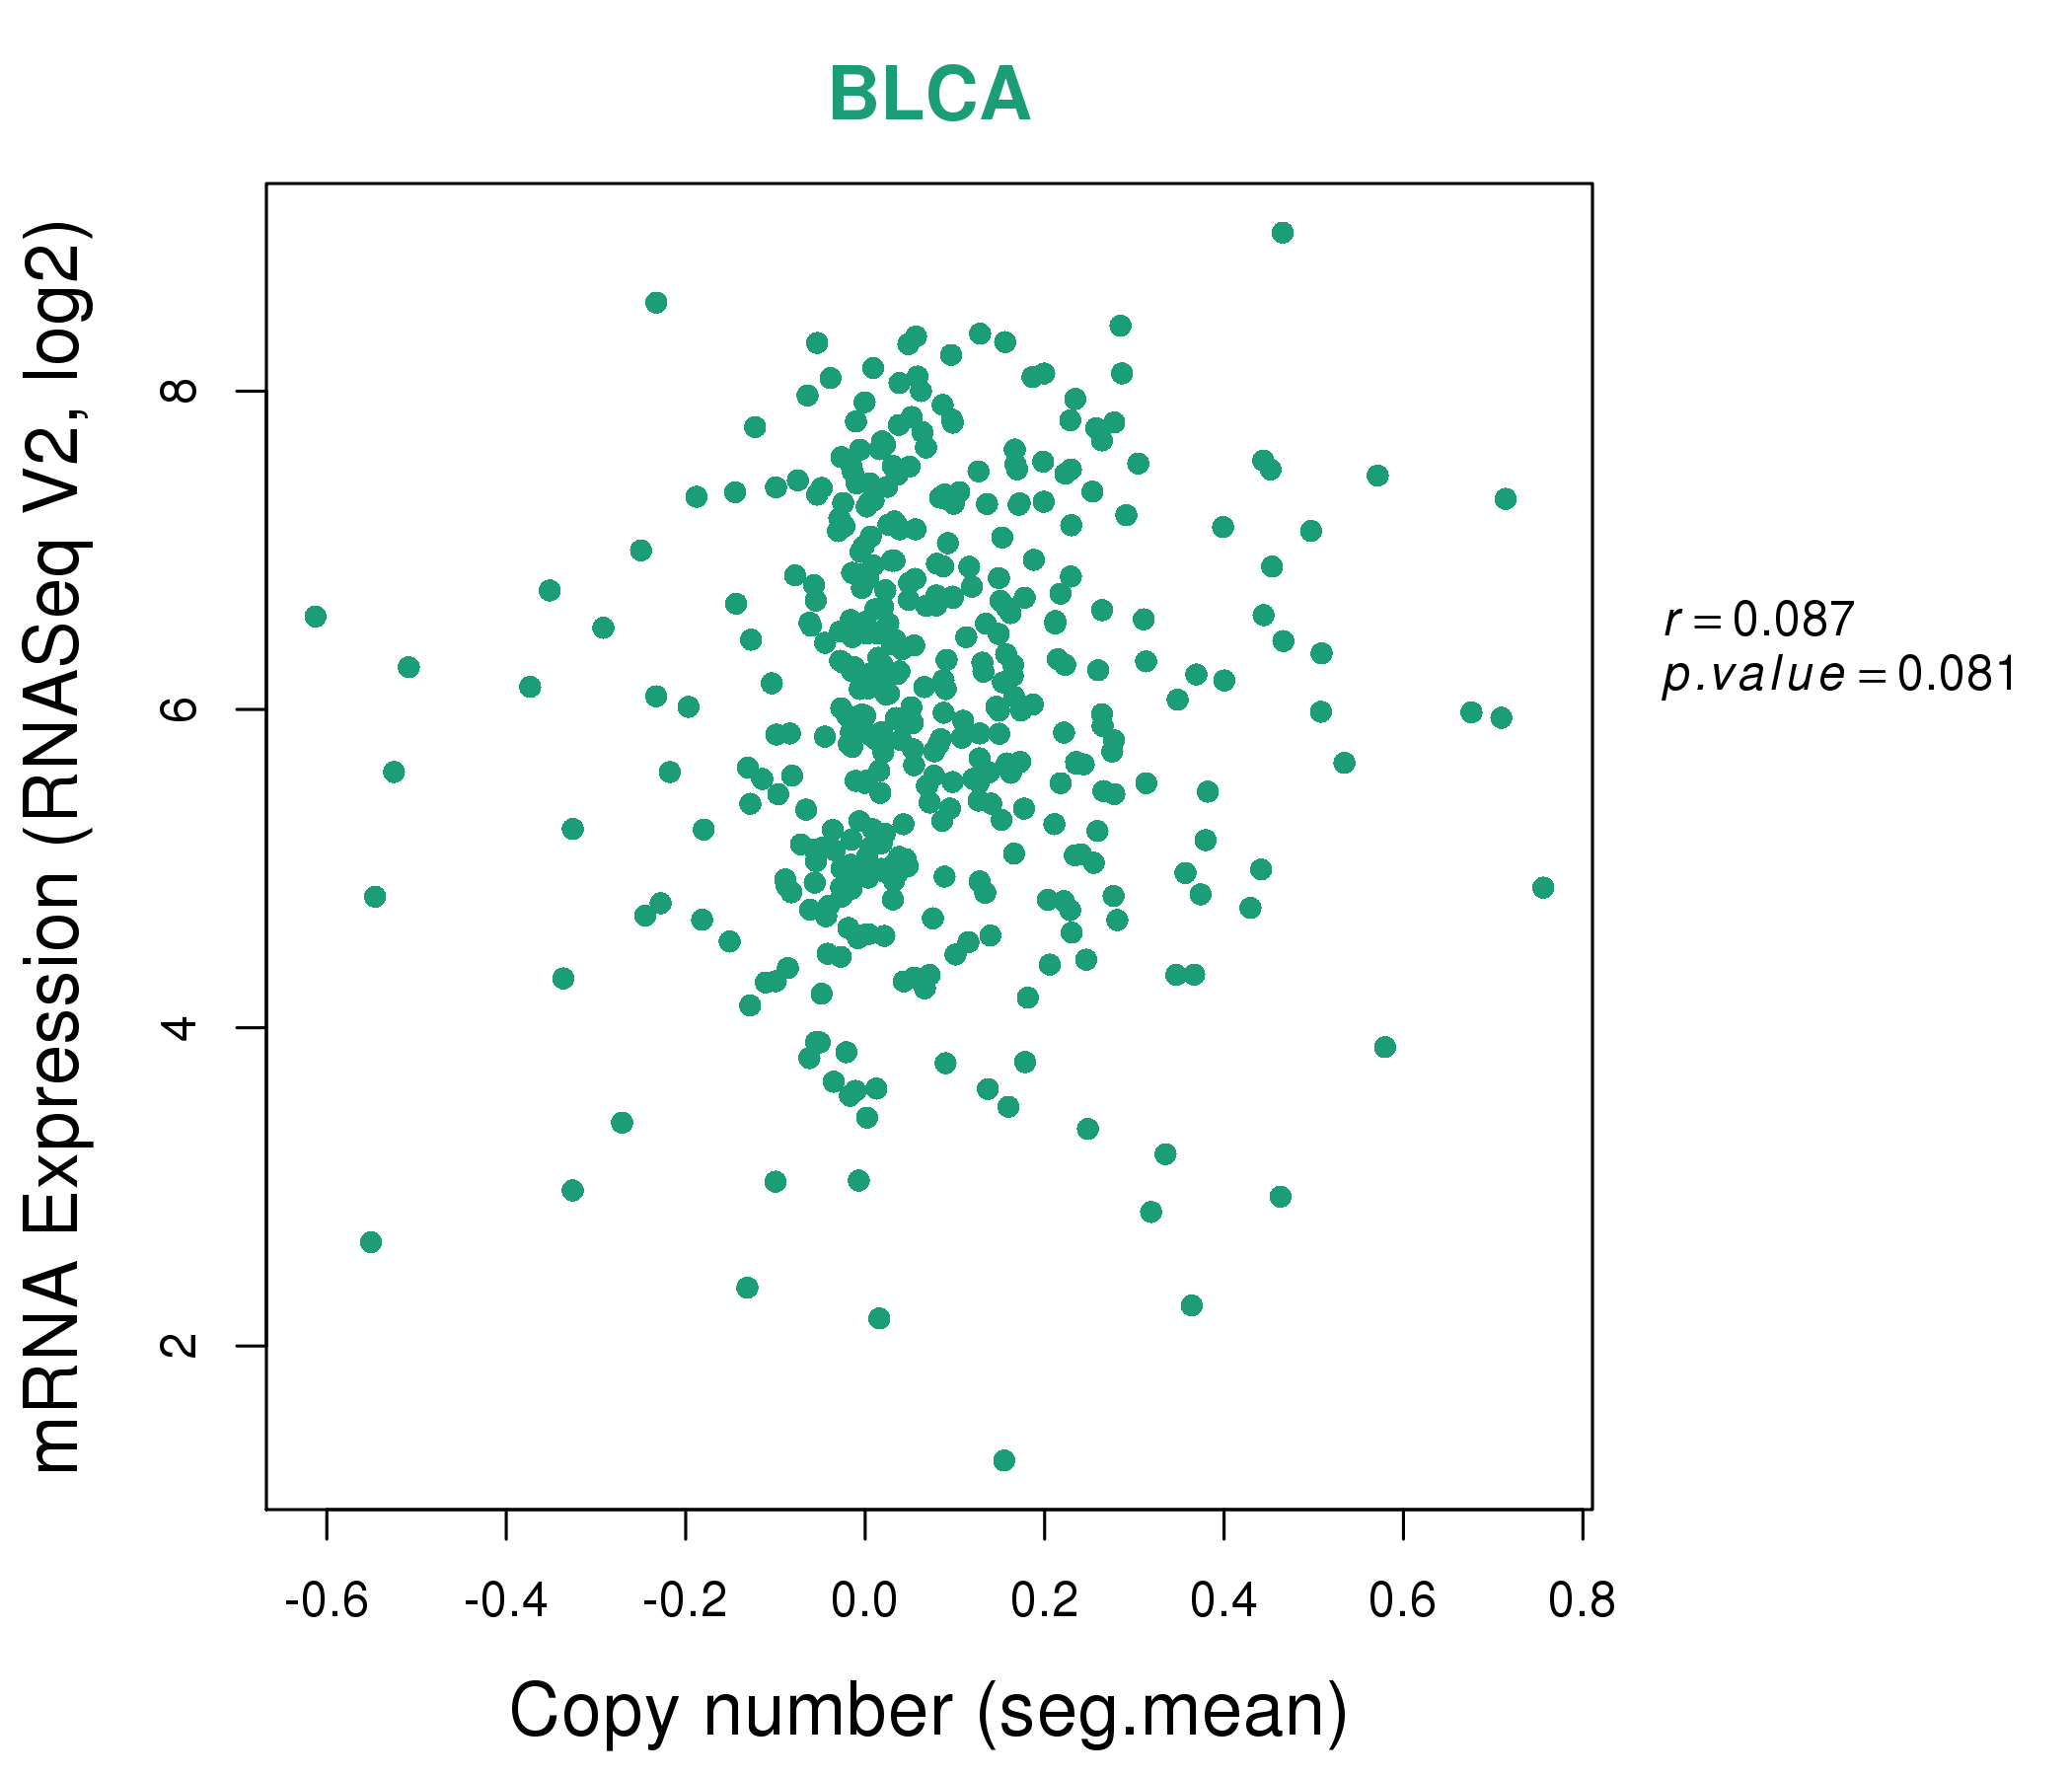
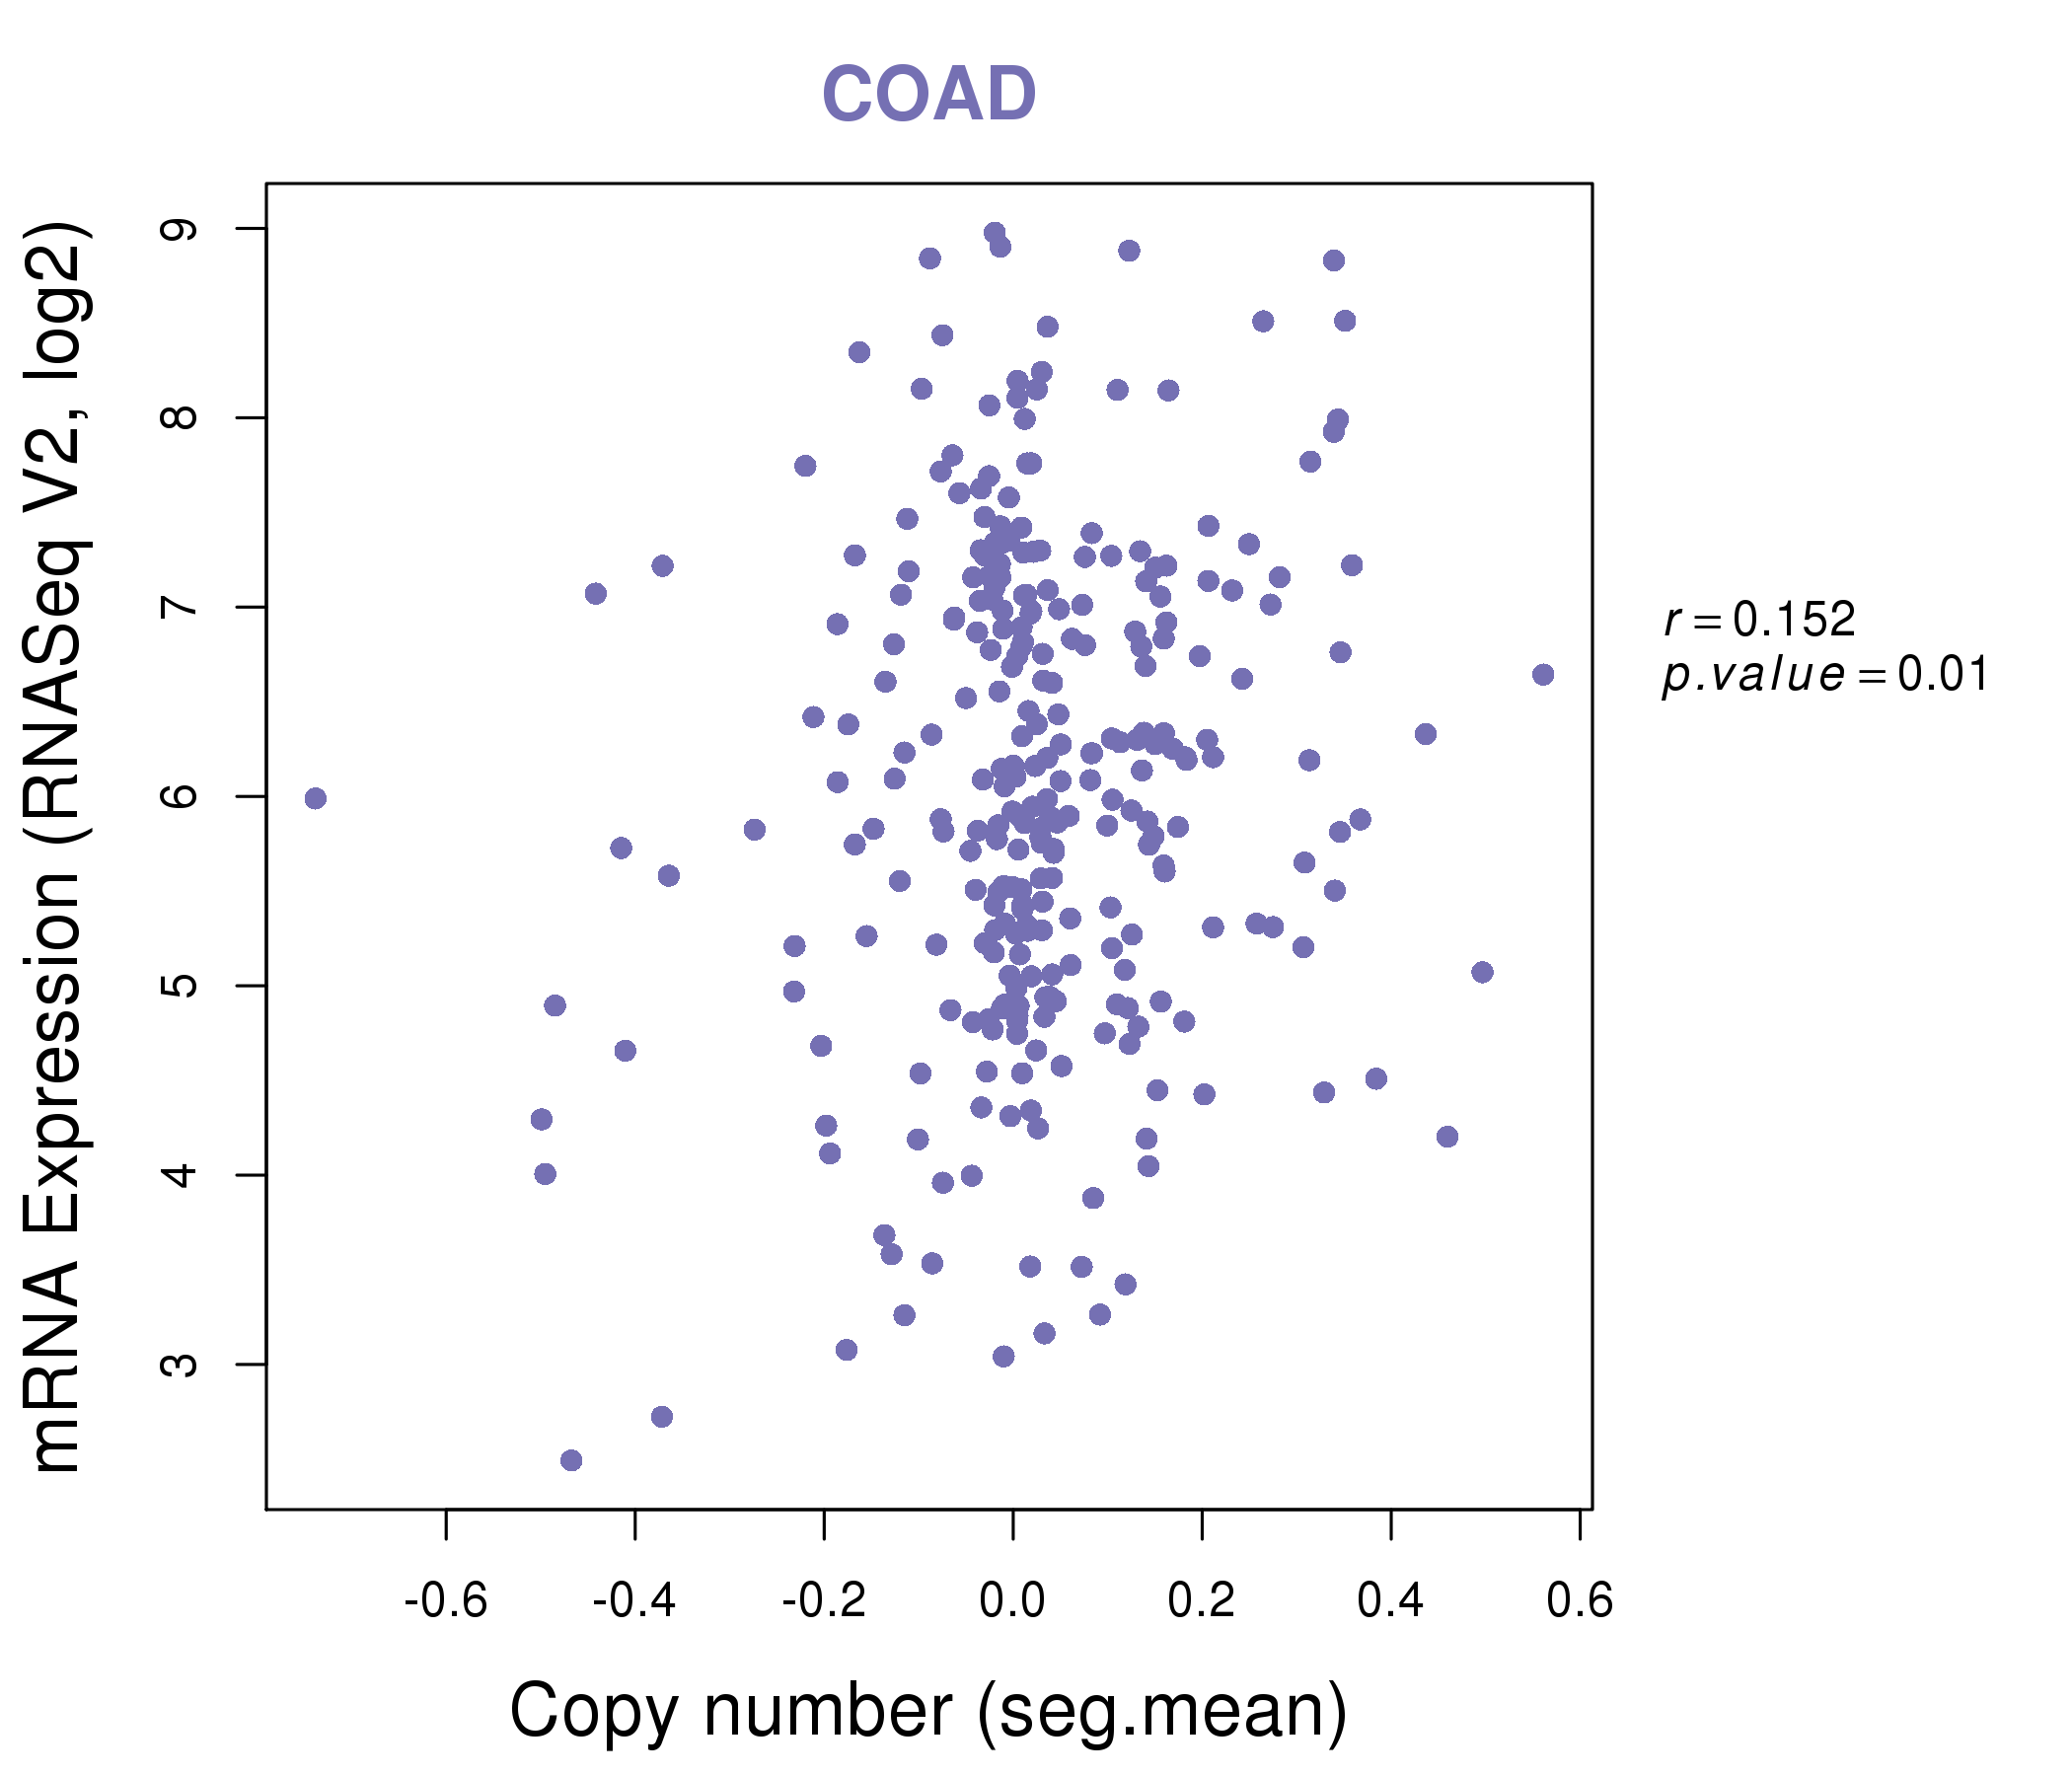
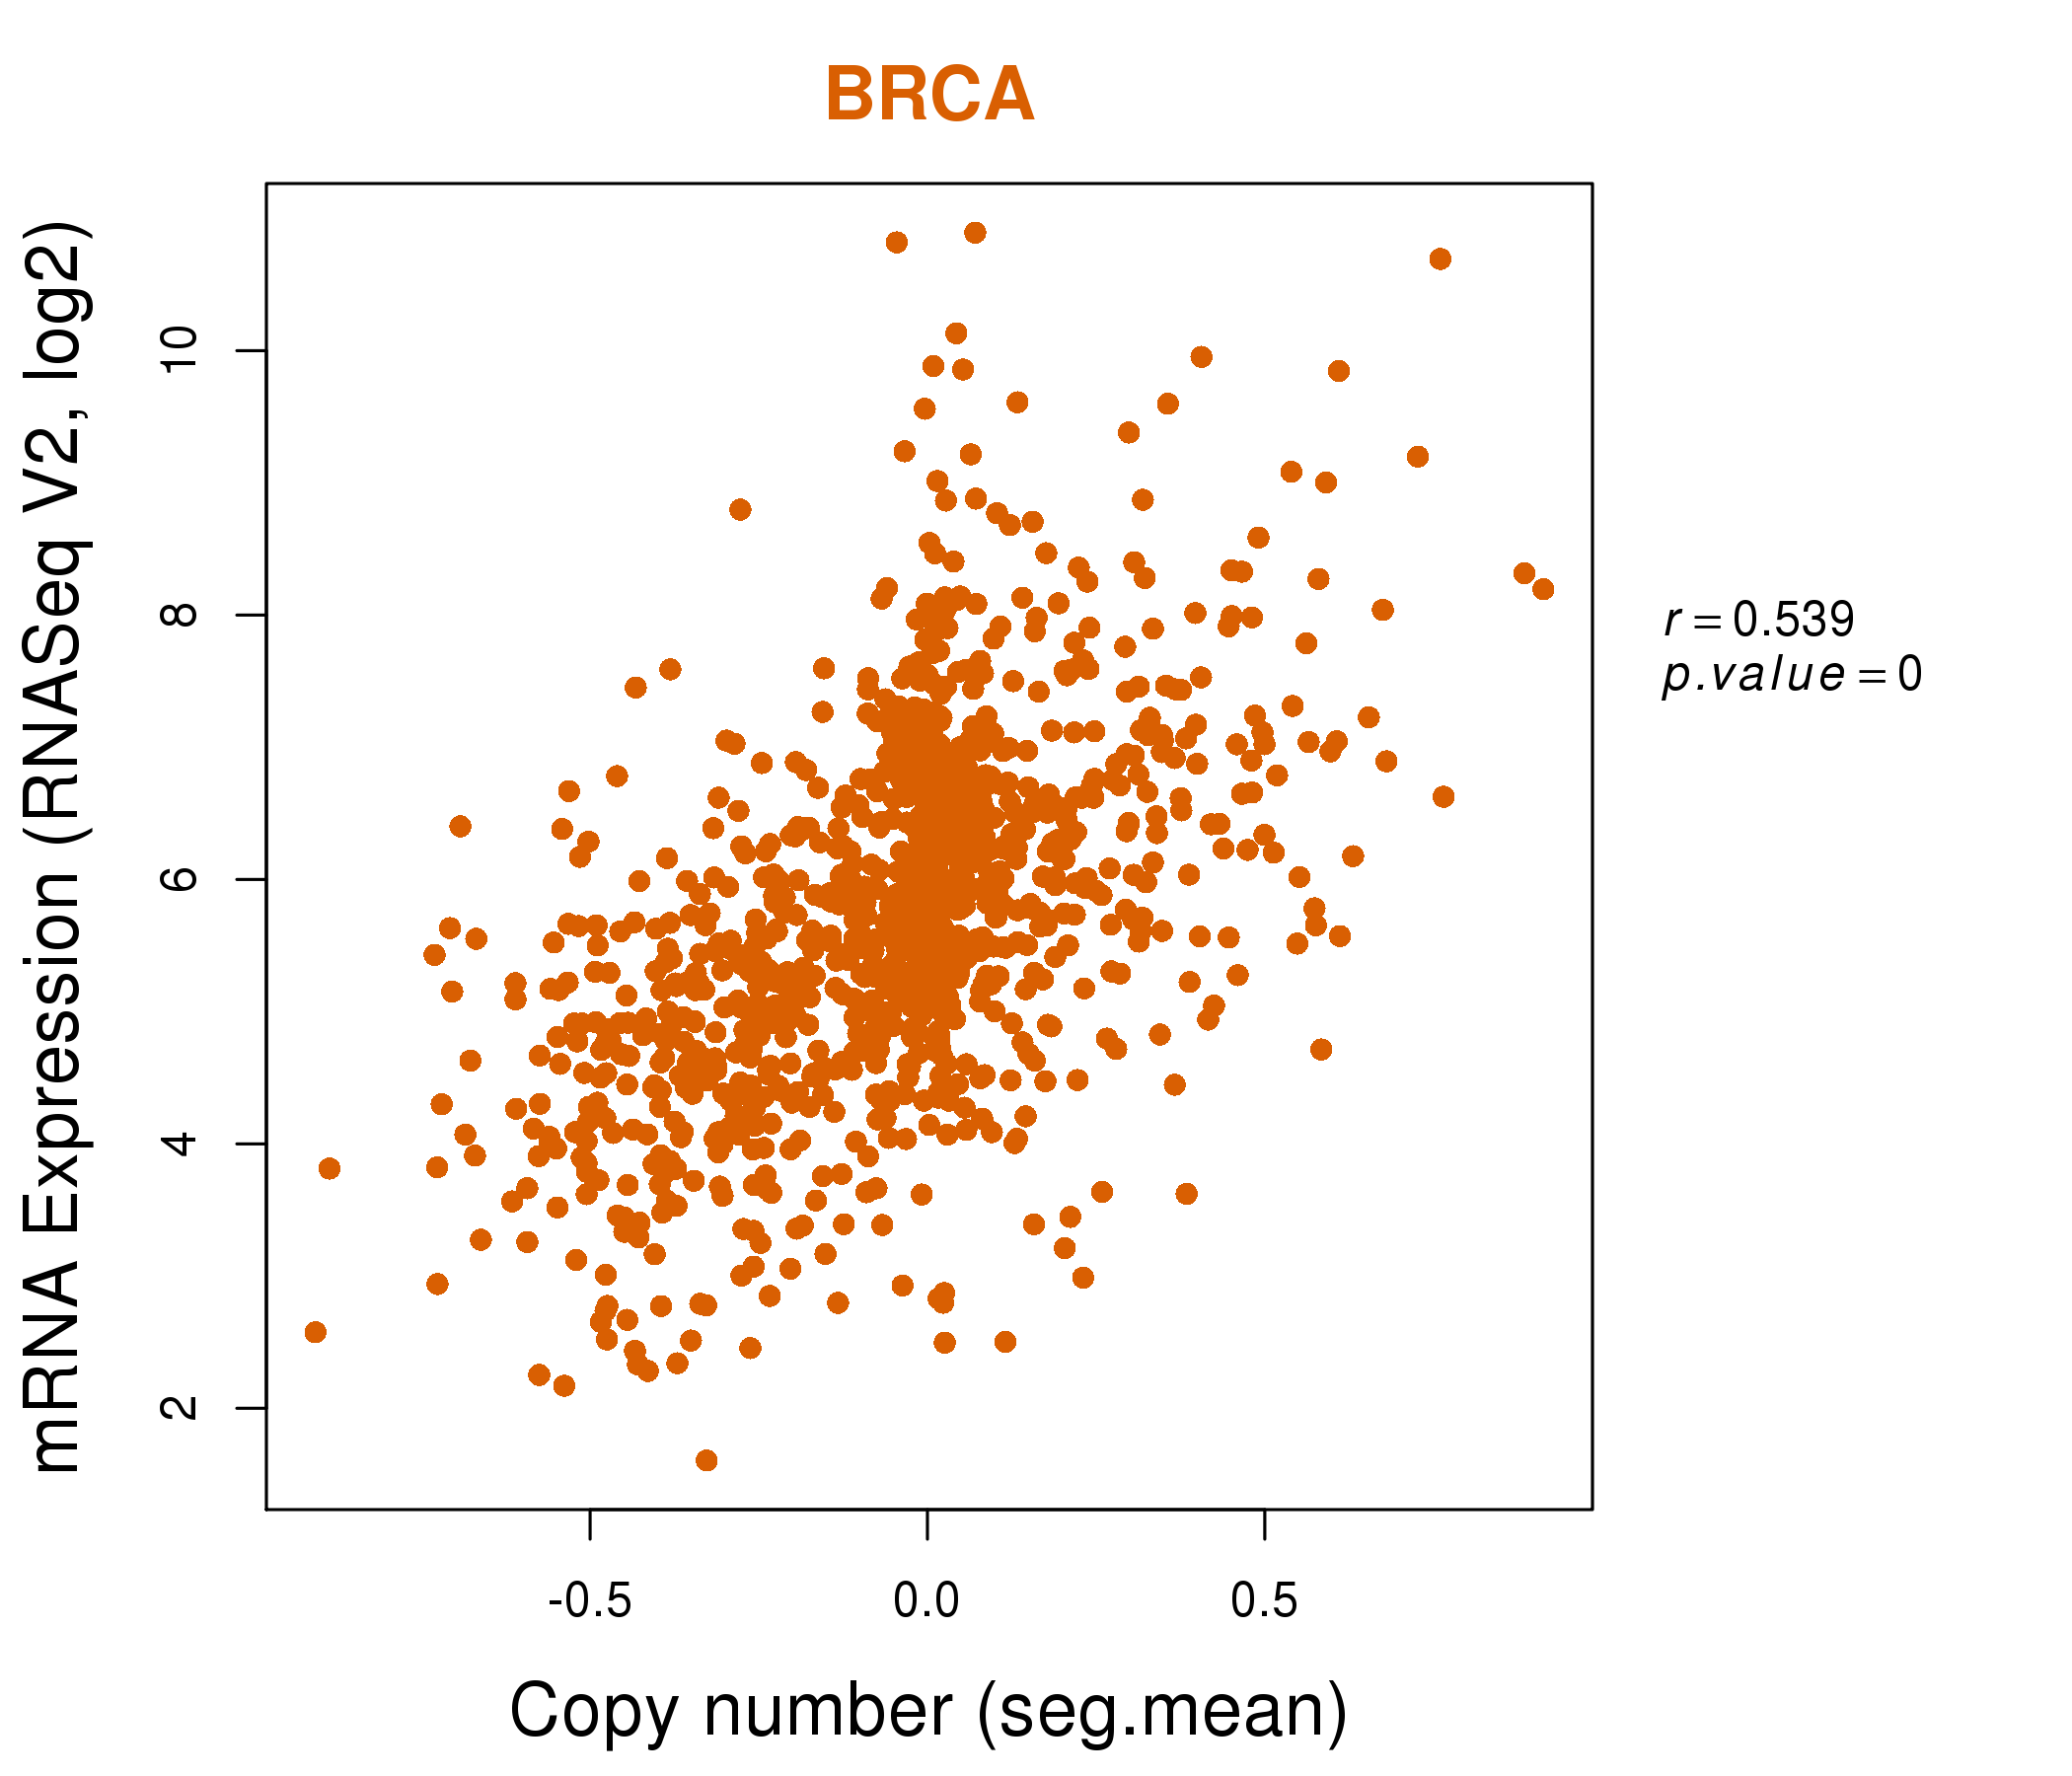
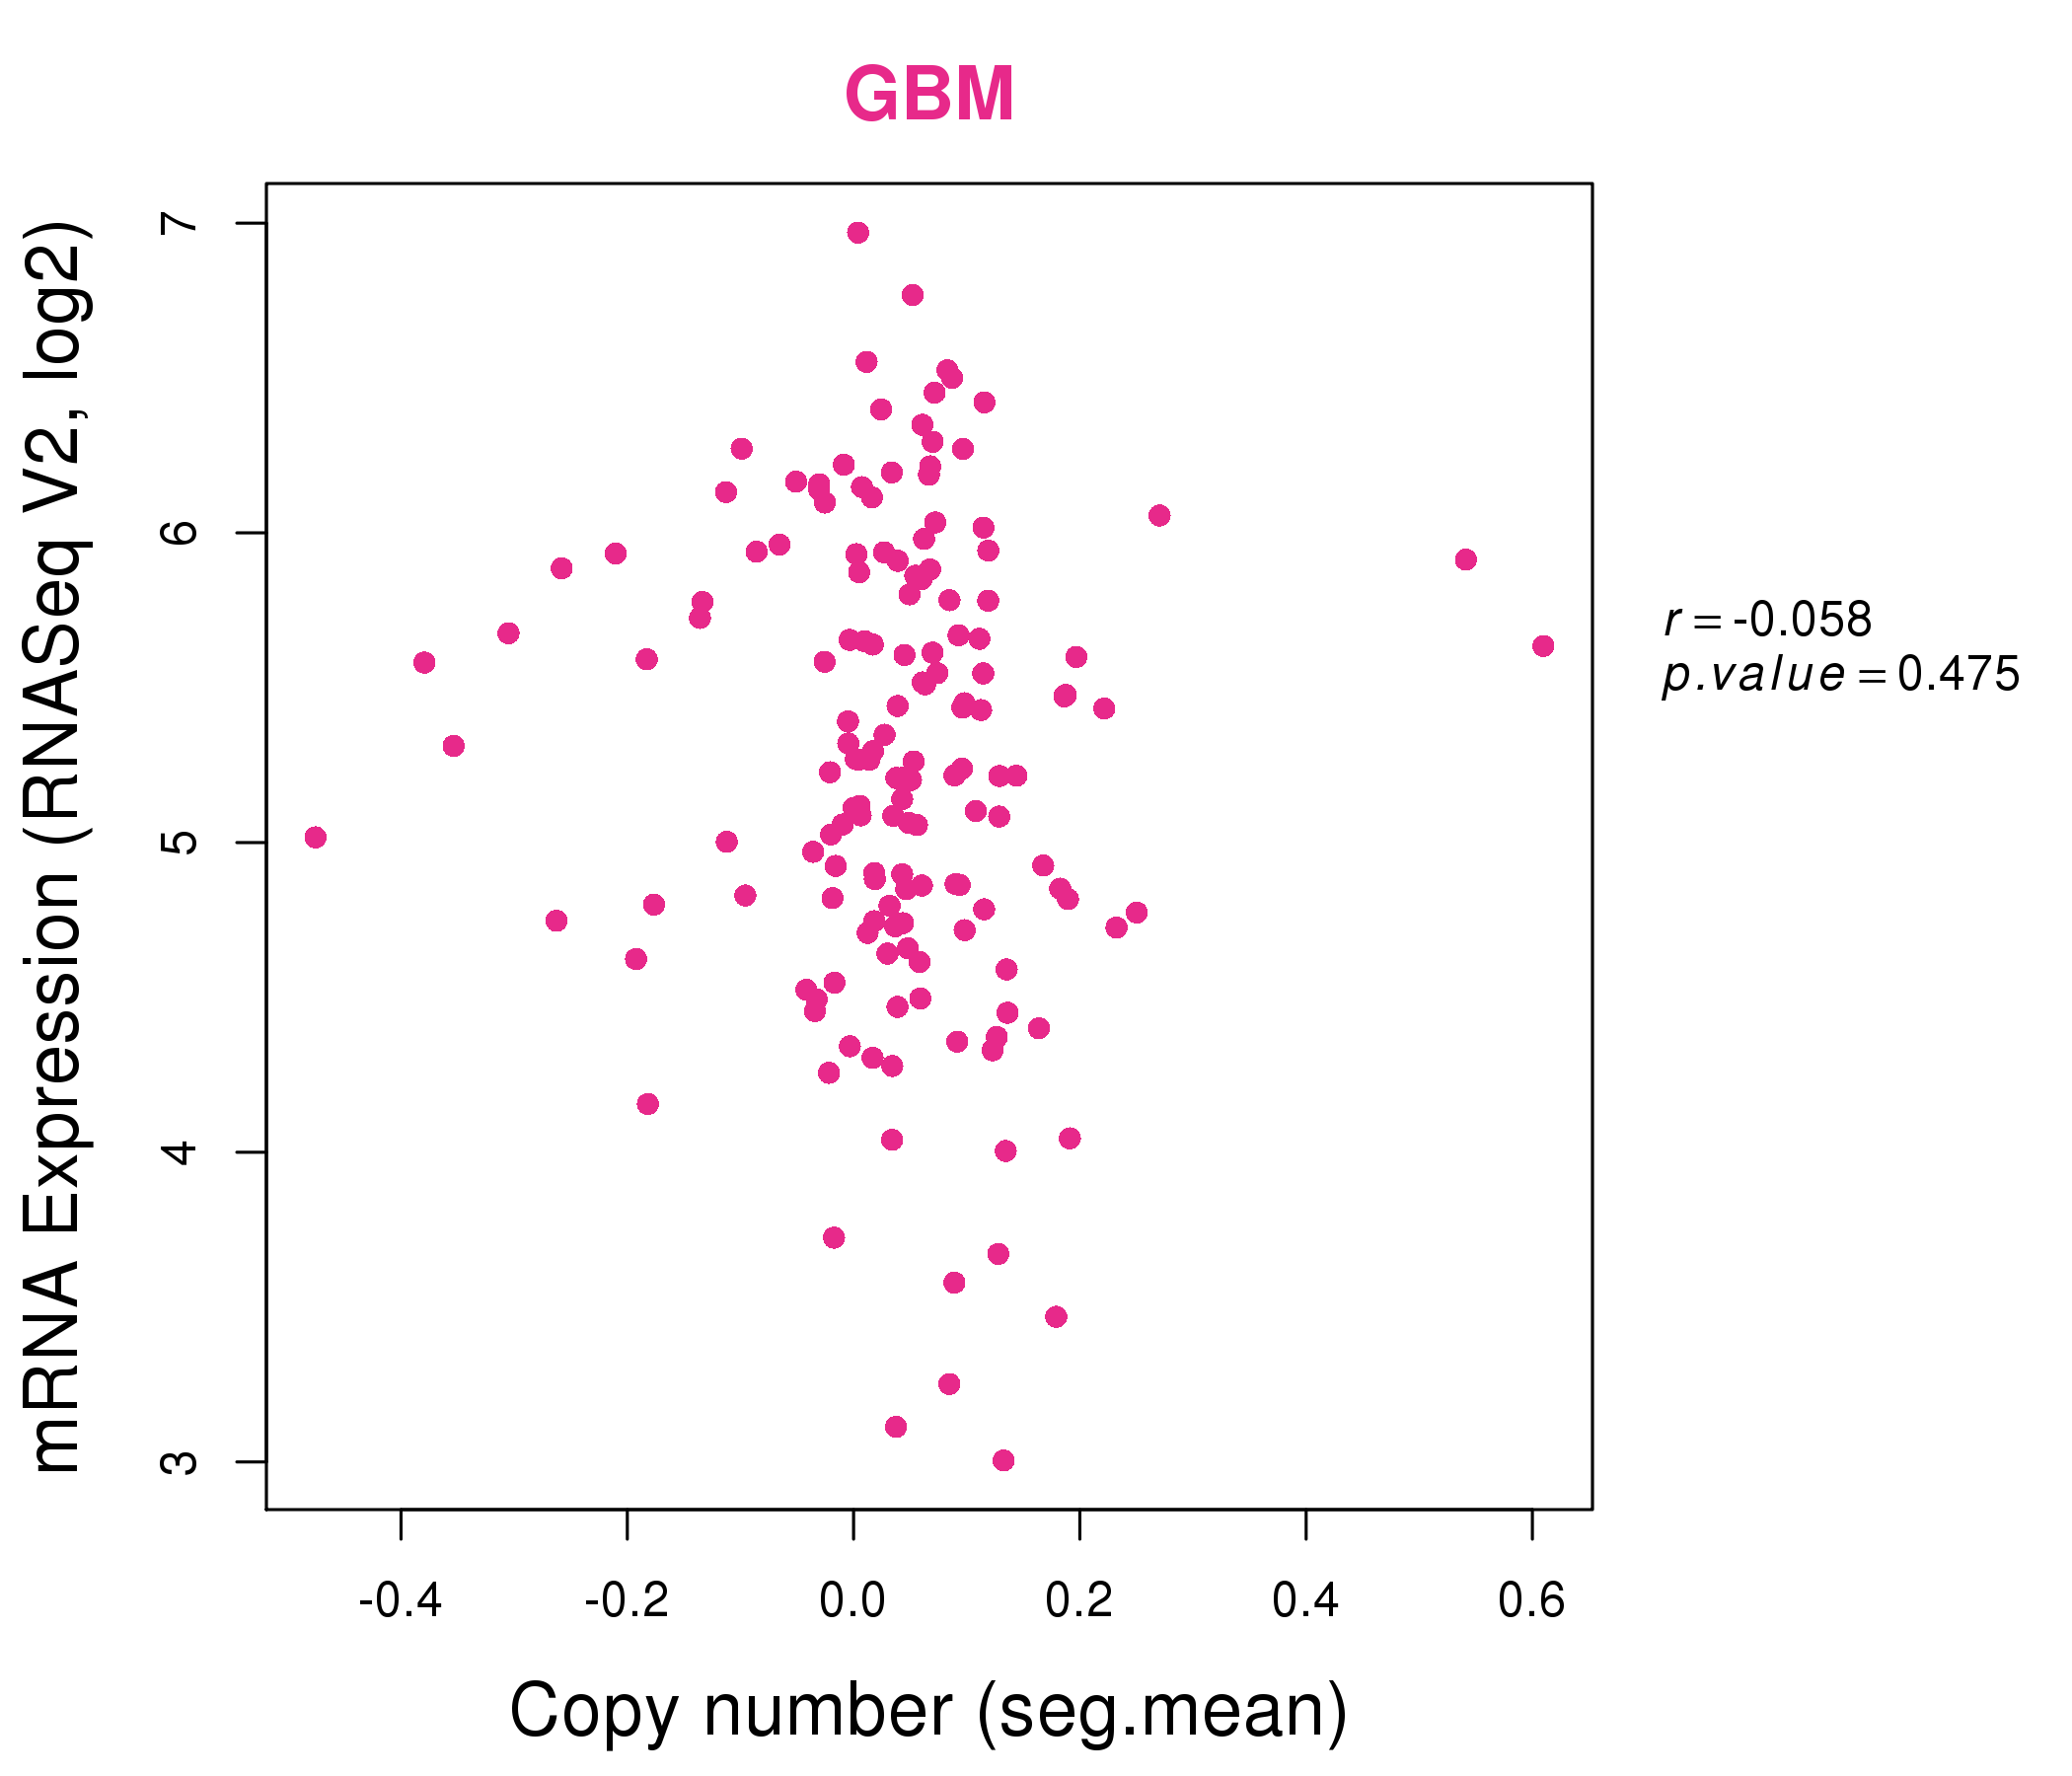
| * This plots show the correlation between CNV and gene expression. |
: Open all plots for all cancer types
 |
|
 |
|
| Top |
| Gene-Gene Network Information |
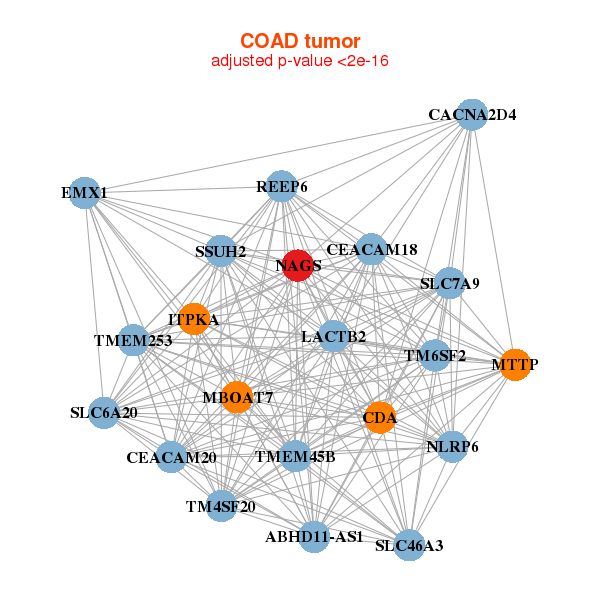
| * Co-Expression network figures were drawn using R package igraph. Only the top 20 genes with the highest correlations were shown. Red circle: input gene, orange circle: cell metabolism gene, sky circle: other gene |
: Open all plots for all cancer types
 |
| ||||
| C12orf60,ERLIN2,G6PC3,GABRA1,H2AFJ,NAGS,LINC00176, NPEPL1,RBMY1A3P,RBMY1E,RBMY1F,RBMY1J,RBMY2FP,RBMY3AP, SSTR1,TCEAL1,TCEAL3,TCEAL6,TMEM101,TSPY1,ZNF703 | BEX2,C10orf35,DDR1,EPHA1,FAAH2,GGT7,GLS2, HKR1,IP6K2,LYPD6B,MED29,MPP2,NAGS,PAK6, PRKCZ,PSD4,RAB17,SEMA4B,SH2D3A,TNK1,VSIG2 | ||||
 |
| ||||
| TMEM253,SSUH2,CACNA2D4,CDA,CEACAM18,CEACAM20,EMX1, ITPKA,LACTB2,MBOAT7,MTTP,NAGS,NLRP6,REEP6, SLC46A3,SLC6A20,SLC7A9,TM4SF20,TM6SF2,TMEM45B,ABHD11-AS1 | ALPI,ADIRF,TMEM253,CHN2,CYP2J2,DGAT1,FADS6, SLC52A1,HEBP1,MMEL1,NAGS,OIT3,PCK2,PGRMC2, PKLR,PLA2G12B,SLC15A1,SLC5A11,SLC6A19,TM4SF5,TMPRSS7 |
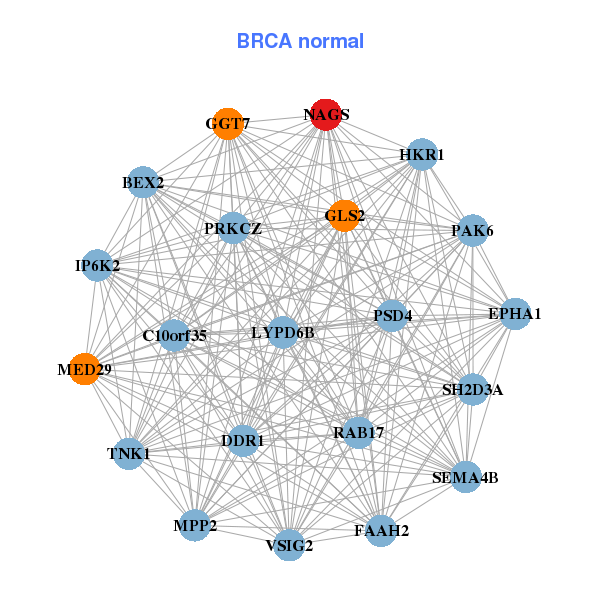
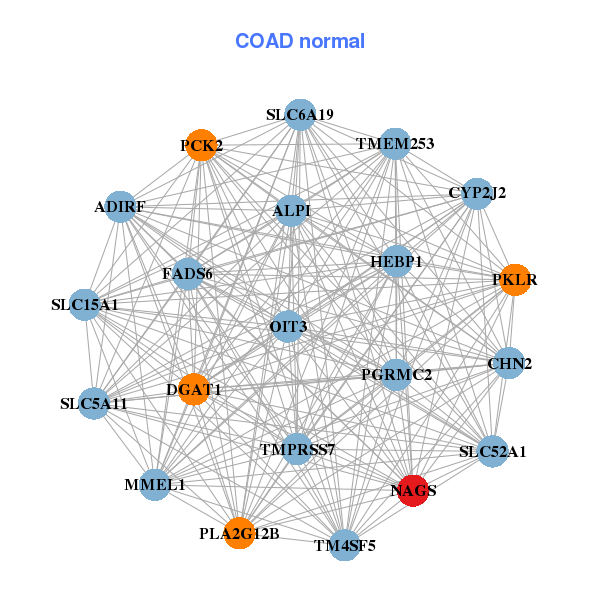
| * Co-Expression network figures were drawn using R package igraph. Only the top 20 genes with the highest correlations were shown. Red circle: input gene, orange circle: cell metabolism gene, sky circle: other gene |
: Open all plots for all cancer types
| Top |
: Open all interacting genes' information including KEGG pathway for all interacting genes from DAVID
| Top |
| Pharmacological Information for NAGS |
| DB Category | DB Name | DB's ID and Url link |
| * Gene Centered Interaction Network. |
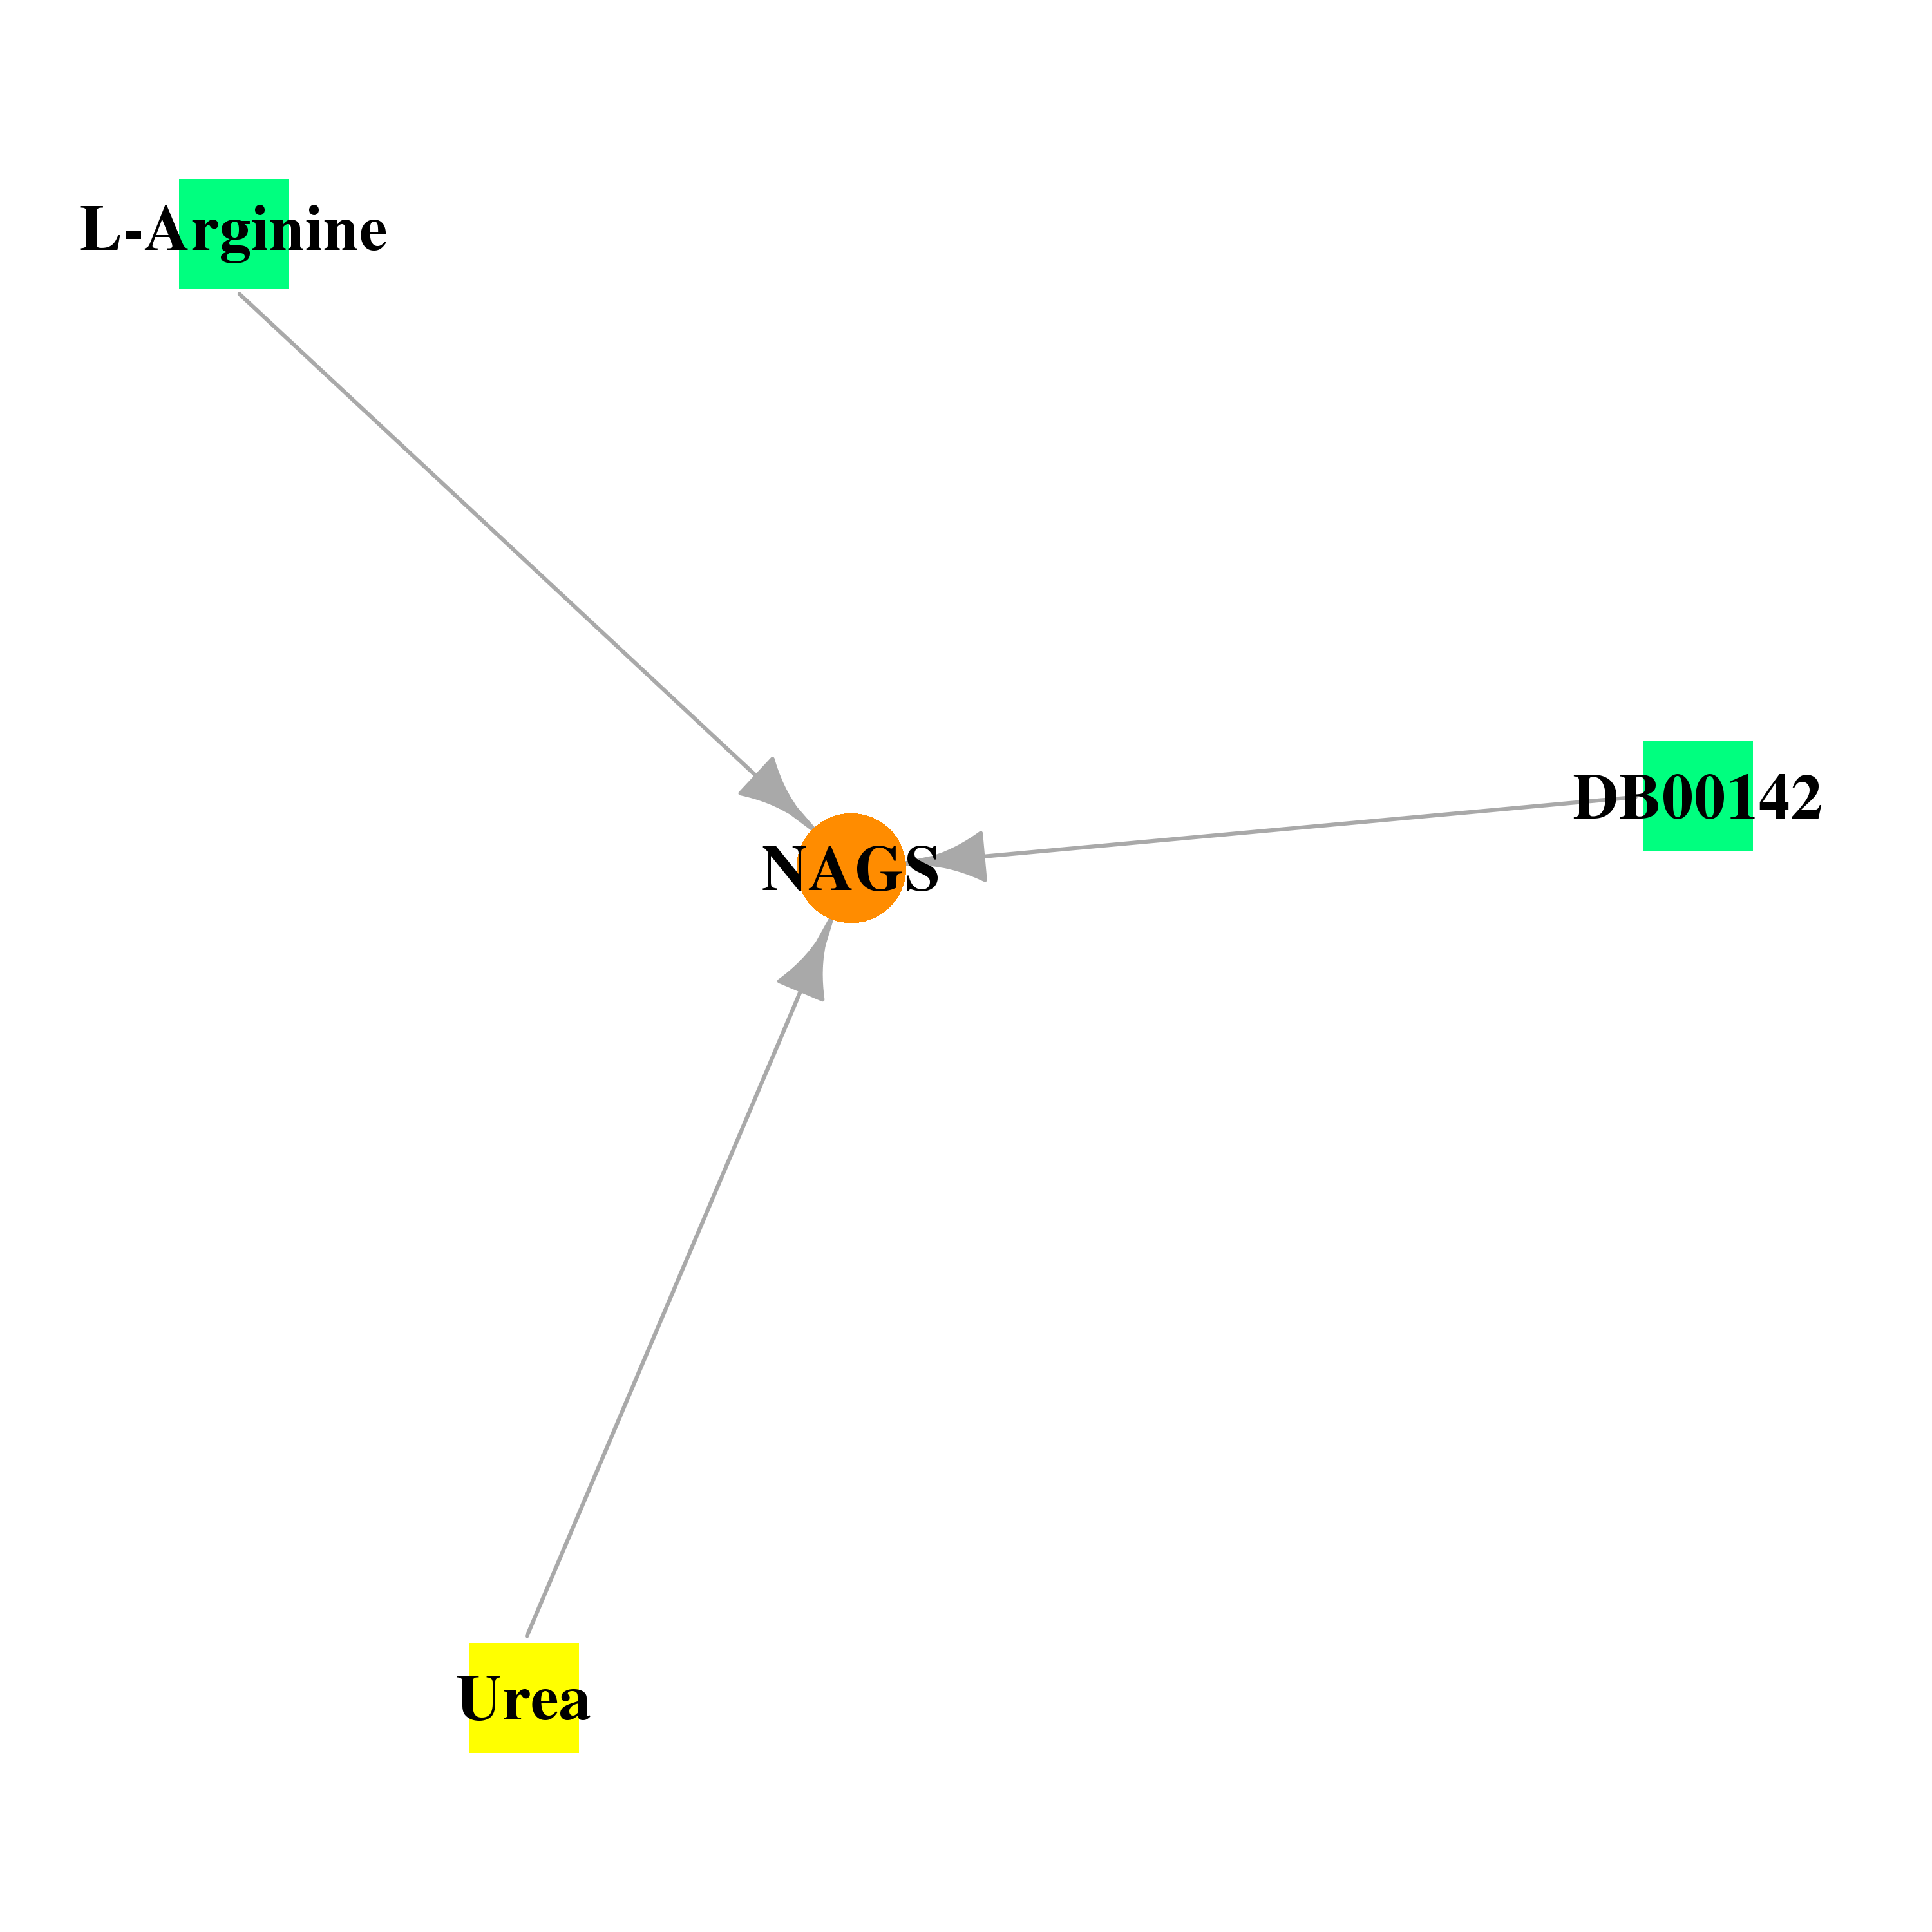 |
| * Drug Centered Interaction Network. |
| DrugBank ID | Target Name | Drug Groups | Generic Name | Drug Centered Network | Drug Structure |
| DB00142 | N-acetylglutamate synthase | approved; nutraceutical | L-Glutamic Acid | 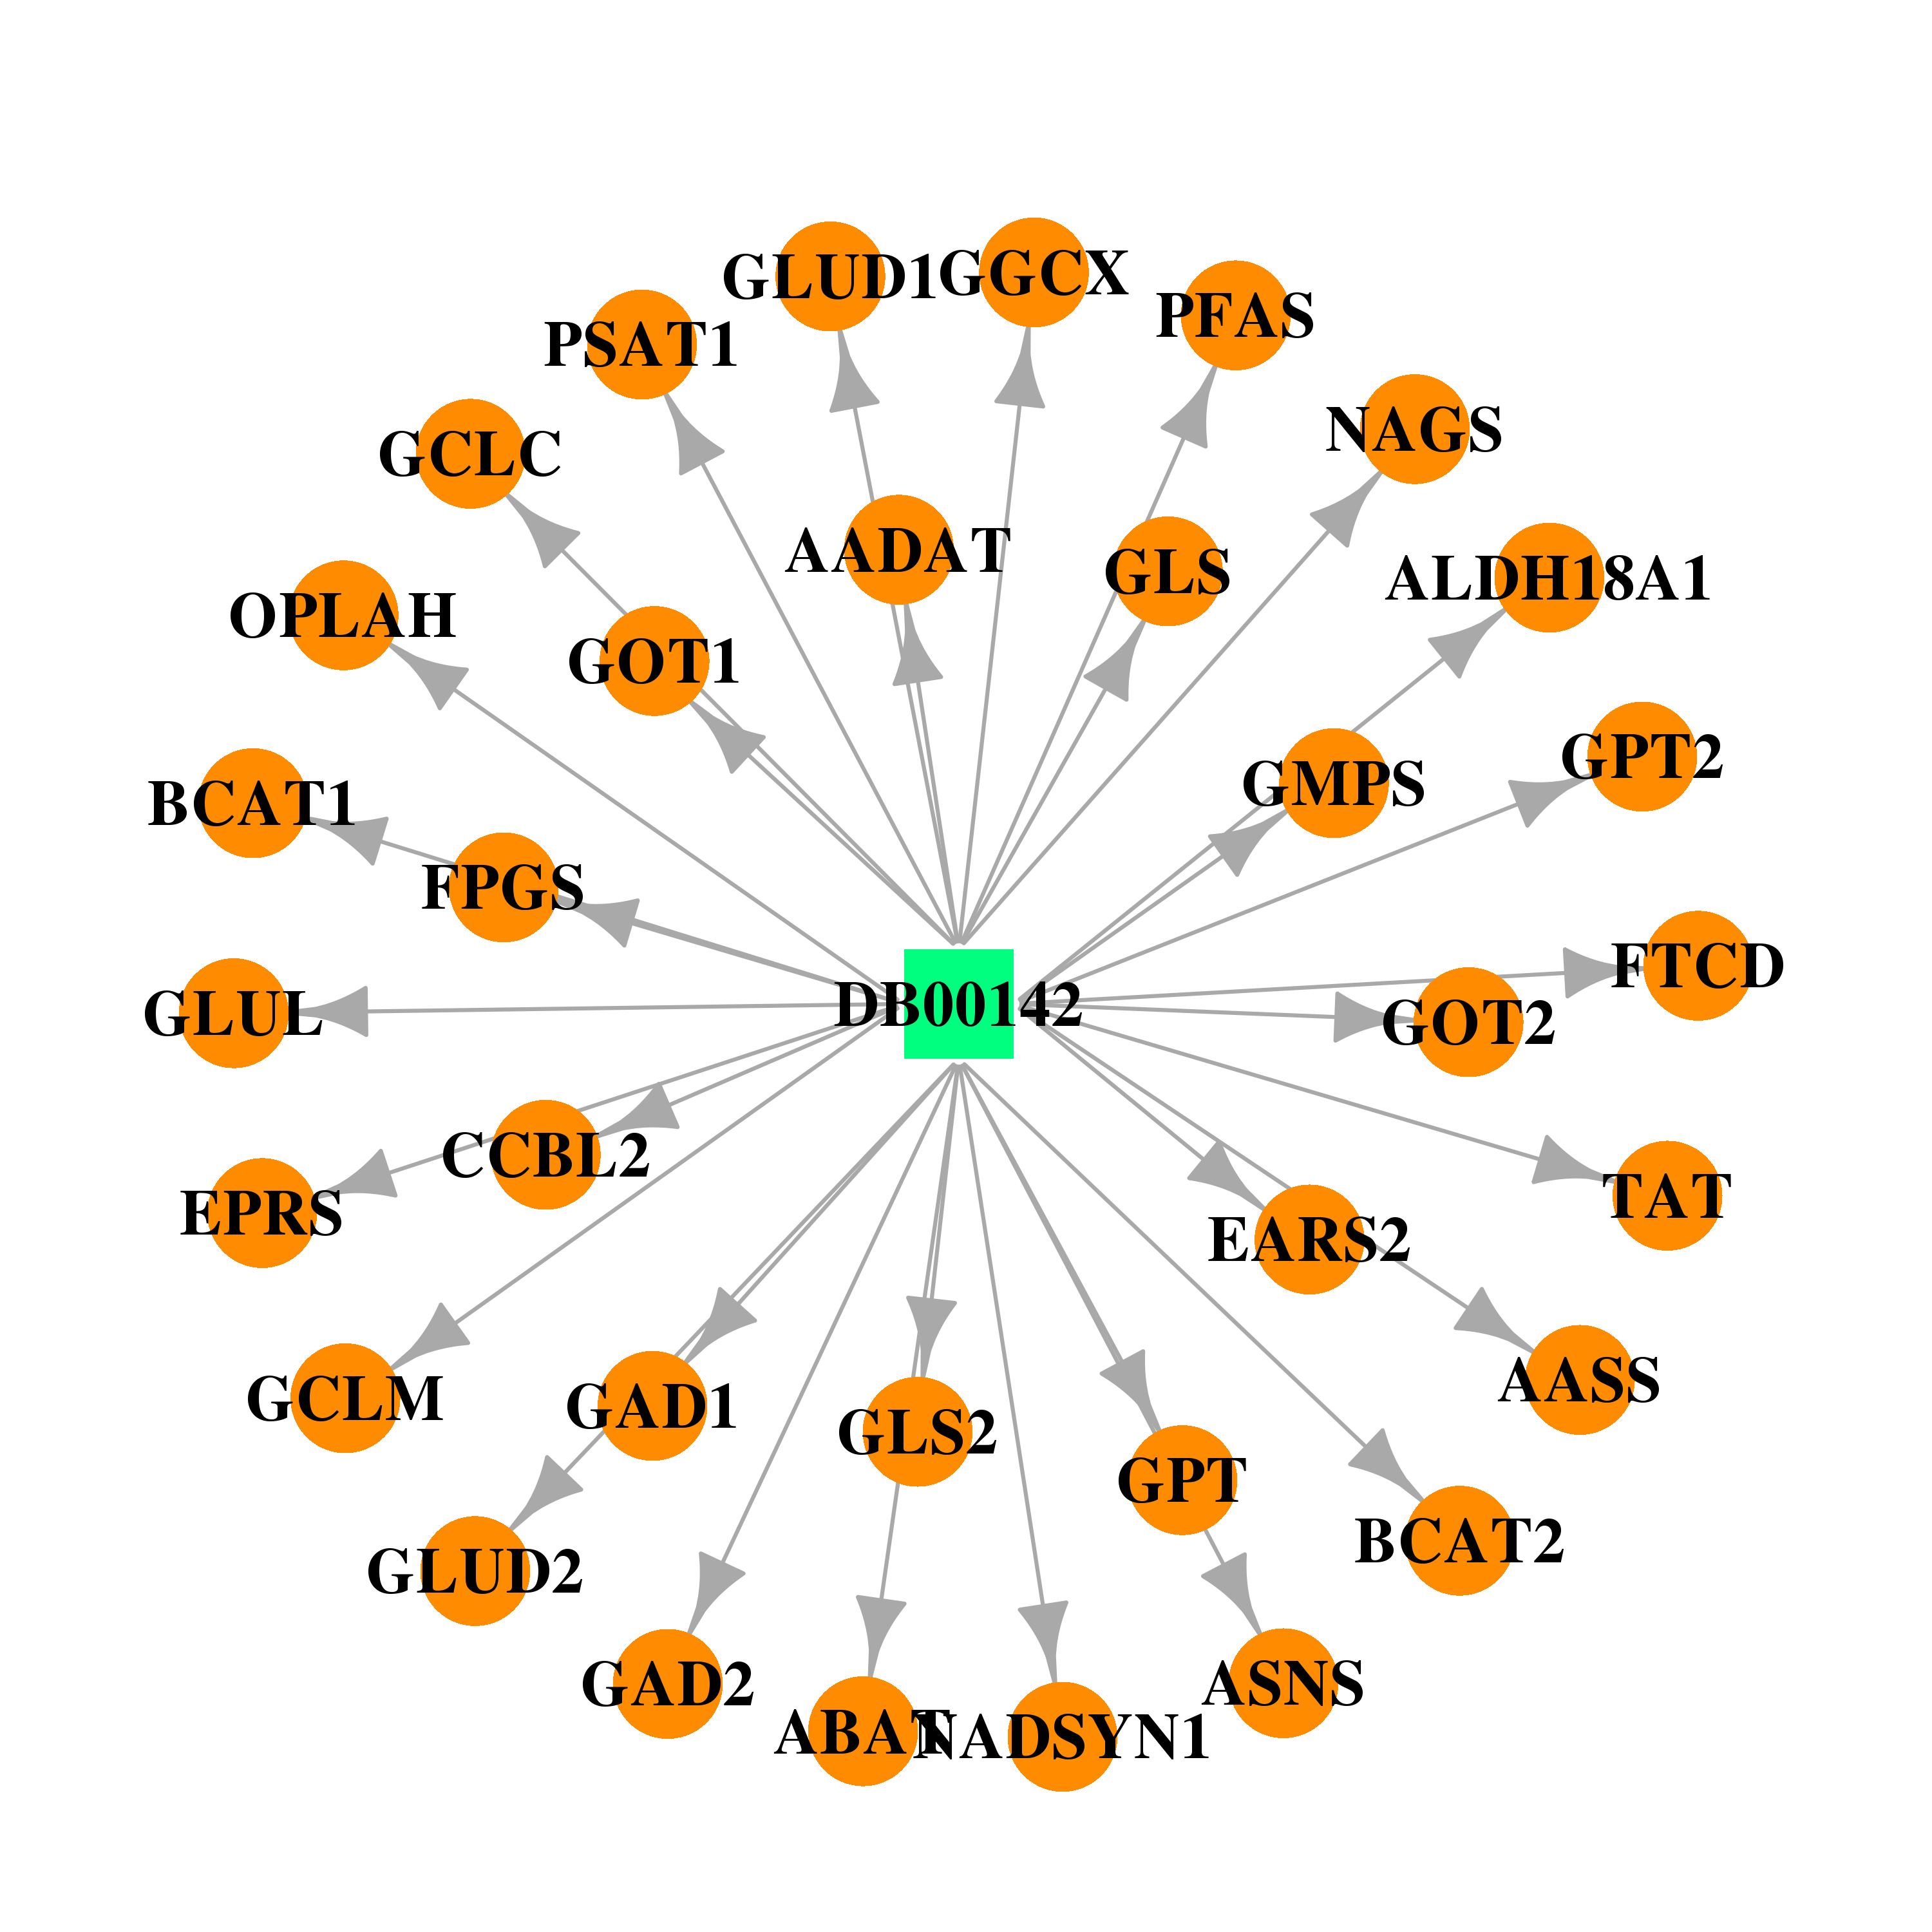 | 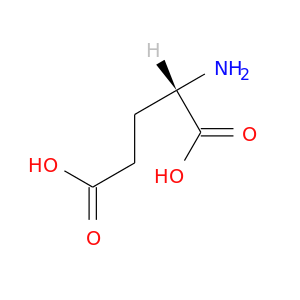 |
| DB00125 | N-acetylglutamate synthase | approved; nutraceutical | L-Arginine |  |  |
| DB03904 | N-acetylglutamate synthase | experimental | Urea |  | 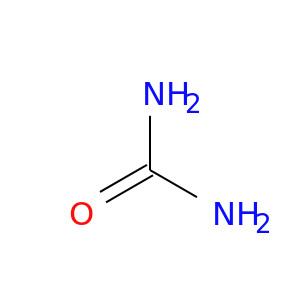 |
| Top |
| Cross referenced IDs for NAGS |
| * We obtained these cross-references from Uniprot database. It covers 150 different DBs, 18 categories. http://www.uniprot.org/help/cross_references_section |
: Open all cross reference information
|
Copyright © 2016-Present - The Univsersity of Texas Health Science Center at Houston @ |