|
||||||||||||||||||||
| |
| Phenotypic Information (metabolism pathway, cancer, disease, phenome) |
| |
| |
| Gene-Gene Network Information: Co-Expression Network, Interacting Genes & KEGG |
| |
|


| Gene Summary for DBT |
| Basic gene info. | Gene symbol | DBT |
| Gene name | dihydrolipoamide branched chain transacylase E2 | |
| Synonyms | BCATE2|BCKAD-E2|BCKADE2|E2|E2B | |
| Cytomap | UCSC genome browser: 1p31 | |
| Genomic location | chr1 :100652477-100715409 | |
| Type of gene | protein-coding | |
| RefGenes | NM_001918.3, | |
| Ensembl id | ENSG00000137992 | |
| Description | BCKAD E2 subunitE2 component of branched chain alpha-keto acid dehydrogenase complexbranched chain acyltransferase, E2 componentbranched-chain alpha-keto acid dehydrogenase complex component E2dihydrolipoamide acetyltransferase component of branched-c | |
| Modification date | 20141219 | |
| dbXrefs | MIM : 248610 | |
| HGNC : HGNC | ||
| Ensembl : ENSG00000137992 | ||
| HPRD : 02010 | ||
| Vega : OTTHUMG00000010921 | ||
| Protein | UniProt: go to UniProt's Cross Reference DB Table | |
| Expression | CleanEX: HS_DBT | |
| BioGPS: 1629 | ||
| Gene Expression Atlas: ENSG00000137992 | ||
| The Human Protein Atlas: ENSG00000137992 | ||
| Pathway | NCI Pathway Interaction Database: DBT | |
| KEGG: DBT | ||
| REACTOME: DBT | ||
| ConsensusPathDB | ||
| Pathway Commons: DBT | ||
| Metabolism | MetaCyc: DBT | |
| HUMANCyc: DBT | ||
| Regulation | Ensembl's Regulation: ENSG00000137992 | |
| miRBase: chr1 :100,652,477-100,715,409 | ||
| TargetScan: NM_001918 | ||
| cisRED: ENSG00000137992 | ||
| Context | iHOP: DBT | |
| cancer metabolism search in PubMed: DBT | ||
| UCL Cancer Institute: DBT | ||
| Assigned class in ccmGDB | C | |
| Top |
| Phenotypic Information for DBT(metabolism pathway, cancer, disease, phenome) |
| Cancer | CGAP: DBT |
| Familial Cancer Database: DBT | |
| * This gene is included in those cancer gene databases. |
|
|
|
|
|
|
| ||||||||||||||
Oncogene 1 | Significant driver gene in | |||||||||||||||||||
| cf) number; DB name 1 Oncogene; http://nar.oxfordjournals.org/content/35/suppl_1/D721.long, 2 Tumor Suppressor gene; https://bioinfo.uth.edu/TSGene/, 3 Cancer Gene Census; http://www.nature.com/nrc/journal/v4/n3/abs/nrc1299.html, 4 CancerGenes; http://nar.oxfordjournals.org/content/35/suppl_1/D721.long, 5 Network of Cancer Gene; http://ncg.kcl.ac.uk/index.php, 1Therapeutic Vulnerabilities in Cancer; http://cbio.mskcc.org/cancergenomics/statius/ |
| REACTOME_METABOLISM_OF_AMINO_ACIDS_AND_DERIVATIVES | |
| OMIM | |
| Orphanet | |
| Disease | KEGG Disease: DBT |
| MedGen: DBT (Human Medical Genetics with Condition) | |
| ClinVar: DBT | |
| Phenotype | MGI: DBT (International Mouse Phenotyping Consortium) |
| PhenomicDB: DBT | |
| Mutations for DBT |
| * Under tables are showing count per each tissue to give us broad intuition about tissue specific mutation patterns.You can go to the detailed page for each mutation database's web site. |
| - Statistics for Tissue and Mutation type | Top |
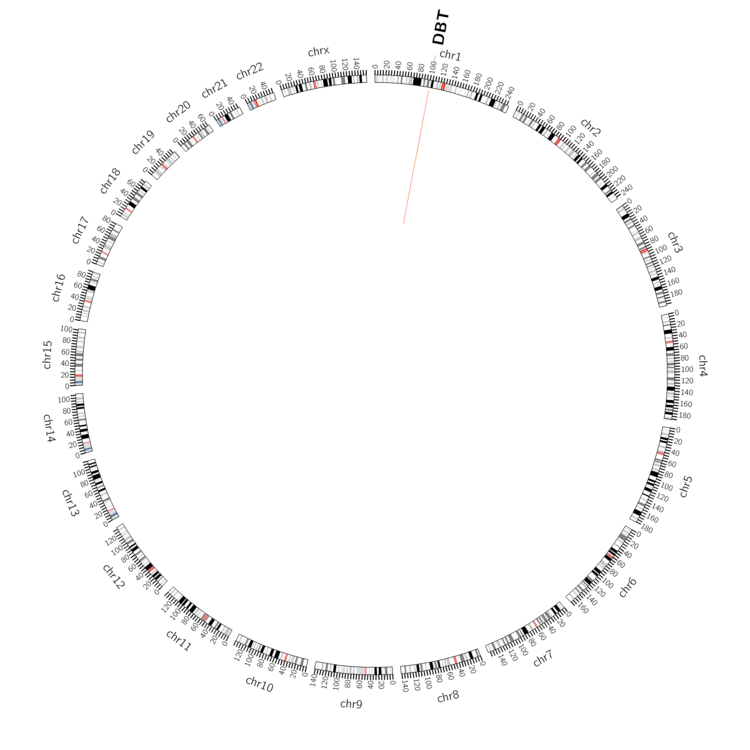 |
| - For Inter-chromosomal Variations |
| There's no inter-chromosomal structural variation. |
| - For Intra-chromosomal Variations |
| * Intra-chromosomal variantions includes 'intrachromosomal amplicon to amplicon', 'intrachromosomal amplicon to non-amplified dna', 'intrachromosomal deletion', 'intrachromosomal fold-back inversion', 'intrachromosomal inversion', 'intrachromosomal tandem duplication', 'Intrachromosomal unknown type', 'intrachromosomal with inverted orientation', 'intrachromosomal with non-inverted orientation'. |
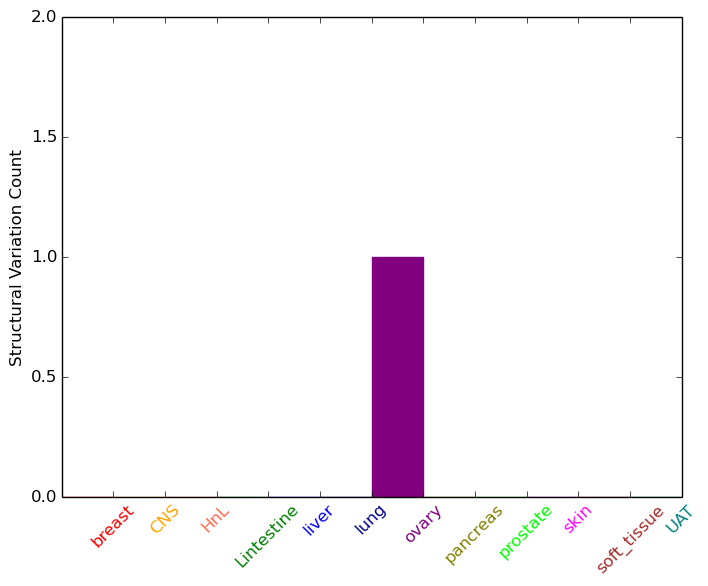 |
| Sample | Symbol_a | Chr_a | Start_a | End_a | Symbol_b | Chr_b | Start_b | End_b |
| ovary | DBT | chr1 | 100685748 | 100685768 | DBT | chr1 | 100675421 | 100675441 |
| cf) Tissue number; Tissue name (1;Breast, 2;Central_nervous_system, 3;Haematopoietic_and_lymphoid_tissue, 4;Large_intestine, 5;Liver, 6;Lung, 7;Ovary, 8;Pancreas, 9;Prostate, 10;Skin, 11;Soft_tissue, 12;Upper_aerodigestive_tract) |
| * From mRNA Sanger sequences, Chitars2.0 arranged chimeric transcripts. This table shows DBT related fusion information. |
| ID | Head Gene | Tail Gene | Accession | Gene_a | qStart_a | qEnd_a | Chromosome_a | tStart_a | tEnd_a | Gene_a | qStart_a | qEnd_a | Chromosome_a | tStart_a | tEnd_a |
| BE832547 | HLA-DMA | 261 | 295 | 6 | 32918651 | 32918685 | DBT | 287 | 398 | 1 | 100661530 | 100661644 | |
| AI432188 | STIM1 | 198 | 277 | 11 | 3925156 | 3925235 | DBT | 274 | 413 | 1 | 100660264 | 100660403 | |
| Top |
| There's no copy number variation information in COSMIC data for this gene. |
| Top |
|
 |
| Top |
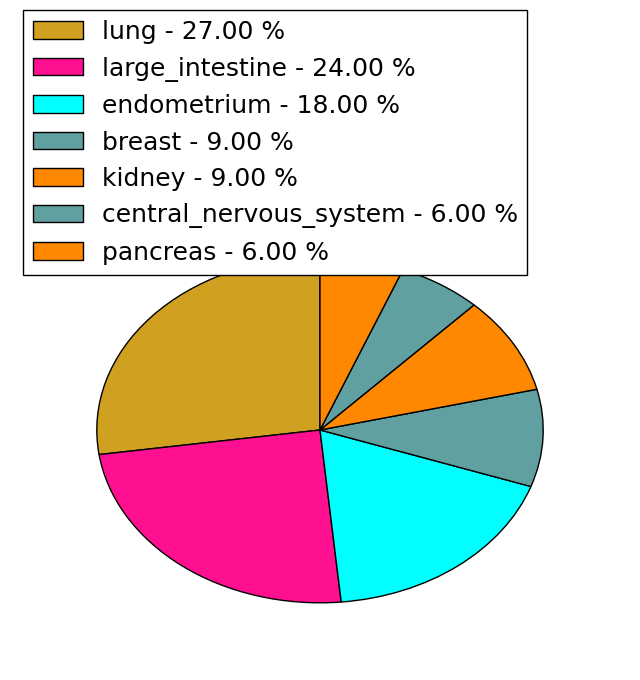
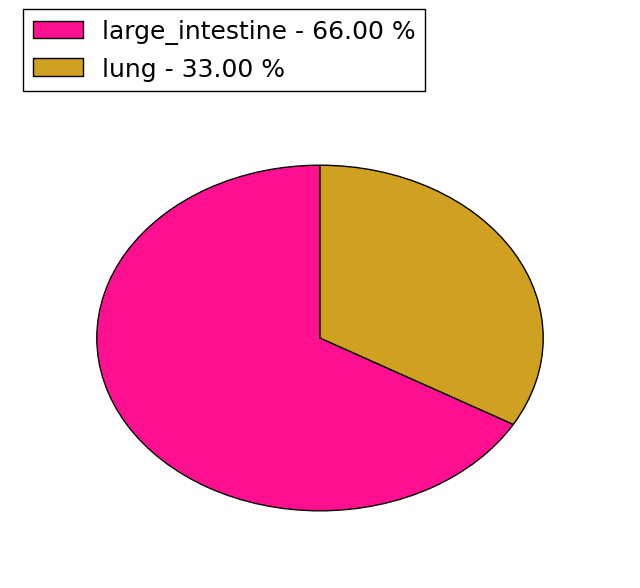
| Stat. for Non-Synonymous SNVs (# total SNVs=33) | (# total SNVs=6) |
 | 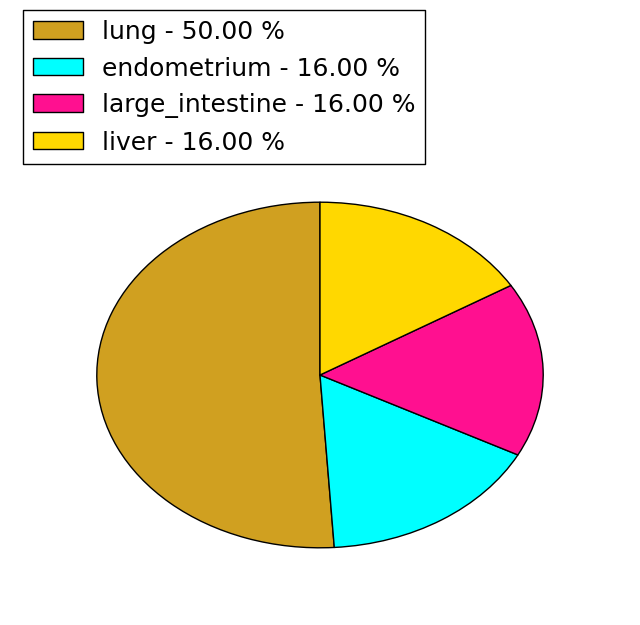 |
(# total SNVs=3) | (# total SNVs=4) |
 | 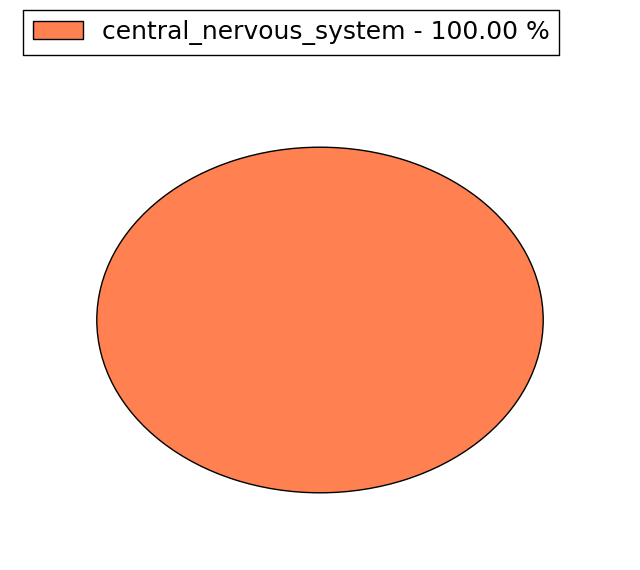 |
| Top |
| * When you move the cursor on each content, you can see more deailed mutation information on the Tooltip. Those are primary_site,primary_histology,mutation(aa),pubmedID. |
| GRCh37 position | Mutation(aa) | Unique sampleID count |
| chr1:100696322-100696323 | p.P134fs*19 | 3 |
| chr1:100672123-100672123 | p.Q363* | 2 |
| chr1:100676288-100676288 | p.A327S | 2 |
| chr1:100706430-100706430 | p.R21H | 2 |
| chr1:100684199-100684199 | p.L180L | 2 |
| chr1:100672100-100672100 | p.I370I | 1 |
| chr1:100701023-100701023 | p.E74K | 1 |
| chr1:100680458-100680458 | p.T285N | 1 |
| chr1:100661971-100661971 | p.P430L | 1 |
| chr1:100684204-100684204 | p.R178H | 1 |
| Top |
|
 |
| Point Mutation/ Tissue ID | 1 | 2 | 3 | 4 | 5 | 6 | 7 | 8 | 9 | 10 | 11 | 12 | 13 | 14 | 15 | 16 | 17 | 18 | 19 | 20 |
| # sample | 1 | 7 | 1 | 4 | 1 | 1 | 9 | 2 | 2 | 2 | 1 | 7 | ||||||||
| # mutation | 1 | 8 | 1 | 4 | 1 | 1 | 14 | 2 | 2 | 2 | 1 | 7 | ||||||||
| nonsynonymous SNV | 1 | 7 | 1 | 4 | 1 | 1 | 11 | 1 | 1 | 2 | 1 | 6 | ||||||||
| synonymous SNV | 1 | 3 | 1 | 1 | 1 |
| cf) Tissue ID; Tissue type (1; BLCA[Bladder Urothelial Carcinoma], 2; BRCA[Breast invasive carcinoma], 3; CESC[Cervical squamous cell carcinoma and endocervical adenocarcinoma], 4; COAD[Colon adenocarcinoma], 5; GBM[Glioblastoma multiforme], 6; Glioma Low Grade, 7; HNSC[Head and Neck squamous cell carcinoma], 8; KICH[Kidney Chromophobe], 9; KIRC[Kidney renal clear cell carcinoma], 10; KIRP[Kidney renal papillary cell carcinoma], 11; LAML[Acute Myeloid Leukemia], 12; LUAD[Lung adenocarcinoma], 13; LUSC[Lung squamous cell carcinoma], 14; OV[Ovarian serous cystadenocarcinoma ], 15; PAAD[Pancreatic adenocarcinoma], 16; PRAD[Prostate adenocarcinoma], 17; SKCM[Skin Cutaneous Melanoma], 18:STAD[Stomach adenocarcinoma], 19:THCA[Thyroid carcinoma], 20:UCEC[Uterine Corpus Endometrial Carcinoma]) |
| Top |
| * We represented just top 10 SNVs. When you move the cursor on each content, you can see more deailed mutation information on the Tooltip. Those are primary_site, primary_histology, mutation(aa), pubmedID. |
| Genomic Position | Mutation(aa) | Unique sampleID count |
| chr1:100684199 | p.L180M | 2 |
| chr1:100676288 | p.T388I | 1 |
| chr1:100681747 | p.M235I | 1 |
| chr1:100672042 | p.R21H | 1 |
| chr1:100706417 | p.R376S | 1 |
| chr1:100680397 | p.M235T | 1 |
| chr1:100672047 | p.K16M | 1 |
| chr1:100706430 | p.L374L | 1 |
| chr1:100680426 | p.D234Y | 1 |
| chr1:100684204 | p.G15G | 1 |
| * Copy number data were extracted from TCGA using R package TCGA-Assembler. The URLs of all public data files on TCGA DCC data server were gathered on Jan-05-2015. Function ProcessCNAData in TCGA-Assembler package was used to obtain gene-level copy number value which is calculated as the average copy number of the genomic region of a gene. |
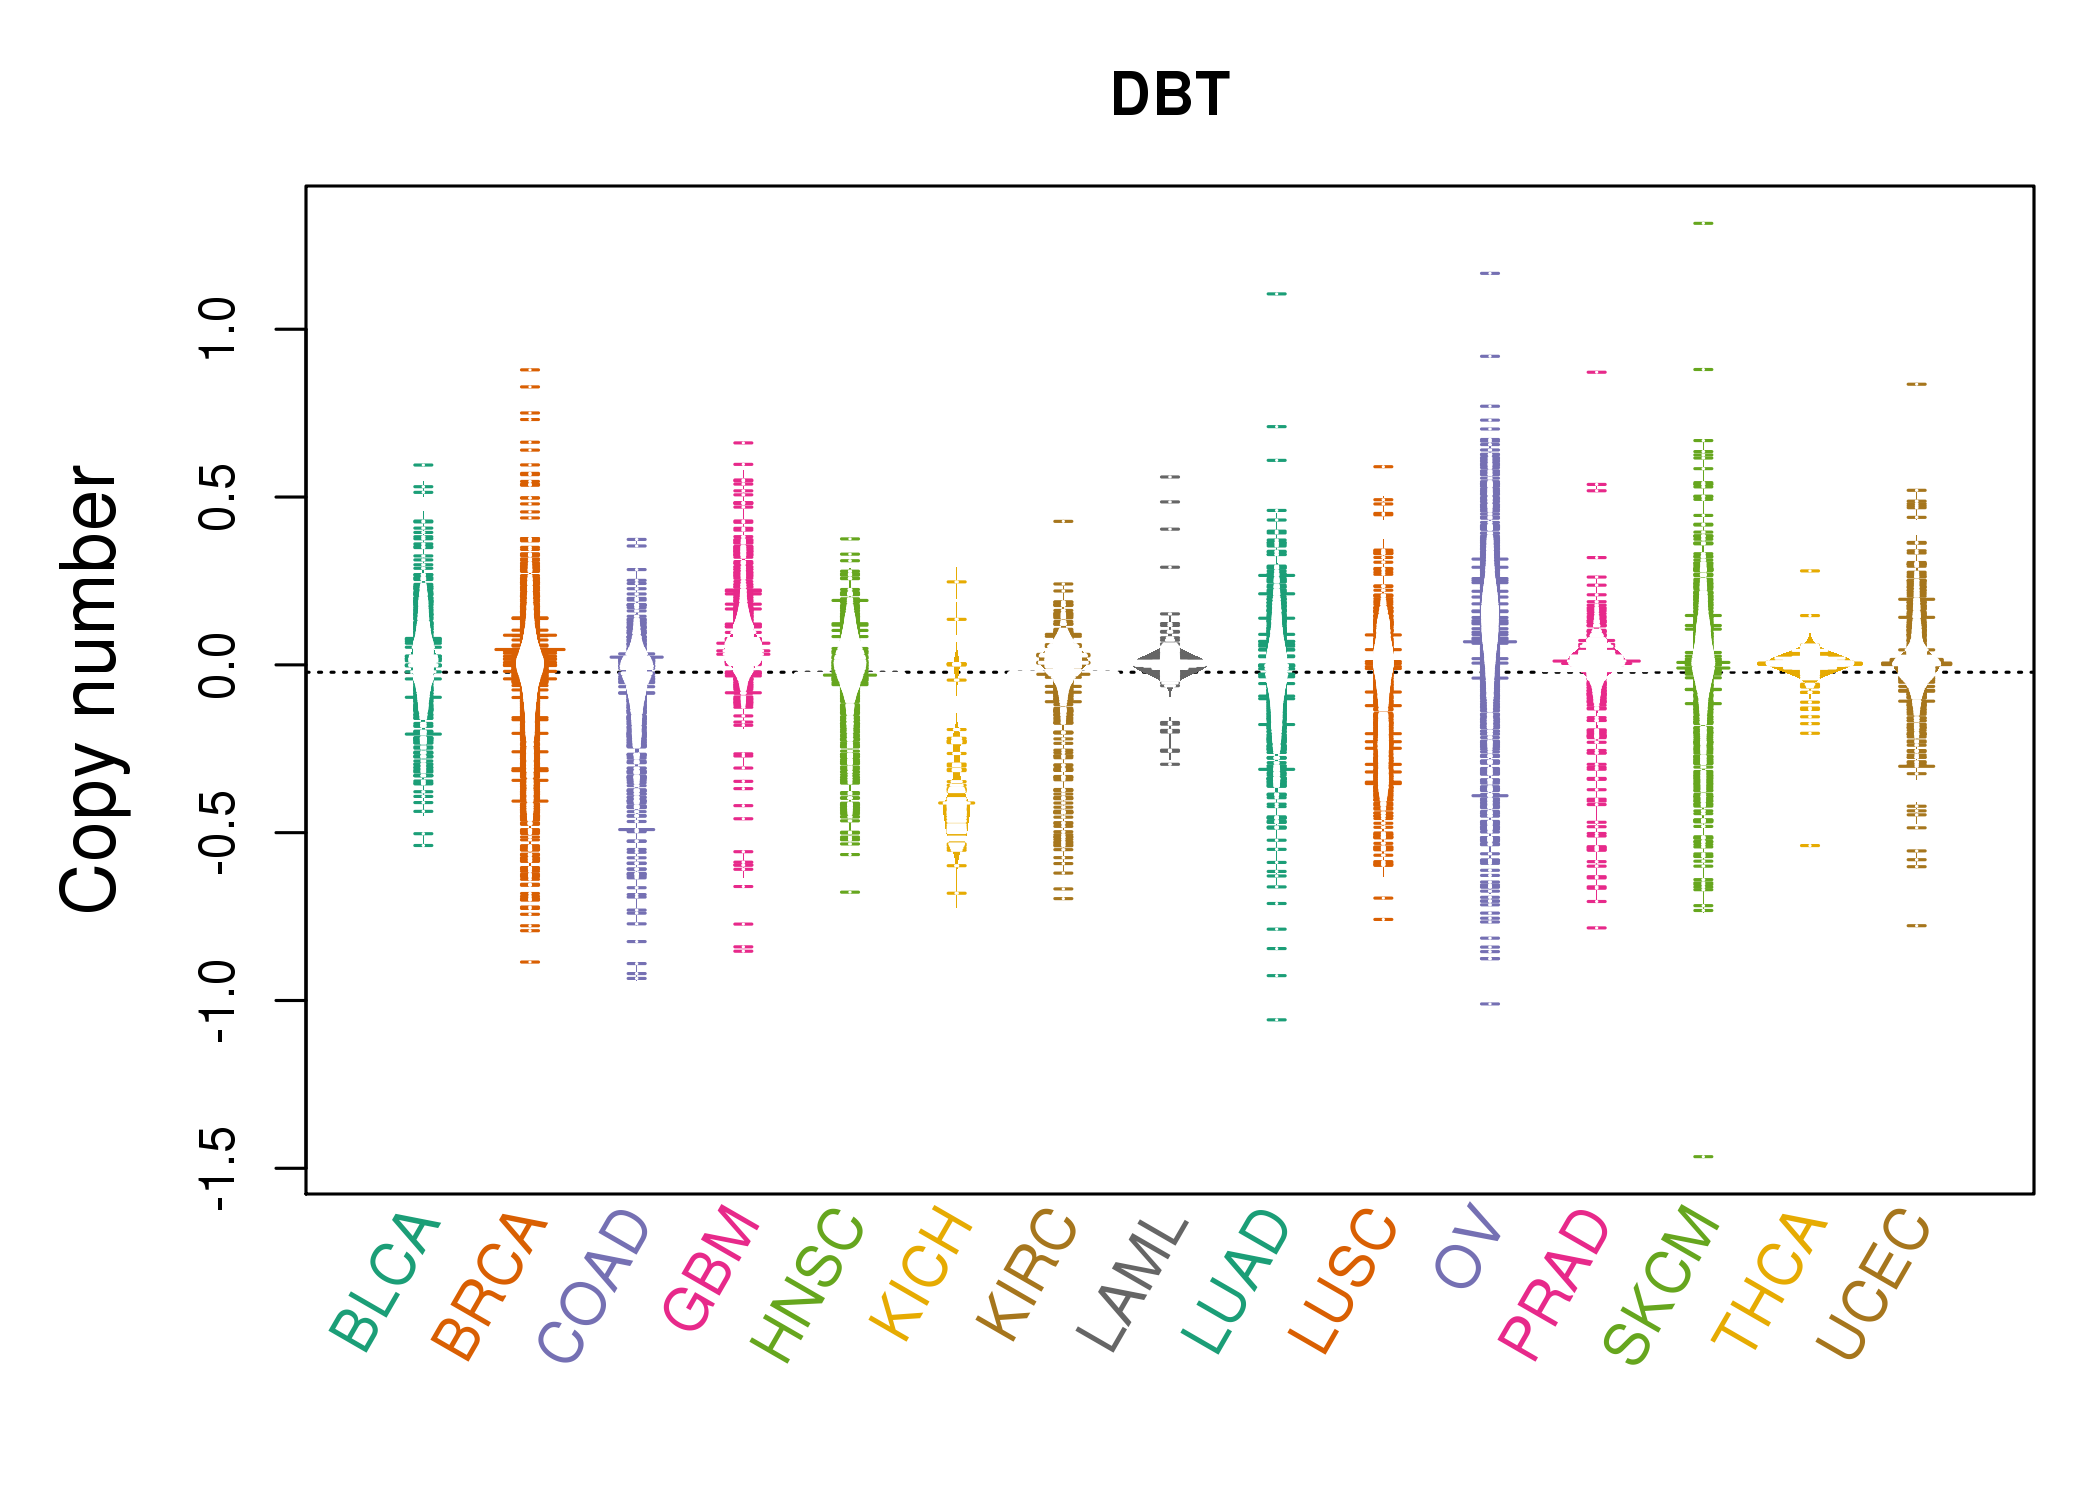 |
| cf) Tissue ID[Tissue type]: BLCA[Bladder Urothelial Carcinoma], BRCA[Breast invasive carcinoma], CESC[Cervical squamous cell carcinoma and endocervical adenocarcinoma], COAD[Colon adenocarcinoma], GBM[Glioblastoma multiforme], Glioma Low Grade, HNSC[Head and Neck squamous cell carcinoma], KICH[Kidney Chromophobe], KIRC[Kidney renal clear cell carcinoma], KIRP[Kidney renal papillary cell carcinoma], LAML[Acute Myeloid Leukemia], LUAD[Lung adenocarcinoma], LUSC[Lung squamous cell carcinoma], OV[Ovarian serous cystadenocarcinoma ], PAAD[Pancreatic adenocarcinoma], PRAD[Prostate adenocarcinoma], SKCM[Skin Cutaneous Melanoma], STAD[Stomach adenocarcinoma], THCA[Thyroid carcinoma], UCEC[Uterine Corpus Endometrial Carcinoma] |
| Top |
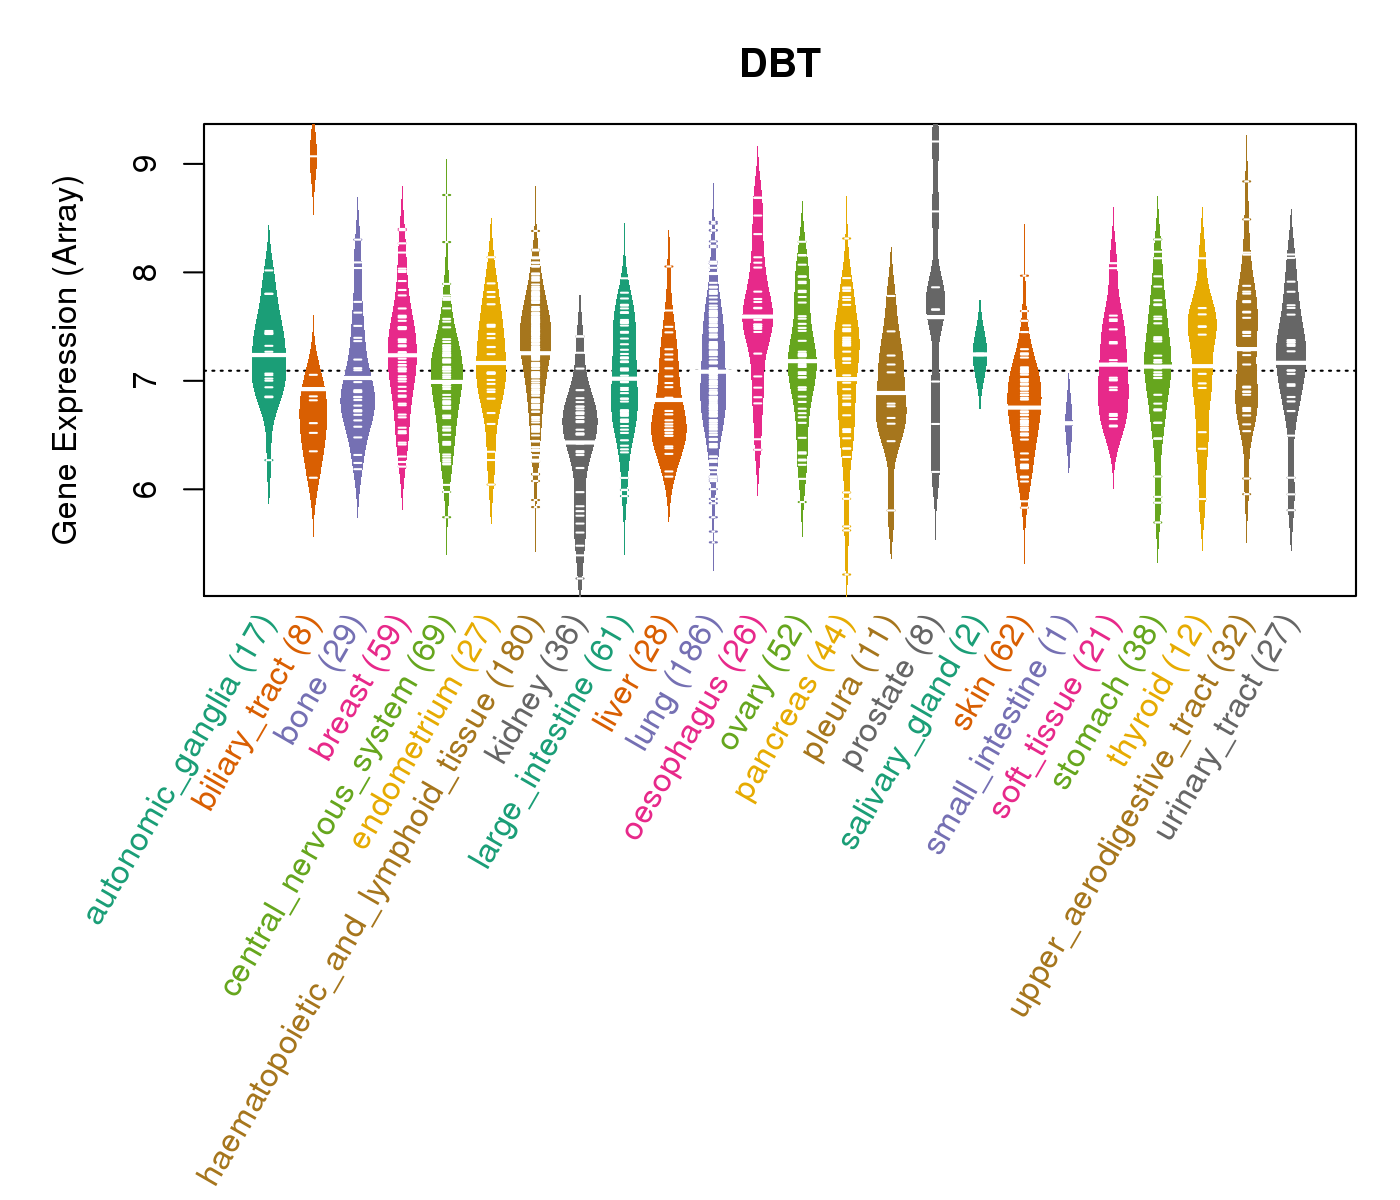
| Gene Expression for DBT |
| * CCLE gene expression data were extracted from CCLE_Expression_Entrez_2012-10-18.res: Gene-centric RMA-normalized mRNA expression data. |
 |
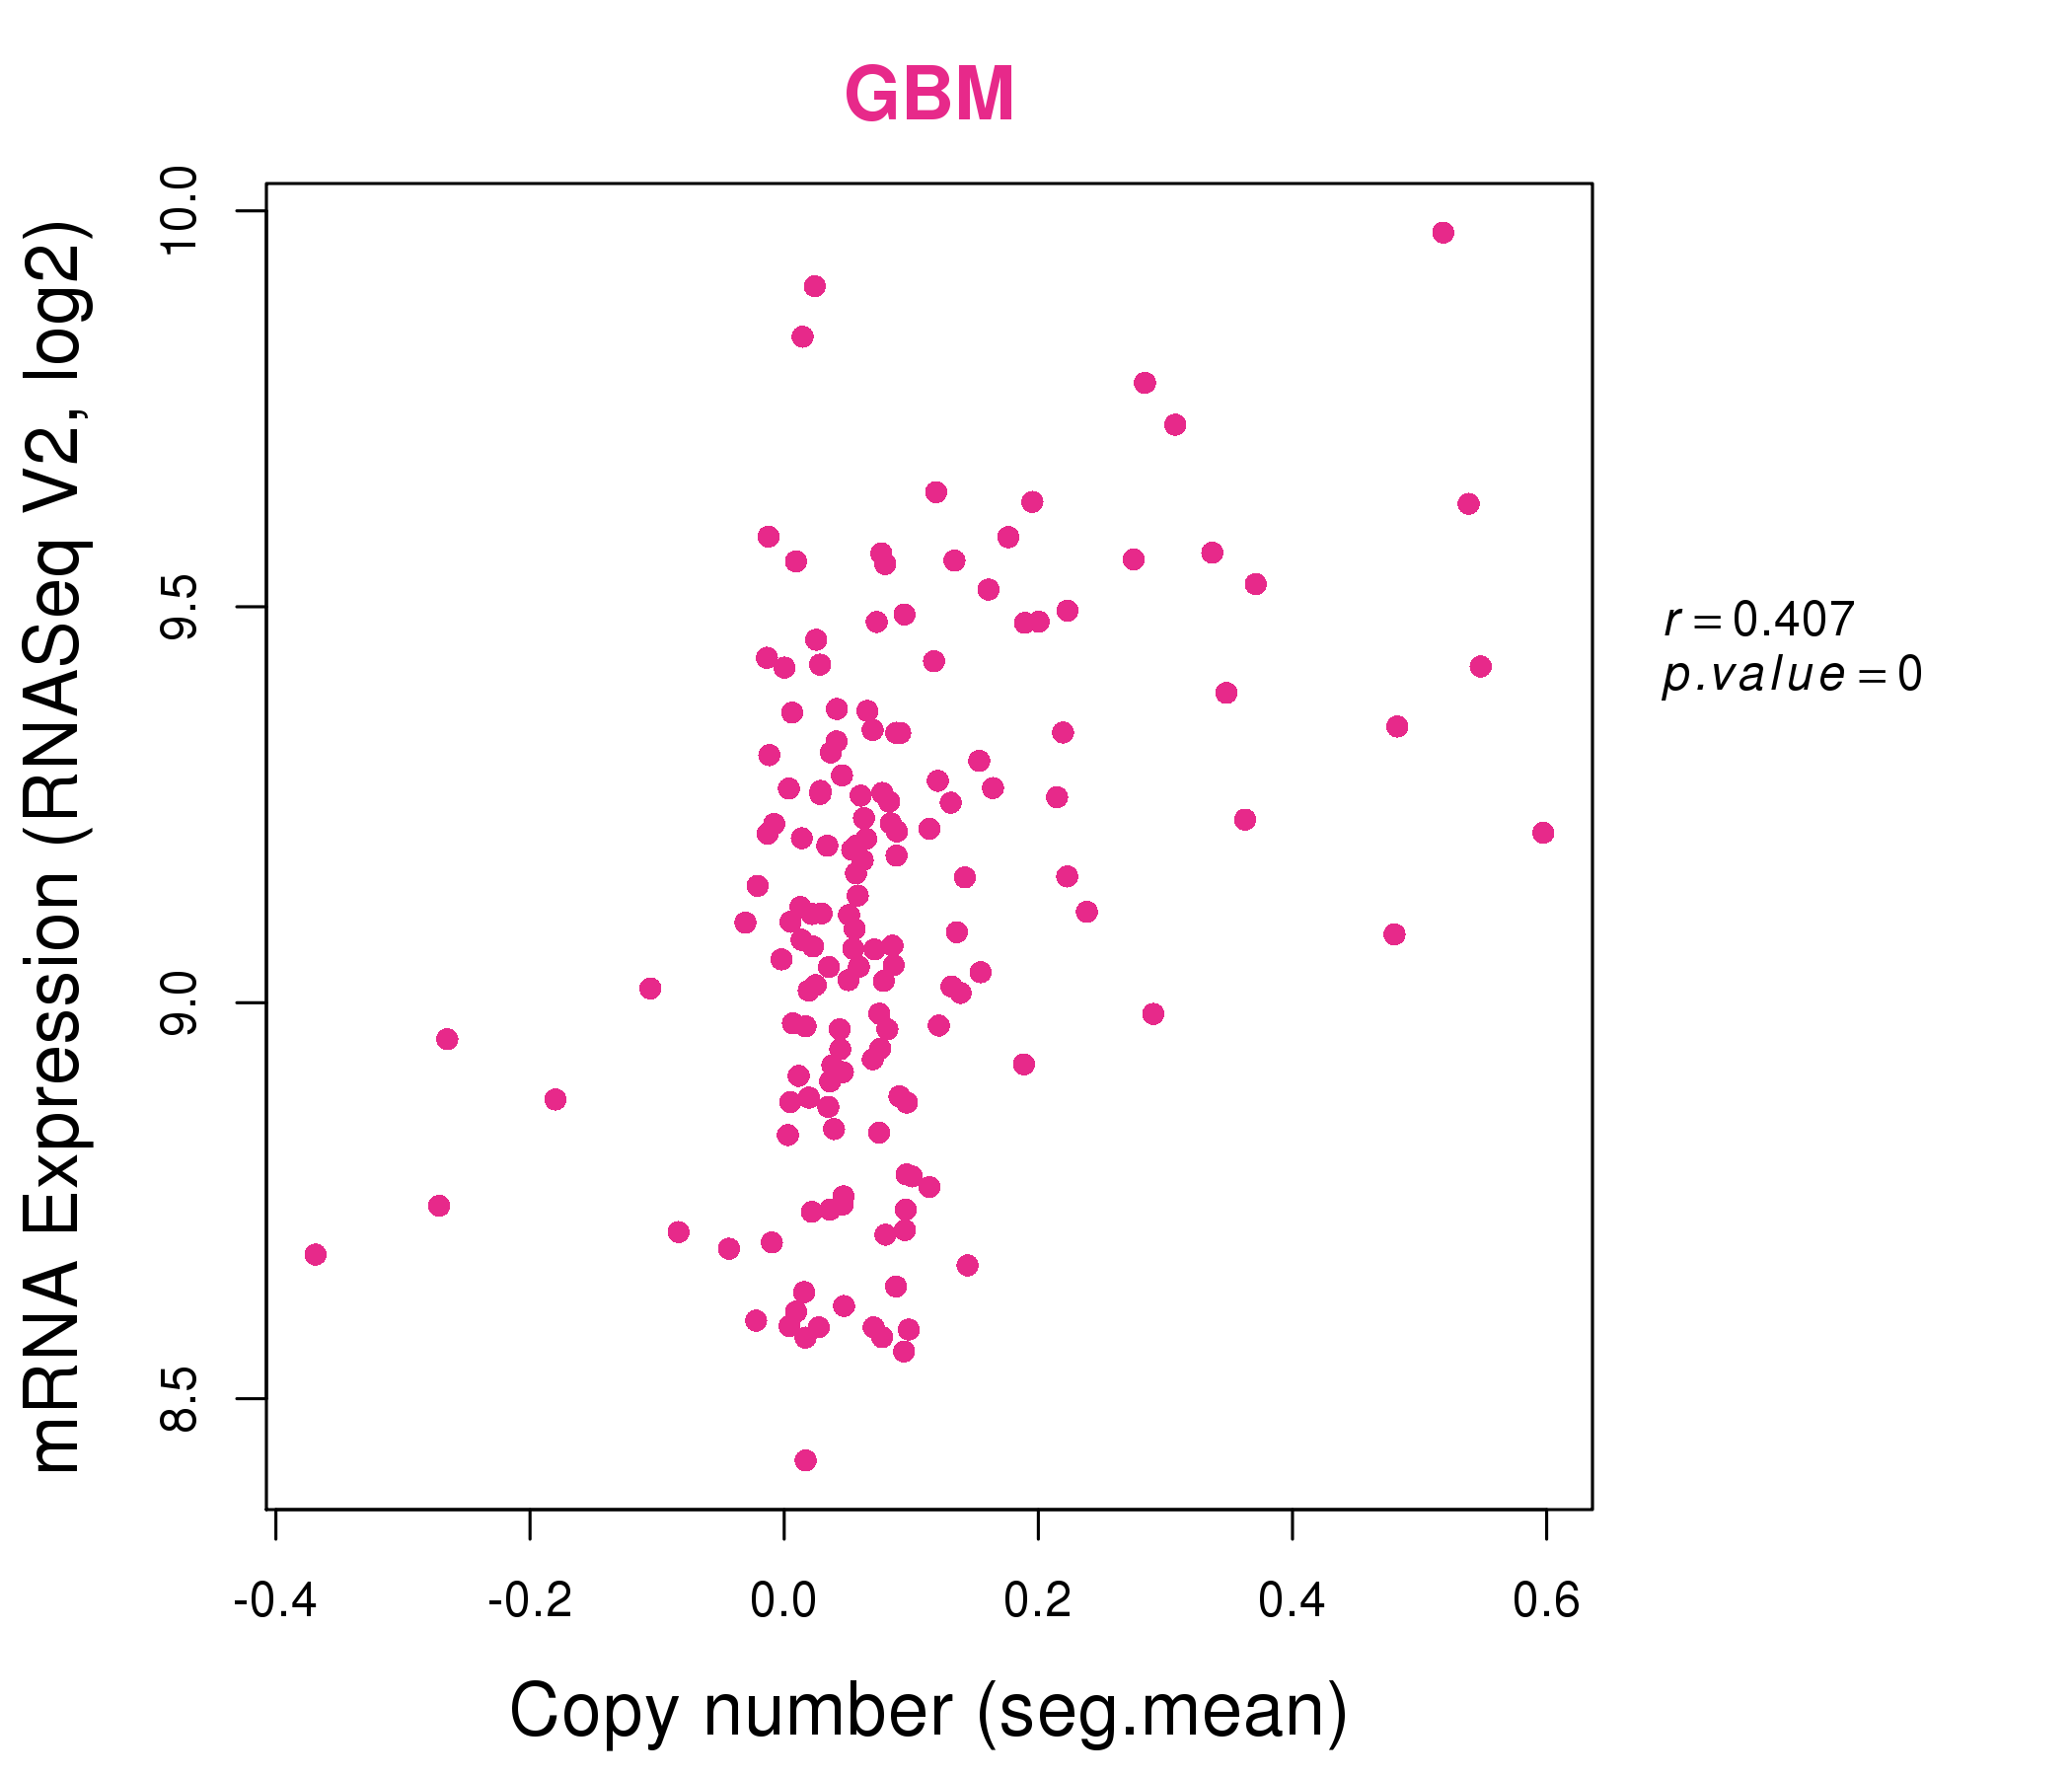
| * Normalized gene expression data of RNASeqV2 was extracted from TCGA using R package TCGA-Assembler. The URLs of all public data files on TCGA DCC data server were gathered at Jan-05-2015. Only eight cancer types have enough normal control samples for differential expression analysis. (t test, adjusted p<0.05 (using Benjamini-Hochberg FDR)) |
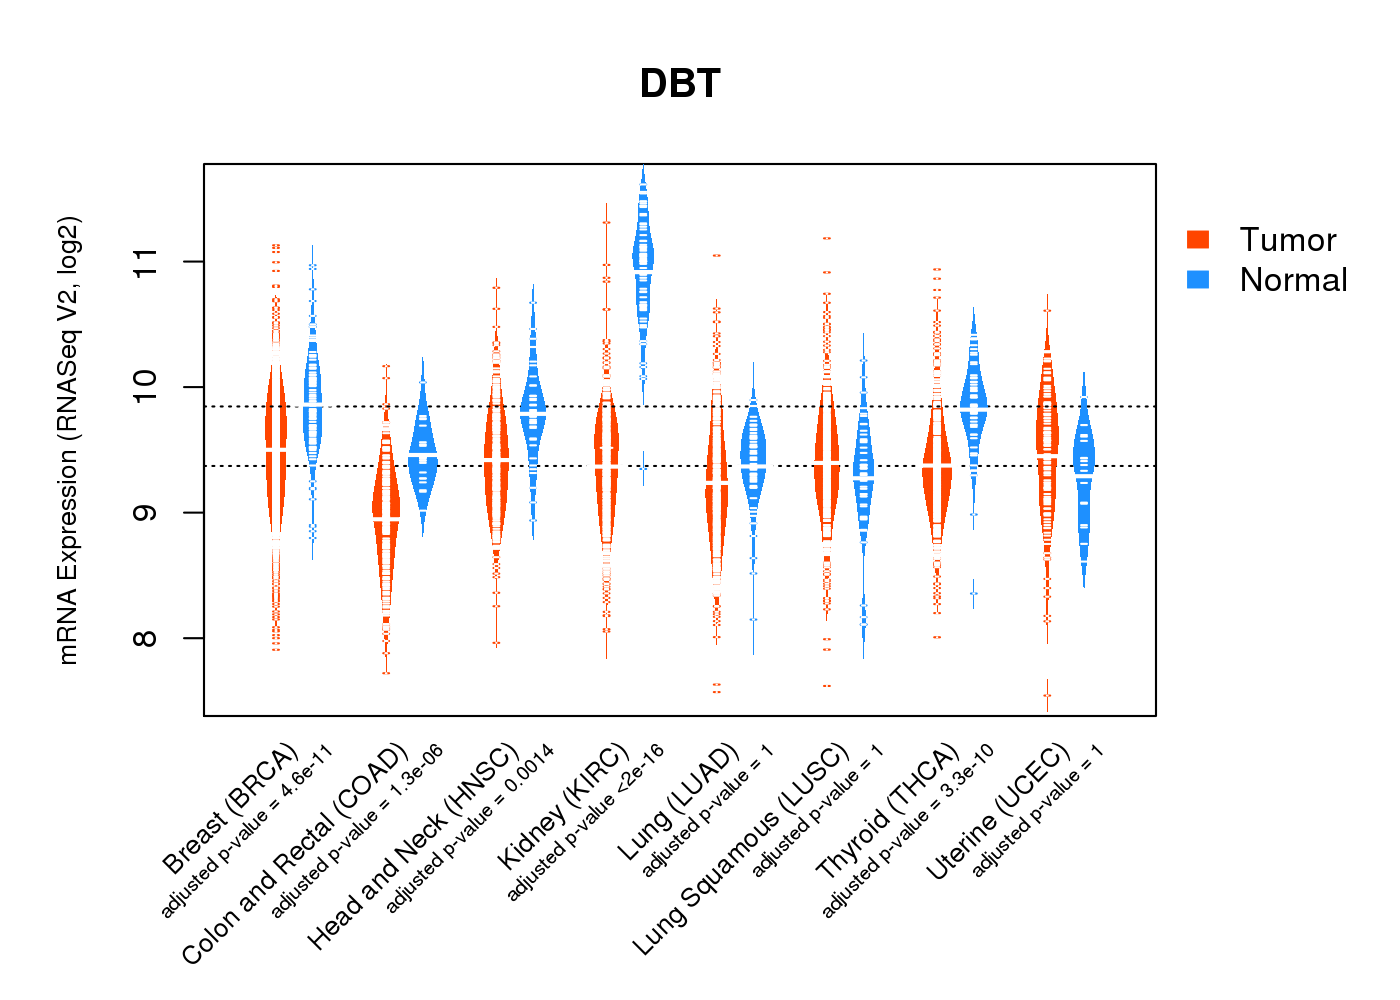 |
| Top |
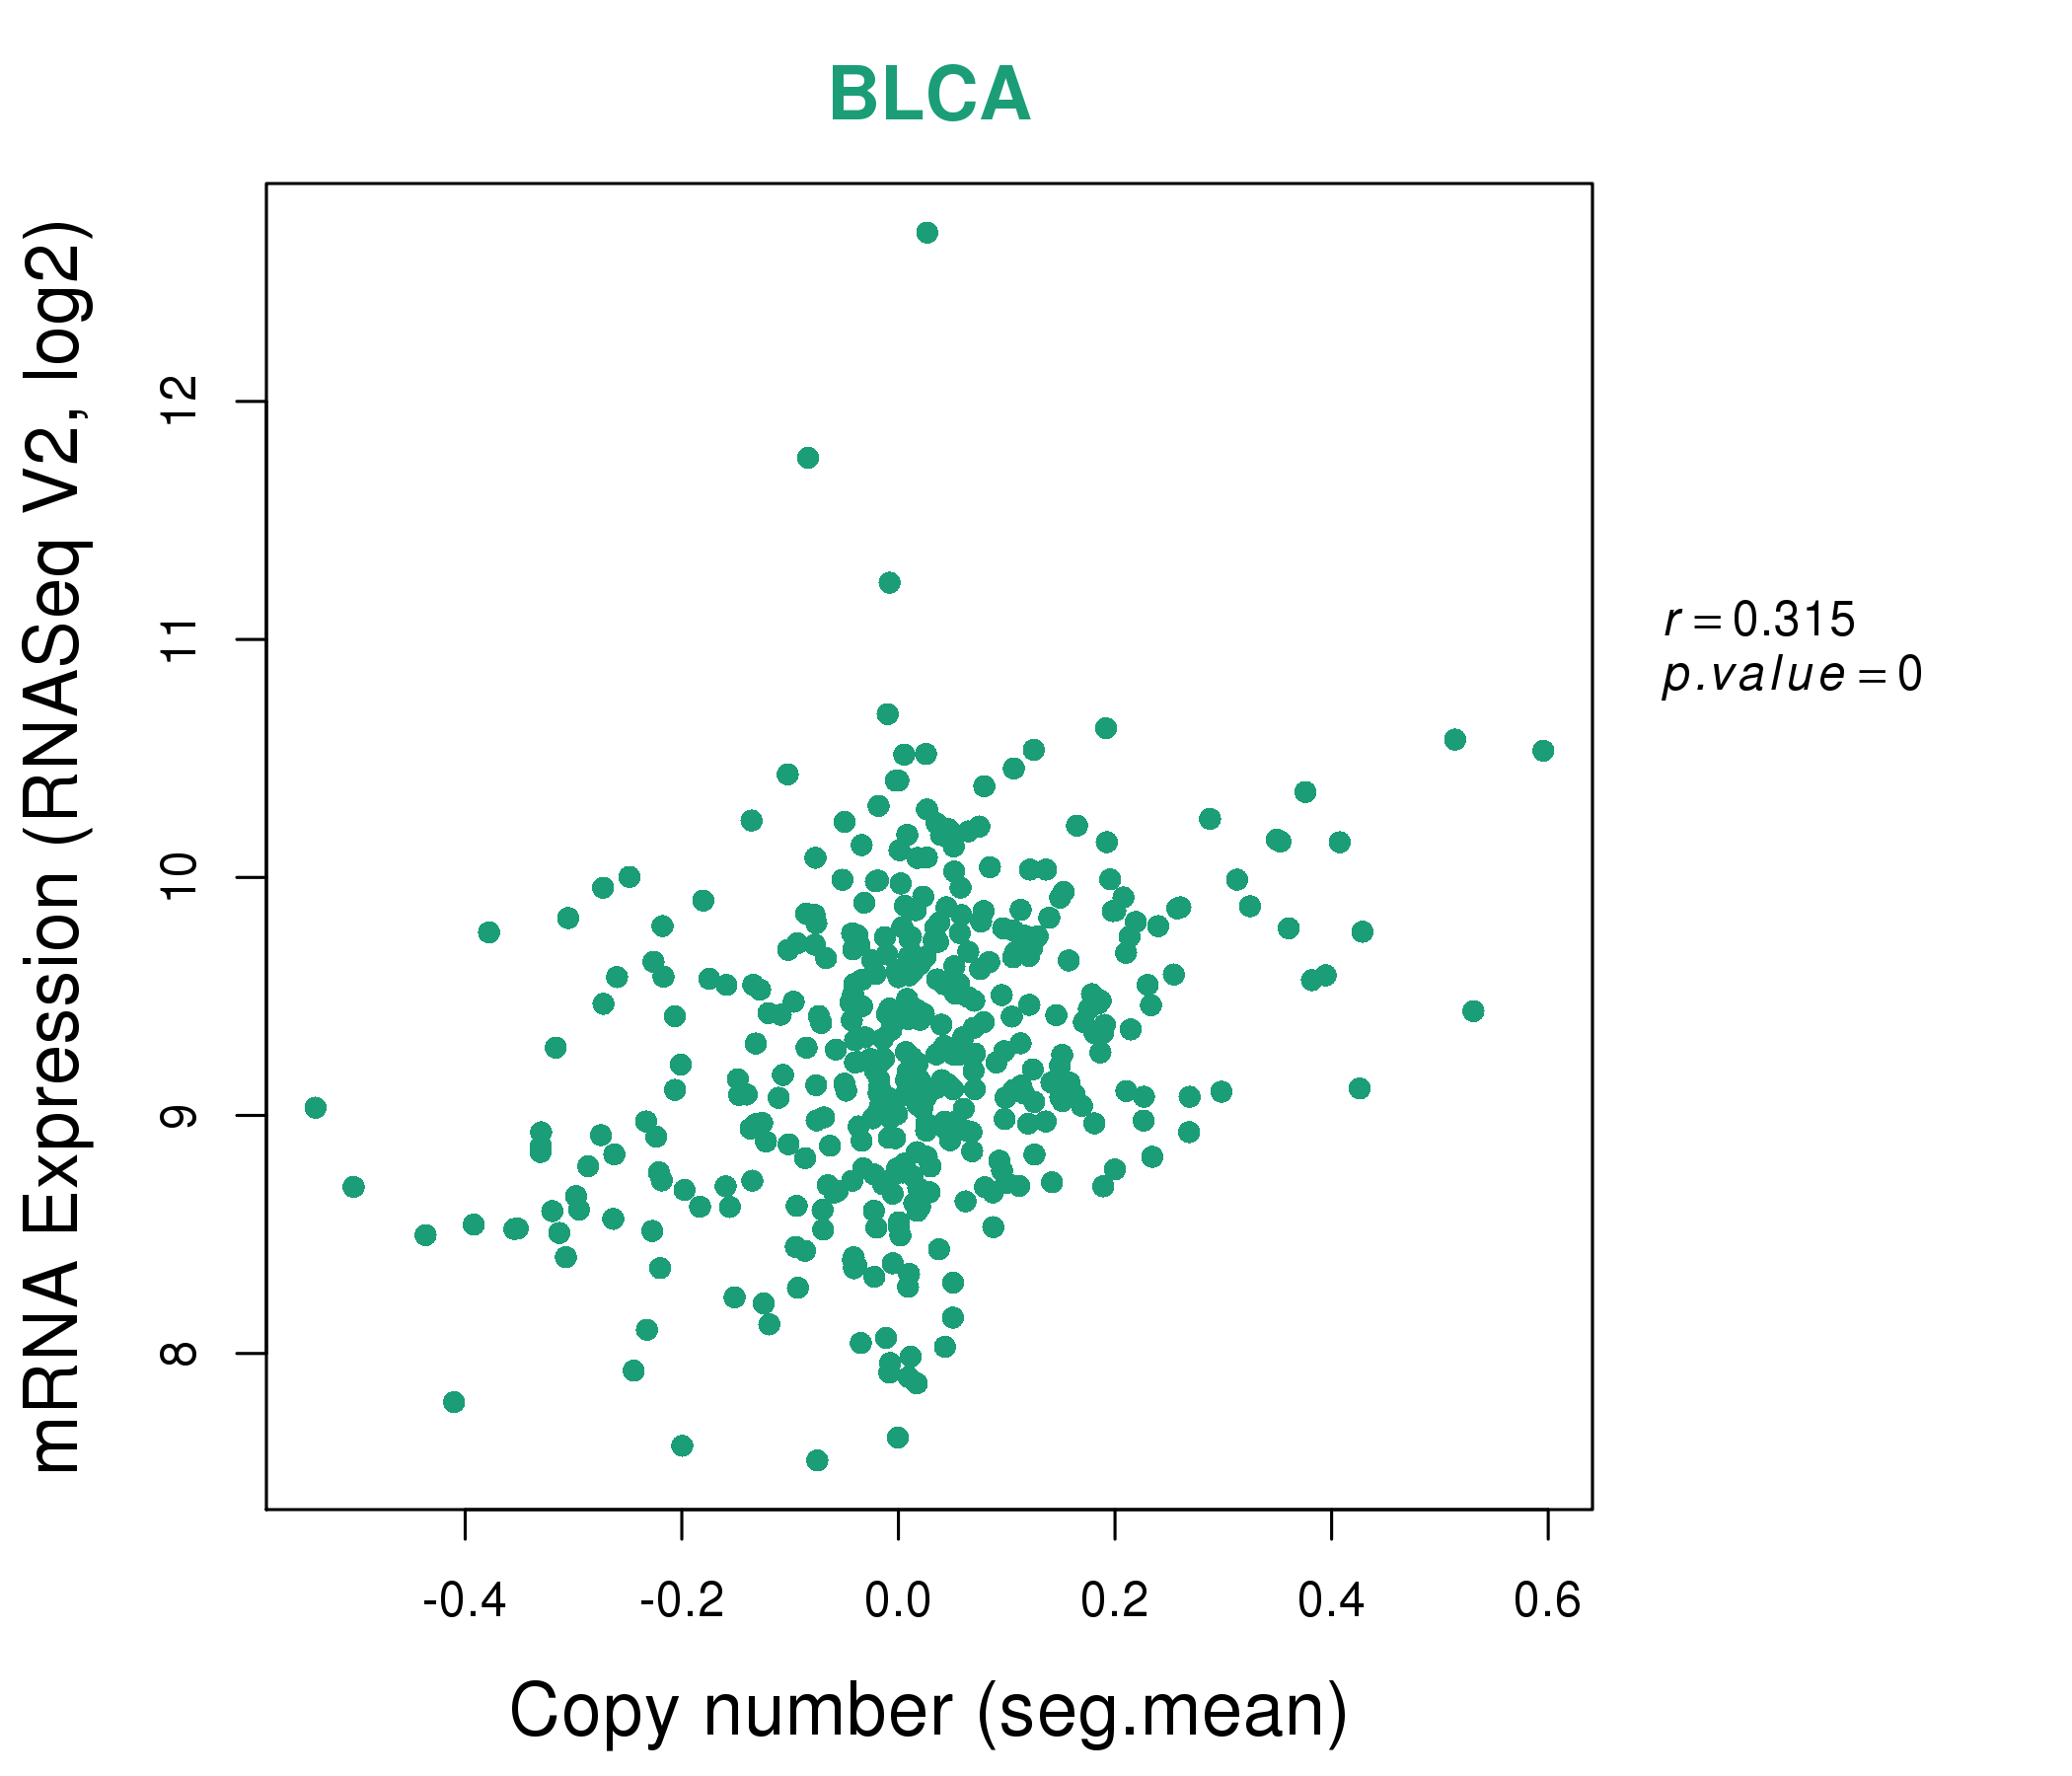
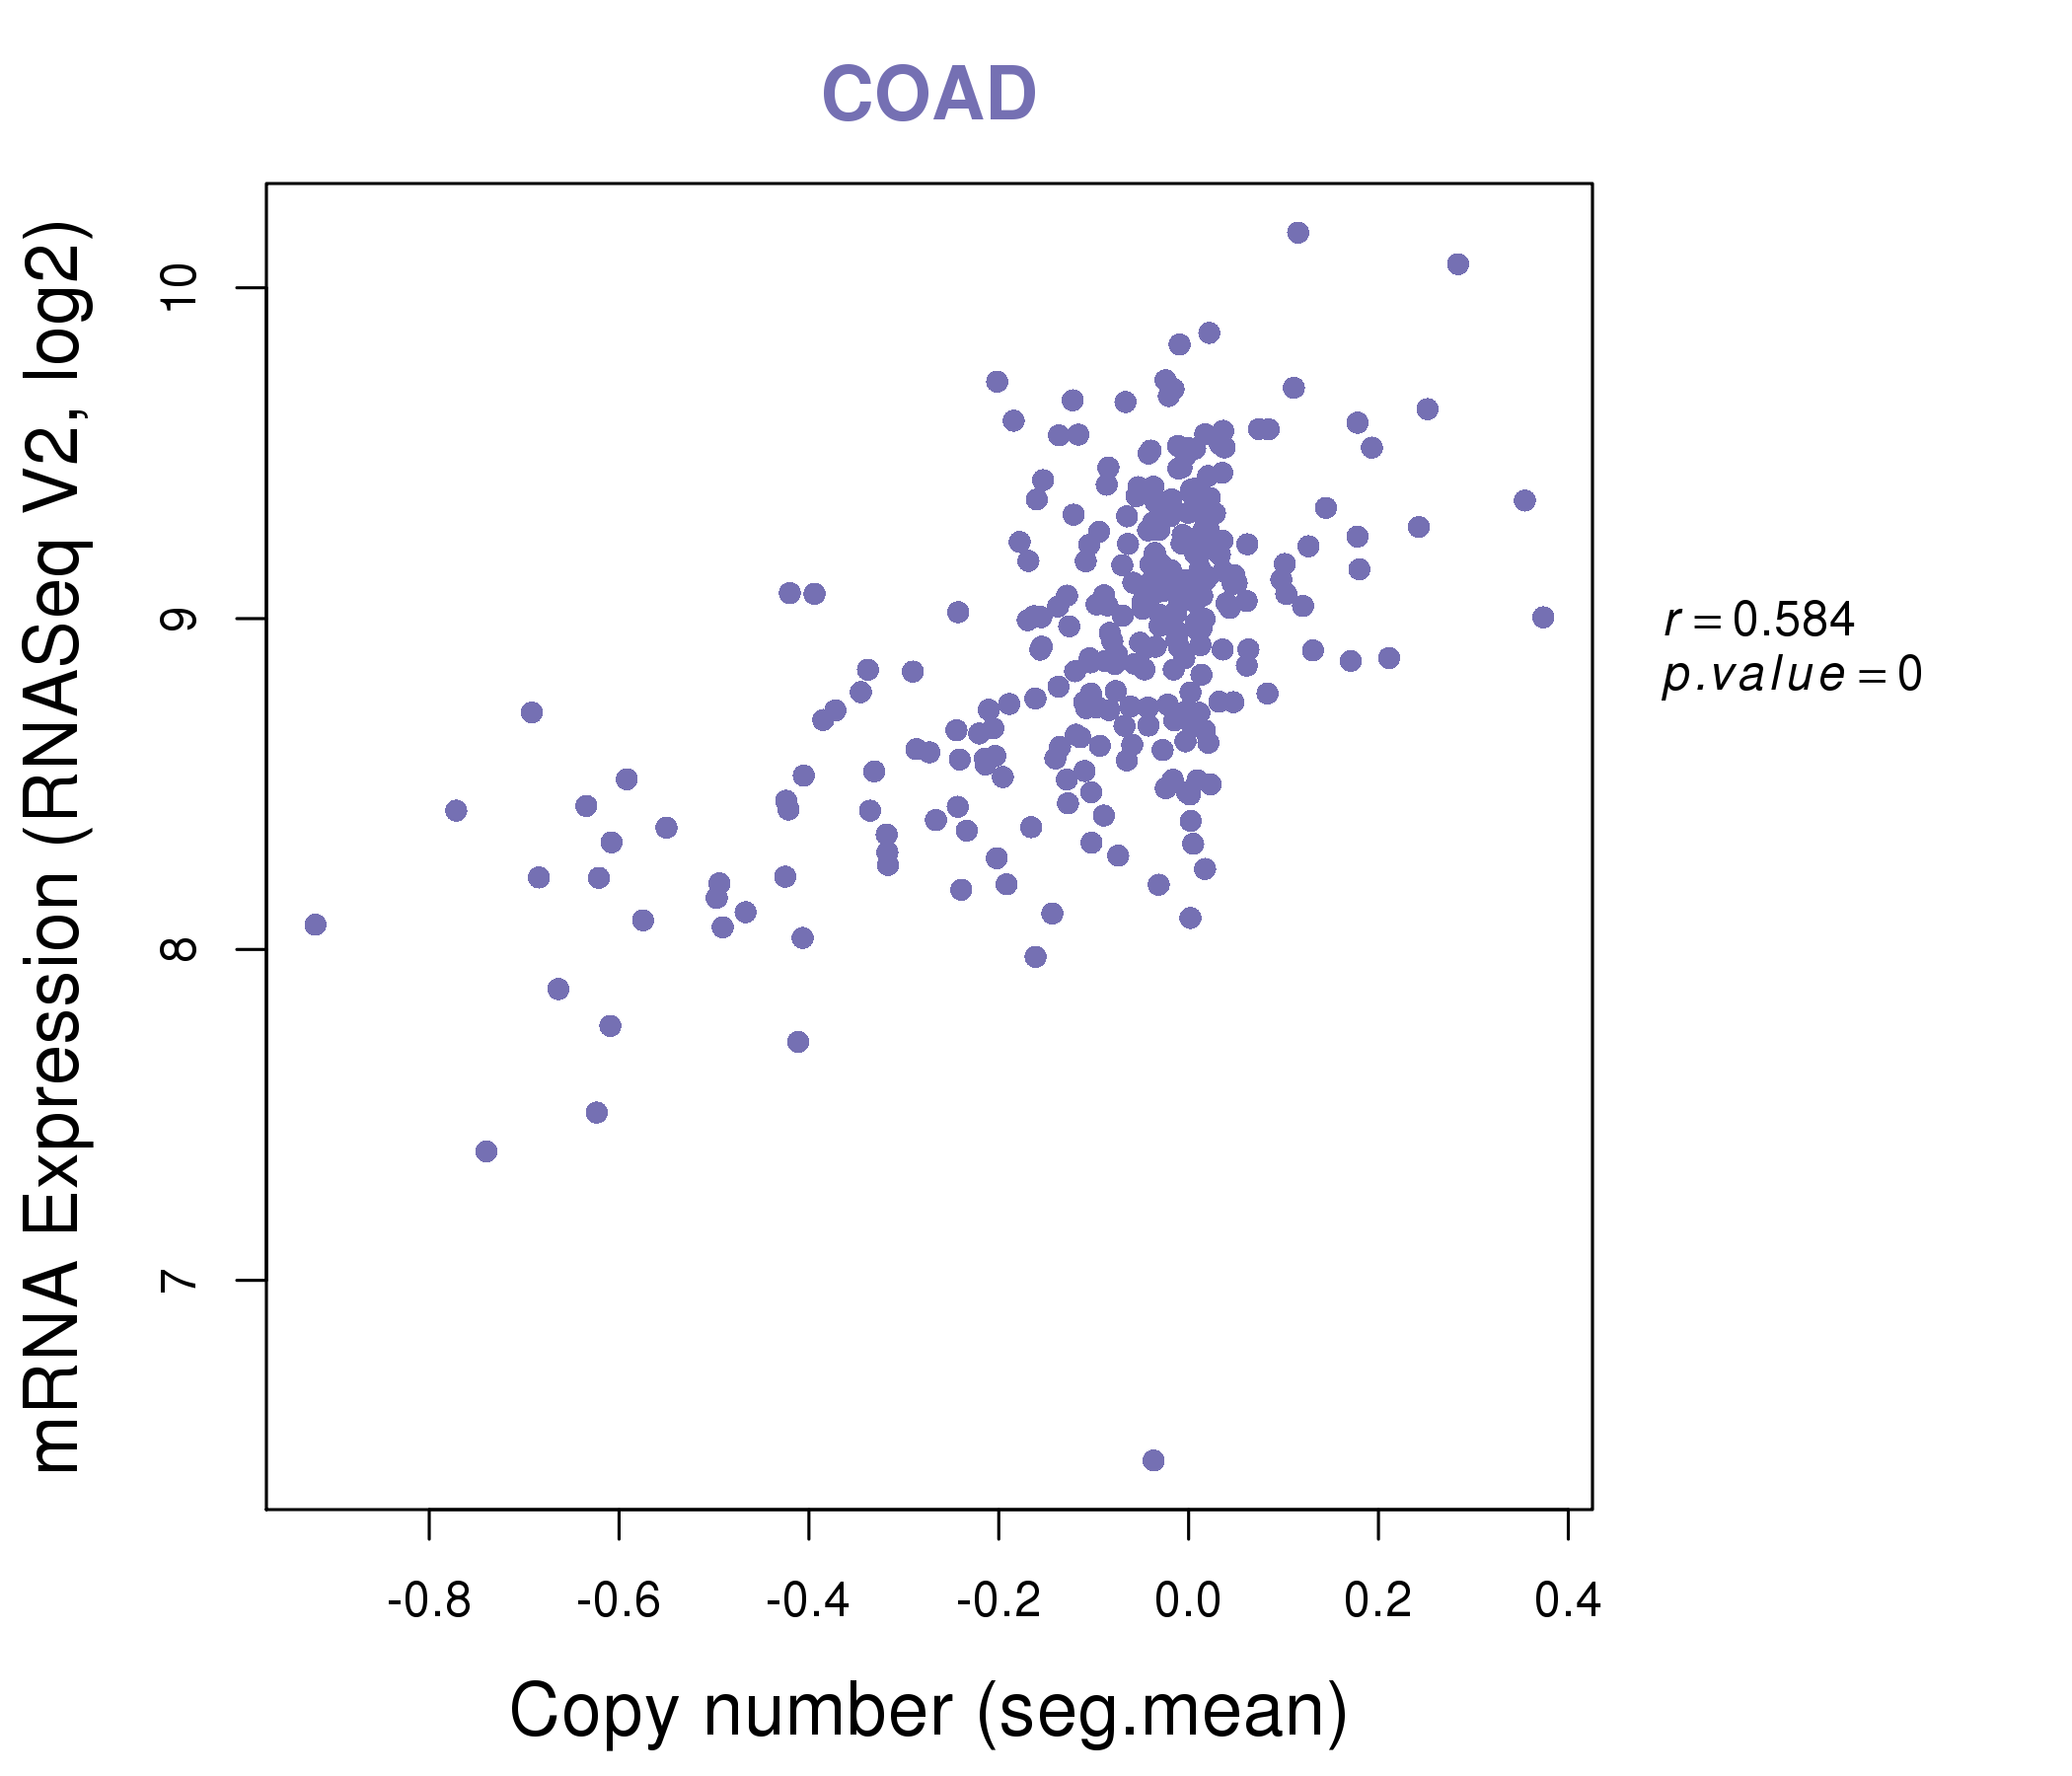
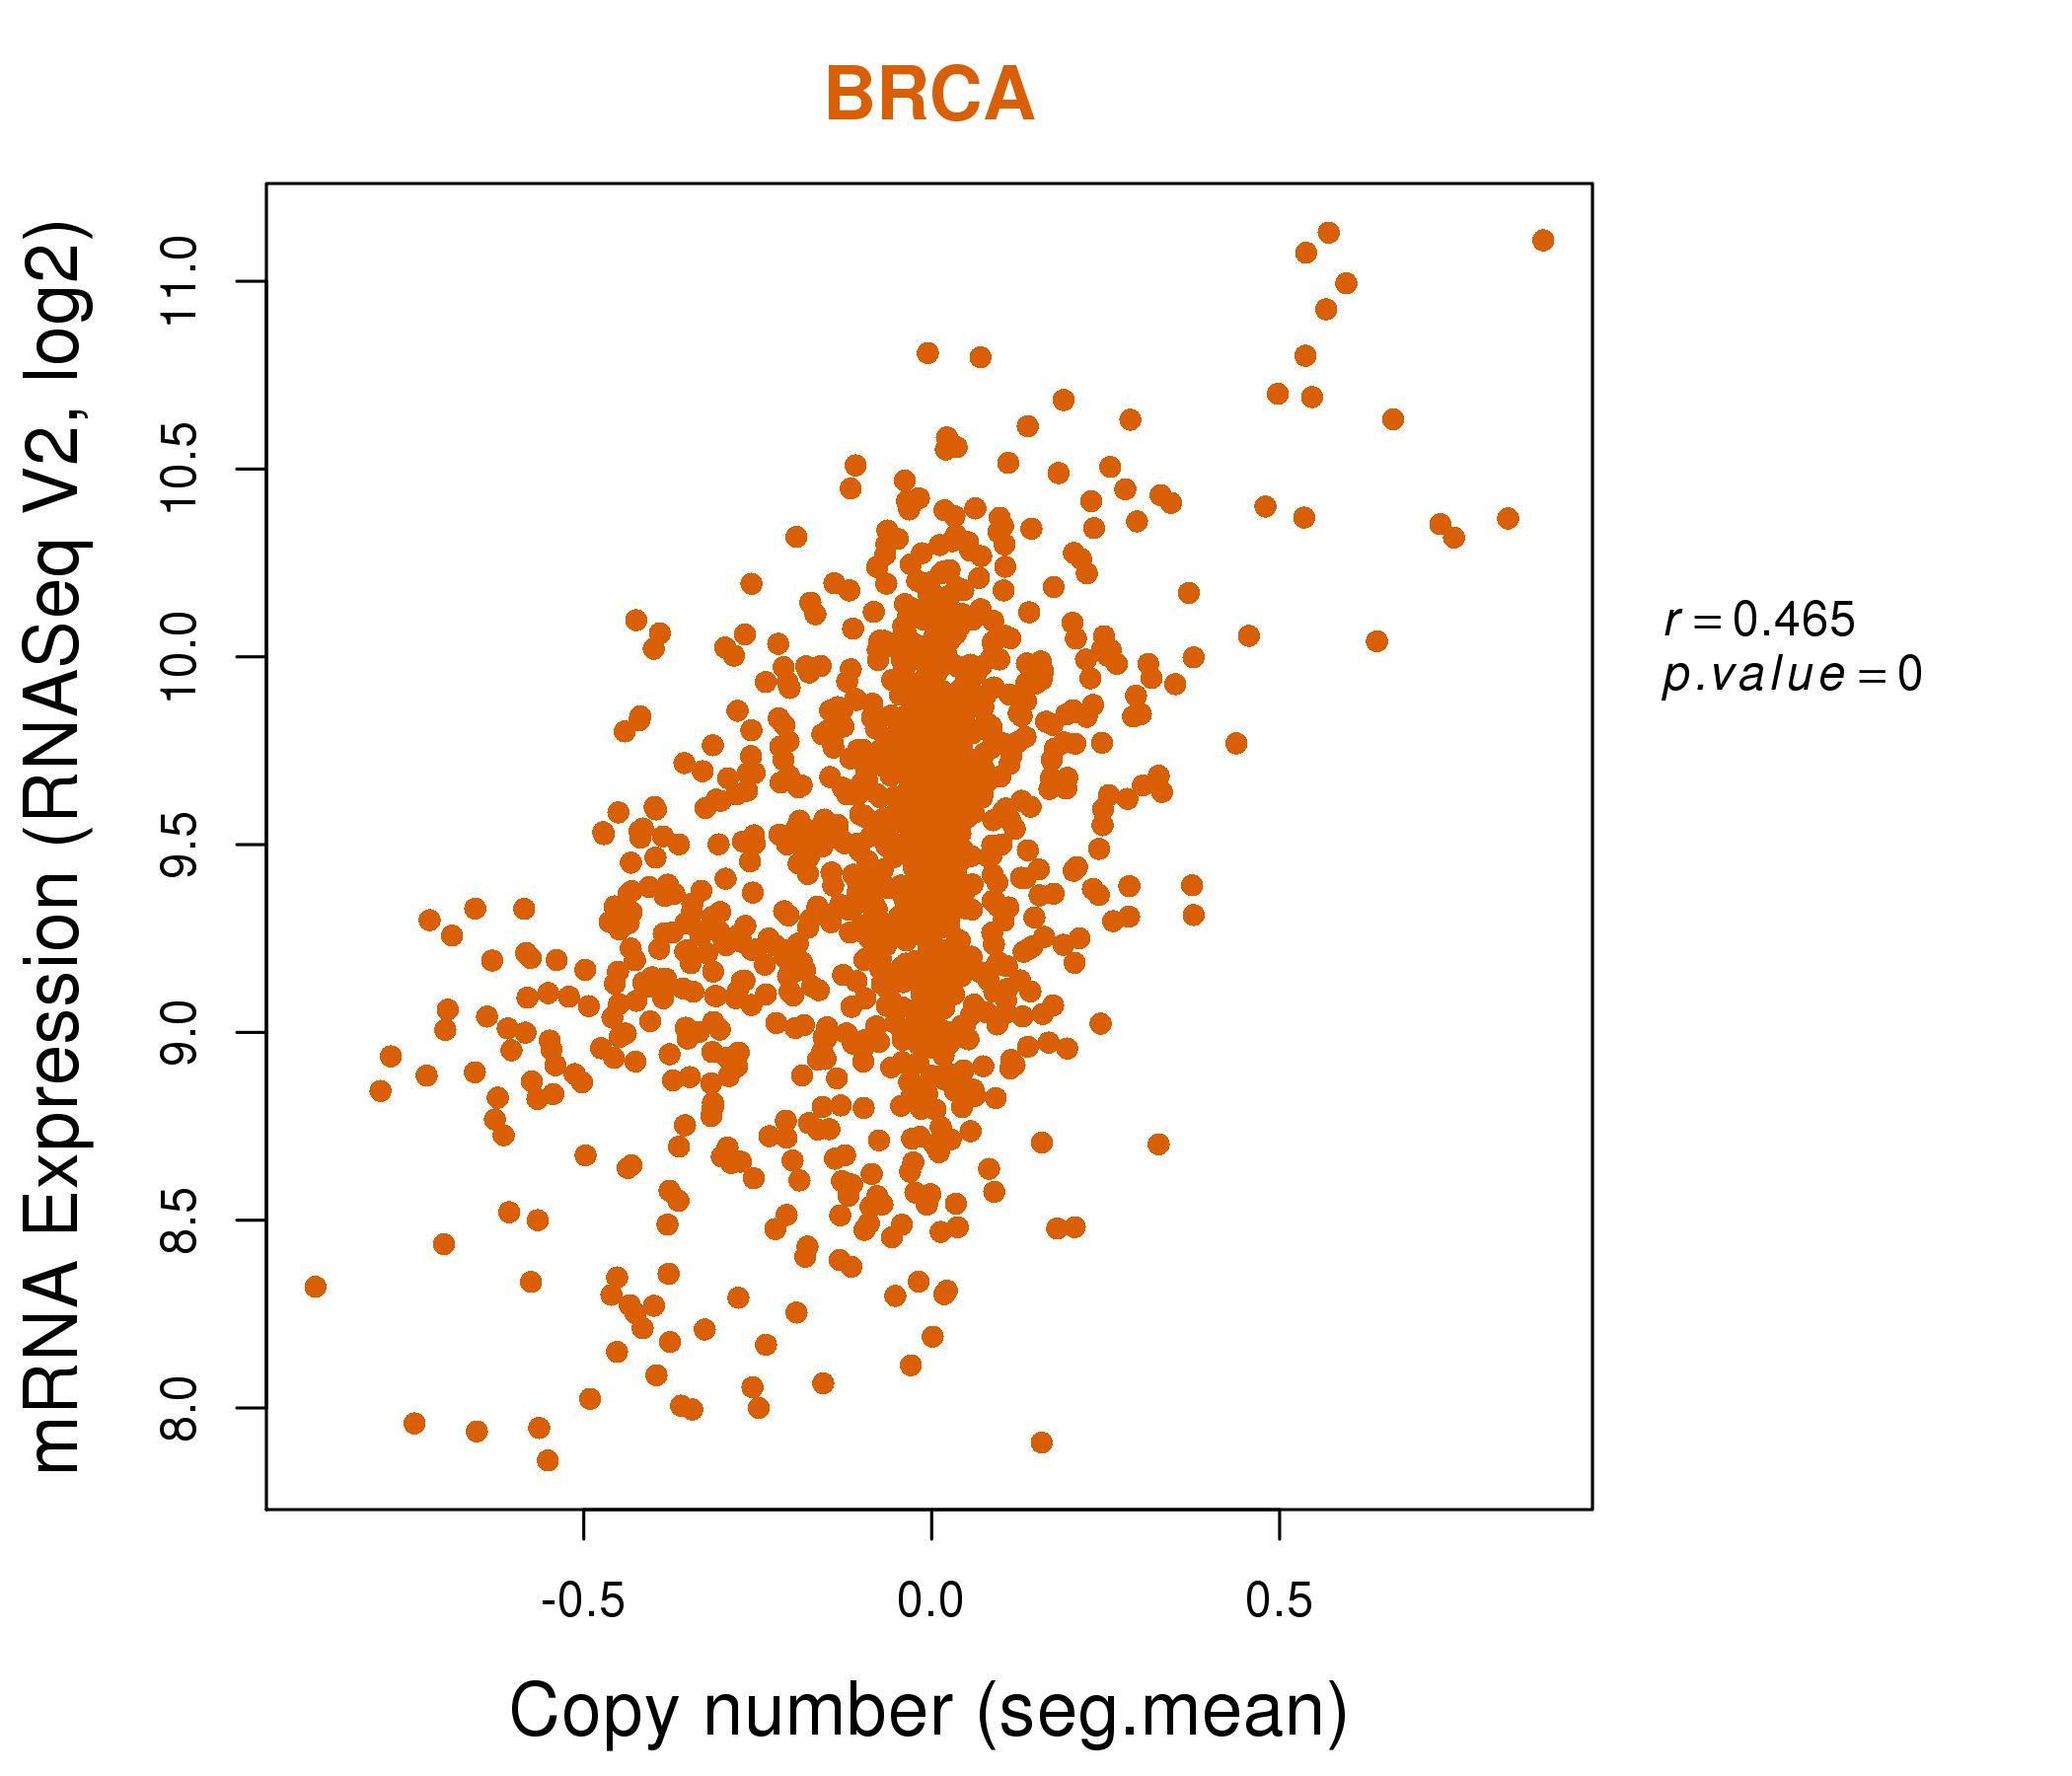
| * This plots show the correlation between CNV and gene expression. |
: Open all plots for all cancer types
 |
|
 |
|
| Top |
| Gene-Gene Network Information |
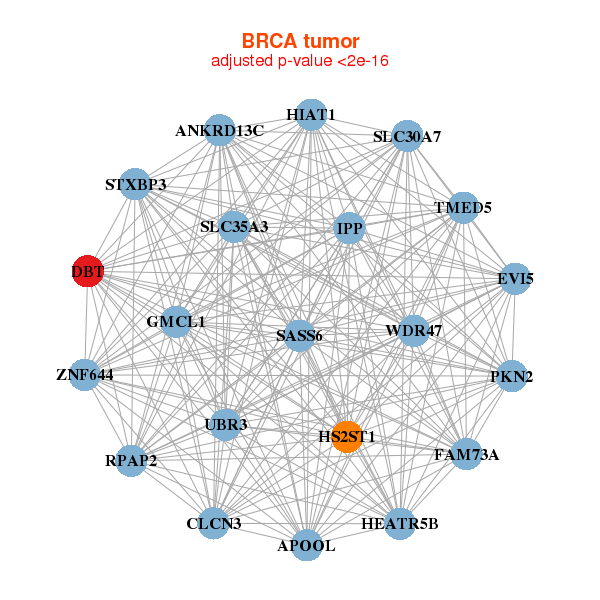
| * Co-Expression network figures were drawn using R package igraph. Only the top 20 genes with the highest correlations were shown. Red circle: input gene, orange circle: cell metabolism gene, sky circle: other gene |
: Open all plots for all cancer types
 |
|
| ANKRD13C,APOOL,CLCN3,DBT,EVI5,FAM73A,GMCL1, HEATR5B,HIAT1,HS2ST1,IPP,PKN2,RPAP2,SASS6, SLC30A7,SLC35A3,STXBP3,TMED5,UBR3,WDR47,ZNF644 | ALDH6A1,CLASP1,DBT,DCTN4,DHTKD1,HECTD1,KIAA1715, KLHL24,L2HGDH,MPHOSPH9,MUT,OXR1,PPARA,PPM1A, PTCD2,RMND5A,SNX13,TMLHE,TOMM70A,TRIM23,UBR2 |
 |
|
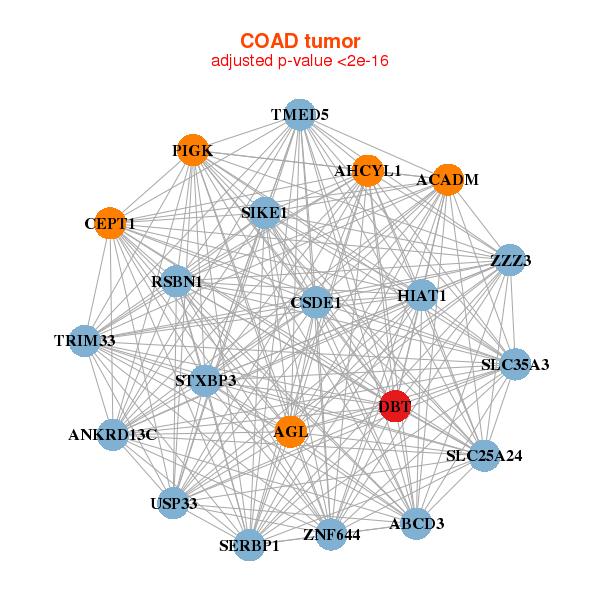
| ABCD3,ACADM,AGL,AHCYL1,ANKRD13C,CEPT1,CSDE1, DBT,HIAT1,PIGK,RSBN1,SERBP1,SIKE1,SLC25A24, SLC35A3,STXBP3,TMED5,TRIM33,USP33,ZNF644,ZZZ3 | AASDHPPT,AGK,AKIP1,XXYLT1,C5orf24,DBT,DHX40, ESD,EXD2,FAM149B1,FIG4,KITLG,MBLAC2,POLK, RSBN1L,THAP2,TMEM123,USP28,ZBTB41,ZMYM1,ZNF214 |

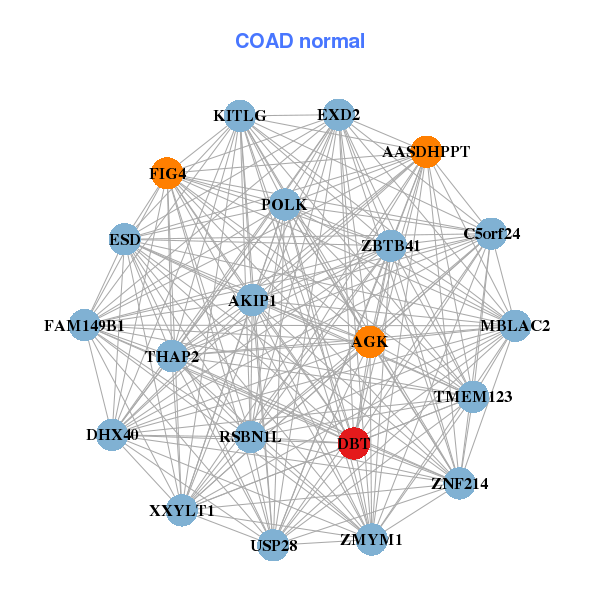
| * Co-Expression network figures were drawn using R package igraph. Only the top 20 genes with the highest correlations were shown. Red circle: input gene, orange circle: cell metabolism gene, sky circle: other gene |
: Open all plots for all cancer types
| Top |
: Open all interacting genes' information including KEGG pathway for all interacting genes from DAVID
| Top |
| Pharmacological Information for DBT |
| There's no related Drug. |
| Top |
| Cross referenced IDs for DBT |
| * We obtained these cross-references from Uniprot database. It covers 150 different DBs, 18 categories. http://www.uniprot.org/help/cross_references_section |
: Open all cross reference information
|
Copyright © 2016-Present - The Univsersity of Texas Health Science Center at Houston @ |