|
||||||||||||||||||||
| |
| Phenotypic Information (metabolism pathway, cancer, disease, phenome) |
| |
| |
| Gene-Gene Network Information: Co-Expression Network, Interacting Genes & KEGG |
| |
|


| Gene Summary for ECI1 |
| Basic gene info. | Gene symbol | ECI1 |
| Gene name | enoyl-CoA delta isomerase 1 | |
| Synonyms | DCI | |
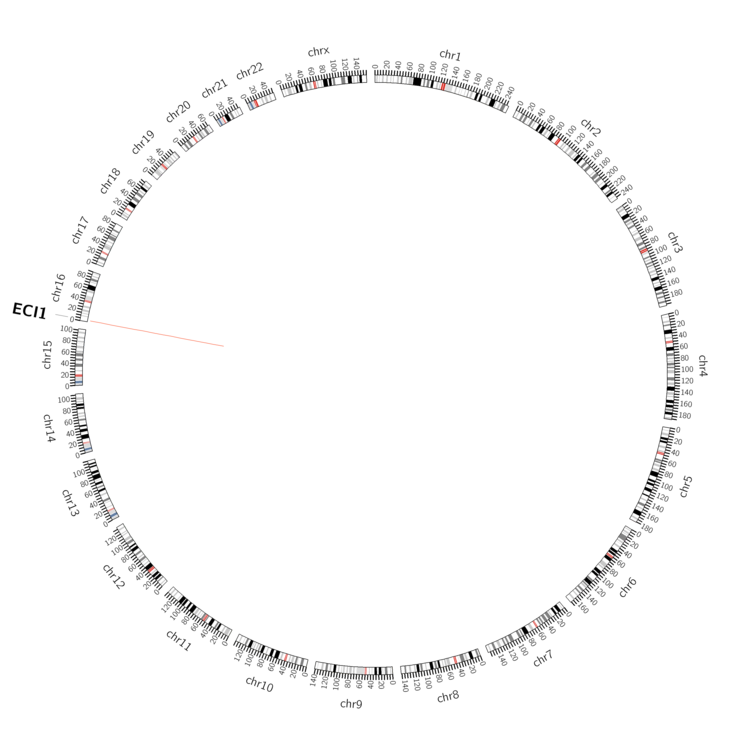
| Cytomap | UCSC genome browser: 16p13.3 | |
| Genomic location | chr16 :2289872-2301602 | |
| Type of gene | protein-coding | |
| RefGenes | NM_001178029.1, NM_001919.3, | |
| Ensembl id | ENSG00000167969 | |
| Description | 3,2 trans-enoyl-CoA isomerase3,2 trans-enoyl-Coenzyme A isomerase3,2-trans-enoyl-CoA isomerase, mitochondrialD3,D2-enoyl-CoA isomeraseacetylene-allene isomerasedelta(3),Delta(2)-enoyl-CoA isomerasedelta3, delta2-enoyl-CoA isomerasedodecenoyl-CoA de | |
| Modification date | 20141207 | |
| dbXrefs | MIM : 600305 | |
| HGNC : HGNC | ||
| Ensembl : ENSG00000167969 | ||
| HPRD : 02628 | ||
| Vega : OTTHUMG00000128830 | ||
| Protein | UniProt: go to UniProt's Cross Reference DB Table | |
| Expression | CleanEX: HS_ECI1 | |
| BioGPS: 1632 | ||
| Gene Expression Atlas: ENSG00000167969 | ||
| The Human Protein Atlas: ENSG00000167969 | ||
| Pathway | NCI Pathway Interaction Database: ECI1 | |
| KEGG: ECI1 | ||
| REACTOME: ECI1 | ||
| ConsensusPathDB | ||
| Pathway Commons: ECI1 | ||
| Metabolism | MetaCyc: ECI1 | |
| HUMANCyc: ECI1 | ||
| Regulation | Ensembl's Regulation: ENSG00000167969 | |
| miRBase: chr16 :2,289,872-2,301,602 | ||
| TargetScan: NM_001178029 | ||
| cisRED: ENSG00000167969 | ||
| Context | iHOP: ECI1 | |
| cancer metabolism search in PubMed: ECI1 | ||
| UCL Cancer Institute: ECI1 | ||
| Assigned class in ccmGDB | C | |
| Top |
| Phenotypic Information for ECI1(metabolism pathway, cancer, disease, phenome) |
| Cancer | CGAP: ECI1 |
| Familial Cancer Database: ECI1 | |
| * This gene is included in those cancer gene databases. |
|
|
|
|
|
|
| ||||||||||||||
Oncogene 1 | Significant driver gene in | |||||||||||||||||||
| cf) number; DB name 1 Oncogene; http://nar.oxfordjournals.org/content/35/suppl_1/D721.long, 2 Tumor Suppressor gene; https://bioinfo.uth.edu/TSGene/, 3 Cancer Gene Census; http://www.nature.com/nrc/journal/v4/n3/abs/nrc1299.html, 4 CancerGenes; http://nar.oxfordjournals.org/content/35/suppl_1/D721.long, 5 Network of Cancer Gene; http://ncg.kcl.ac.uk/index.php, 1Therapeutic Vulnerabilities in Cancer; http://cbio.mskcc.org/cancergenomics/statius/ |
| KEGG_FATTY_ACID_METABOLISM REACTOME_METABOLISM_OF_LIPIDS_AND_LIPOPROTEINS | |
| OMIM | |
| Orphanet | |
| Disease | KEGG Disease: ECI1 |
| MedGen: ECI1 (Human Medical Genetics with Condition) | |
| ClinVar: ECI1 | |
| Phenotype | MGI: ECI1 (International Mouse Phenotyping Consortium) |
| PhenomicDB: ECI1 | |
| Mutations for ECI1 |
| * Under tables are showing count per each tissue to give us broad intuition about tissue specific mutation patterns.You can go to the detailed page for each mutation database's web site. |
| - Statistics for Tissue and Mutation type | Top |
 |
| - For Inter-chromosomal Variations |
| There's no inter-chromosomal structural variation. |
| - For Intra-chromosomal Variations |
| * Intra-chromosomal variantions includes 'intrachromosomal amplicon to amplicon', 'intrachromosomal amplicon to non-amplified dna', 'intrachromosomal deletion', 'intrachromosomal fold-back inversion', 'intrachromosomal inversion', 'intrachromosomal tandem duplication', 'Intrachromosomal unknown type', 'intrachromosomal with inverted orientation', 'intrachromosomal with non-inverted orientation'. |
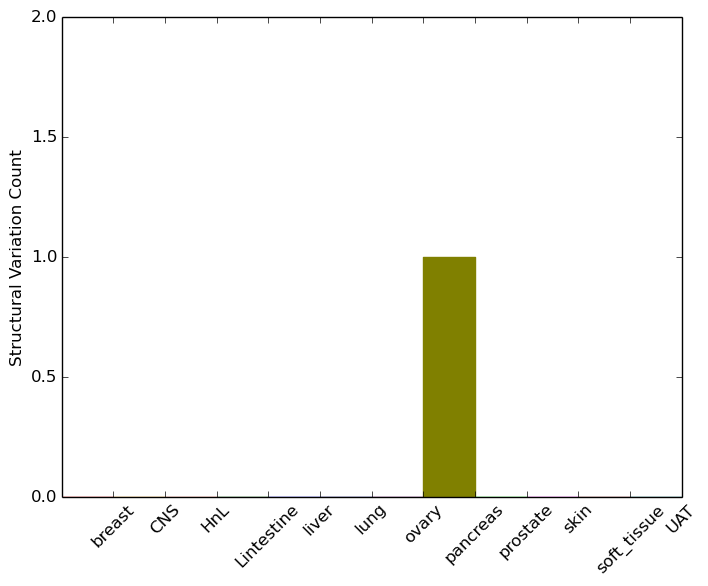 |
| Sample | Symbol_a | Chr_a | Start_a | End_a | Symbol_b | Chr_b | Start_b | End_b |
| pancreas | ECI1 | chr16 | 2294362 | 2294382 | ECI1 | chr16 | 2295692 | 2295712 |
| cf) Tissue number; Tissue name (1;Breast, 2;Central_nervous_system, 3;Haematopoietic_and_lymphoid_tissue, 4;Large_intestine, 5;Liver, 6;Lung, 7;Ovary, 8;Pancreas, 9;Prostate, 10;Skin, 11;Soft_tissue, 12;Upper_aerodigestive_tract) |
| * From mRNA Sanger sequences, Chitars2.0 arranged chimeric transcripts. This table shows ECI1 related fusion information. |
| ID | Head Gene | Tail Gene | Accession | Gene_a | qStart_a | qEnd_a | Chromosome_a | tStart_a | tEnd_a | Gene_a | qStart_a | qEnd_a | Chromosome_a | tStart_a | tEnd_a |
| BE388423 | MRPL4 | 8 | 598 | 19 | 10365262 | 10370405 | ECI1 | 599 | 654 | 16 | 2301515 | 2301572 | |
| Top |
| There's no copy number variation information in COSMIC data for this gene. |
| Top |
|
 |
| Top |
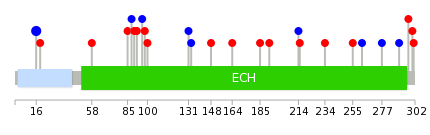
| Stat. for Non-Synonymous SNVs (# total SNVs=14) | (# total SNVs=10) |
 |  |
(# total SNVs=1) | (# total SNVs=0) |
 |
| Top |
| * When you move the cursor on each content, you can see more deailed mutation information on the Tooltip. Those are primary_site,primary_histology,mutation(aa),pubmedID. |
| GRCh37 position | Mutation(aa) | Unique sampleID count |
| chr16:2301520-2301520 | p.R16R | 3 |
| chr16:2294451-2294451 | p.L133L | 1 |
| chr16:2290114-2290114 | p.R259* | 1 |
| chr16:2294455-2294455 | p.L131L | 1 |
| chr16:2290126-2290126 | p.K255E | 1 |
| chr16:2294550-2294550 | p.R100C | 1 |
| chr16:2290147-2290147 | p.? | 1 |
| chr16:2296861-2296861 | p.S98W | 1 |
| chr16:2289988-2289988 | p.K301E | 1 |
| chr16:2293088-2293088 | p.S234N | 1 |
| Top |
|
 |
| Point Mutation/ Tissue ID | 1 | 2 | 3 | 4 | 5 | 6 | 7 | 8 | 9 | 10 | 11 | 12 | 13 | 14 | 15 | 16 | 17 | 18 | 19 | 20 |
| # sample | 1 | 6 | 1 | 3 | 1 | 2 | 2 | |||||||||||||
| # mutation | 1 | 6 | 1 | 3 | 1 | 2 | 3 | |||||||||||||
| nonsynonymous SNV | 3 | 1 | 2 | 1 | 1 | 1 | ||||||||||||||
| synonymous SNV | 1 | 3 | 1 | 1 | 2 |
| cf) Tissue ID; Tissue type (1; BLCA[Bladder Urothelial Carcinoma], 2; BRCA[Breast invasive carcinoma], 3; CESC[Cervical squamous cell carcinoma and endocervical adenocarcinoma], 4; COAD[Colon adenocarcinoma], 5; GBM[Glioblastoma multiforme], 6; Glioma Low Grade, 7; HNSC[Head and Neck squamous cell carcinoma], 8; KICH[Kidney Chromophobe], 9; KIRC[Kidney renal clear cell carcinoma], 10; KIRP[Kidney renal papillary cell carcinoma], 11; LAML[Acute Myeloid Leukemia], 12; LUAD[Lung adenocarcinoma], 13; LUSC[Lung squamous cell carcinoma], 14; OV[Ovarian serous cystadenocarcinoma ], 15; PAAD[Pancreatic adenocarcinoma], 16; PRAD[Prostate adenocarcinoma], 17; SKCM[Skin Cutaneous Melanoma], 18:STAD[Stomach adenocarcinoma], 19:THCA[Thyroid carcinoma], 20:UCEC[Uterine Corpus Endometrial Carcinoma]) |
| Top |
| * We represented just top 10 SNVs. When you move the cursor on each content, you can see more deailed mutation information on the Tooltip. Those are primary_site, primary_histology, mutation(aa), pubmedID. |
| Genomic Position | Mutation(aa) | Unique sampleID count |
| chr16:2293392 | p.S98S,ECI1 | 1 |
| chr16:2293439 | p.L96L,ECI1 | 1 |
| chr16:2294451 | p.S90C,ECI1 | 1 |
| chr16:2289989 | p.K63N,ECI1 | 1 |
| chr16:2294455 | p.E283D,ECI1 | 1 |
| chr16:2290000 | p.A58T,ECI1 | 1 |
| chr16:2296861 | p.L280I,ECI1 | 1 |
| chr16:2290058 | p.R16R,ECI1 | 1 |
| chr16:2296868 | p.F260F,ECI1 | 1 |
| chr16:2290103 | p.T245T,ECI1 | 1 |
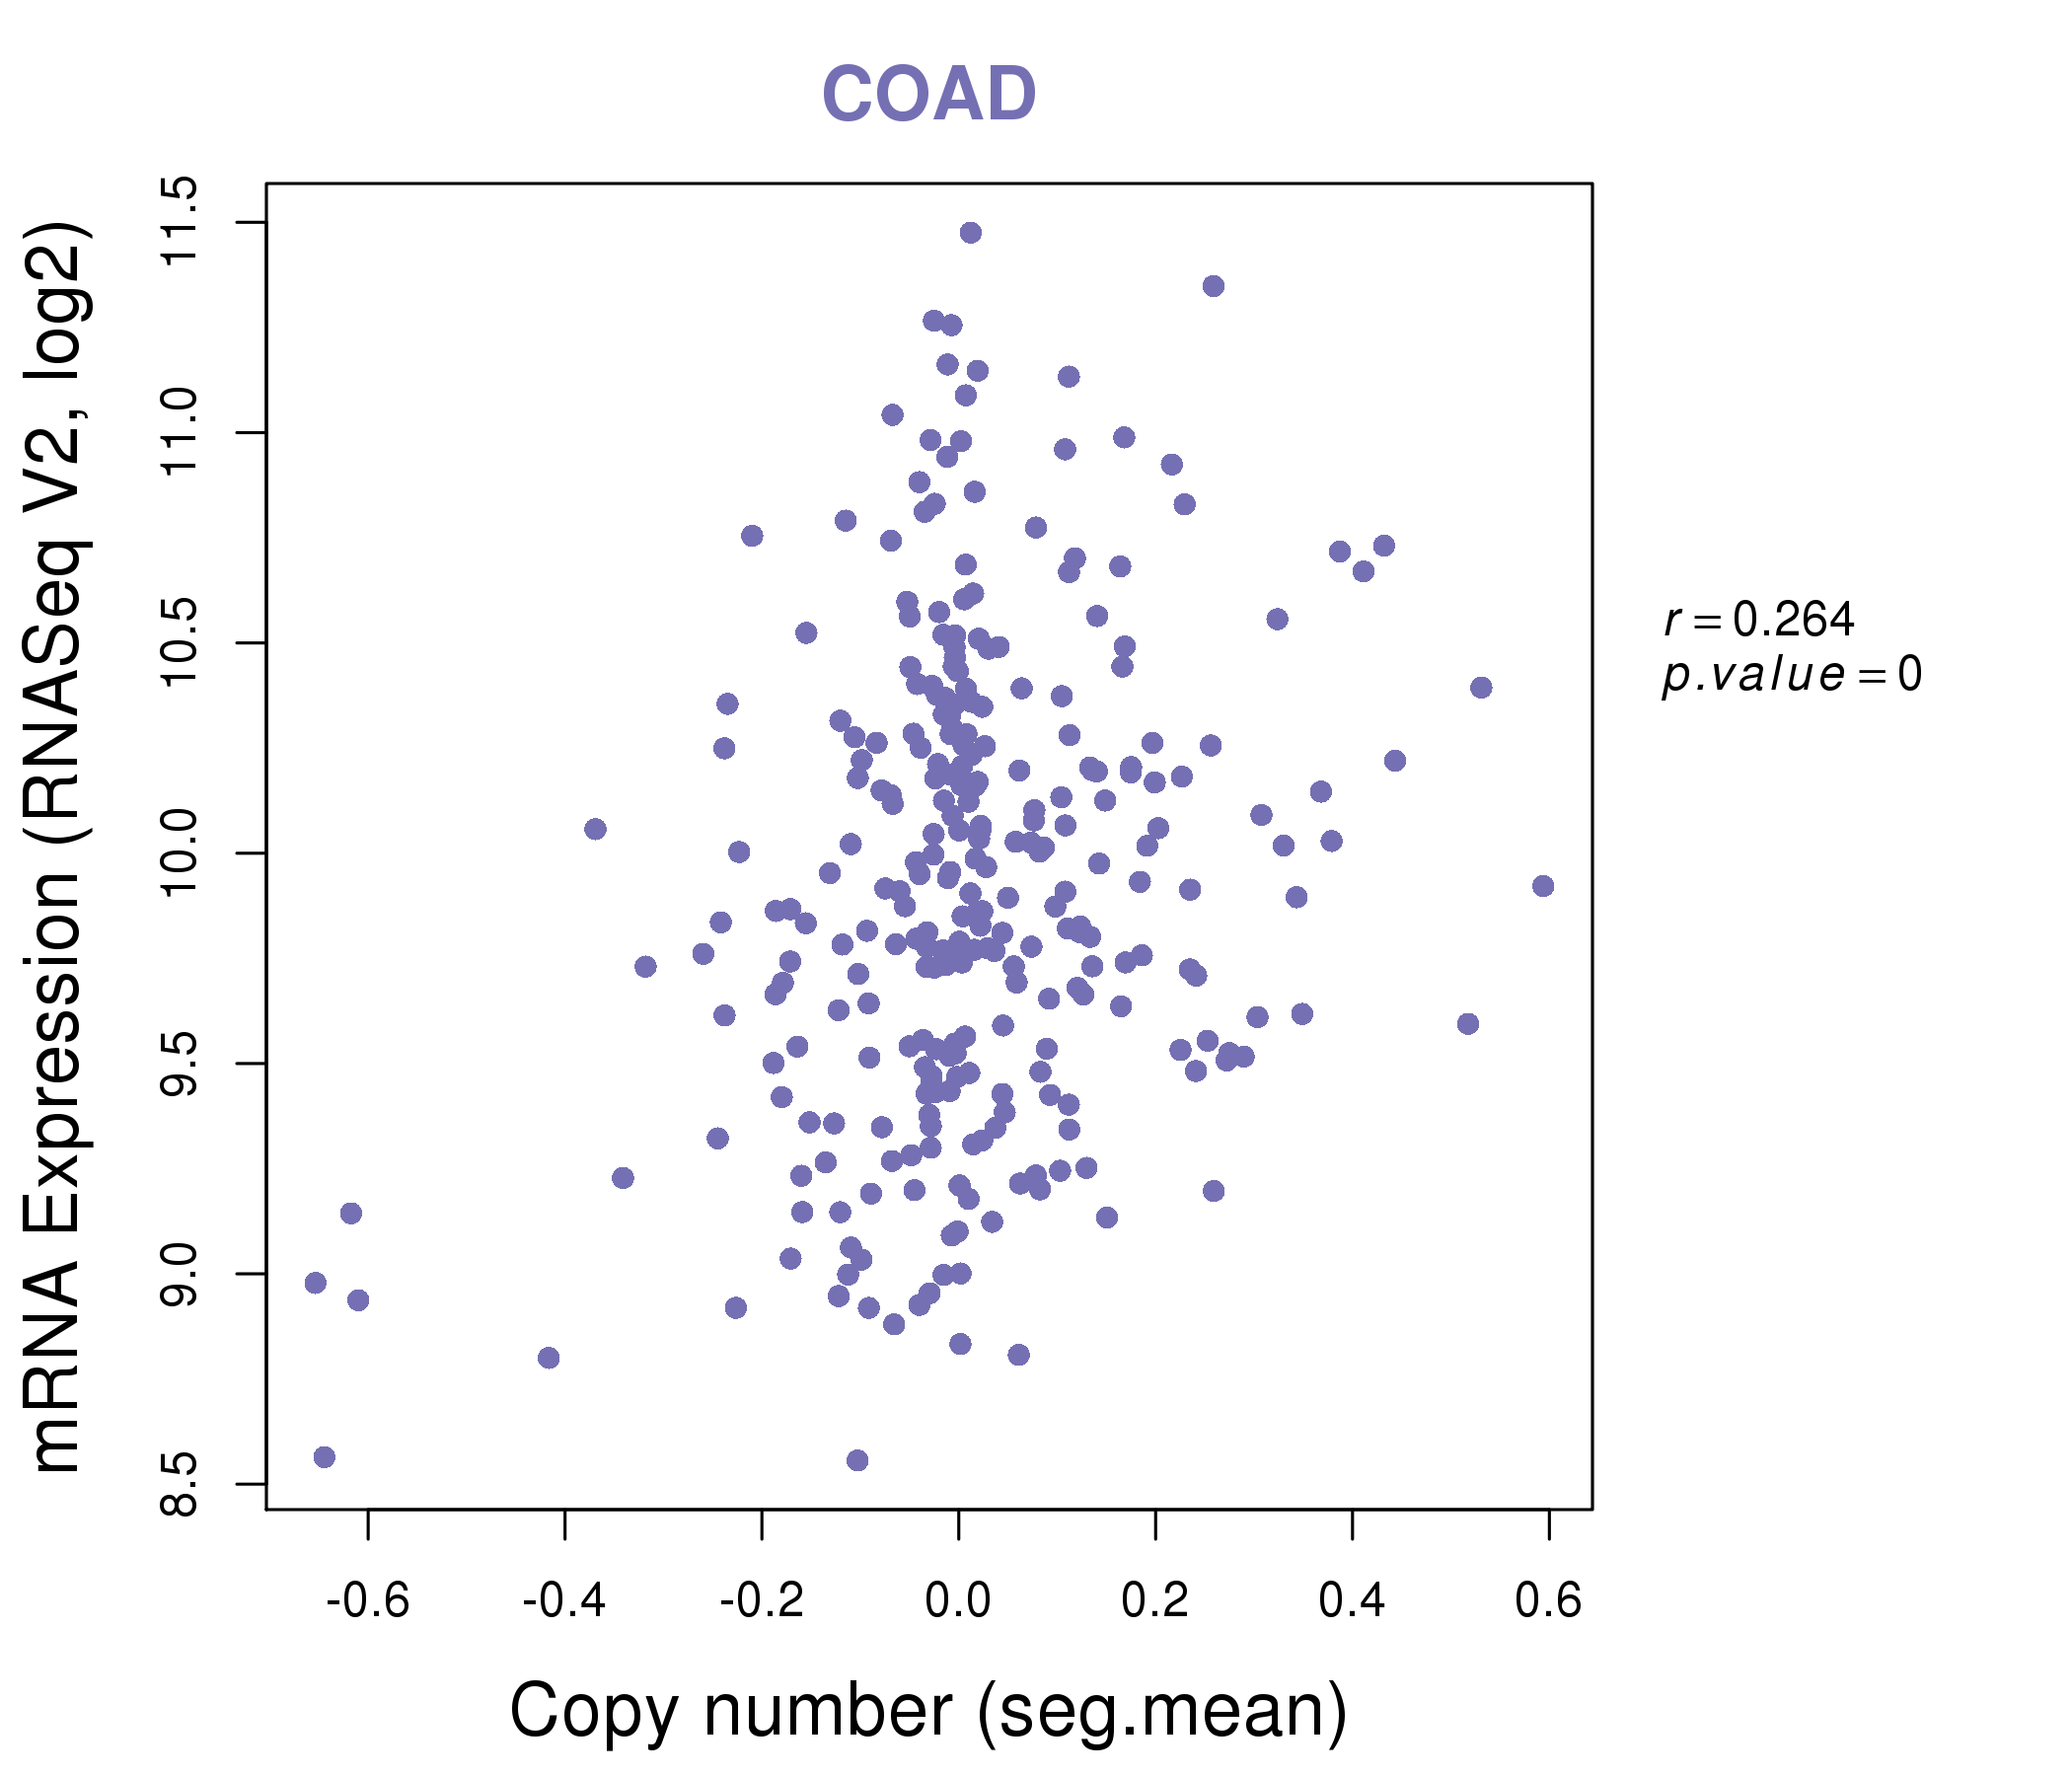
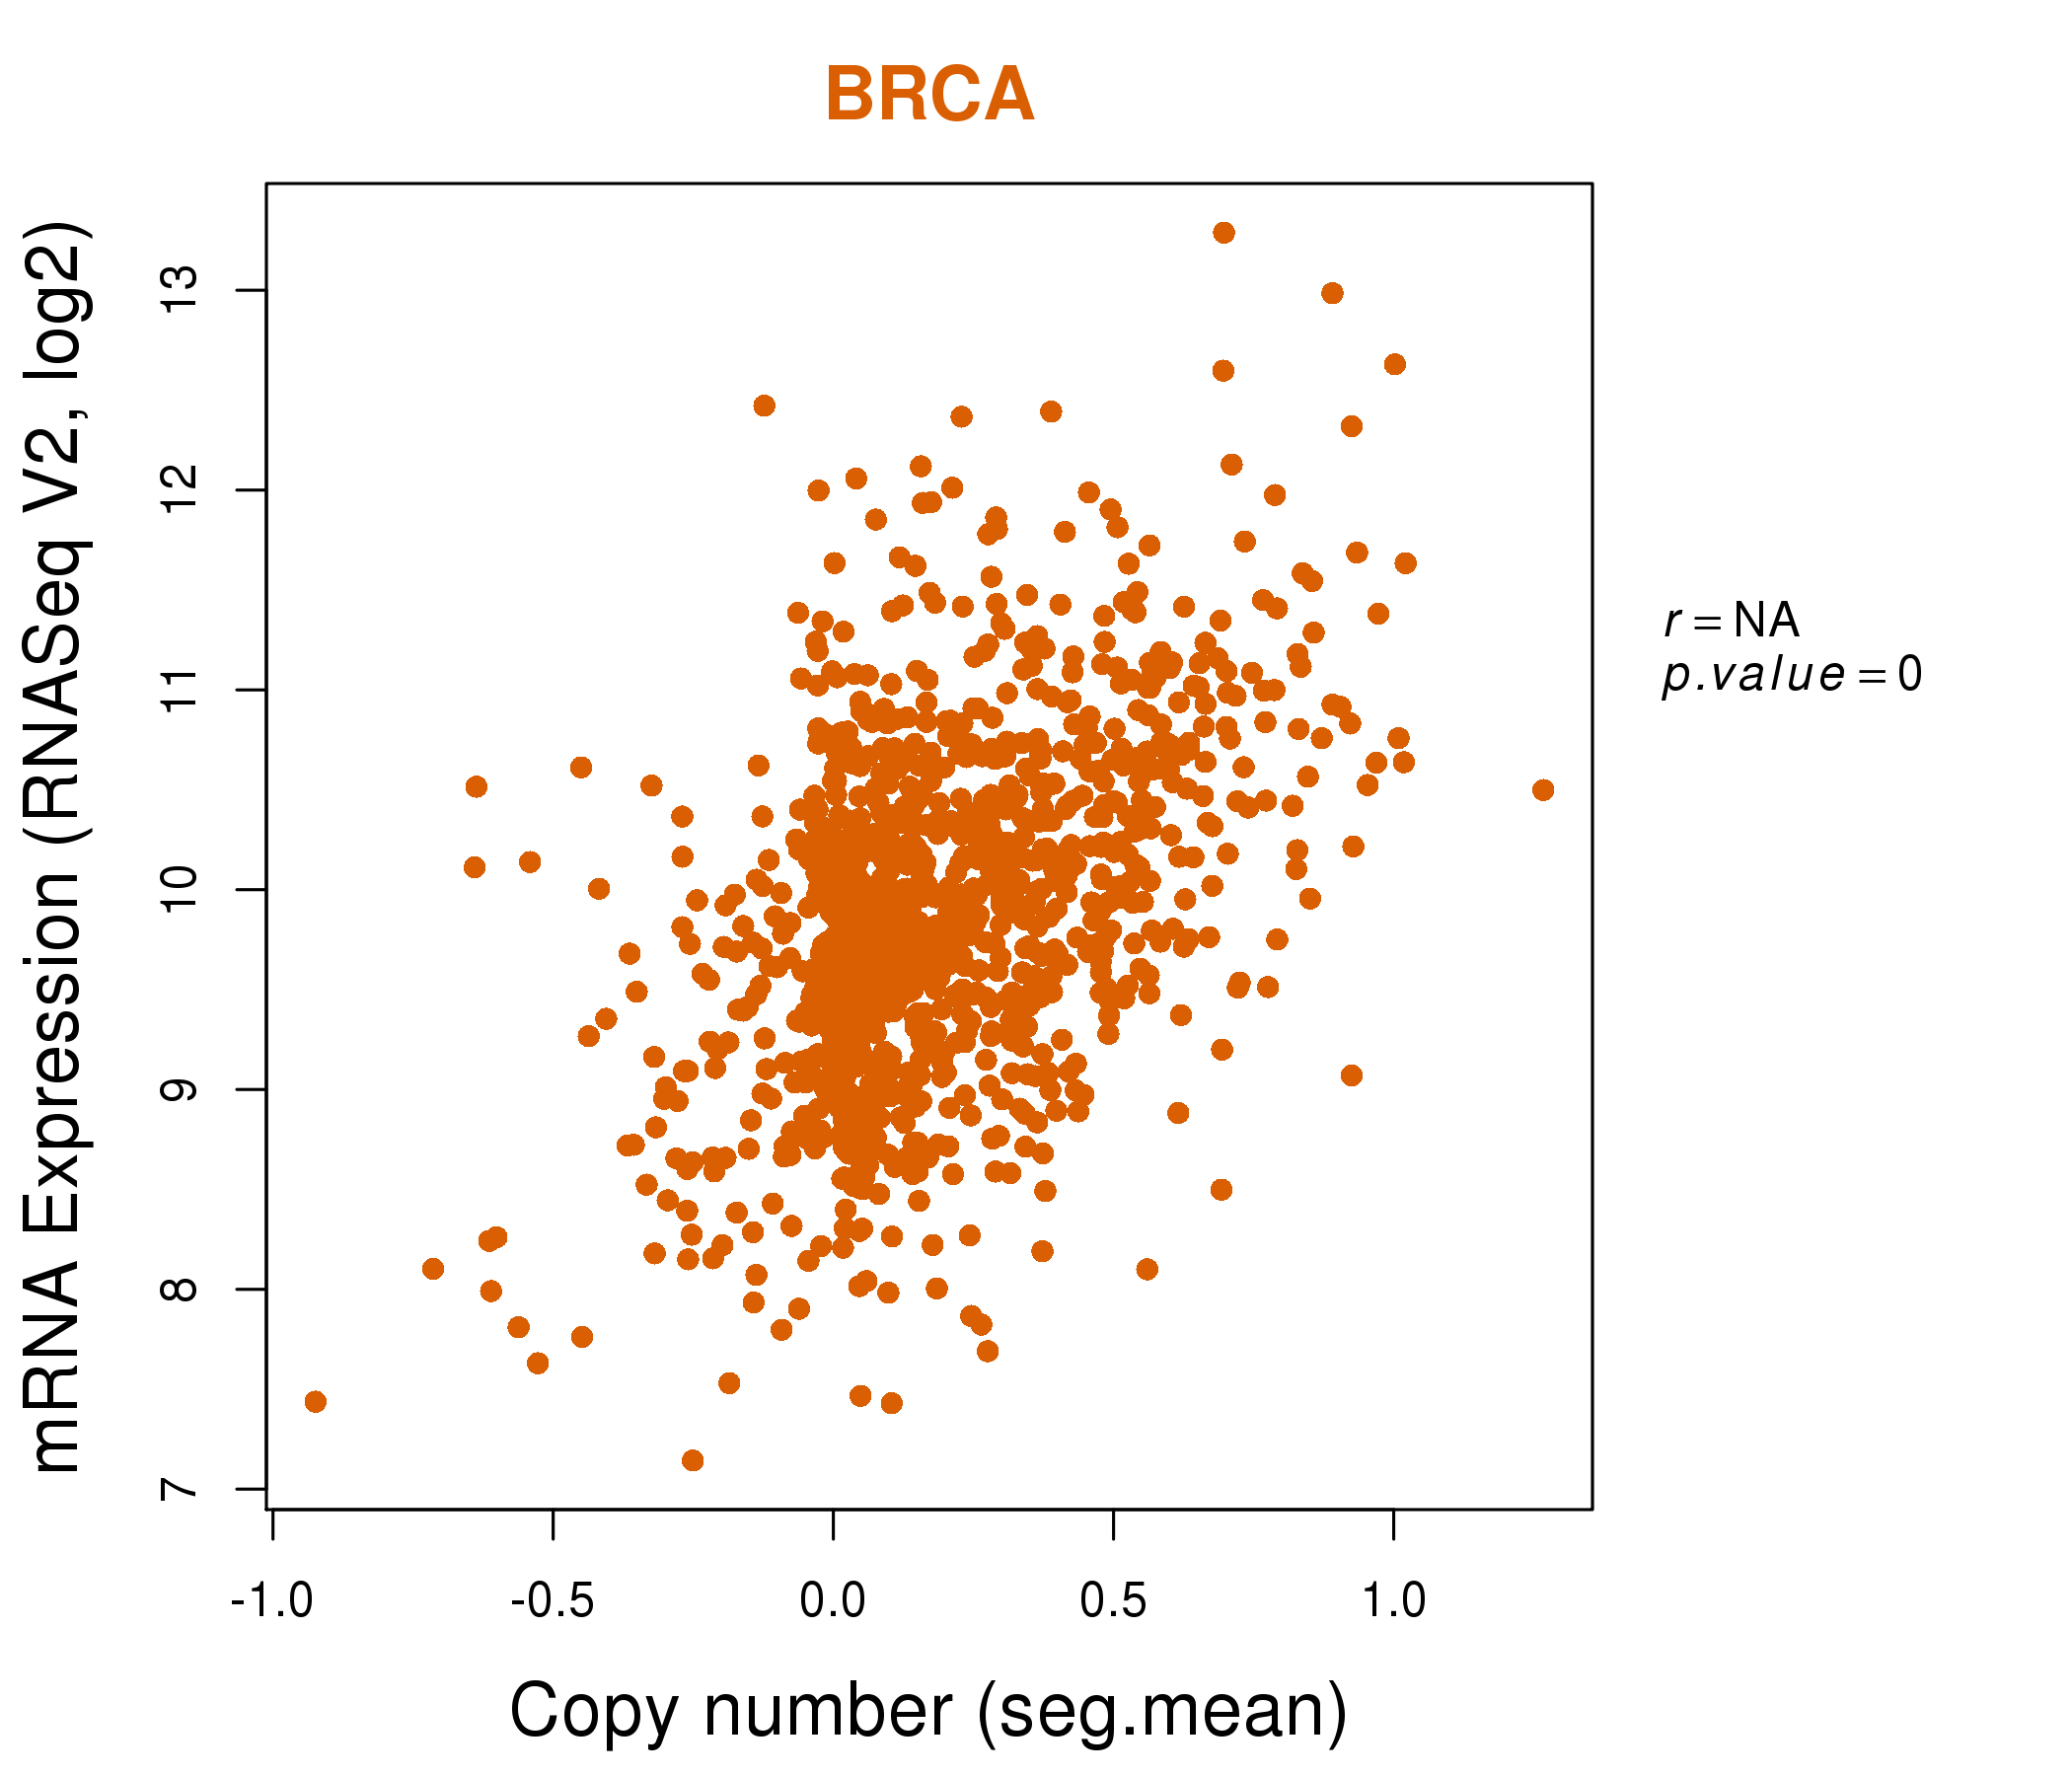
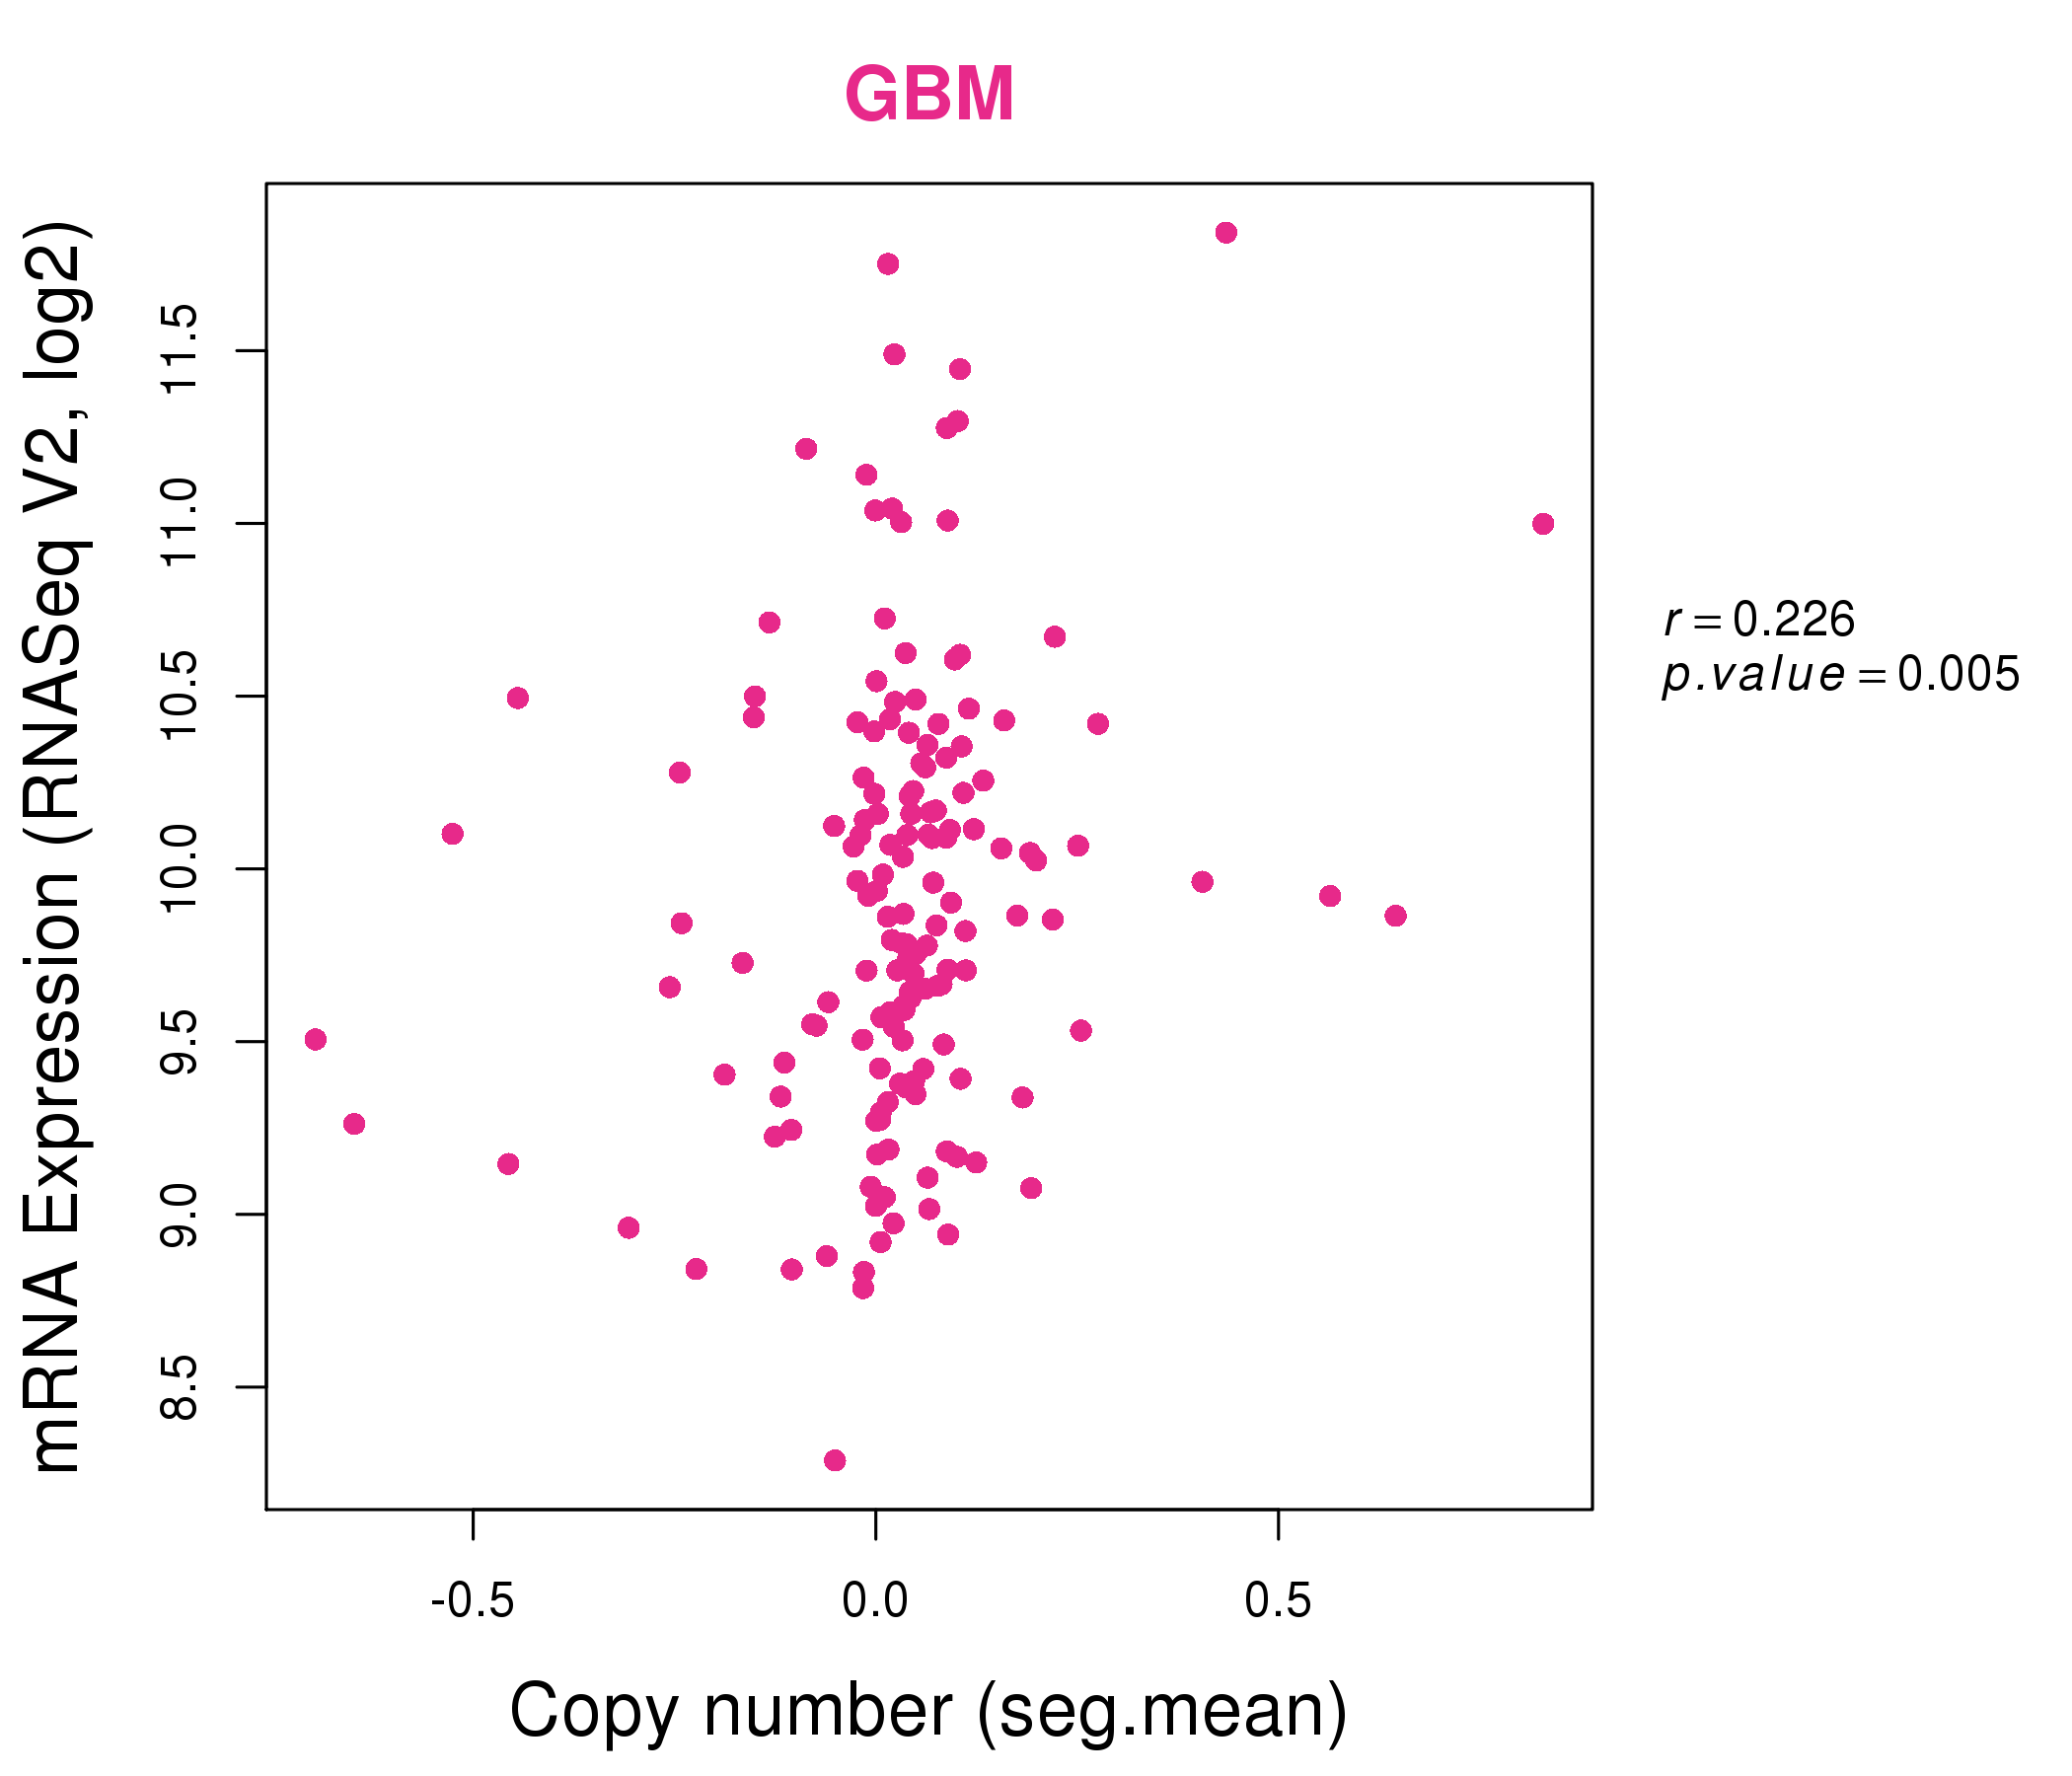
| * Copy number data were extracted from TCGA using R package TCGA-Assembler. The URLs of all public data files on TCGA DCC data server were gathered on Jan-05-2015. Function ProcessCNAData in TCGA-Assembler package was used to obtain gene-level copy number value which is calculated as the average copy number of the genomic region of a gene. |
 |
| cf) Tissue ID[Tissue type]: BLCA[Bladder Urothelial Carcinoma], BRCA[Breast invasive carcinoma], CESC[Cervical squamous cell carcinoma and endocervical adenocarcinoma], COAD[Colon adenocarcinoma], GBM[Glioblastoma multiforme], Glioma Low Grade, HNSC[Head and Neck squamous cell carcinoma], KICH[Kidney Chromophobe], KIRC[Kidney renal clear cell carcinoma], KIRP[Kidney renal papillary cell carcinoma], LAML[Acute Myeloid Leukemia], LUAD[Lung adenocarcinoma], LUSC[Lung squamous cell carcinoma], OV[Ovarian serous cystadenocarcinoma ], PAAD[Pancreatic adenocarcinoma], PRAD[Prostate adenocarcinoma], SKCM[Skin Cutaneous Melanoma], STAD[Stomach adenocarcinoma], THCA[Thyroid carcinoma], UCEC[Uterine Corpus Endometrial Carcinoma] |
| Top |
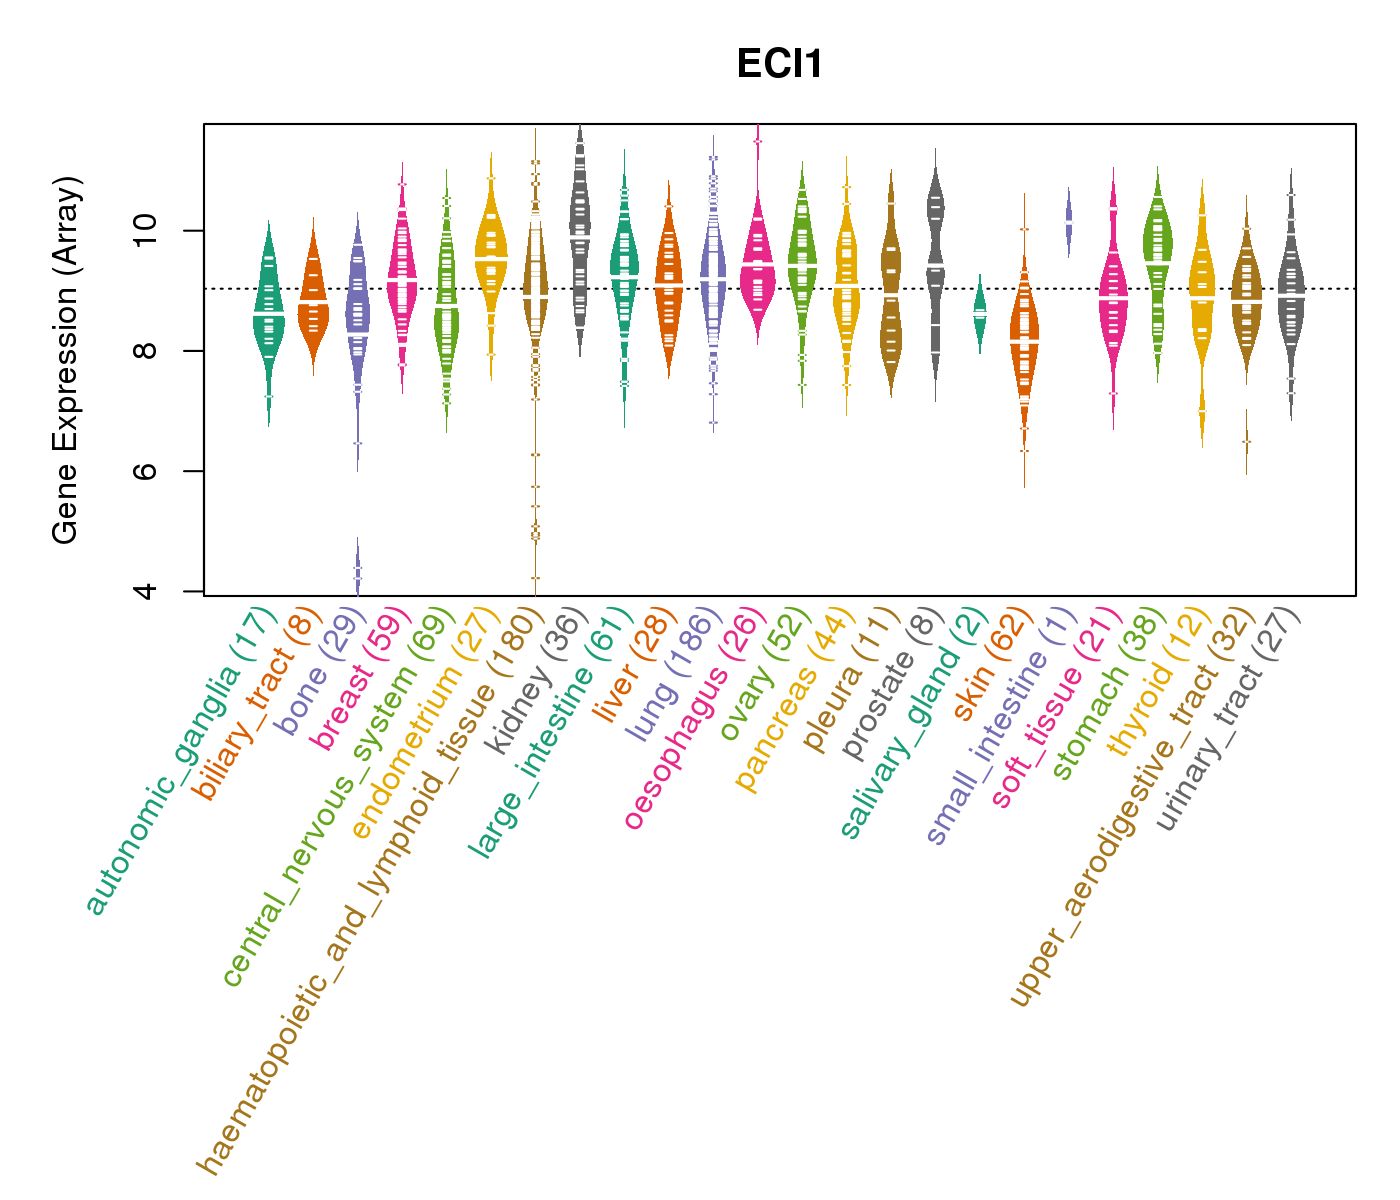
| Gene Expression for ECI1 |
| * CCLE gene expression data were extracted from CCLE_Expression_Entrez_2012-10-18.res: Gene-centric RMA-normalized mRNA expression data. |
 |
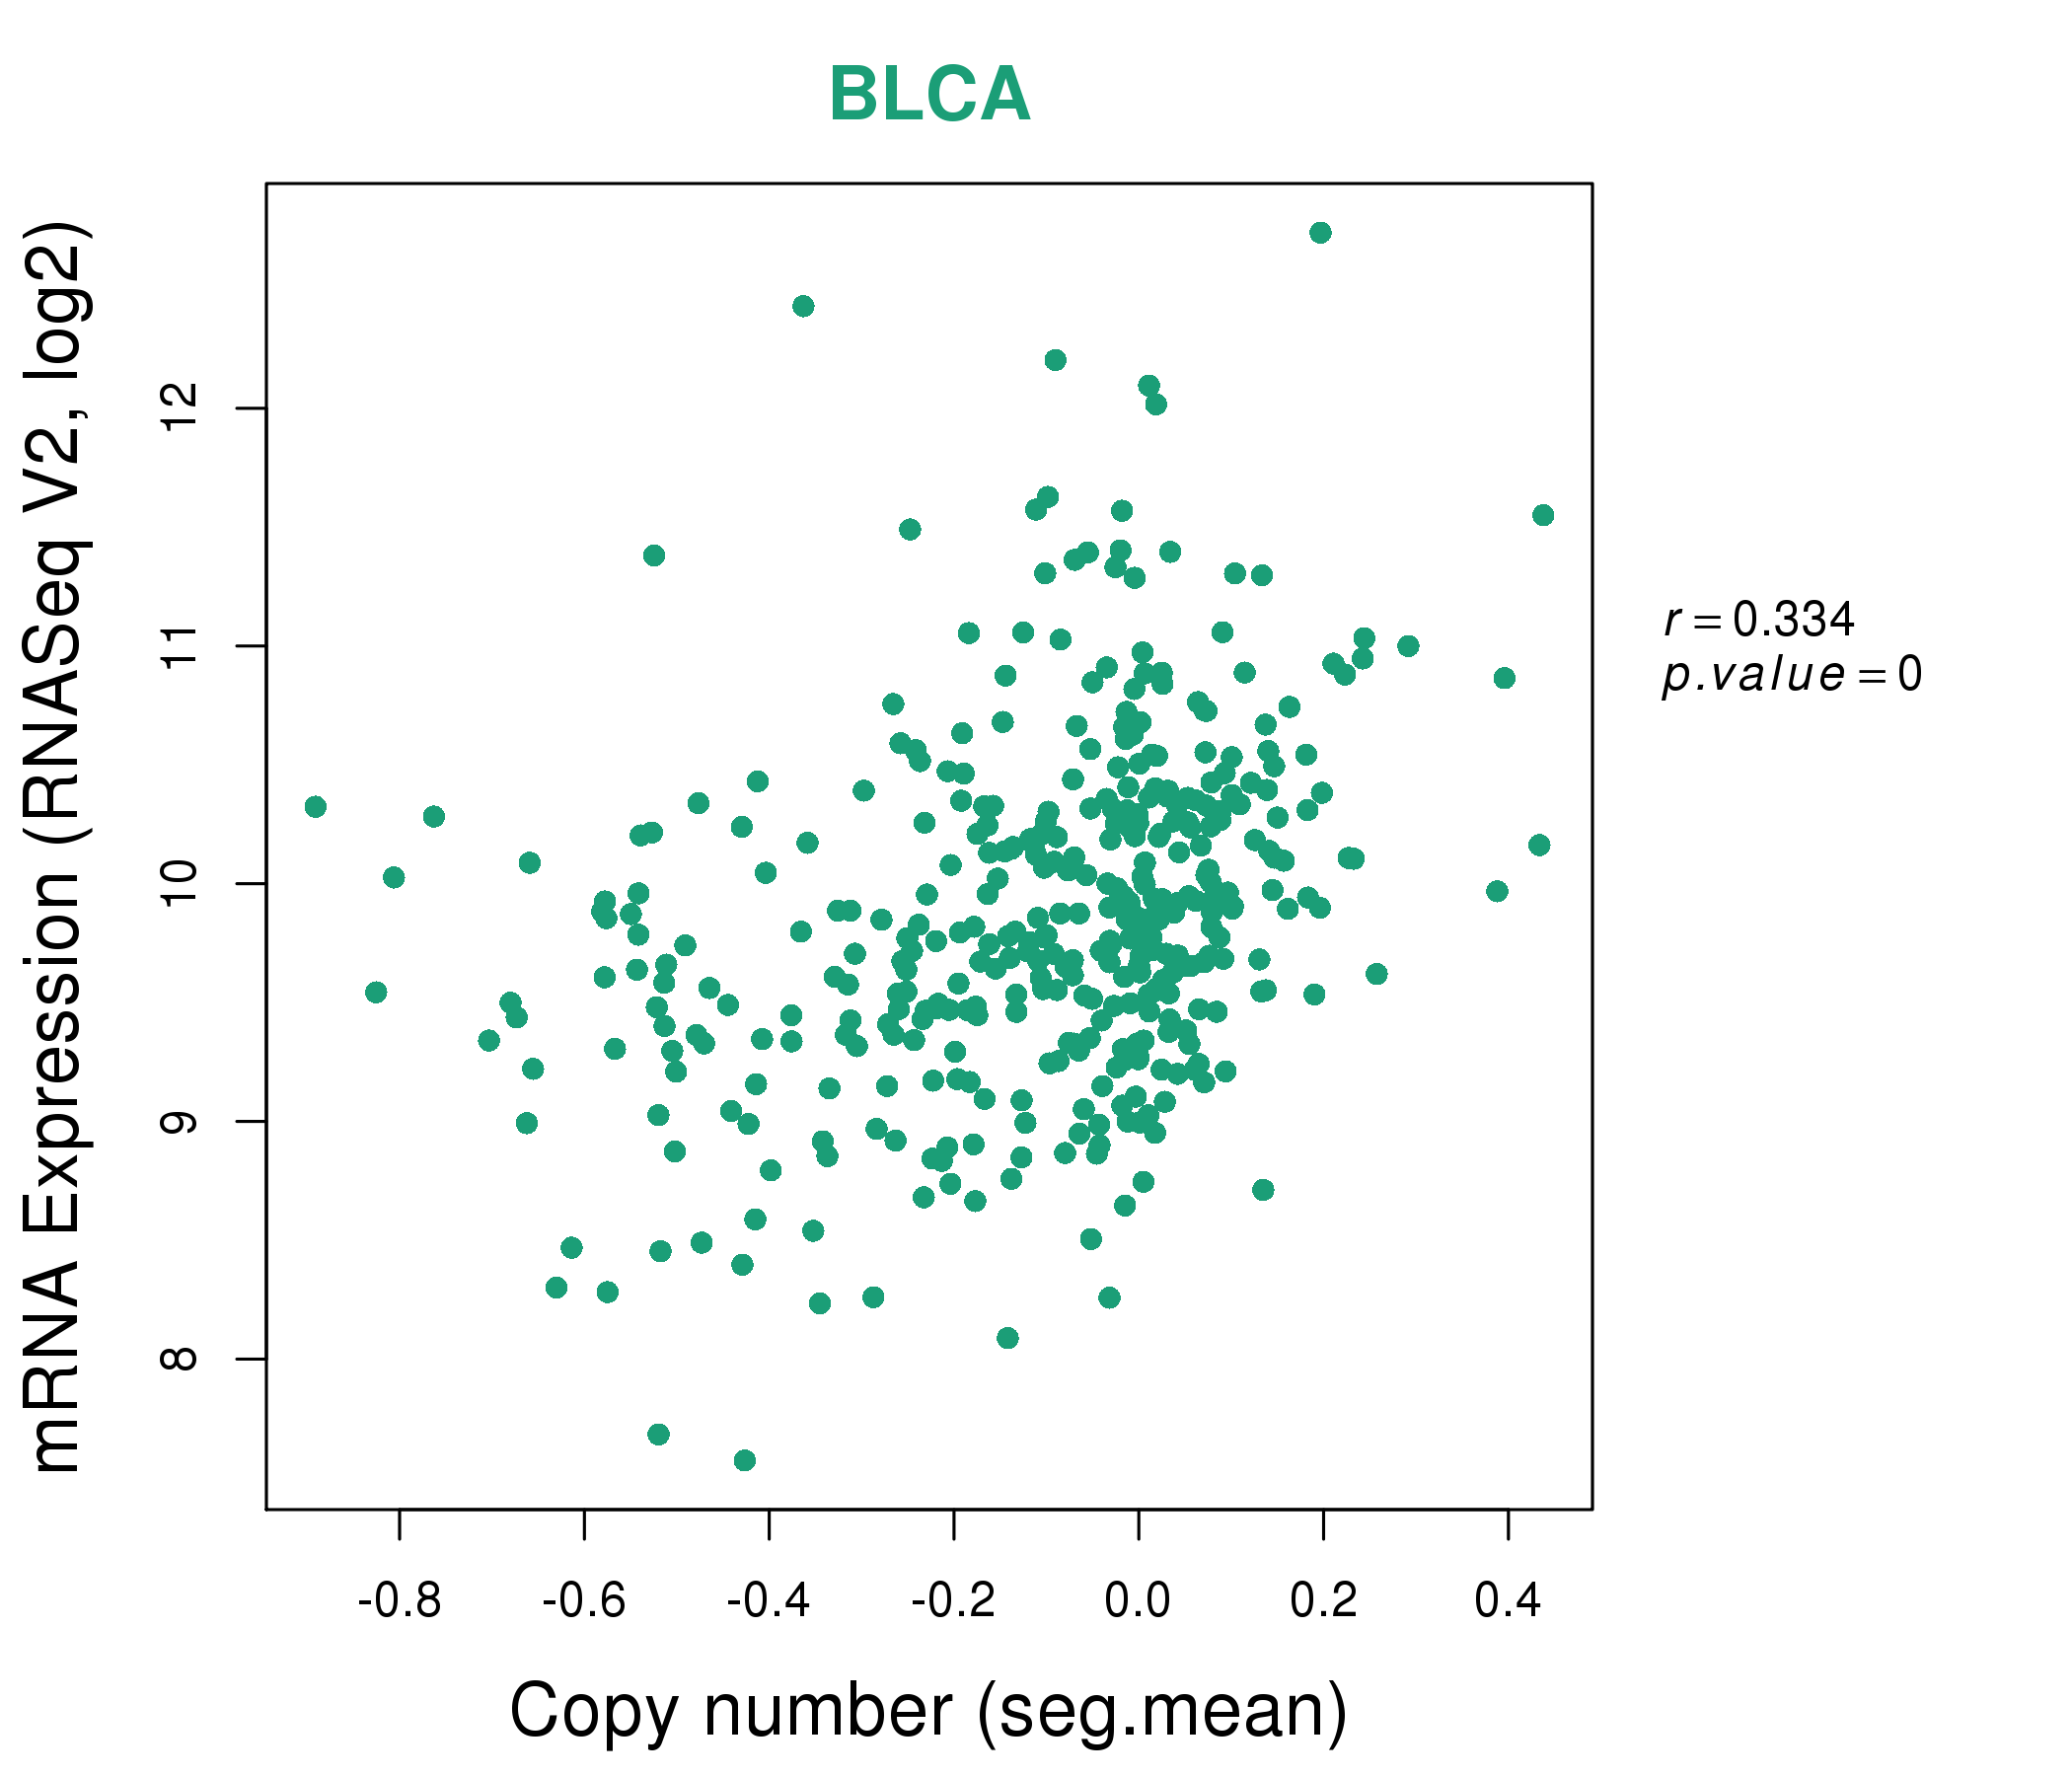
| * Normalized gene expression data of RNASeqV2 was extracted from TCGA using R package TCGA-Assembler. The URLs of all public data files on TCGA DCC data server were gathered at Jan-05-2015. Only eight cancer types have enough normal control samples for differential expression analysis. (t test, adjusted p<0.05 (using Benjamini-Hochberg FDR)) |
 |
| Top |
| * This plots show the correlation between CNV and gene expression. |
: Open all plots for all cancer types
 |
|
 |
|
| Top |
| Gene-Gene Network Information |
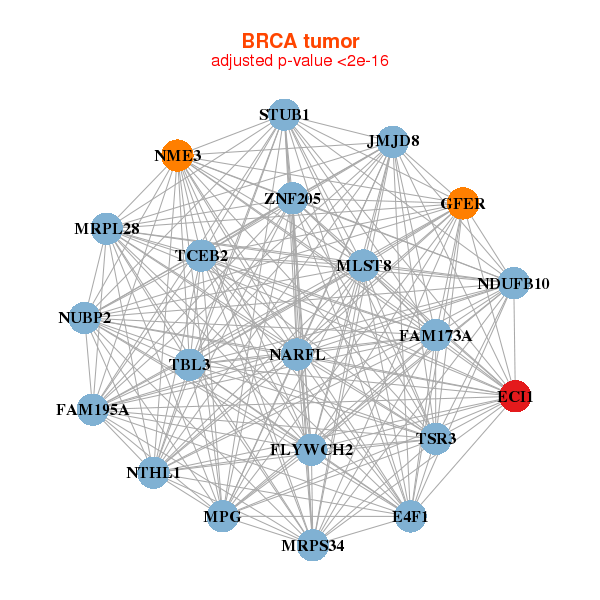
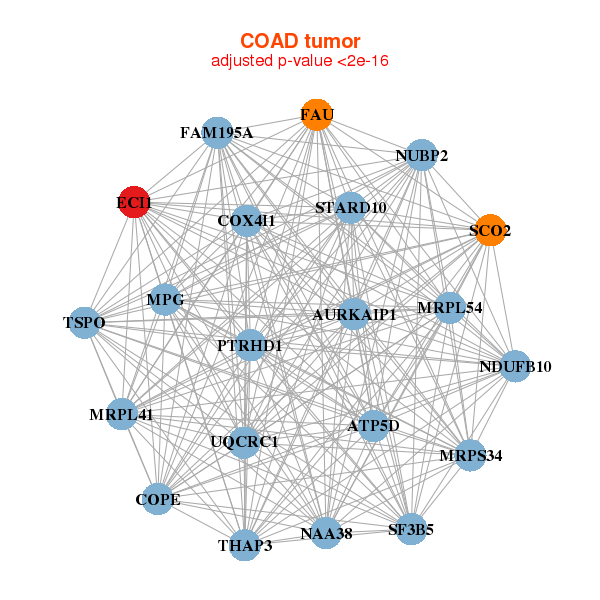
| * Co-Expression network figures were drawn using R package igraph. Only the top 20 genes with the highest correlations were shown. Red circle: input gene, orange circle: cell metabolism gene, sky circle: other gene |
: Open all plots for all cancer types
 |
| ||||
| TSR3,ECI1,E4F1,FAM173A,FAM195A,FLYWCH2,GFER, JMJD8,MLST8,MPG,MRPL28,MRPS34,NARFL,NDUFB10, NME3,NTHL1,NUBP2,STUB1,TBL3,TCEB2,ZNF205 | ATP5D,BCKDHA,CLPP,COX4I1,ECI1,ECSIT,FAM195A, HSF1,IDH3B,MRPL12,MRPL2,MRPL38,MRPL41,MRPS18A, NDUFA13,NDUFV1,POLR2I,PPP1R16A,THAP4,PAM16,TUFM | ||||
 |
| ||||
| ATP5D,AURKAIP1,PTRHD1,COPE,COX4I1,ECI1,FAM195A, FAU,NAA38,MPG,MRPL41,MRPL54,MRPS34,NDUFB10, NUBP2,SCO2,SF3B5,STARD10,THAP3,TSPO,UQCRC1 | ALKBH7,MPC2,C15orf61,WDR83OS,RPP25L,CISD3,COX4I1, COX5B,ECI1,DUSP23,FAM98C,IMP3,MED11,NDUFA2, NDUFB10,SDHAF1,STK16,TEX264,TMEM134,TMEM219,ZNHIT1 |
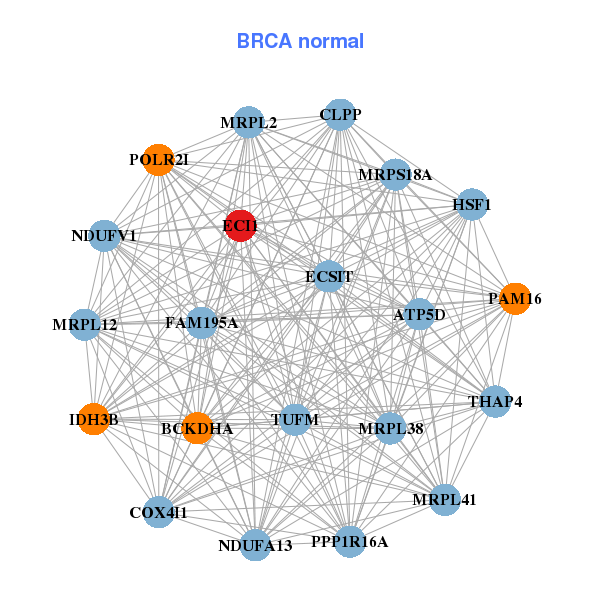
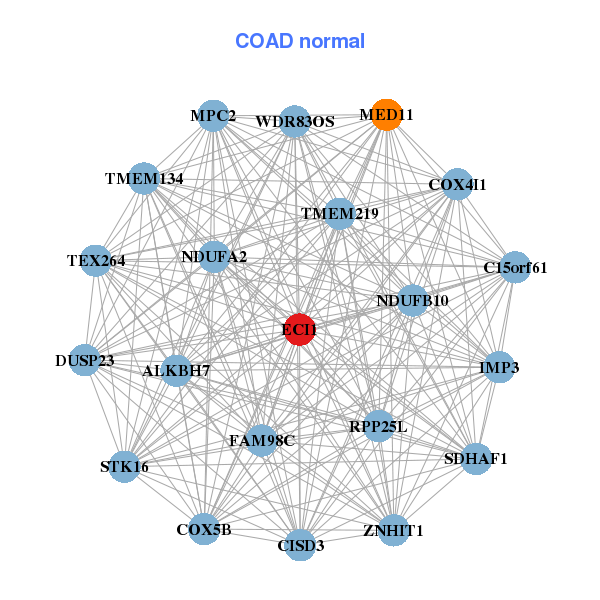
| * Co-Expression network figures were drawn using R package igraph. Only the top 20 genes with the highest correlations were shown. Red circle: input gene, orange circle: cell metabolism gene, sky circle: other gene |
: Open all plots for all cancer types
| Top |
: Open all interacting genes' information including KEGG pathway for all interacting genes from DAVID
| Top |
| Pharmacological Information for ECI1 |
| DB Category | DB Name | DB's ID and Url link |
| * Gene Centered Interaction Network. |
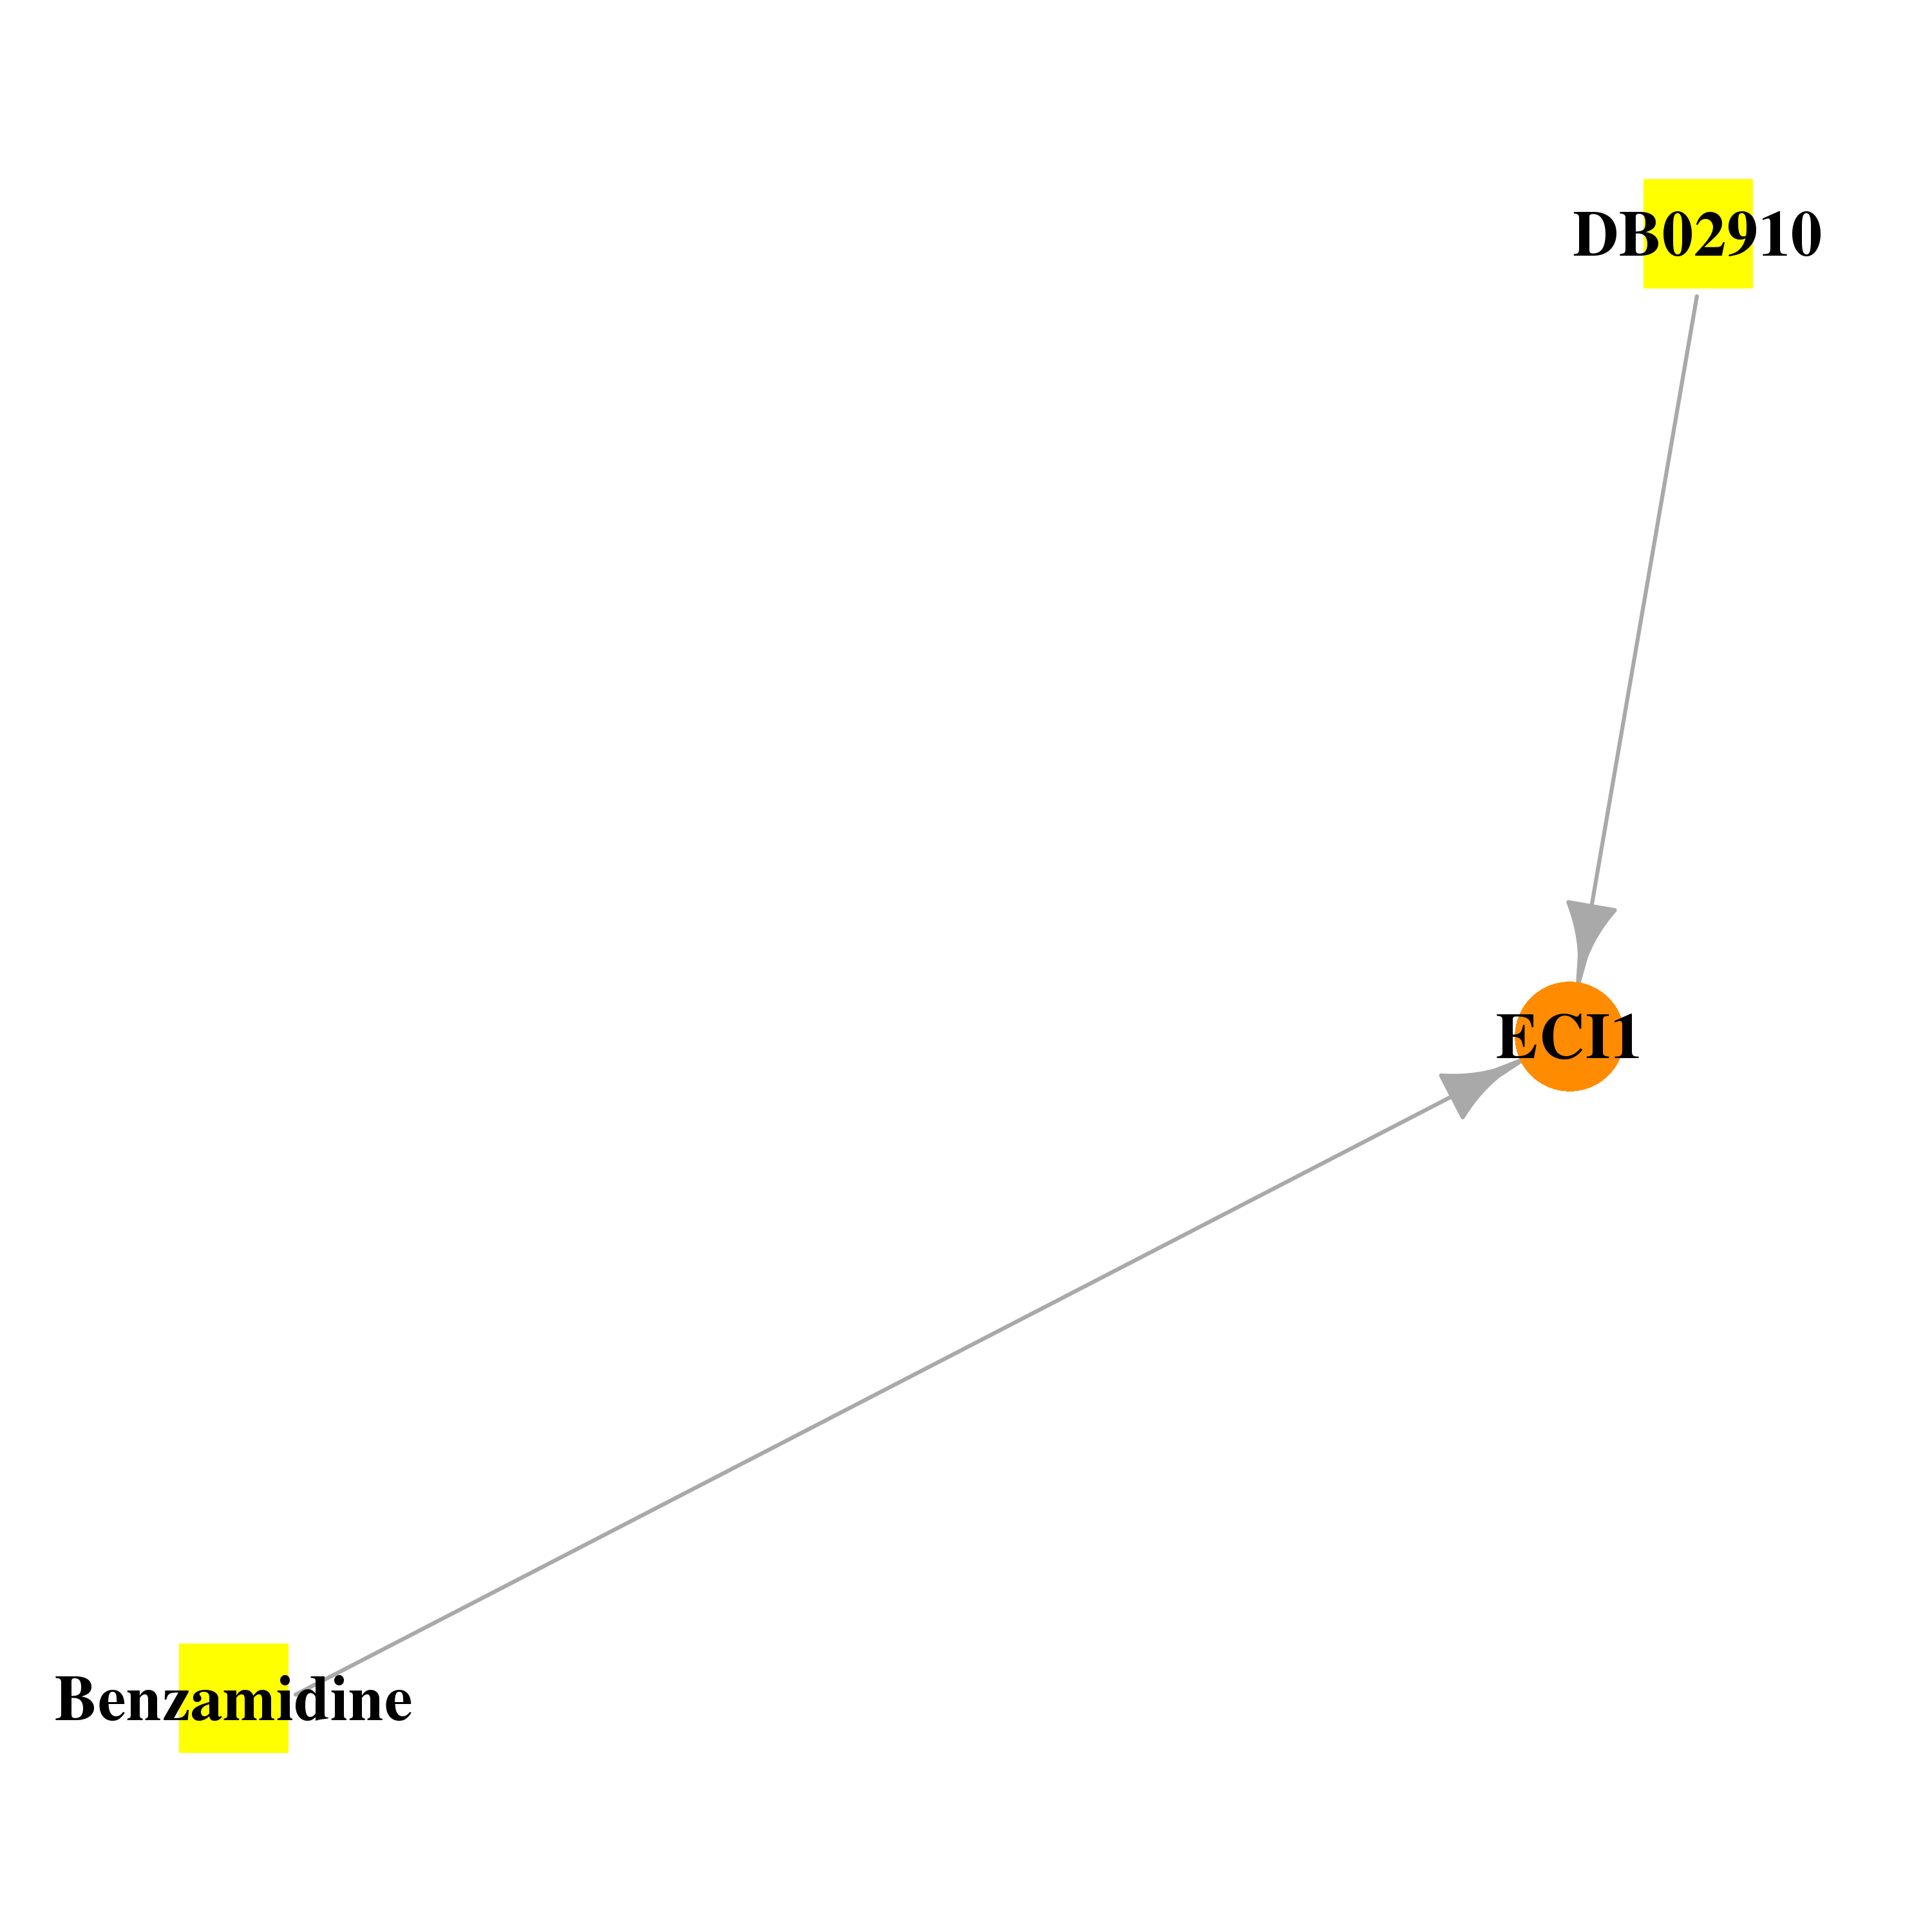 |
| * Drug Centered Interaction Network. |
| DrugBank ID | Target Name | Drug Groups | Generic Name | Drug Centered Network | Drug Structure |
| DB02910 | enoyl-CoA delta isomerase 1 | experimental | Octanoyl-Coenzyme A | 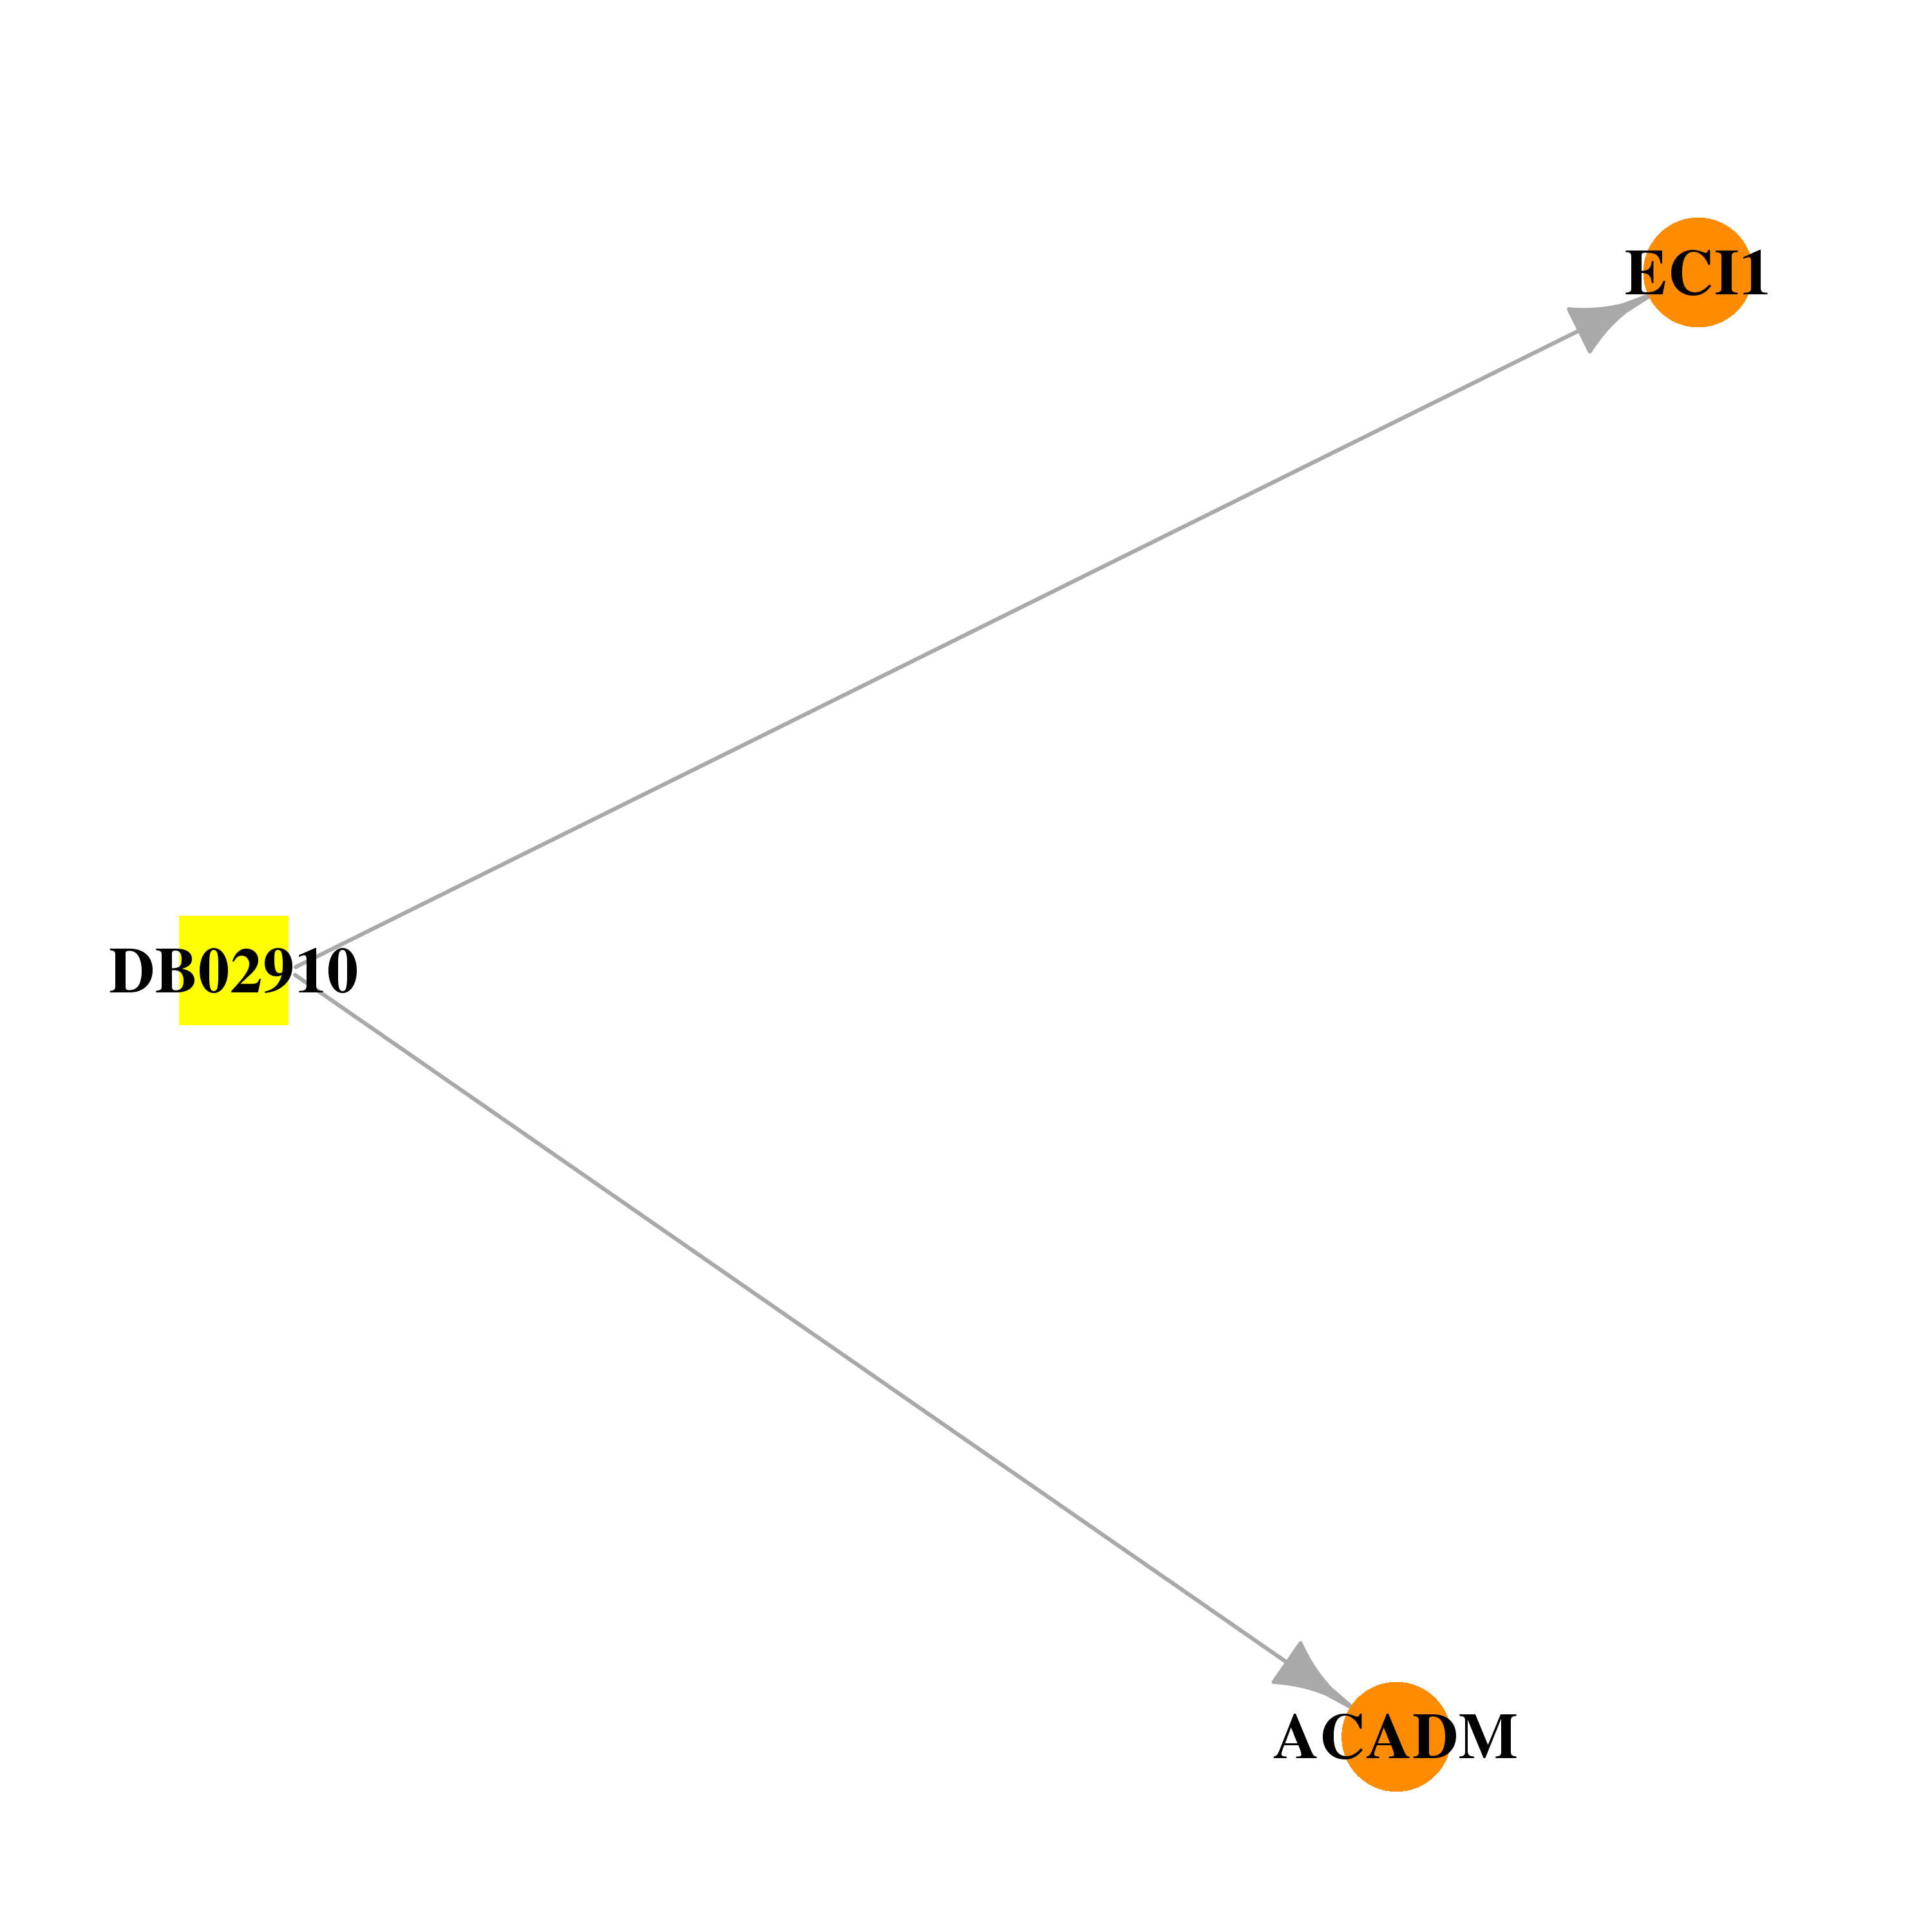 | 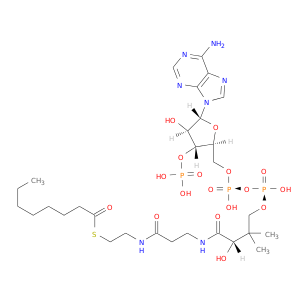 |
| DB03127 | enoyl-CoA delta isomerase 1 | experimental | Benzamidine |  | 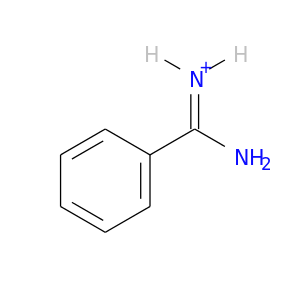 |
| Top |
| Cross referenced IDs for ECI1 |
| * We obtained these cross-references from Uniprot database. It covers 150 different DBs, 18 categories. http://www.uniprot.org/help/cross_references_section |
: Open all cross reference information
|
Copyright © 2016-Present - The Univsersity of Texas Health Science Center at Houston @ |