|
||||||||||||||||||||
| |
| Phenotypic Information (metabolism pathway, cancer, disease, phenome) |
| |
| |
| Gene-Gene Network Information: Co-Expression Network, Interacting Genes & KEGG |
| |
|


| Gene Summary for DCN |
| Top |
| Phenotypic Information for DCN(metabolism pathway, cancer, disease, phenome) |
| Cancer | CGAP: DCN |
| Familial Cancer Database: DCN | |
| * This gene is included in those cancer gene databases. |
|
|
|
|
|
| . | ||||||||||||||
Oncogene 1 | Significant driver gene in | |||||||||||||||||||
| cf) number; DB name 1 Oncogene; http://nar.oxfordjournals.org/content/35/suppl_1/D721.long, 2 Tumor Suppressor gene; https://bioinfo.uth.edu/TSGene/, 3 Cancer Gene Census; http://www.nature.com/nrc/journal/v4/n3/abs/nrc1299.html, 4 CancerGenes; http://nar.oxfordjournals.org/content/35/suppl_1/D721.long, 5 Network of Cancer Gene; http://ncg.kcl.ac.uk/index.php, 1Therapeutic Vulnerabilities in Cancer; http://cbio.mskcc.org/cancergenomics/statius/ |
| REACTOME_METABOLISM_OF_CARBOHYDRATES | |
| OMIM | |
| Orphanet | |
| Disease | KEGG Disease: DCN |
| MedGen: DCN (Human Medical Genetics with Condition) | |
| ClinVar: DCN | |
| Phenotype | MGI: DCN (International Mouse Phenotyping Consortium) |
| PhenomicDB: DCN | |
| Mutations for DCN |
| * Under tables are showing count per each tissue to give us broad intuition about tissue specific mutation patterns.You can go to the detailed page for each mutation database's web site. |
| There's no structural variation information in COSMIC data for this gene. |
| * From mRNA Sanger sequences, Chitars2.0 arranged chimeric transcripts. This table shows DCN related fusion information. |
| ID | Head Gene | Tail Gene | Accession | Gene_a | qStart_a | qEnd_a | Chromosome_a | tStart_a | tEnd_a | Gene_a | qStart_a | qEnd_a | Chromosome_a | tStart_a | tEnd_a |
| BG927599 | NECAB3 | 77 | 122 | 20 | 32261363 | 32261408 | DCN | 116 | 475 | 12 | 91550912 | 91558472 | |
| M14219 | DCN | 26 | 1292 | 12 | 91539704 | 91576454 | SSR1 | 1292 | 1778 | 6 | 7288053 | 7288539 | |
| BM720639 | DCN | 17 | 531 | 12 | 91552132 | 91572364 | ZNF263 | 526 | 687 | 16 | 3341286 | 3341448 | |
| CV569111 | DCN | 1 | 73 | 12 | 91572239 | 91572312 | CRIPAK | 73 | 603 | 4 | 1387247 | 1387781 | |
| BP289909 | IGFBP4 | 1 | 395 | 17 | 38613421 | 38613815 | DCN | 395 | 568 | 12 | 91572307 | 91573256 | |
| DR979449 | CD36 | 1 | 103 | 7 | 80289884 | 80289988 | DCN | 98 | 148 | 12 | 91539474 | 91539530 | |
| AI752586 | DCN | 8 | 202 | 12 | 91572318 | 91576581 | DCN | 190 | 386 | 12 | 91572117 | 91572313 | |
| AA736813 | DCN | 14 | 34 | 12 | 91571449 | 91571469 | MAGI1 | 31 | 56 | 3 | 65352758 | 65352801 | |
| Top |
| There's no copy number variation information in COSMIC data for this gene. |
| Top |
|
 |
| Top |
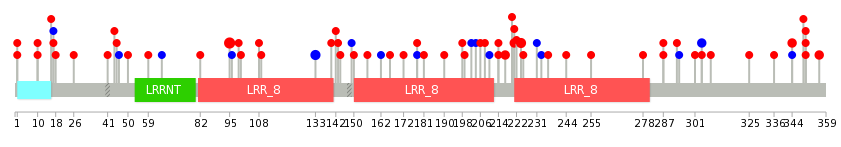
| Stat. for Non-Synonymous SNVs (# total SNVs=47) | (# total SNVs=14) |
 |  |
(# total SNVs=2) | (# total SNVs=0) |
 |
| Top |
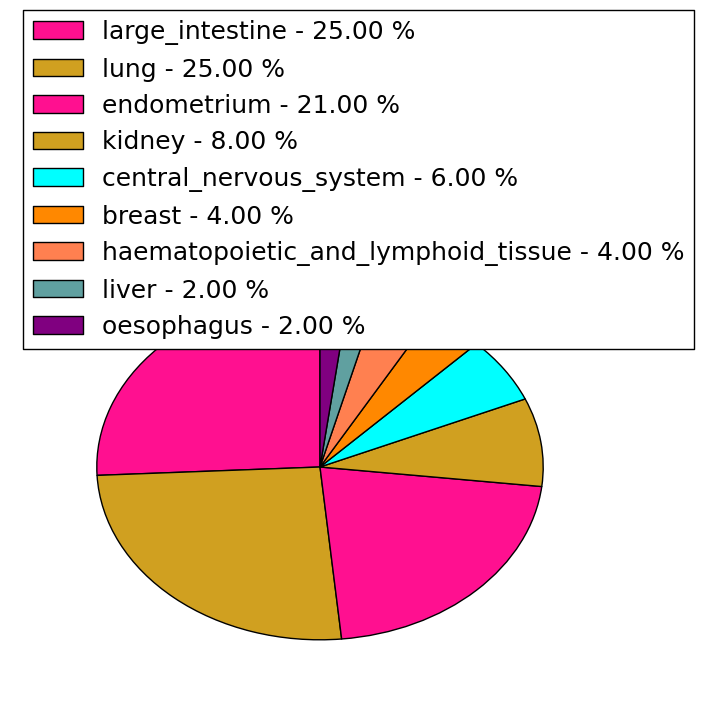
| * When you move the cursor on each content, you can see more deailed mutation information on the Tooltip. Those are primary_site,primary_histology,mutation(aa),pubmedID. |
| GRCh37 position | Mutation(aa) | Unique sampleID count |
| chr12:91558423-91558423 | p.E95K | 6 |
| chr12:91540003-91540003 | p.I304I | 3 |
| chr12:91552212-91552212 | p.R133R | 3 |
| chr12:91546948-91546948 | p.T224M | 3 |
| chr12:91539883-91539883 | p.F344L | 3 |
| chr12:91539849-91539849 | p.G356R | 2 |
| chr12:91552214-91552214 | p.R133* | 2 |
| chr12:91539867-91539867 | p.R350C | 2 |
| chr12:91545456-91545456 | p.G287E | 2 |
| chr12:91546958-91546958 | p.P221S | 2 |
| Top |
|
 |
| Point Mutation/ Tissue ID | 1 | 2 | 3 | 4 | 5 | 6 | 7 | 8 | 9 | 10 | 11 | 12 | 13 | 14 | 15 | 16 | 17 | 18 | 19 | 20 |
| # sample | 1 | 11 | 1 | 5 | 6 | 3 | 1 | 13 | 6 | 10 | ||||||||||
| # mutation | 1 | 8 | 1 | 5 | 6 | 3 | 1 | 14 | 6 | 9 | ||||||||||
| nonsynonymous SNV | 7 | 1 | 5 | 4 | 1 | 11 | 5 | 7 | ||||||||||||
| synonymous SNV | 1 | 1 | 2 | 2 | 1 | 3 | 1 | 2 |
| cf) Tissue ID; Tissue type (1; BLCA[Bladder Urothelial Carcinoma], 2; BRCA[Breast invasive carcinoma], 3; CESC[Cervical squamous cell carcinoma and endocervical adenocarcinoma], 4; COAD[Colon adenocarcinoma], 5; GBM[Glioblastoma multiforme], 6; Glioma Low Grade, 7; HNSC[Head and Neck squamous cell carcinoma], 8; KICH[Kidney Chromophobe], 9; KIRC[Kidney renal clear cell carcinoma], 10; KIRP[Kidney renal papillary cell carcinoma], 11; LAML[Acute Myeloid Leukemia], 12; LUAD[Lung adenocarcinoma], 13; LUSC[Lung squamous cell carcinoma], 14; OV[Ovarian serous cystadenocarcinoma ], 15; PAAD[Pancreatic adenocarcinoma], 16; PRAD[Prostate adenocarcinoma], 17; SKCM[Skin Cutaneous Melanoma], 18:STAD[Stomach adenocarcinoma], 19:THCA[Thyroid carcinoma], 20:UCEC[Uterine Corpus Endometrial Carcinoma]) |
| Top |
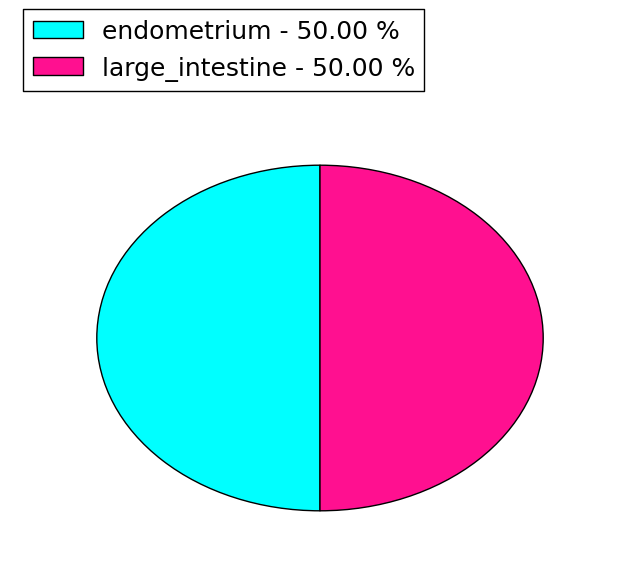
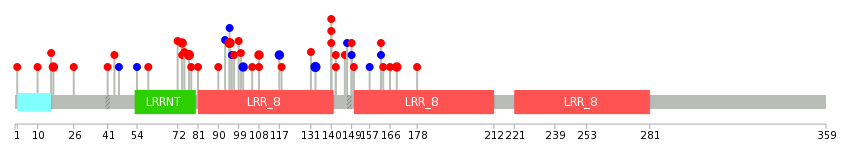
| * We represented just top 10 SNVs. When you move the cursor on each content, you can see more deailed mutation information on the Tooltip. Those are primary_site, primary_histology, mutation(aa), pubmedID. |
| Genomic Position | Mutation(aa) | Unique sampleID count |
| chr12:91552212 | p.R133R,DCN | 3 |
| chr12:91546948 | p.E95K,DCN | 3 |
| chr12:91558423 | p.T77M,DCN | 3 |
| chr12:91545456 | p.G169R,DCN | 2 |
| chr12:91539849 | p.P74S,DCN | 2 |
| chr12:91572281 | p.Q108R,DCN | 2 |
| chr12:91540003 | p.T101T,DCN | 2 |
| chr12:91546958 | p.I117I,DCN | 2 |
| chr12:91550854 | p.G140V,DCN | 2 |
| chr12:91550874 | p.G17R,DCN | 2 |
| * Copy number data were extracted from TCGA using R package TCGA-Assembler. The URLs of all public data files on TCGA DCC data server were gathered on Jan-05-2015. Function ProcessCNAData in TCGA-Assembler package was used to obtain gene-level copy number value which is calculated as the average copy number of the genomic region of a gene. |
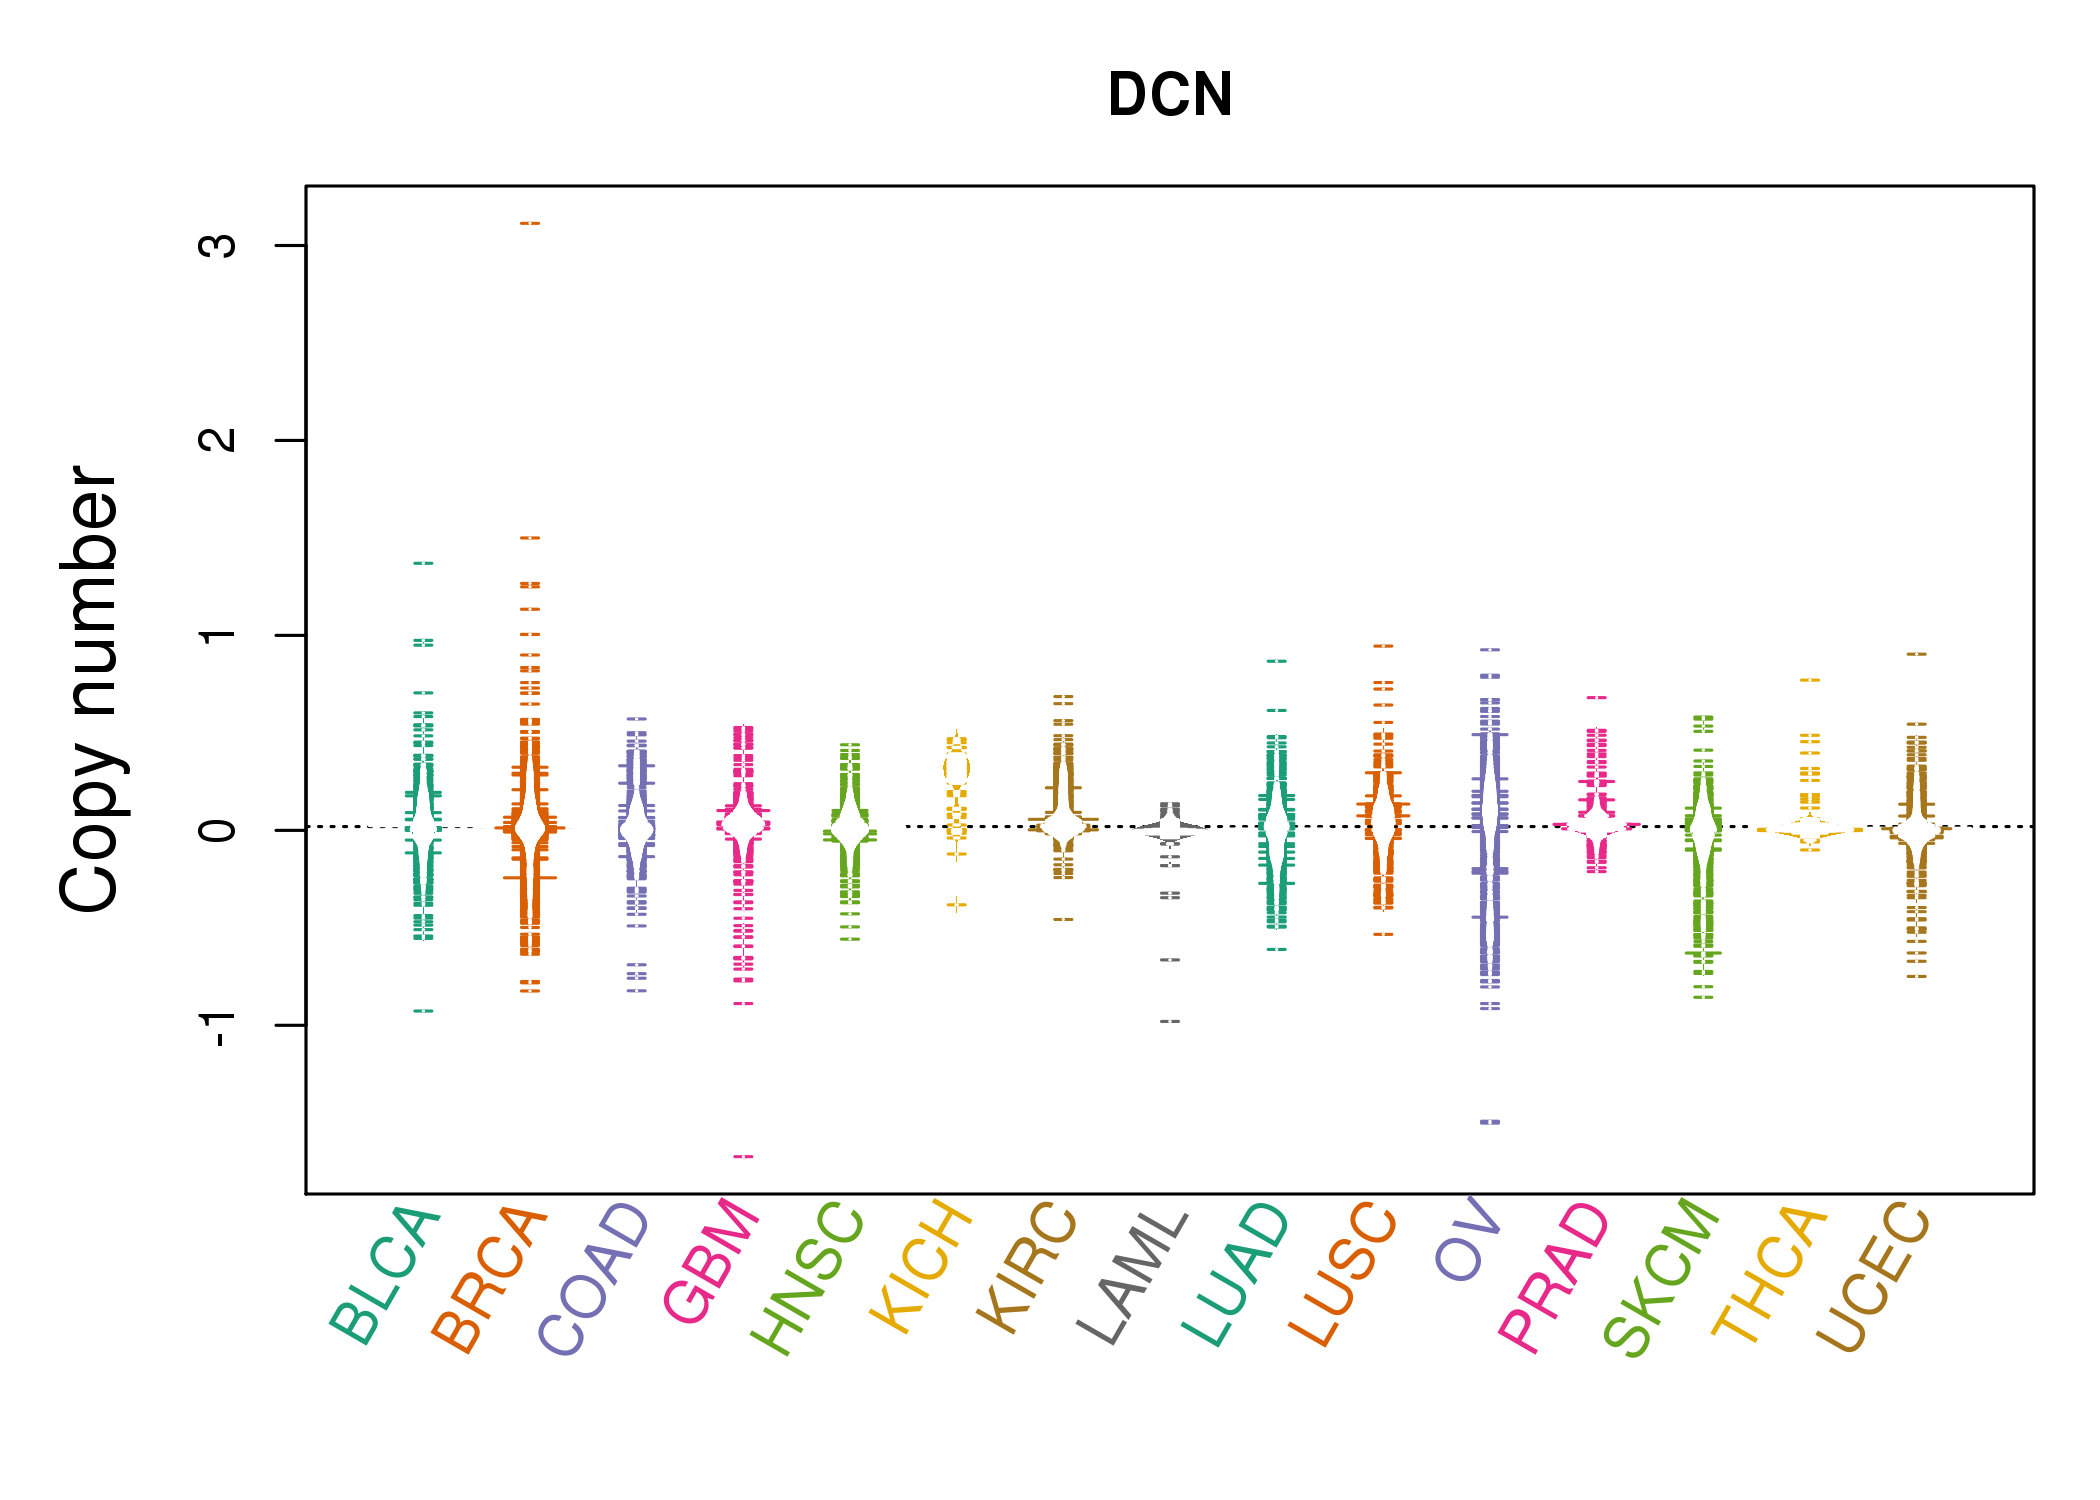 |
| cf) Tissue ID[Tissue type]: BLCA[Bladder Urothelial Carcinoma], BRCA[Breast invasive carcinoma], CESC[Cervical squamous cell carcinoma and endocervical adenocarcinoma], COAD[Colon adenocarcinoma], GBM[Glioblastoma multiforme], Glioma Low Grade, HNSC[Head and Neck squamous cell carcinoma], KICH[Kidney Chromophobe], KIRC[Kidney renal clear cell carcinoma], KIRP[Kidney renal papillary cell carcinoma], LAML[Acute Myeloid Leukemia], LUAD[Lung adenocarcinoma], LUSC[Lung squamous cell carcinoma], OV[Ovarian serous cystadenocarcinoma ], PAAD[Pancreatic adenocarcinoma], PRAD[Prostate adenocarcinoma], SKCM[Skin Cutaneous Melanoma], STAD[Stomach adenocarcinoma], THCA[Thyroid carcinoma], UCEC[Uterine Corpus Endometrial Carcinoma] |
| Top |
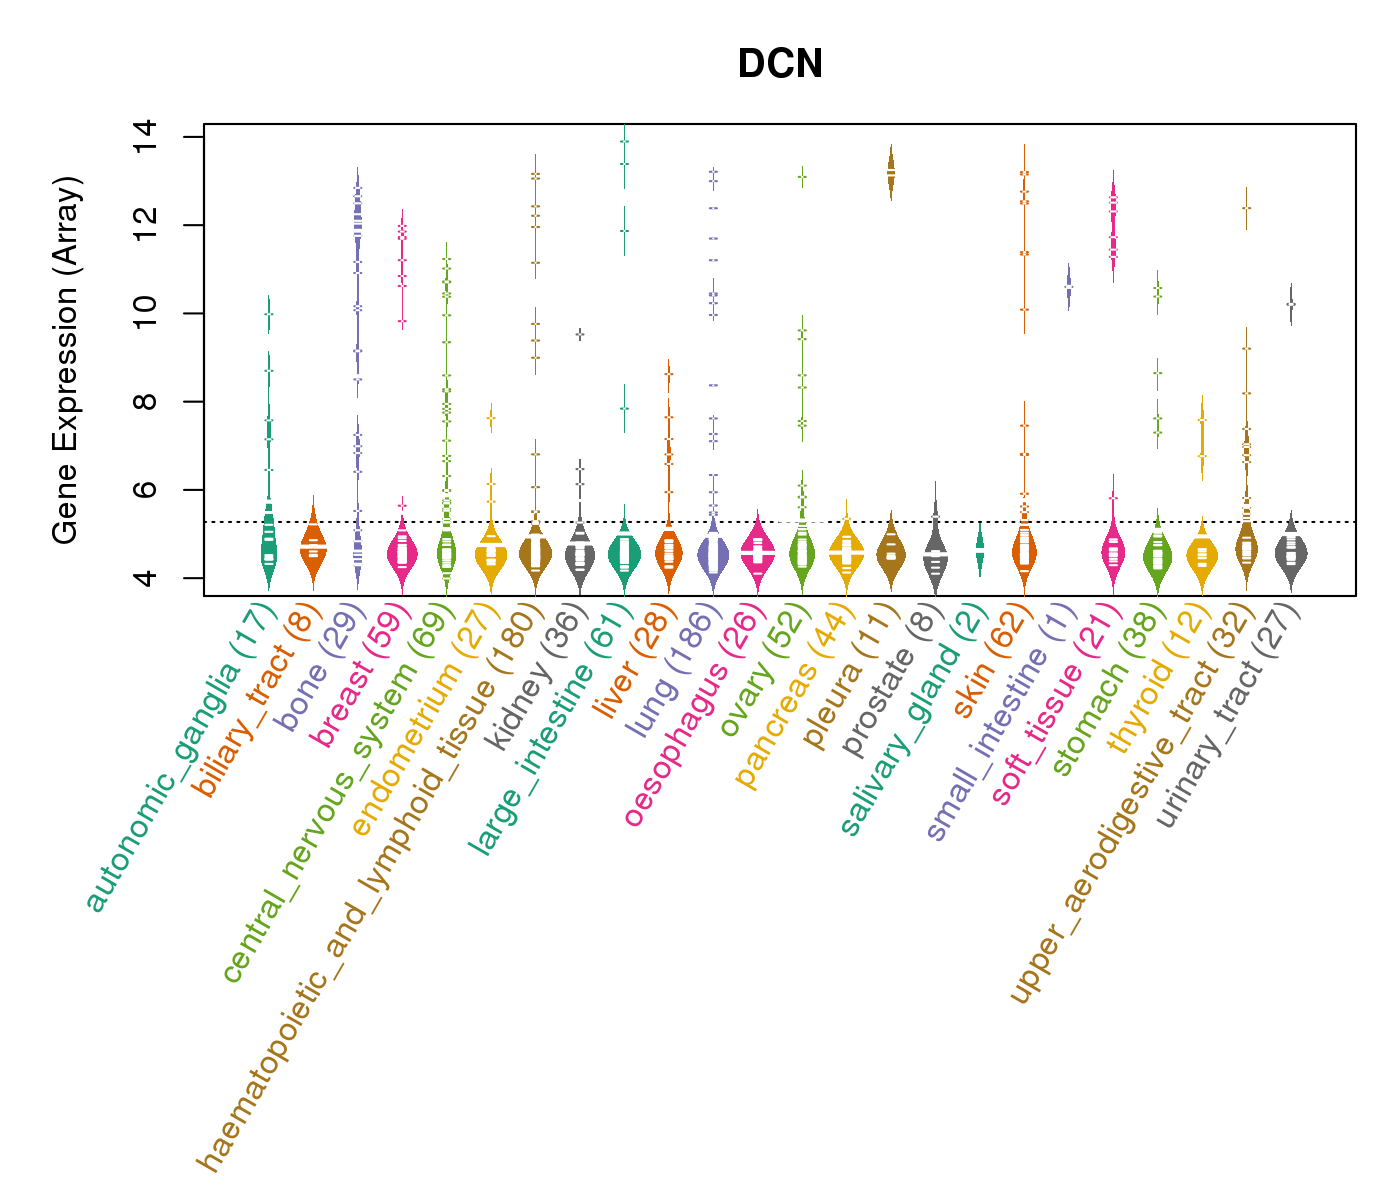
| Gene Expression for DCN |
| * CCLE gene expression data were extracted from CCLE_Expression_Entrez_2012-10-18.res: Gene-centric RMA-normalized mRNA expression data. |
 |
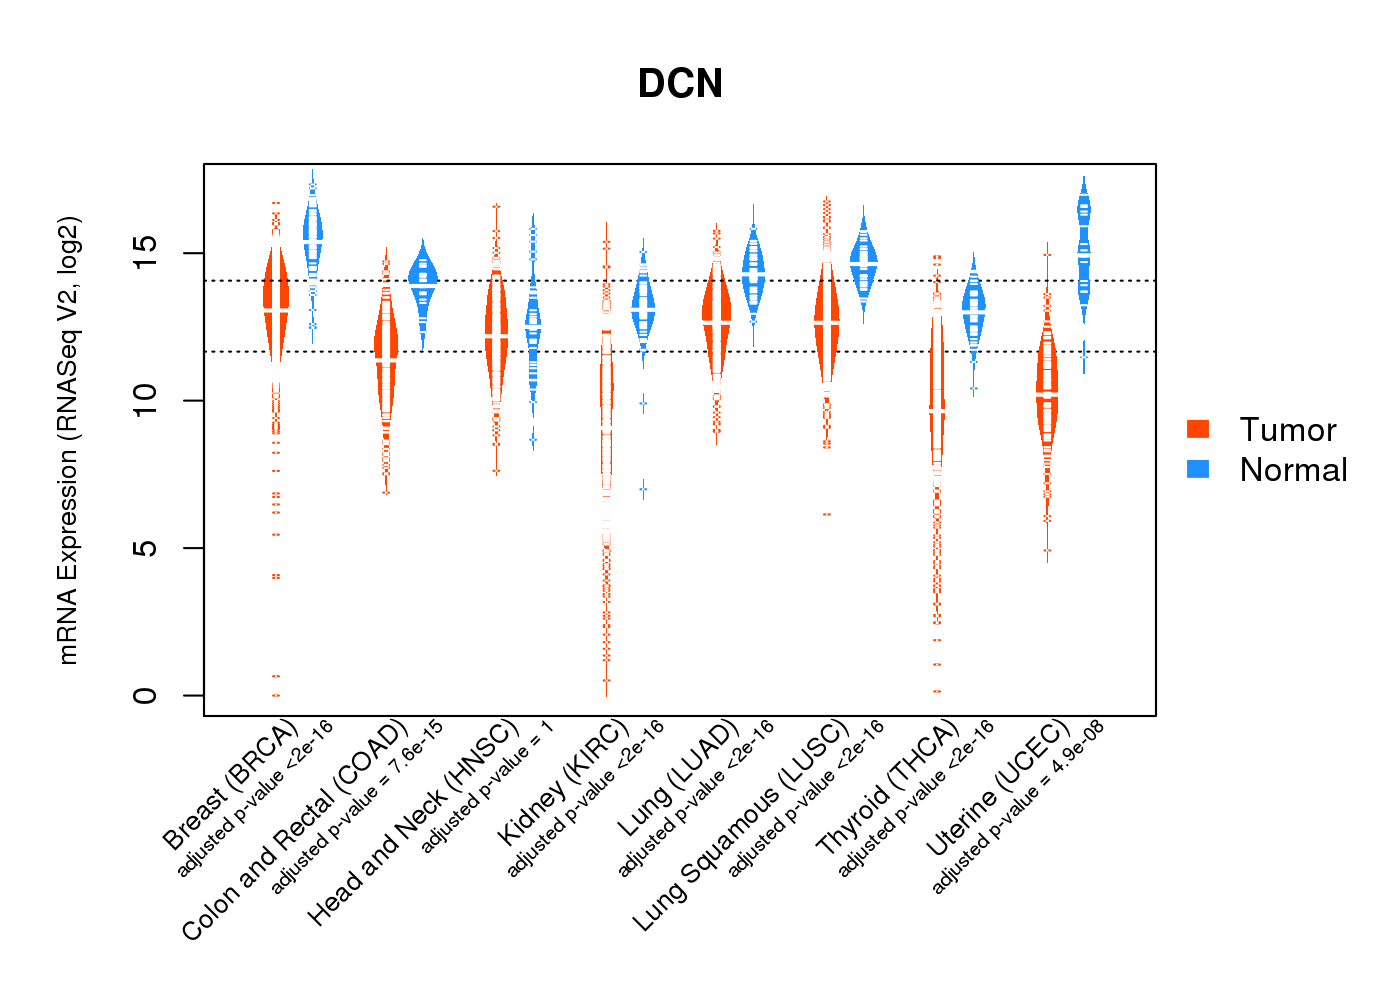
| * Normalized gene expression data of RNASeqV2 was extracted from TCGA using R package TCGA-Assembler. The URLs of all public data files on TCGA DCC data server were gathered at Jan-05-2015. Only eight cancer types have enough normal control samples for differential expression analysis. (t test, adjusted p<0.05 (using Benjamini-Hochberg FDR)) |
 |
| Top |
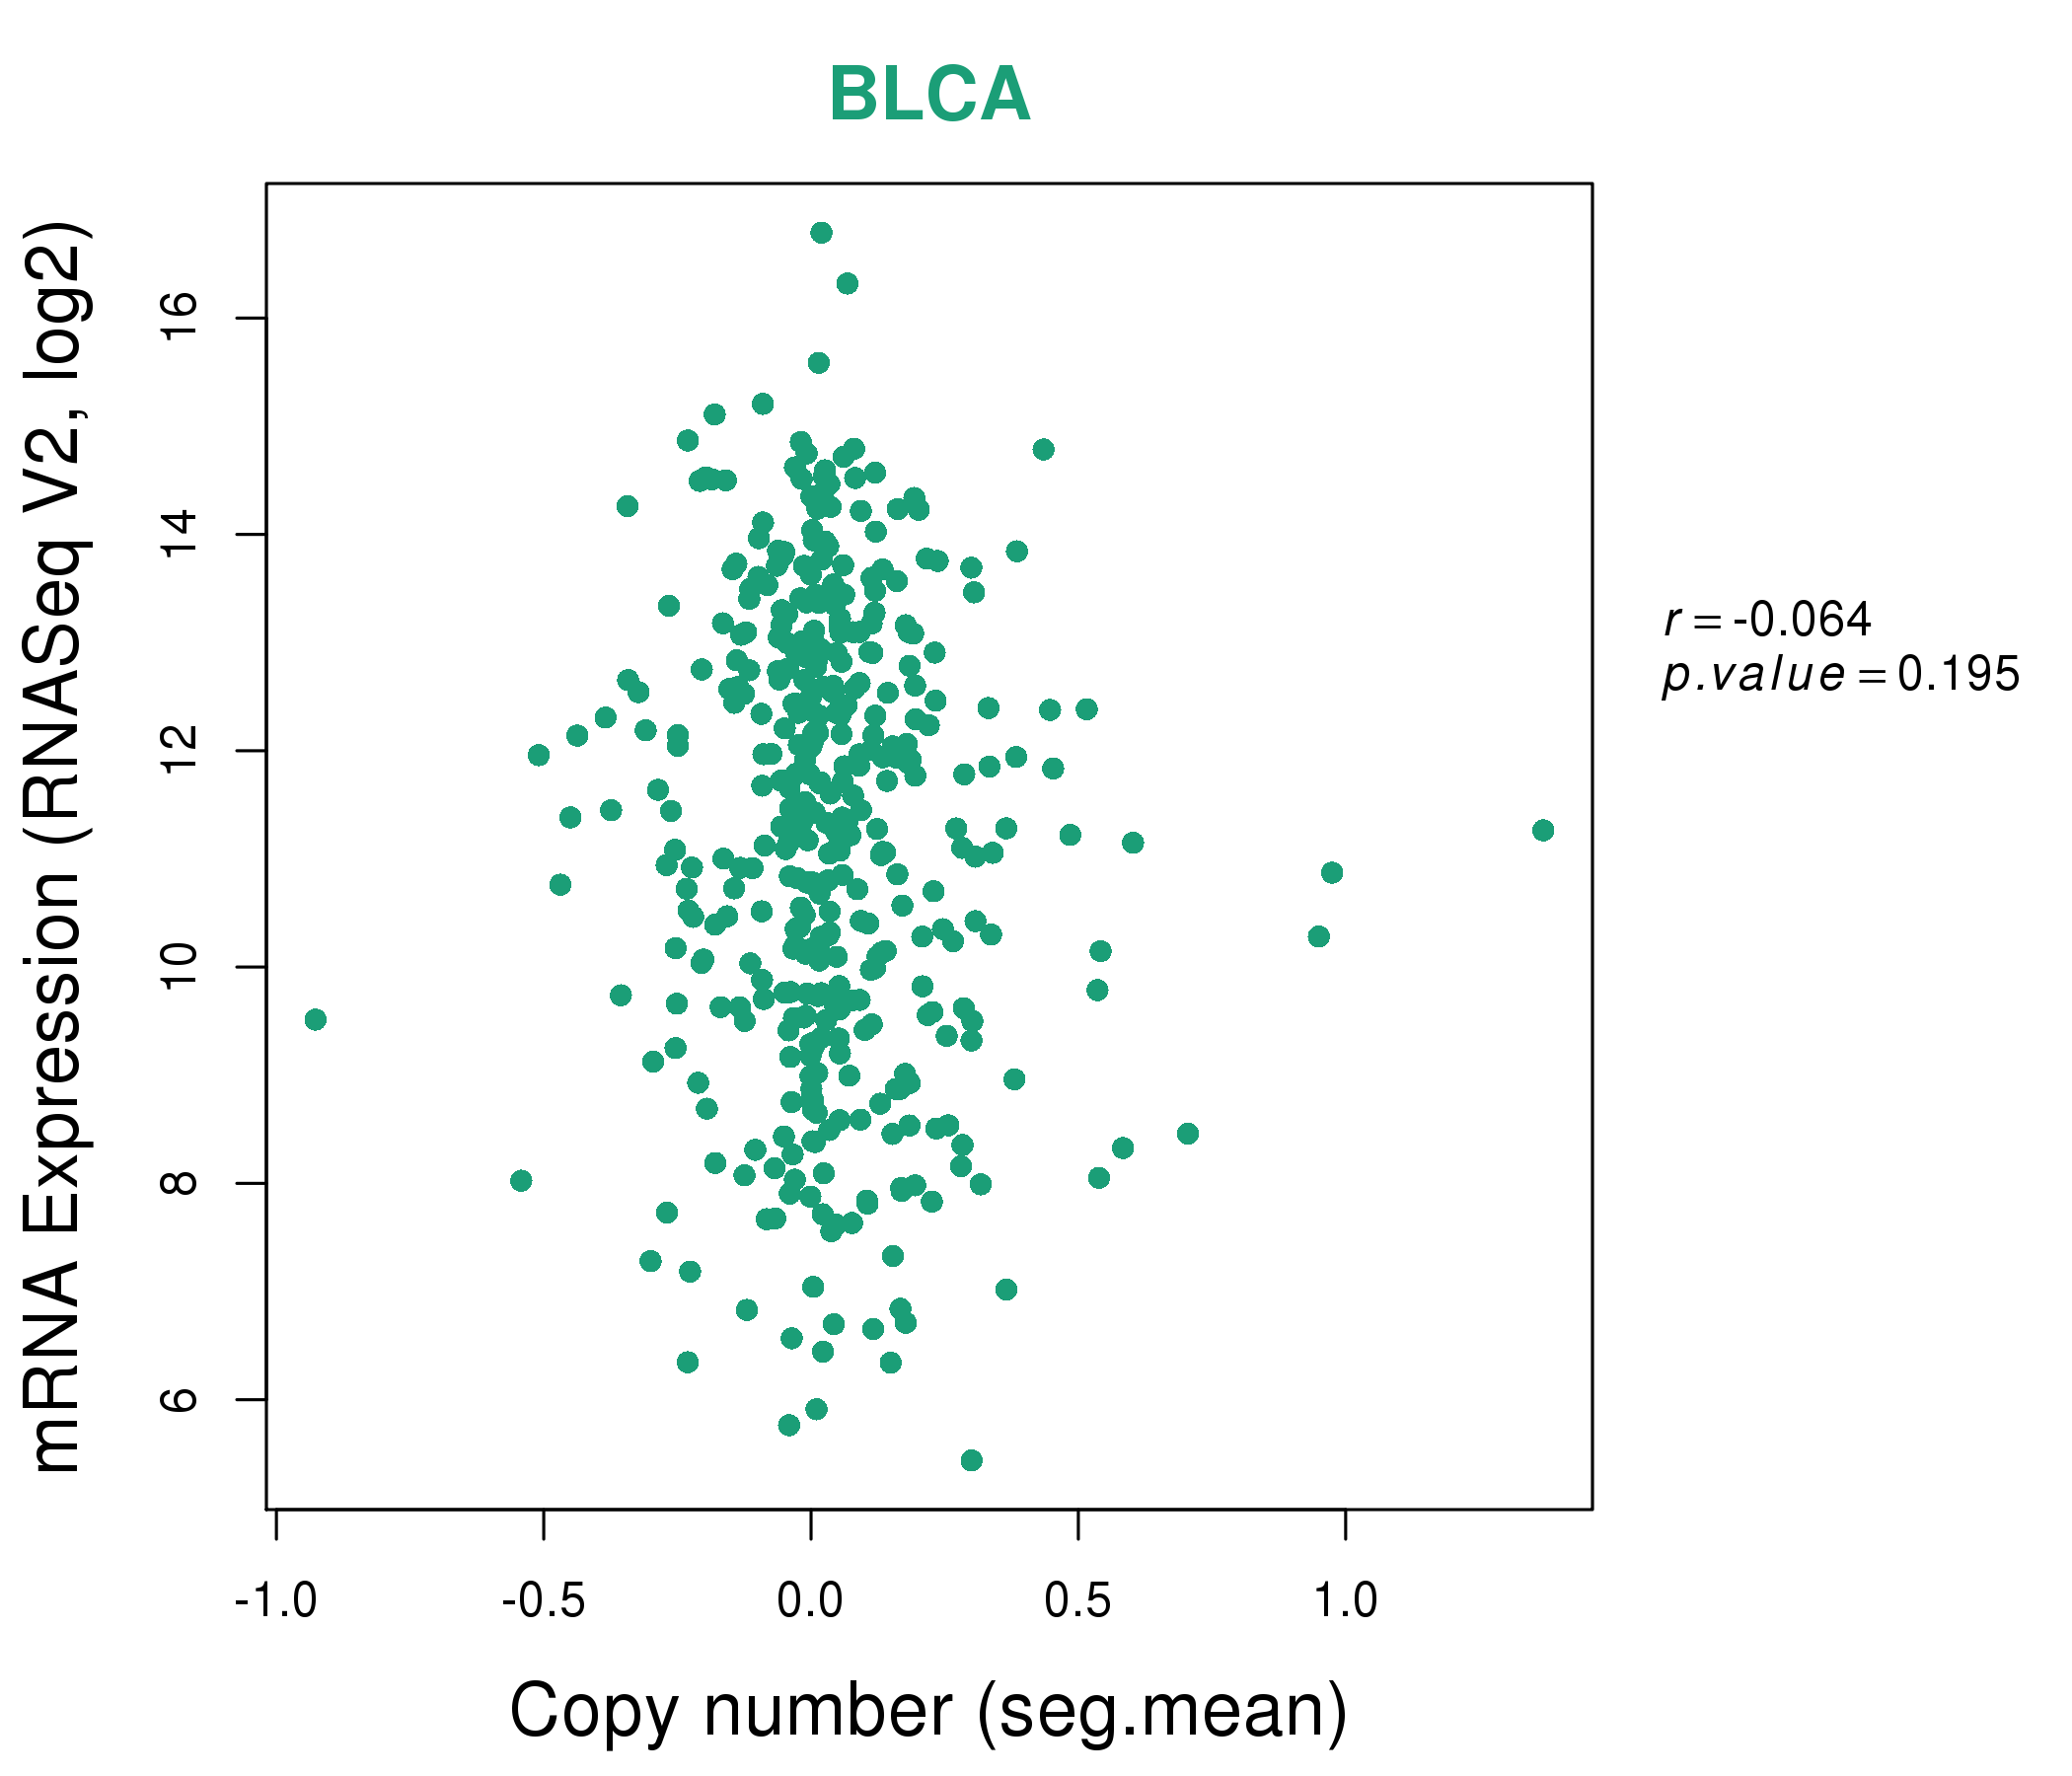
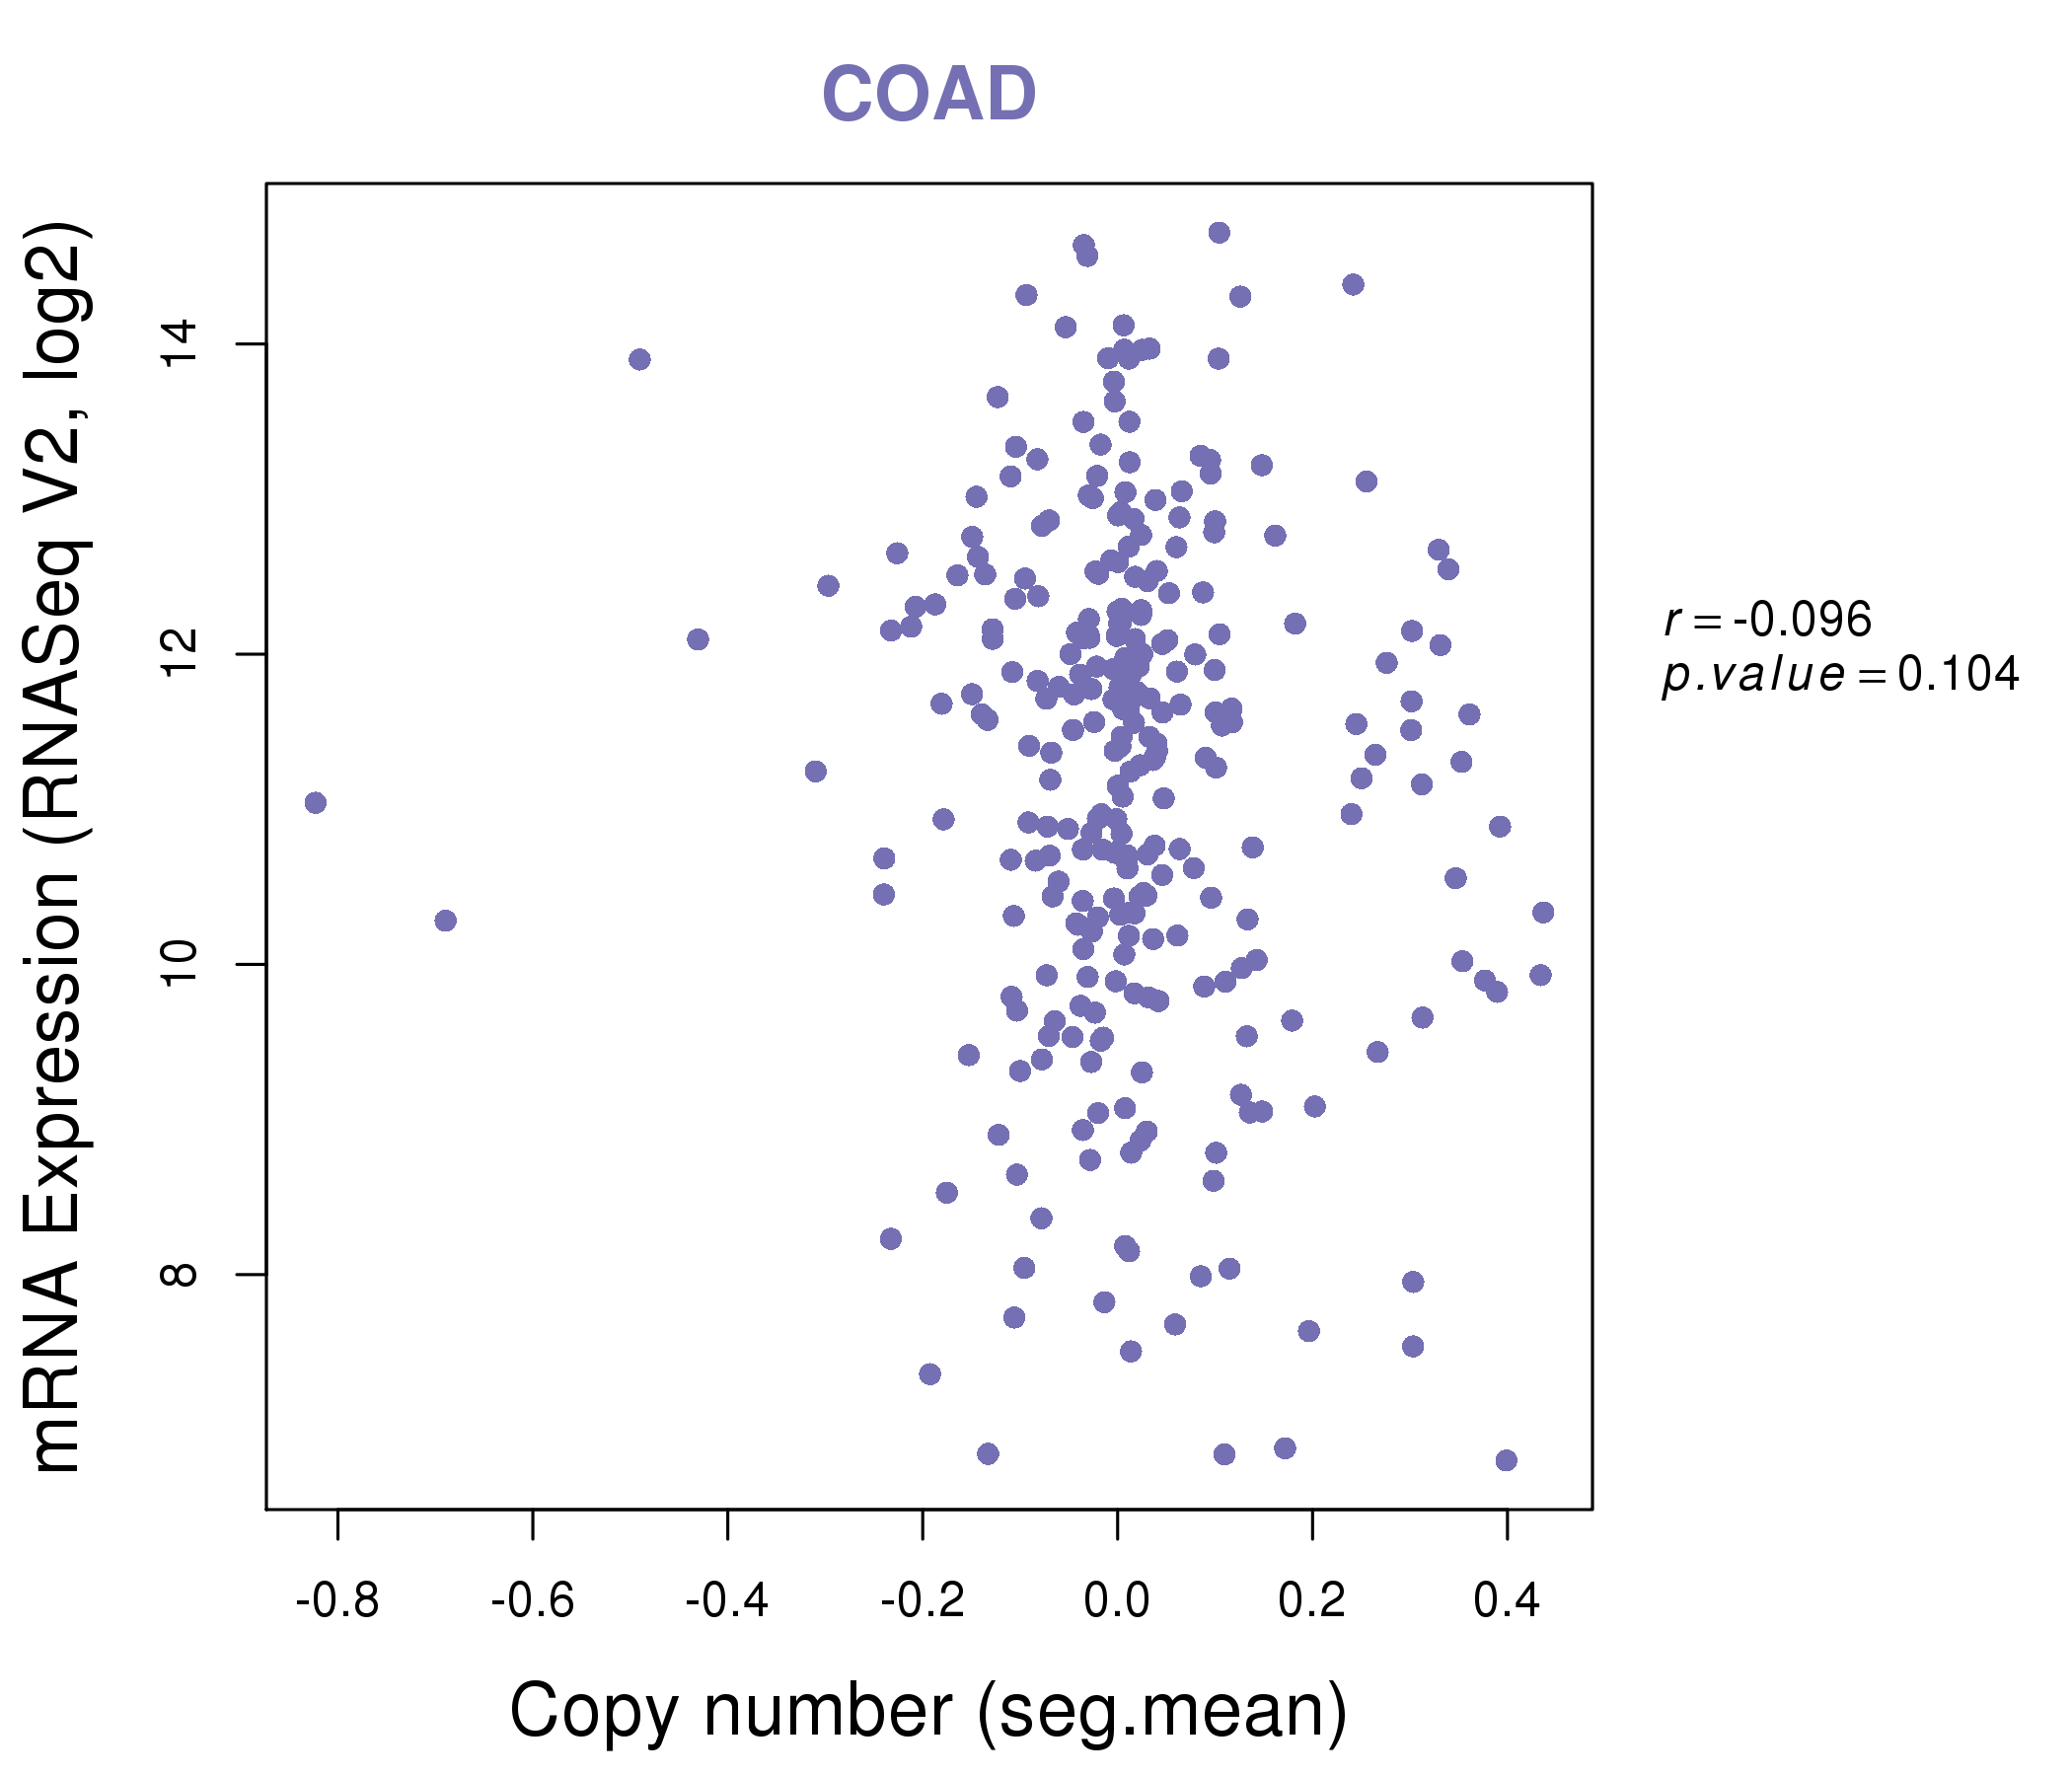
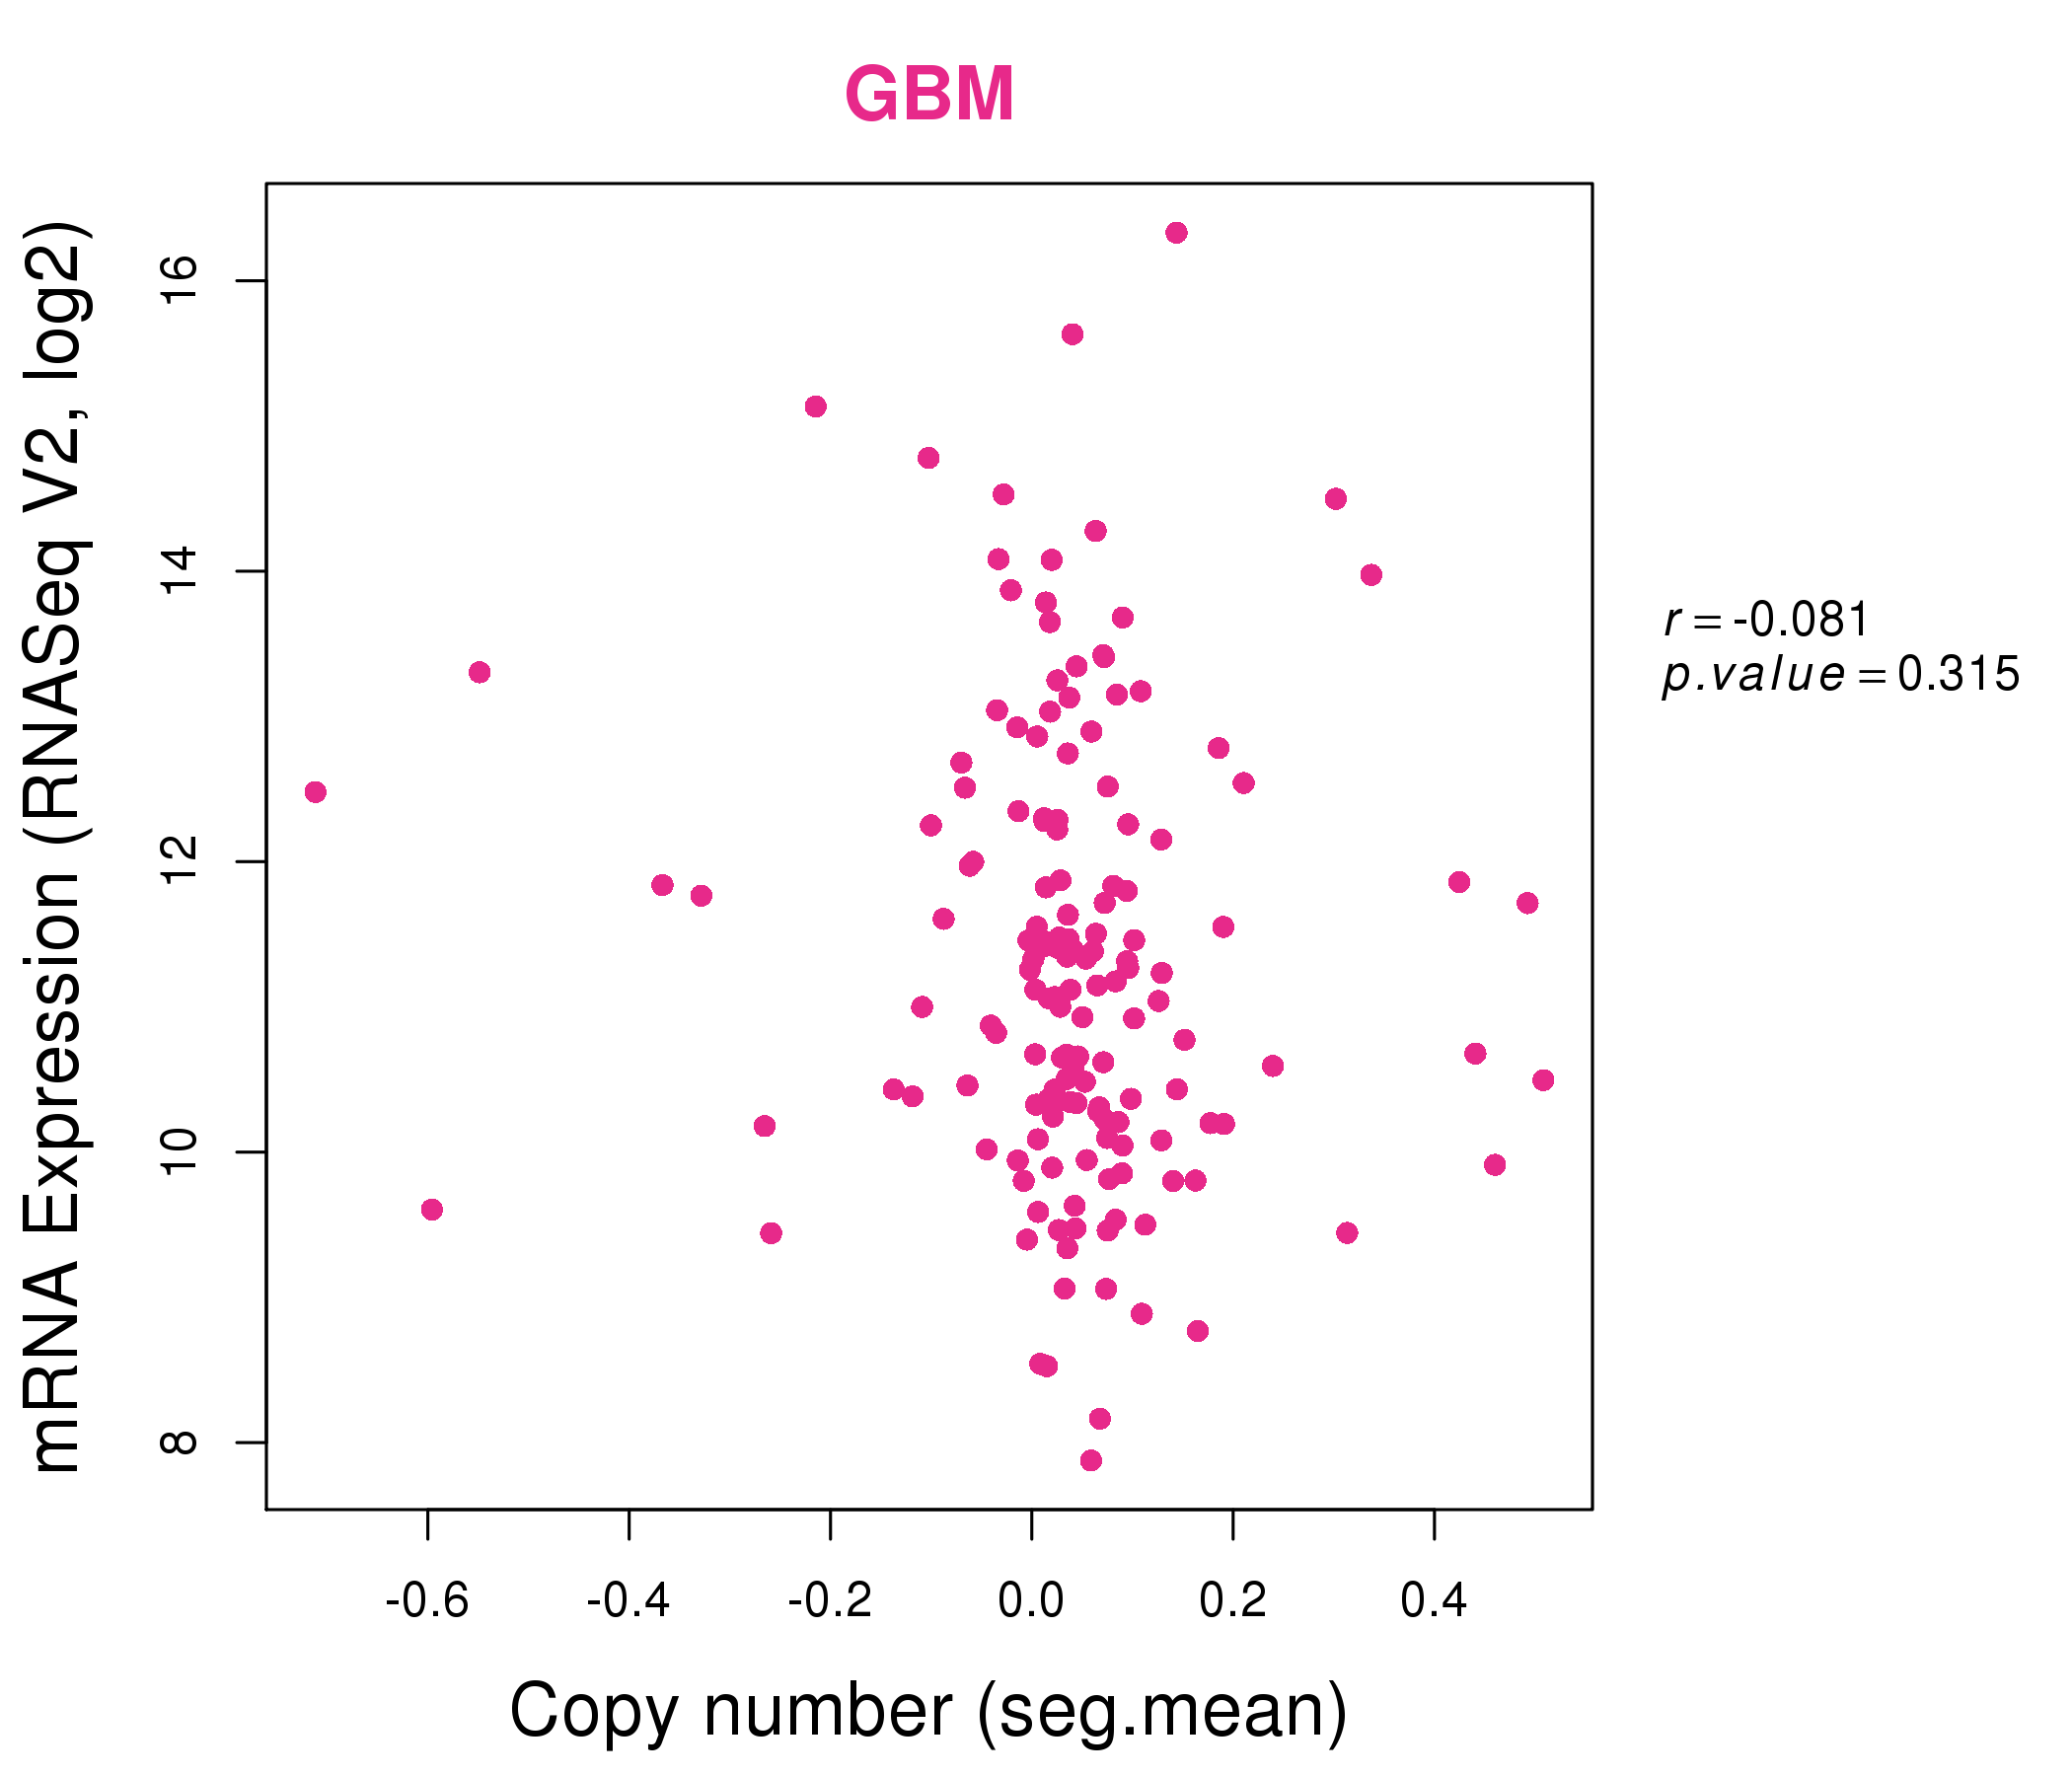
| * This plots show the correlation between CNV and gene expression. |
: Open all plots for all cancer types
 |
|
 |
|

| Top |
| Gene-Gene Network Information |
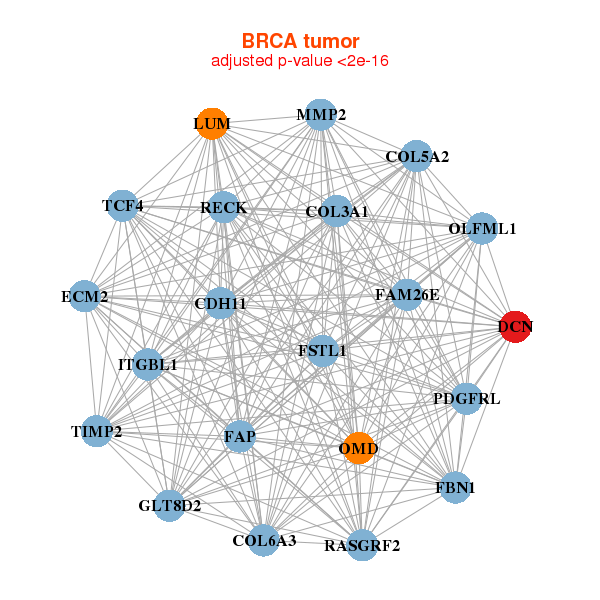
| * Co-Expression network figures were drawn using R package igraph. Only the top 20 genes with the highest correlations were shown. Red circle: input gene, orange circle: cell metabolism gene, sky circle: other gene |
: Open all plots for all cancer types
 |
| ||||
| CDH11,COL3A1,COL5A2,COL6A3,DCN,ECM2,FAM26E, FAP,FBN1,FSTL1,GLT8D2,ITGBL1,LUM,MMP2, OLFML1,OMD,PDGFRL,RASGRF2,RECK,TCF4,TIMP2 | C1S,ACKR4___CX3CR1,CLIC2,DCN,DPYSL3,FBLN1,FGL2, GALNT12,MFAP4,NT5E,OGN,OLFML1,OMD,PAM, PDGFRL,CPQ,PMP22,PTGFR,RECK,TIMP2,TPST1 | ||||
 |
| ||||
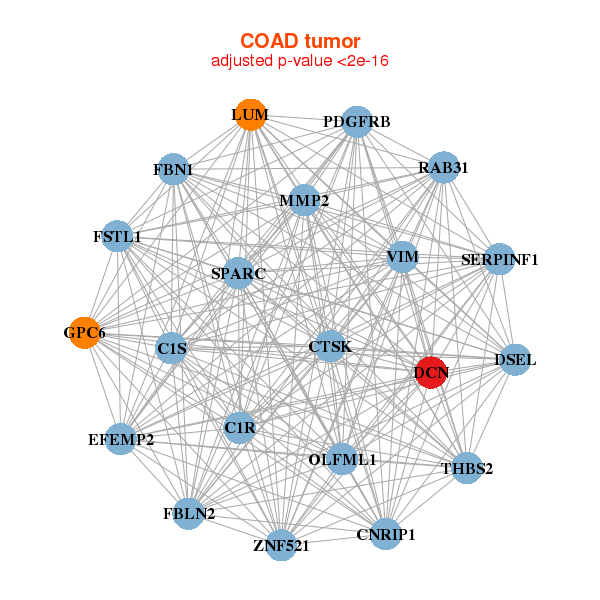
| C1R,C1S,CNRIP1,CTSK,DCN,DSEL,EFEMP2, FBLN2,FBN1,FSTL1,GPC6,LUM,MMP2,OLFML1, PDGFRB,RAB31,SERPINF1,SPARC,THBS2,VIM,ZNF521 | TMEM237,ARHGAP29,B3GALNT1,CAV2,DCN,MICU3,FXYD1, GNG11,LHFP,LUM,MGP,NME5,NRN1,OGN, OMD,SDC2,SGTB,SNCG,SPG20,TAF9B,SLC35G2 |

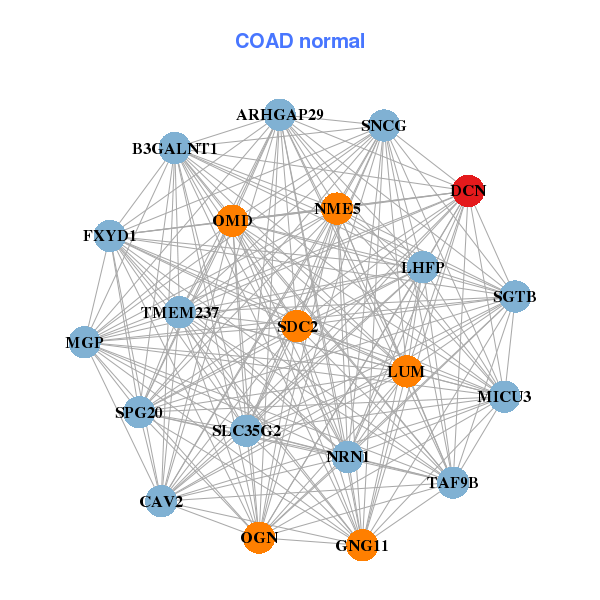
| * Co-Expression network figures were drawn using R package igraph. Only the top 20 genes with the highest correlations were shown. Red circle: input gene, orange circle: cell metabolism gene, sky circle: other gene |
: Open all plots for all cancer types
| Top |
: Open all interacting genes' information including KEGG pathway for all interacting genes from DAVID
| Top |
| Pharmacological Information for DCN |
| DB Category | DB Name | DB's ID and Url link |
| * Gene Centered Interaction Network. |
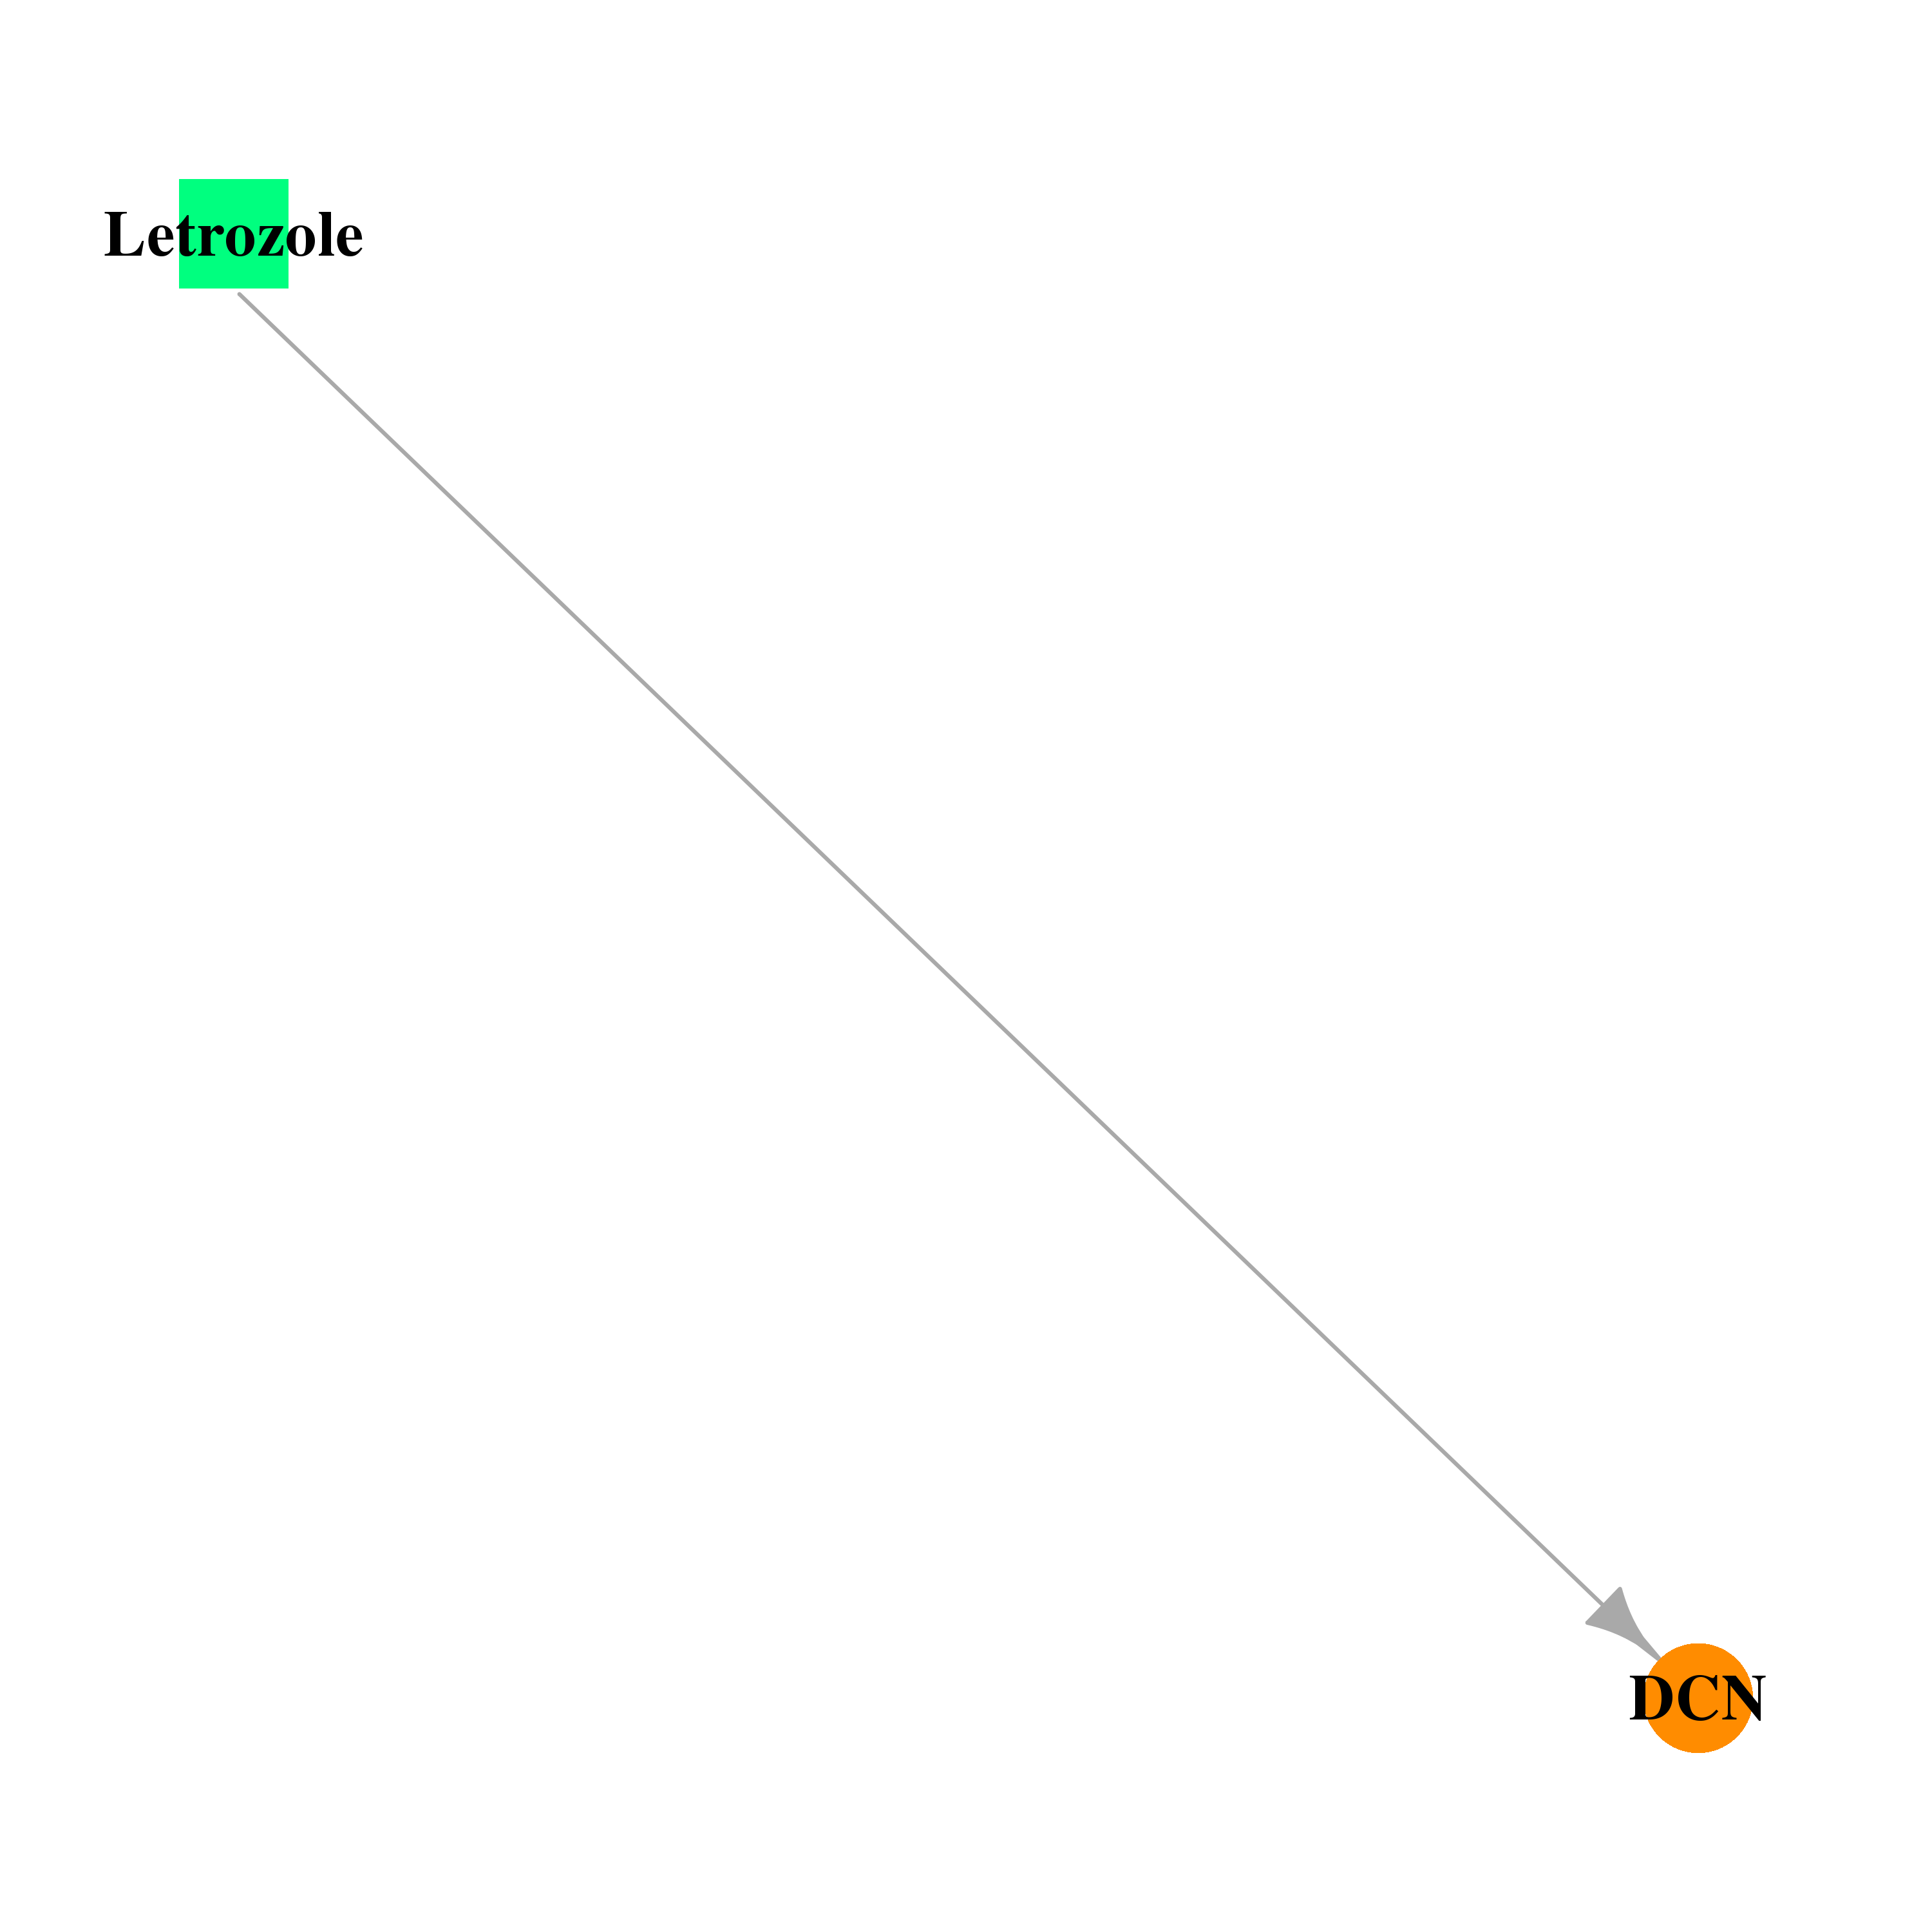 |
| * Drug Centered Interaction Network. |
| DrugBank ID | Target Name | Drug Groups | Generic Name | Drug Centered Network | Drug Structure |
| DB01006 | decorin | approved; investigational | Letrozole | 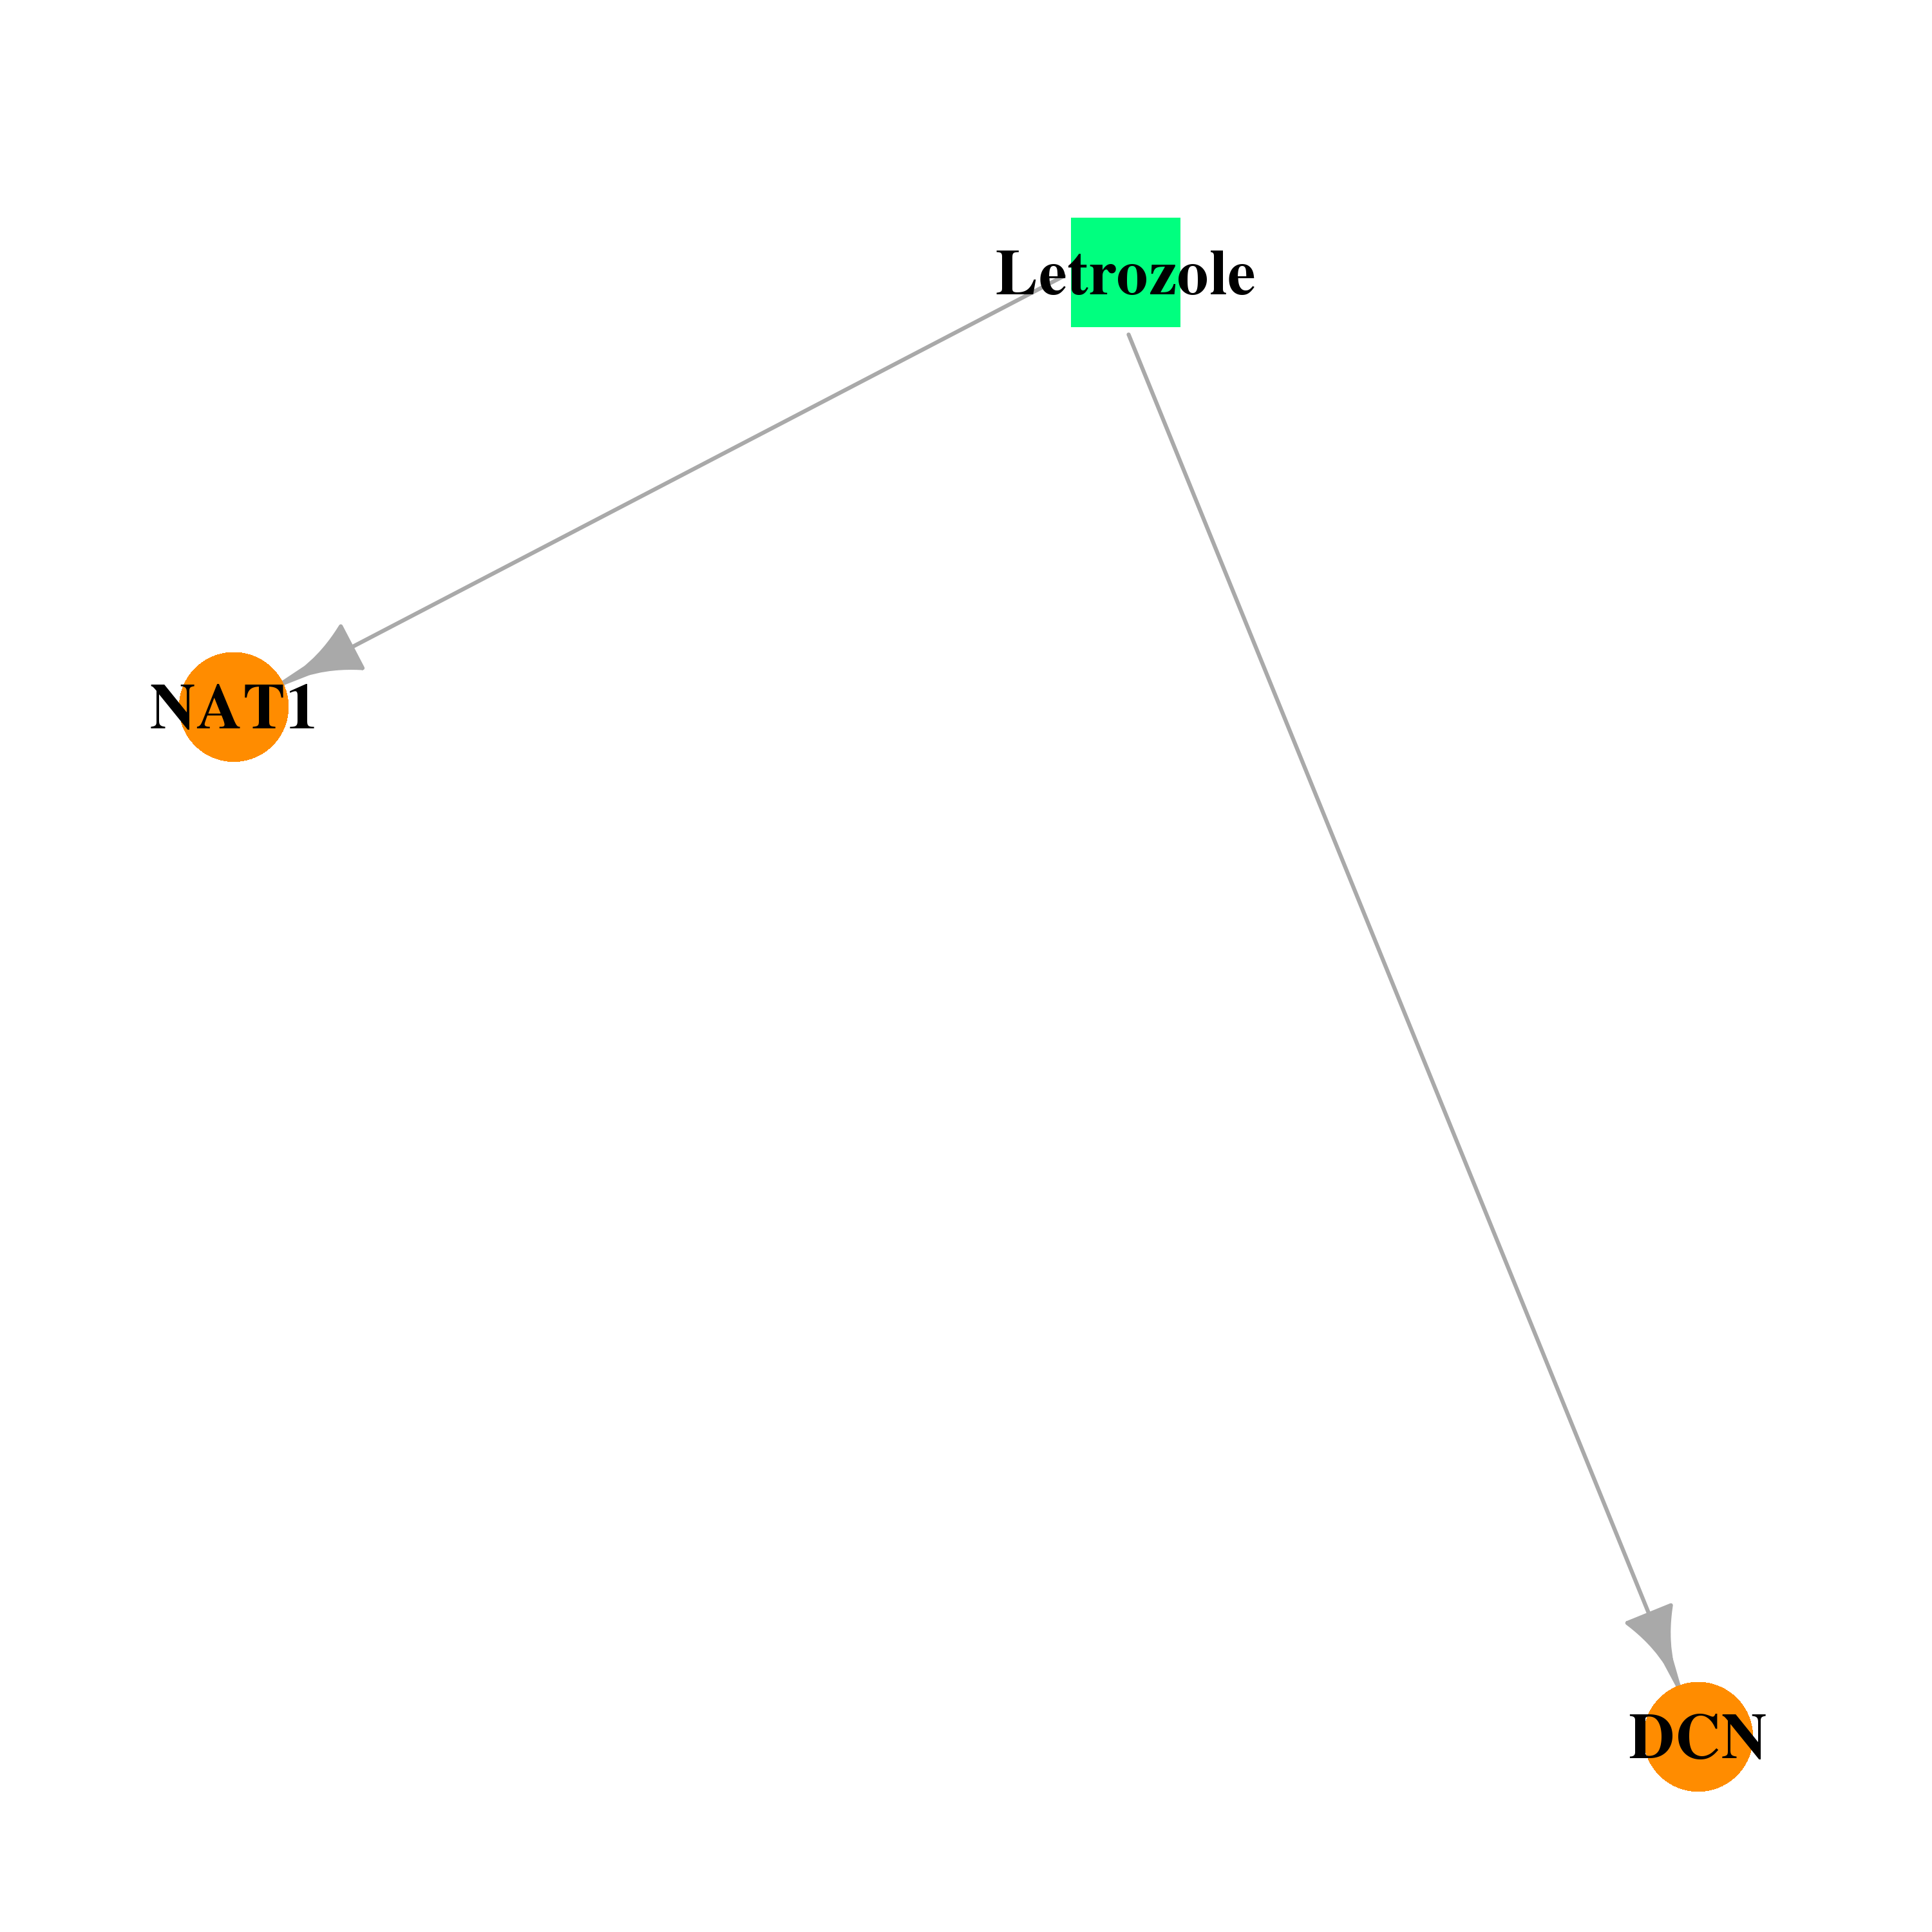 | 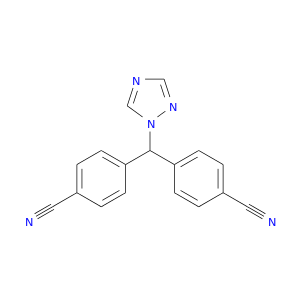 |
| Top |
| Cross referenced IDs for DCN |
| * We obtained these cross-references from Uniprot database. It covers 150 different DBs, 18 categories. http://www.uniprot.org/help/cross_references_section |
: Open all cross reference information
|
Copyright © 2016-Present - The Univsersity of Texas Health Science Center at Houston @ |