|
||||||||||||||||||||
| |
| Phenotypic Information (metabolism pathway, cancer, disease, phenome) |
| |
| |
| Gene-Gene Network Information: Co-Expression Network, Interacting Genes & KEGG |
| |
|


| Gene Summary for DCT |
| Basic gene info. | Gene symbol | DCT |
| Gene name | dopachrome tautomerase | |
| Synonyms | TRP-2|TYRP2 | |
| Cytomap | UCSC genome browser: 13q32 | |
| Genomic location | chr13 :95091840-95131936 | |
| Type of gene | protein-coding | |
| RefGenes | NM_001129889.1, NM_001922.3, | |
| Ensembl id | ENSG00000080166 | |
| Description | DTL-dopachrome Delta-isomeraseL-dopachrome tautomeraseTRP2dopachrome delta-isomerasedopachrome tautomerase (dopachrome delta-isomerase, tyrosine-related protein 2)tyrosinase-related protein 2tyrosine-related protein 2 | |
| Modification date | 20141207 | |
| dbXrefs | MIM : 191275 | |
| HGNC : HGNC | ||
| Ensembl : ENSG00000080166 | ||
| HPRD : 01864 | ||
| Protein | UniProt: go to UniProt's Cross Reference DB Table | |
| Expression | CleanEX: HS_DCT | |
| BioGPS: 1638 | ||
| Gene Expression Atlas: ENSG00000080166 | ||
| The Human Protein Atlas: ENSG00000080166 | ||
| Pathway | NCI Pathway Interaction Database: DCT | |
| KEGG: DCT | ||
| REACTOME: DCT | ||
| ConsensusPathDB | ||
| Pathway Commons: DCT | ||
| Metabolism | MetaCyc: DCT | |
| HUMANCyc: DCT | ||
| Regulation | Ensembl's Regulation: ENSG00000080166 | |
| miRBase: chr13 :95,091,840-95,131,936 | ||
| TargetScan: NM_001129889 | ||
| cisRED: ENSG00000080166 | ||
| Context | iHOP: DCT | |
| cancer metabolism search in PubMed: DCT | ||
| UCL Cancer Institute: DCT | ||
| Assigned class in ccmGDB | C | |
| Top |
| Phenotypic Information for DCT(metabolism pathway, cancer, disease, phenome) |
| Cancer | CGAP: DCT |
| Familial Cancer Database: DCT | |
| * This gene is included in those cancer gene databases. |
|
|
|
|
|
| . | ||||||||||||||
Oncogene 1 | Significant driver gene in | |||||||||||||||||||
| cf) number; DB name 1 Oncogene; http://nar.oxfordjournals.org/content/35/suppl_1/D721.long, 2 Tumor Suppressor gene; https://bioinfo.uth.edu/TSGene/, 3 Cancer Gene Census; http://www.nature.com/nrc/journal/v4/n3/abs/nrc1299.html, 4 CancerGenes; http://nar.oxfordjournals.org/content/35/suppl_1/D721.long, 5 Network of Cancer Gene; http://ncg.kcl.ac.uk/index.php, 1Therapeutic Vulnerabilities in Cancer; http://cbio.mskcc.org/cancergenomics/statius/ |
| KEGG_TYROSINE_METABOLISM | |
| OMIM | |
| Orphanet | |
| Disease | KEGG Disease: DCT |
| MedGen: DCT (Human Medical Genetics with Condition) | |
| ClinVar: DCT | |
| Phenotype | MGI: DCT (International Mouse Phenotyping Consortium) |
| PhenomicDB: DCT | |
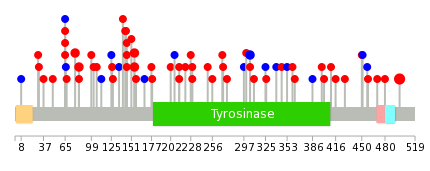
| Mutations for DCT |
| * Under tables are showing count per each tissue to give us broad intuition about tissue specific mutation patterns.You can go to the detailed page for each mutation database's web site. |
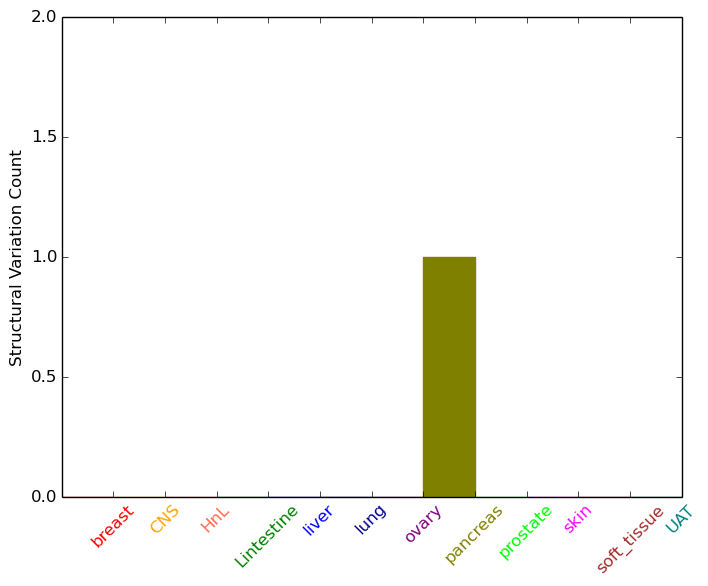
| - Statistics for Tissue and Mutation type | Top |
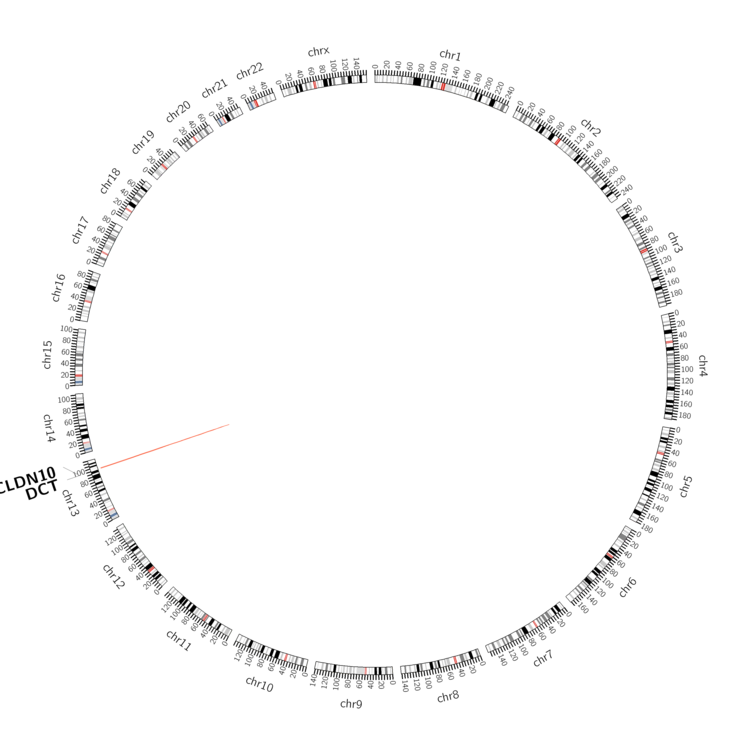 |
| - For Inter-chromosomal Variations |
| There's no inter-chromosomal structural variation. |
| - For Intra-chromosomal Variations |
| * Intra-chromosomal variantions includes 'intrachromosomal amplicon to amplicon', 'intrachromosomal amplicon to non-amplified dna', 'intrachromosomal deletion', 'intrachromosomal fold-back inversion', 'intrachromosomal inversion', 'intrachromosomal tandem duplication', 'Intrachromosomal unknown type', 'intrachromosomal with inverted orientation', 'intrachromosomal with non-inverted orientation'. |
 |
| Sample | Symbol_a | Chr_a | Start_a | End_a | Symbol_b | Chr_b | Start_b | End_b |
| pancreas | DCT | chr13 | 95119000 | 95119020 | CLDN10 | chr13 | 96123104 | 96123124 |
| cf) Tissue number; Tissue name (1;Breast, 2;Central_nervous_system, 3;Haematopoietic_and_lymphoid_tissue, 4;Large_intestine, 5;Liver, 6;Lung, 7;Ovary, 8;Pancreas, 9;Prostate, 10;Skin, 11;Soft_tissue, 12;Upper_aerodigestive_tract) |
| * From mRNA Sanger sequences, Chitars2.0 arranged chimeric transcripts. This table shows DCT related fusion information. |
| ID | Head Gene | Tail Gene | Accession | Gene_a | qStart_a | qEnd_a | Chromosome_a | tStart_a | tEnd_a | Gene_a | qStart_a | qEnd_a | Chromosome_a | tStart_a | tEnd_a |
| Top |
| There's no copy number variation information in COSMIC data for this gene. |
| Top |
|
 |
| Top |
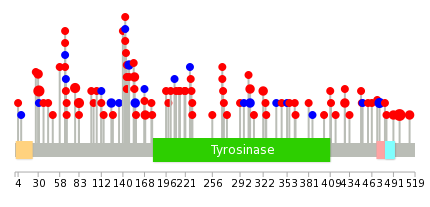
| Stat. for Non-Synonymous SNVs (# total SNVs=95) | (# total SNVs=21) |
 |  |
(# total SNVs=1) | (# total SNVs=0) |
 |
| Top |
| * When you move the cursor on each content, you can see more deailed mutation information on the Tooltip. Those are primary_site,primary_histology,mutation(aa),pubmedID. |
| GRCh37 position | Mutation(aa) | Unique sampleID count |
| chr13:95092216-95092216 | p.R499Q | 7 |
| chr13:95131418-95131418 | p.T31M | 5 |
| chr13:95121132-95121132 | p.D155N | 3 |
| chr13:95092293-95092293 | p.L473L | 3 |
| chr13:95131262-95131262 | p.R83H | 3 |
| chr13:95131277-95131277 | p.R78Q | 3 |
| chr13:95092217-95092217 | p.R499* | 3 |
| chr13:95092240-95092240 | p.A491V | 2 |
| chr13:95114392-95114392 | p.G305G | 2 |
| chr13:95121127-95121127 | p.Y156Y | 2 |
| Top |
|
 |
| Point Mutation/ Tissue ID | 1 | 2 | 3 | 4 | 5 | 6 | 7 | 8 | 9 | 10 | 11 | 12 | 13 | 14 | 15 | 16 | 17 | 18 | 19 | 20 |
| # sample | 4 | 1 | 20 | 1 | 2 | 5 | 1 | 13 | 4 | 2 | 2 | 8 | 1 | 13 | ||||||
| # mutation | 4 | 1 | 21 | 1 | 2 | 5 | 1 | 13 | 4 | 2 | 2 | 8 | 1 | 12 | ||||||
| nonsynonymous SNV | 2 | 1 | 17 | 1 | 2 | 4 | 1 | 9 | 3 | 2 | 2 | 7 | 1 | 9 | ||||||
| synonymous SNV | 2 | 4 | 1 | 4 | 1 | 1 | 3 |
| cf) Tissue ID; Tissue type (1; BLCA[Bladder Urothelial Carcinoma], 2; BRCA[Breast invasive carcinoma], 3; CESC[Cervical squamous cell carcinoma and endocervical adenocarcinoma], 4; COAD[Colon adenocarcinoma], 5; GBM[Glioblastoma multiforme], 6; Glioma Low Grade, 7; HNSC[Head and Neck squamous cell carcinoma], 8; KICH[Kidney Chromophobe], 9; KIRC[Kidney renal clear cell carcinoma], 10; KIRP[Kidney renal papillary cell carcinoma], 11; LAML[Acute Myeloid Leukemia], 12; LUAD[Lung adenocarcinoma], 13; LUSC[Lung squamous cell carcinoma], 14; OV[Ovarian serous cystadenocarcinoma ], 15; PAAD[Pancreatic adenocarcinoma], 16; PRAD[Prostate adenocarcinoma], 17; SKCM[Skin Cutaneous Melanoma], 18:STAD[Stomach adenocarcinoma], 19:THCA[Thyroid carcinoma], 20:UCEC[Uterine Corpus Endometrial Carcinoma]) |
| Top |
| * We represented just top 10 SNVs. When you move the cursor on each content, you can see more deailed mutation information on the Tooltip. Those are primary_site, primary_histology, mutation(aa), pubmedID. |
| Genomic Position | Mutation(aa) | Unique sampleID count |
| chr13:95092216 | p.R499Q,DCT | 5 |
| chr13:95121132 | p.D155Y,DCT | 4 |
| chr13:95131263 | p.G305G,DCT | 2 |
| chr13:95131277 | p.R83C,DCT | 2 |
| chr13:95118820 | p.R78Q,DCT | 2 |
| chr13:95131316 | p.D230N,DCT | 2 |
| chr13:95114392 | p.R65L,DCT | 2 |
| chr13:95118904 | p.N178K,DCT | 1 |
| chr13:95131420 | p.G112G,DCT | 1 |
| chr13:95095700 | p.F8F,DCT | 1 |
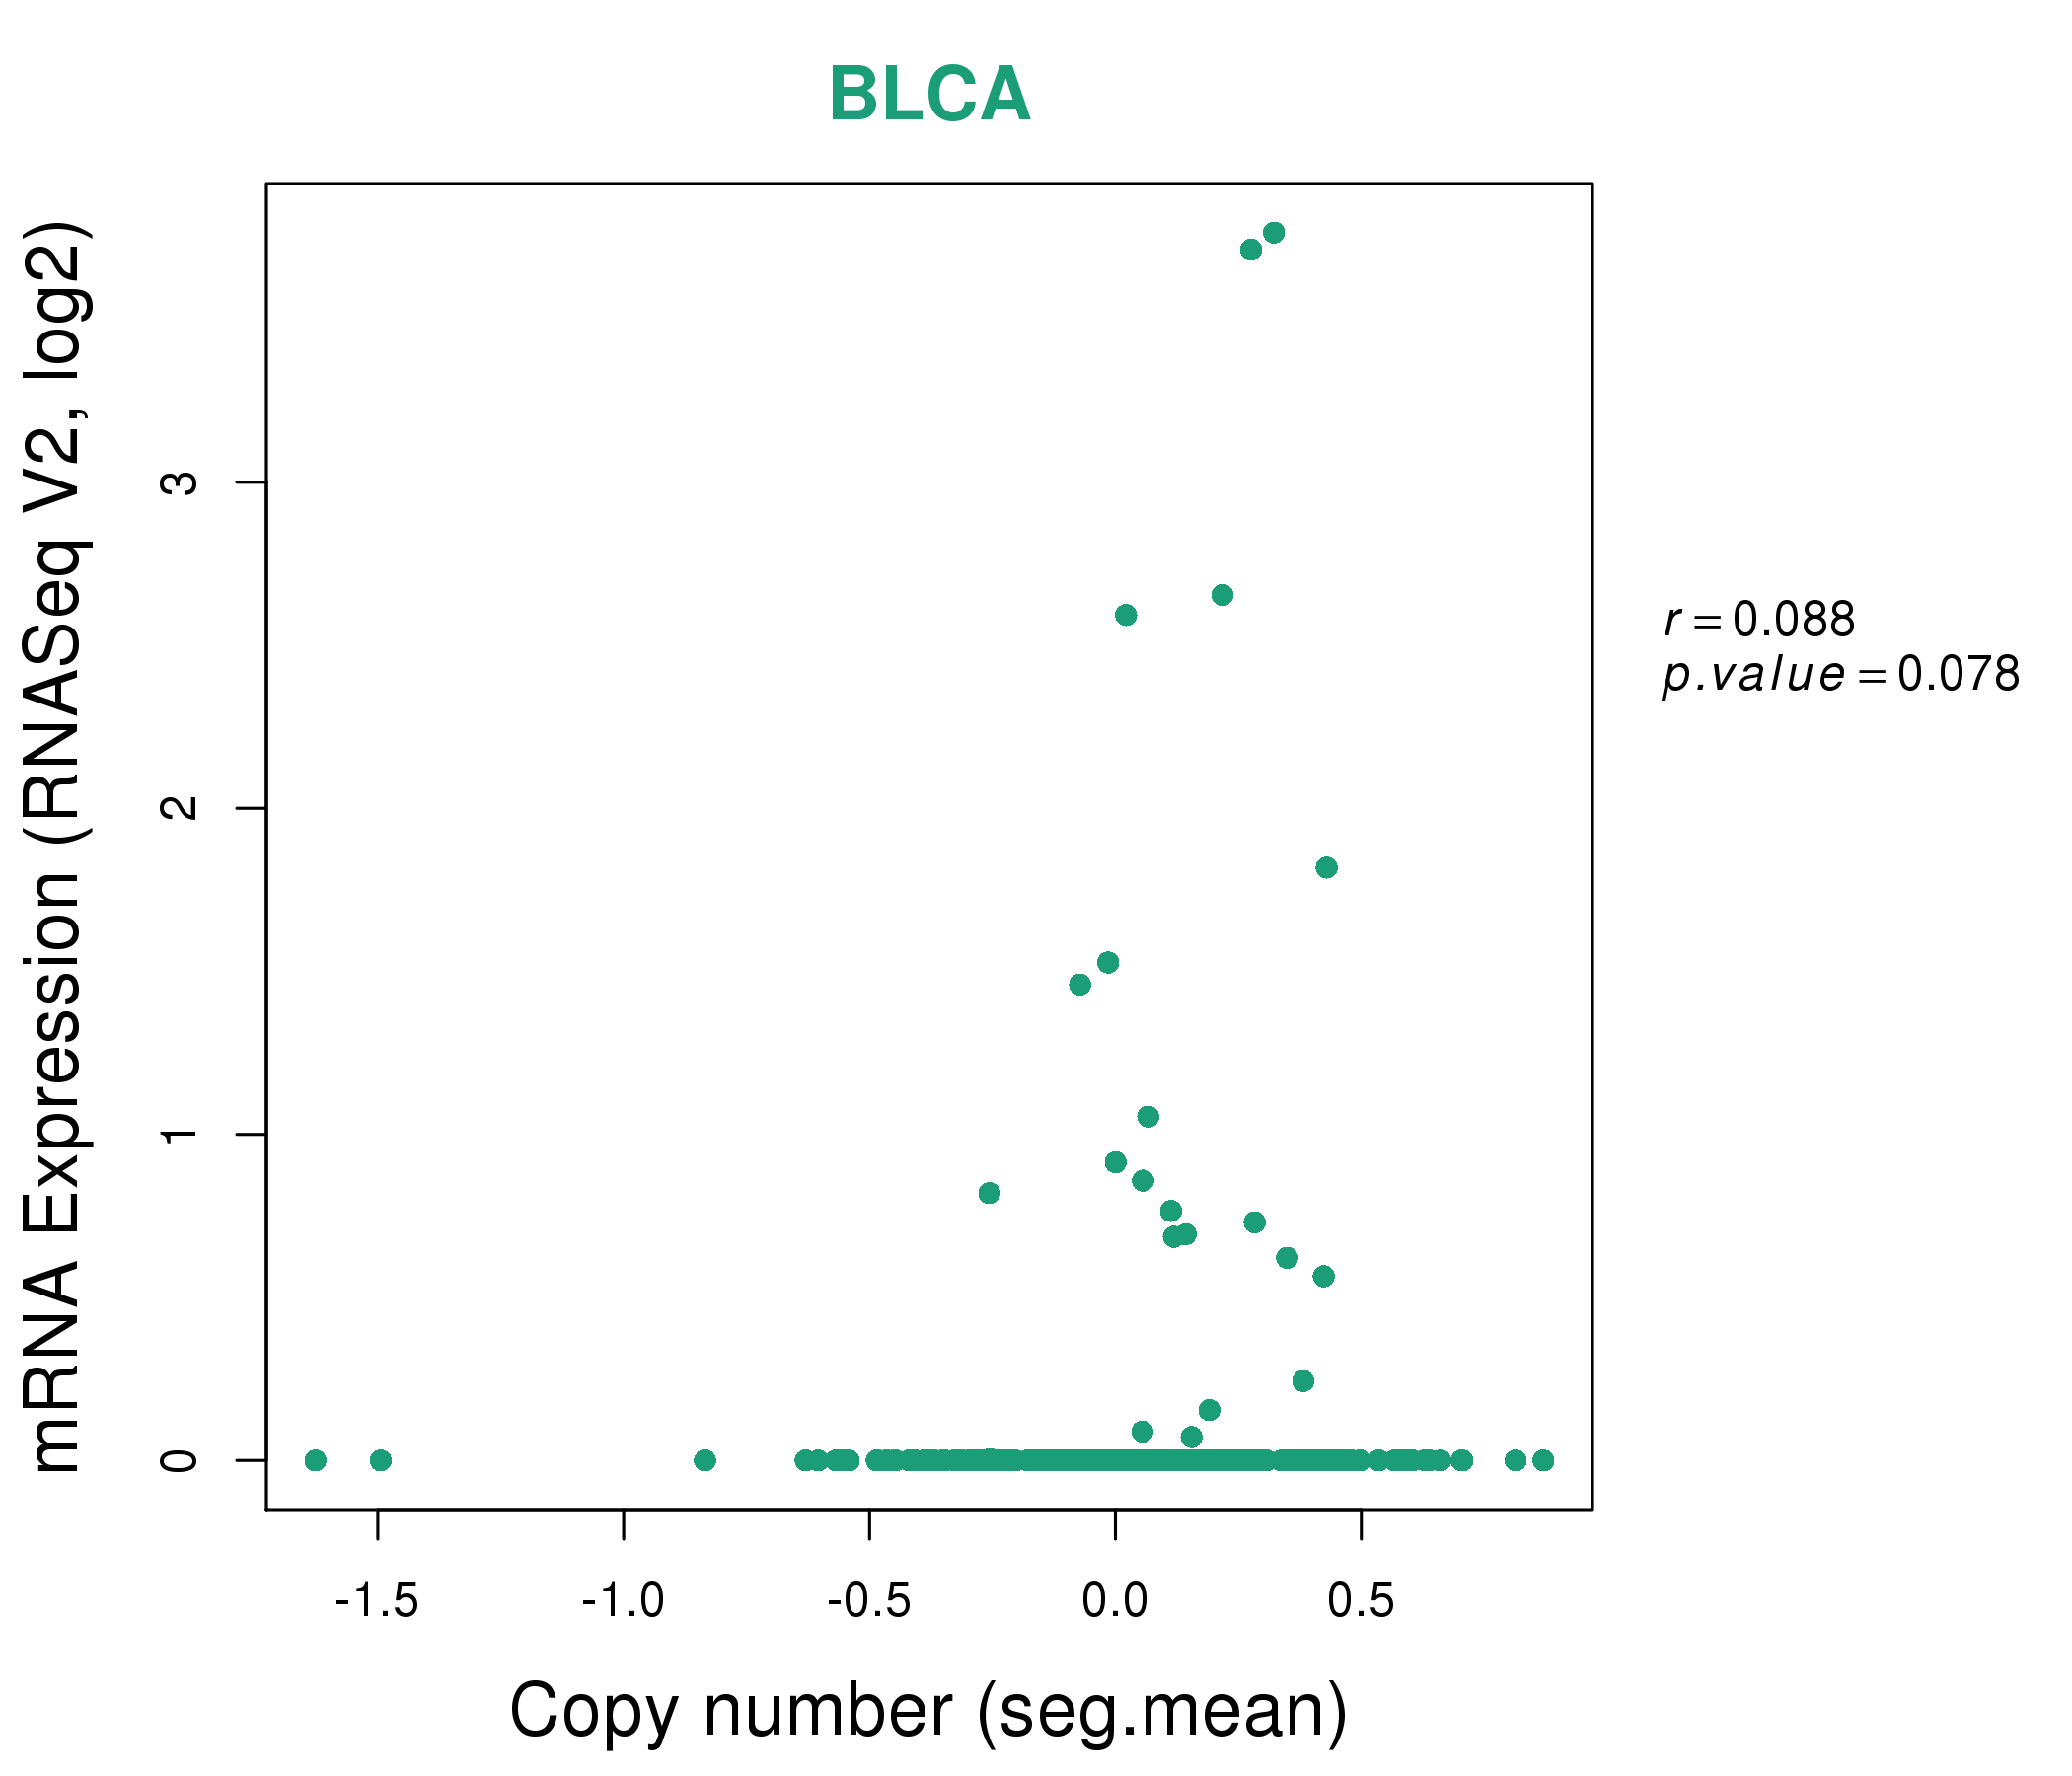
| * Copy number data were extracted from TCGA using R package TCGA-Assembler. The URLs of all public data files on TCGA DCC data server were gathered on Jan-05-2015. Function ProcessCNAData in TCGA-Assembler package was used to obtain gene-level copy number value which is calculated as the average copy number of the genomic region of a gene. |
 |
| cf) Tissue ID[Tissue type]: BLCA[Bladder Urothelial Carcinoma], BRCA[Breast invasive carcinoma], CESC[Cervical squamous cell carcinoma and endocervical adenocarcinoma], COAD[Colon adenocarcinoma], GBM[Glioblastoma multiforme], Glioma Low Grade, HNSC[Head and Neck squamous cell carcinoma], KICH[Kidney Chromophobe], KIRC[Kidney renal clear cell carcinoma], KIRP[Kidney renal papillary cell carcinoma], LAML[Acute Myeloid Leukemia], LUAD[Lung adenocarcinoma], LUSC[Lung squamous cell carcinoma], OV[Ovarian serous cystadenocarcinoma ], PAAD[Pancreatic adenocarcinoma], PRAD[Prostate adenocarcinoma], SKCM[Skin Cutaneous Melanoma], STAD[Stomach adenocarcinoma], THCA[Thyroid carcinoma], UCEC[Uterine Corpus Endometrial Carcinoma] |
| Top |
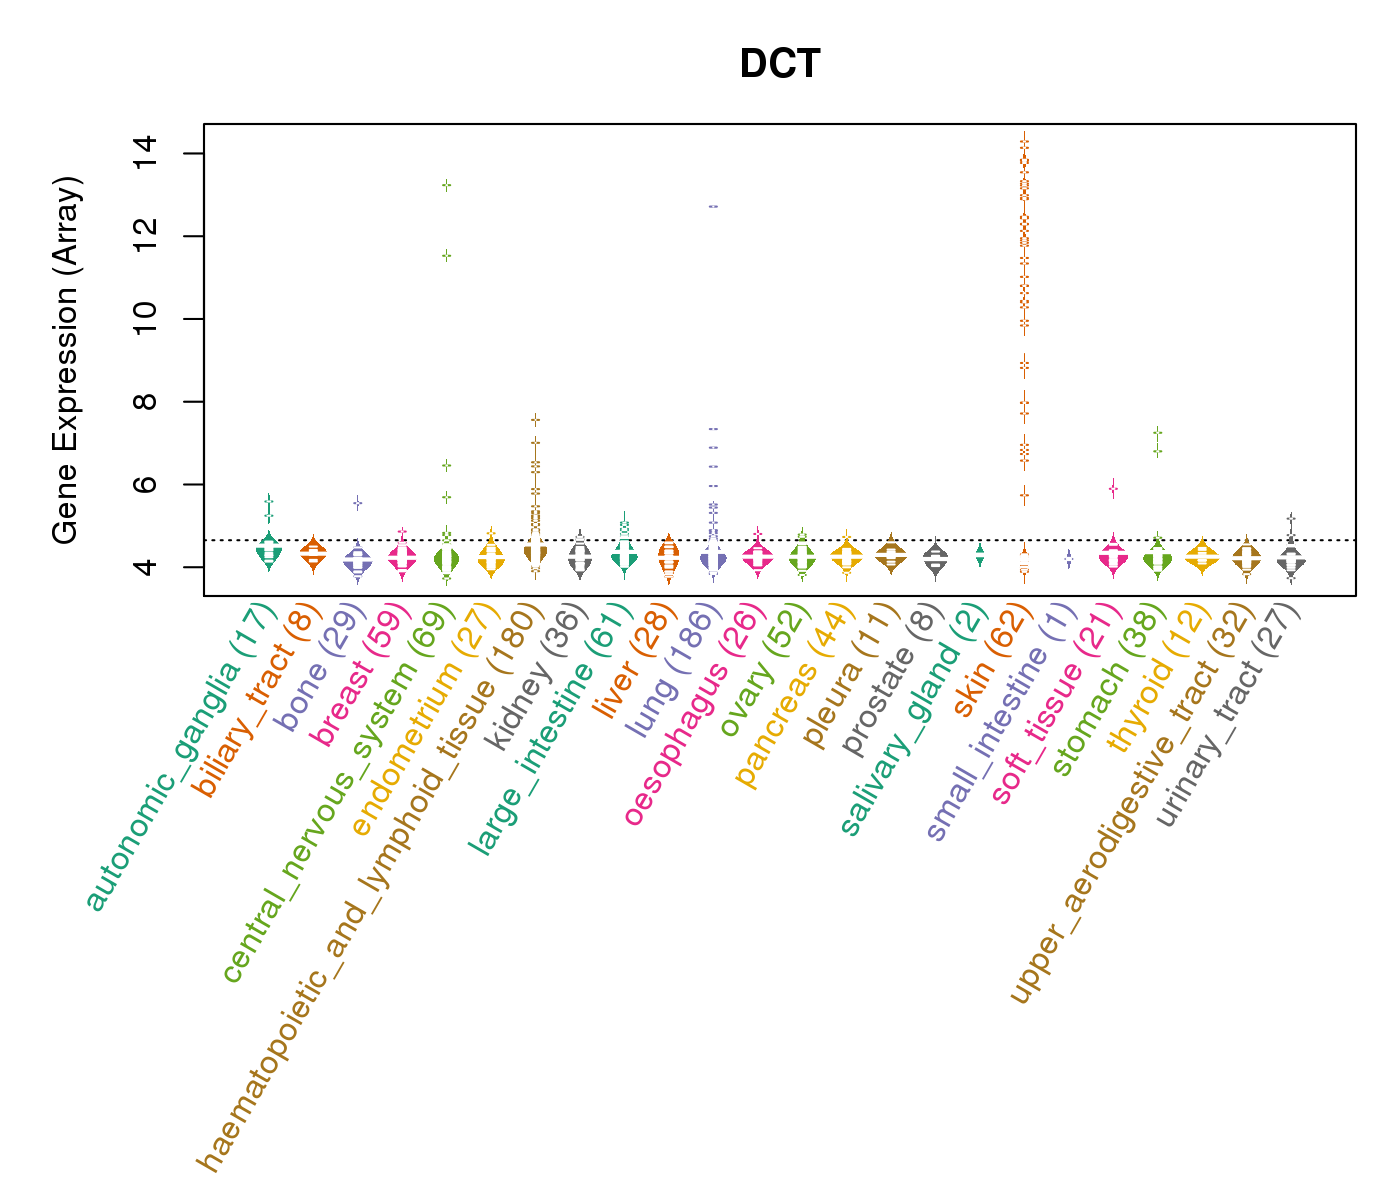
| Gene Expression for DCT |
| * CCLE gene expression data were extracted from CCLE_Expression_Entrez_2012-10-18.res: Gene-centric RMA-normalized mRNA expression data. |
 |
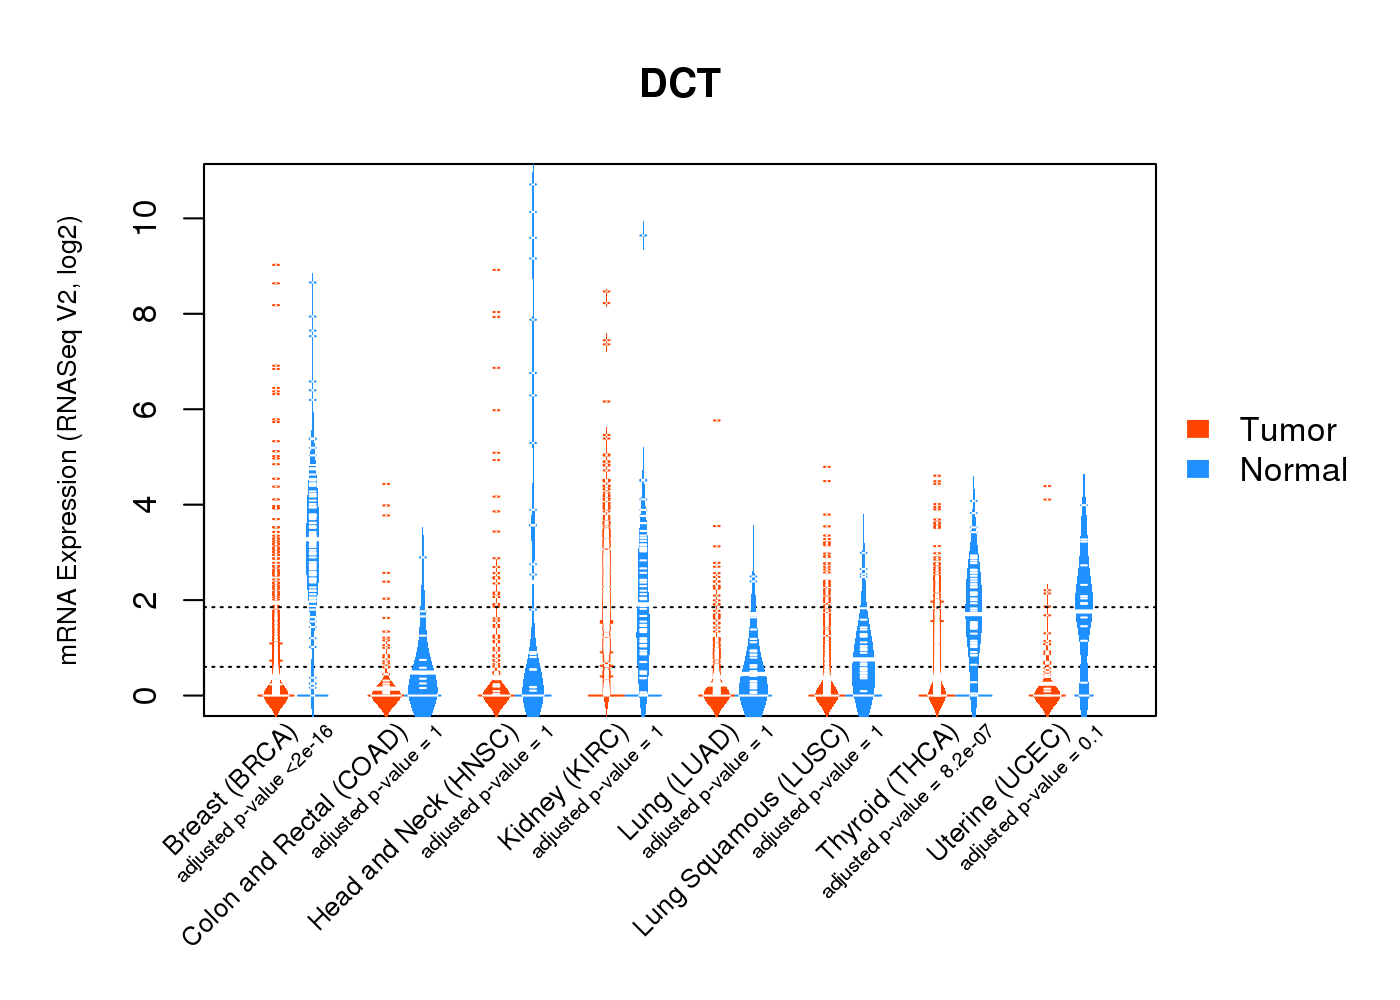
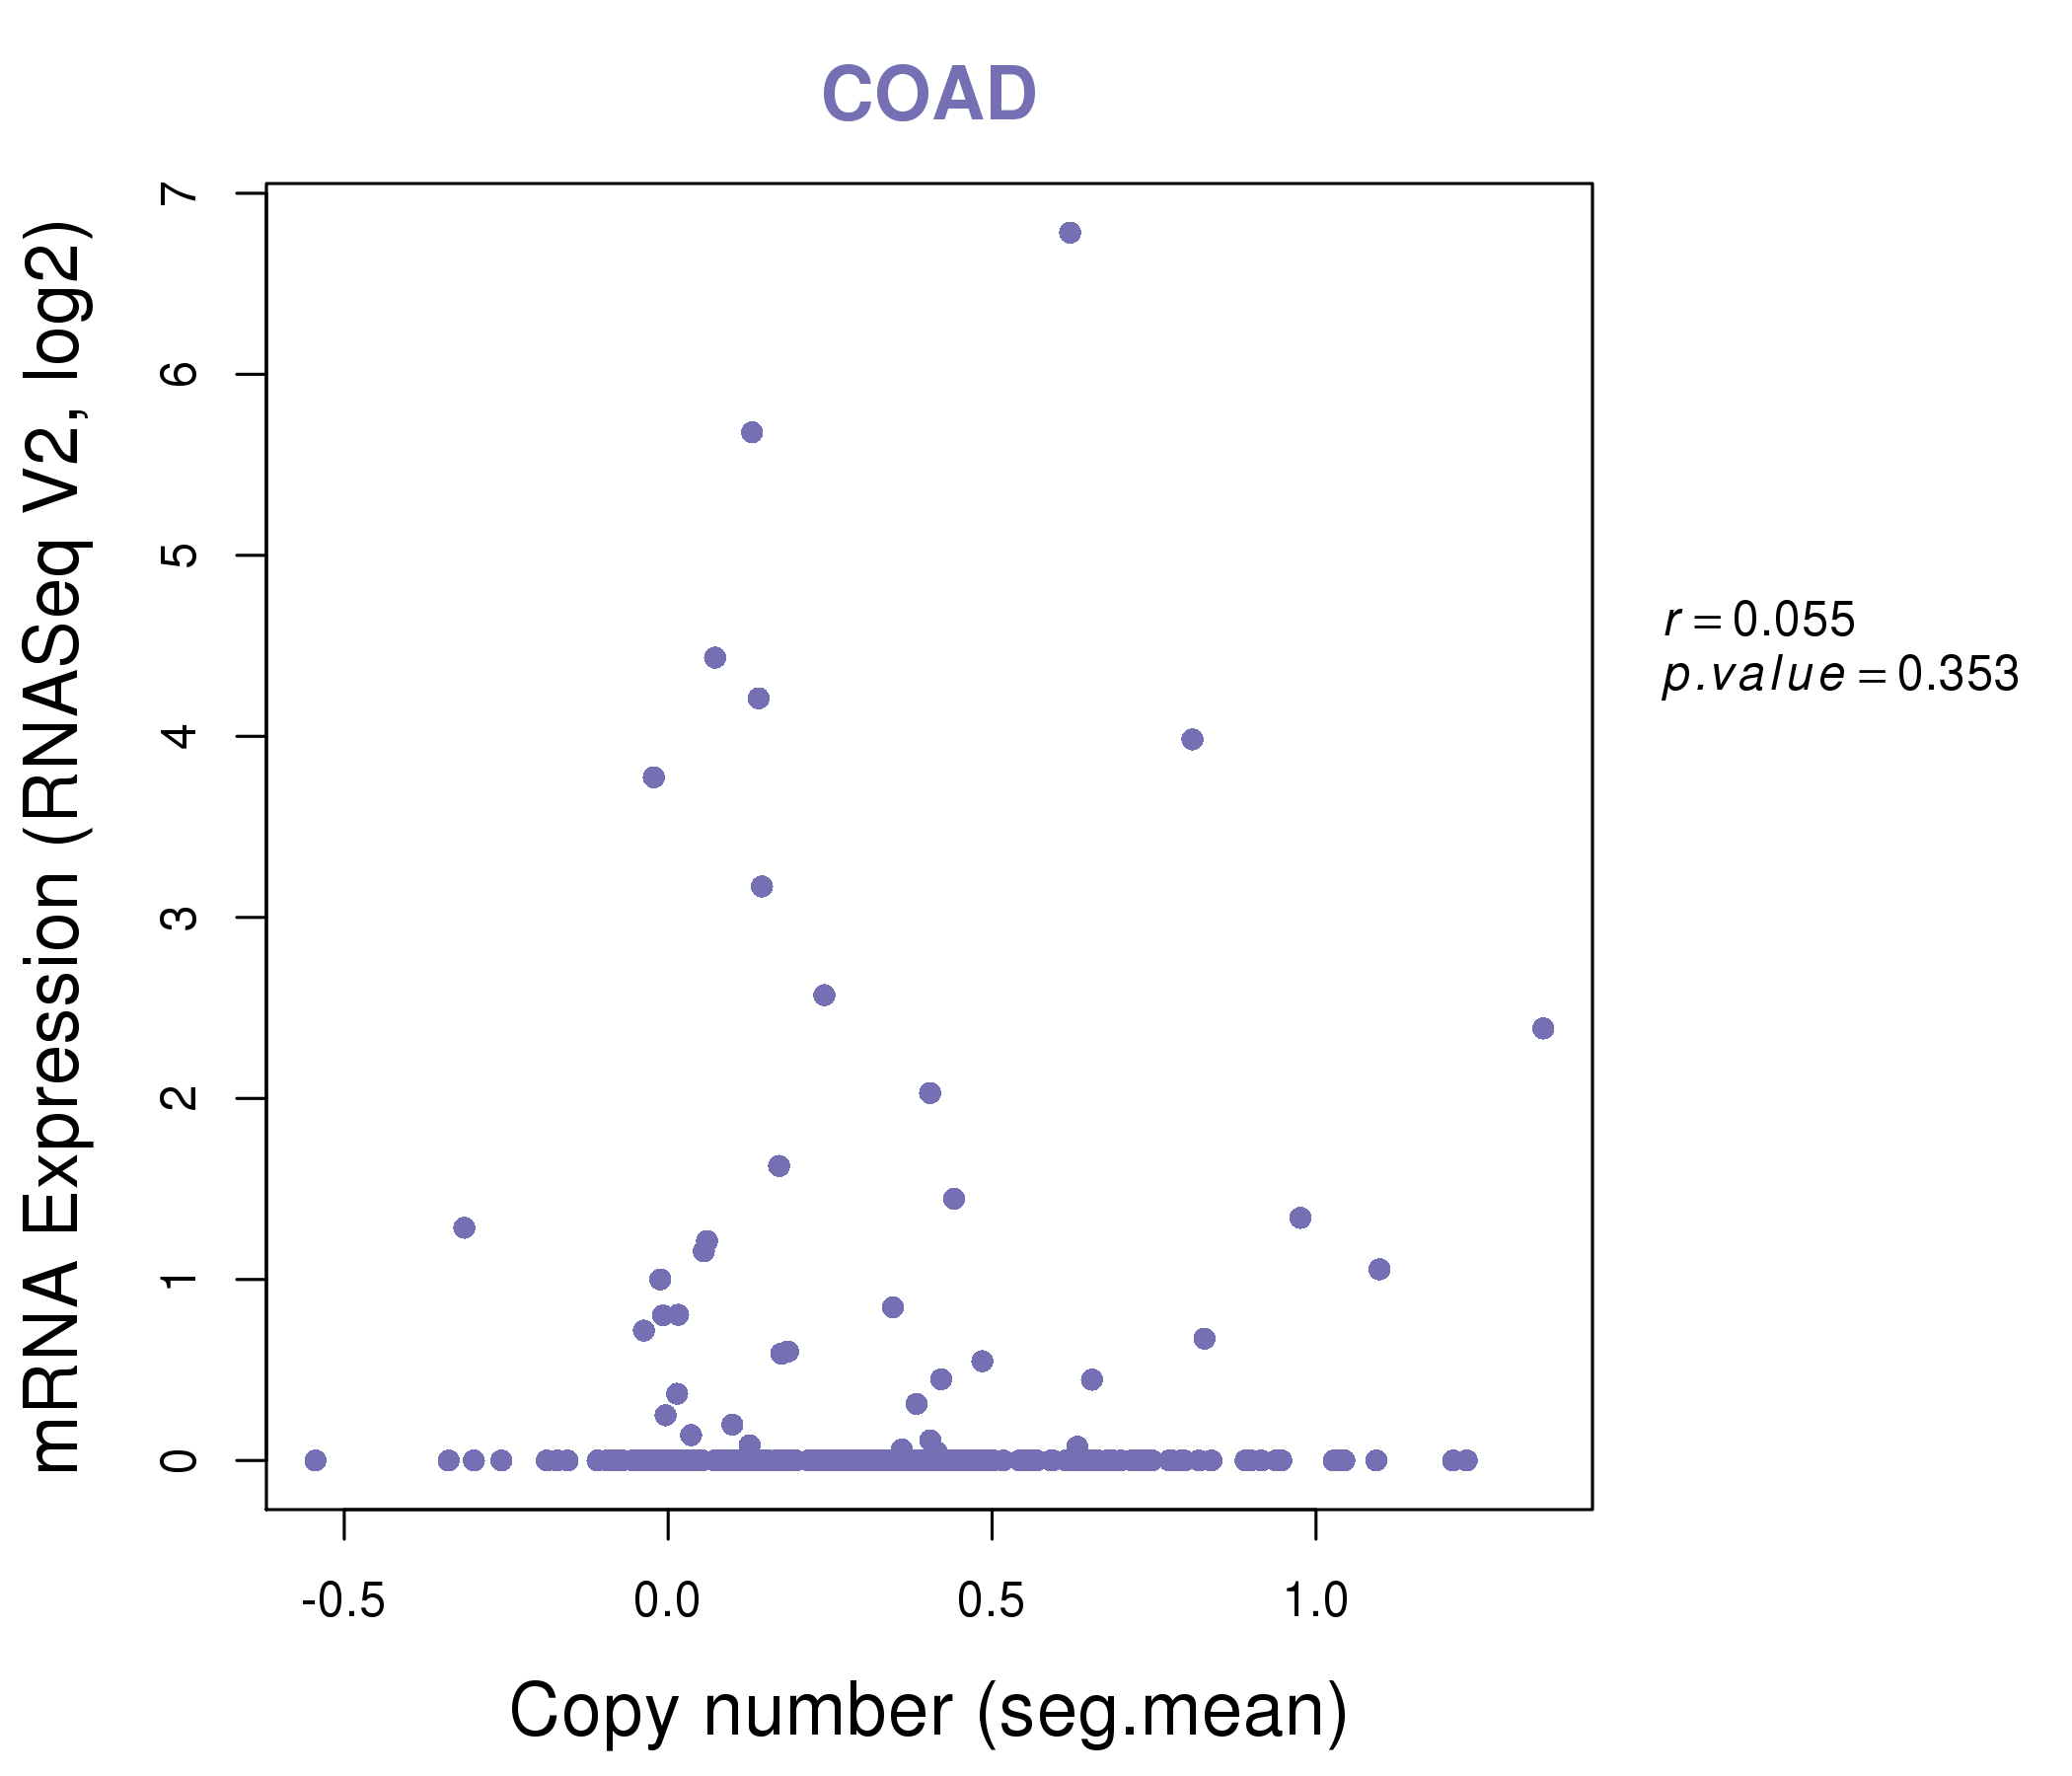
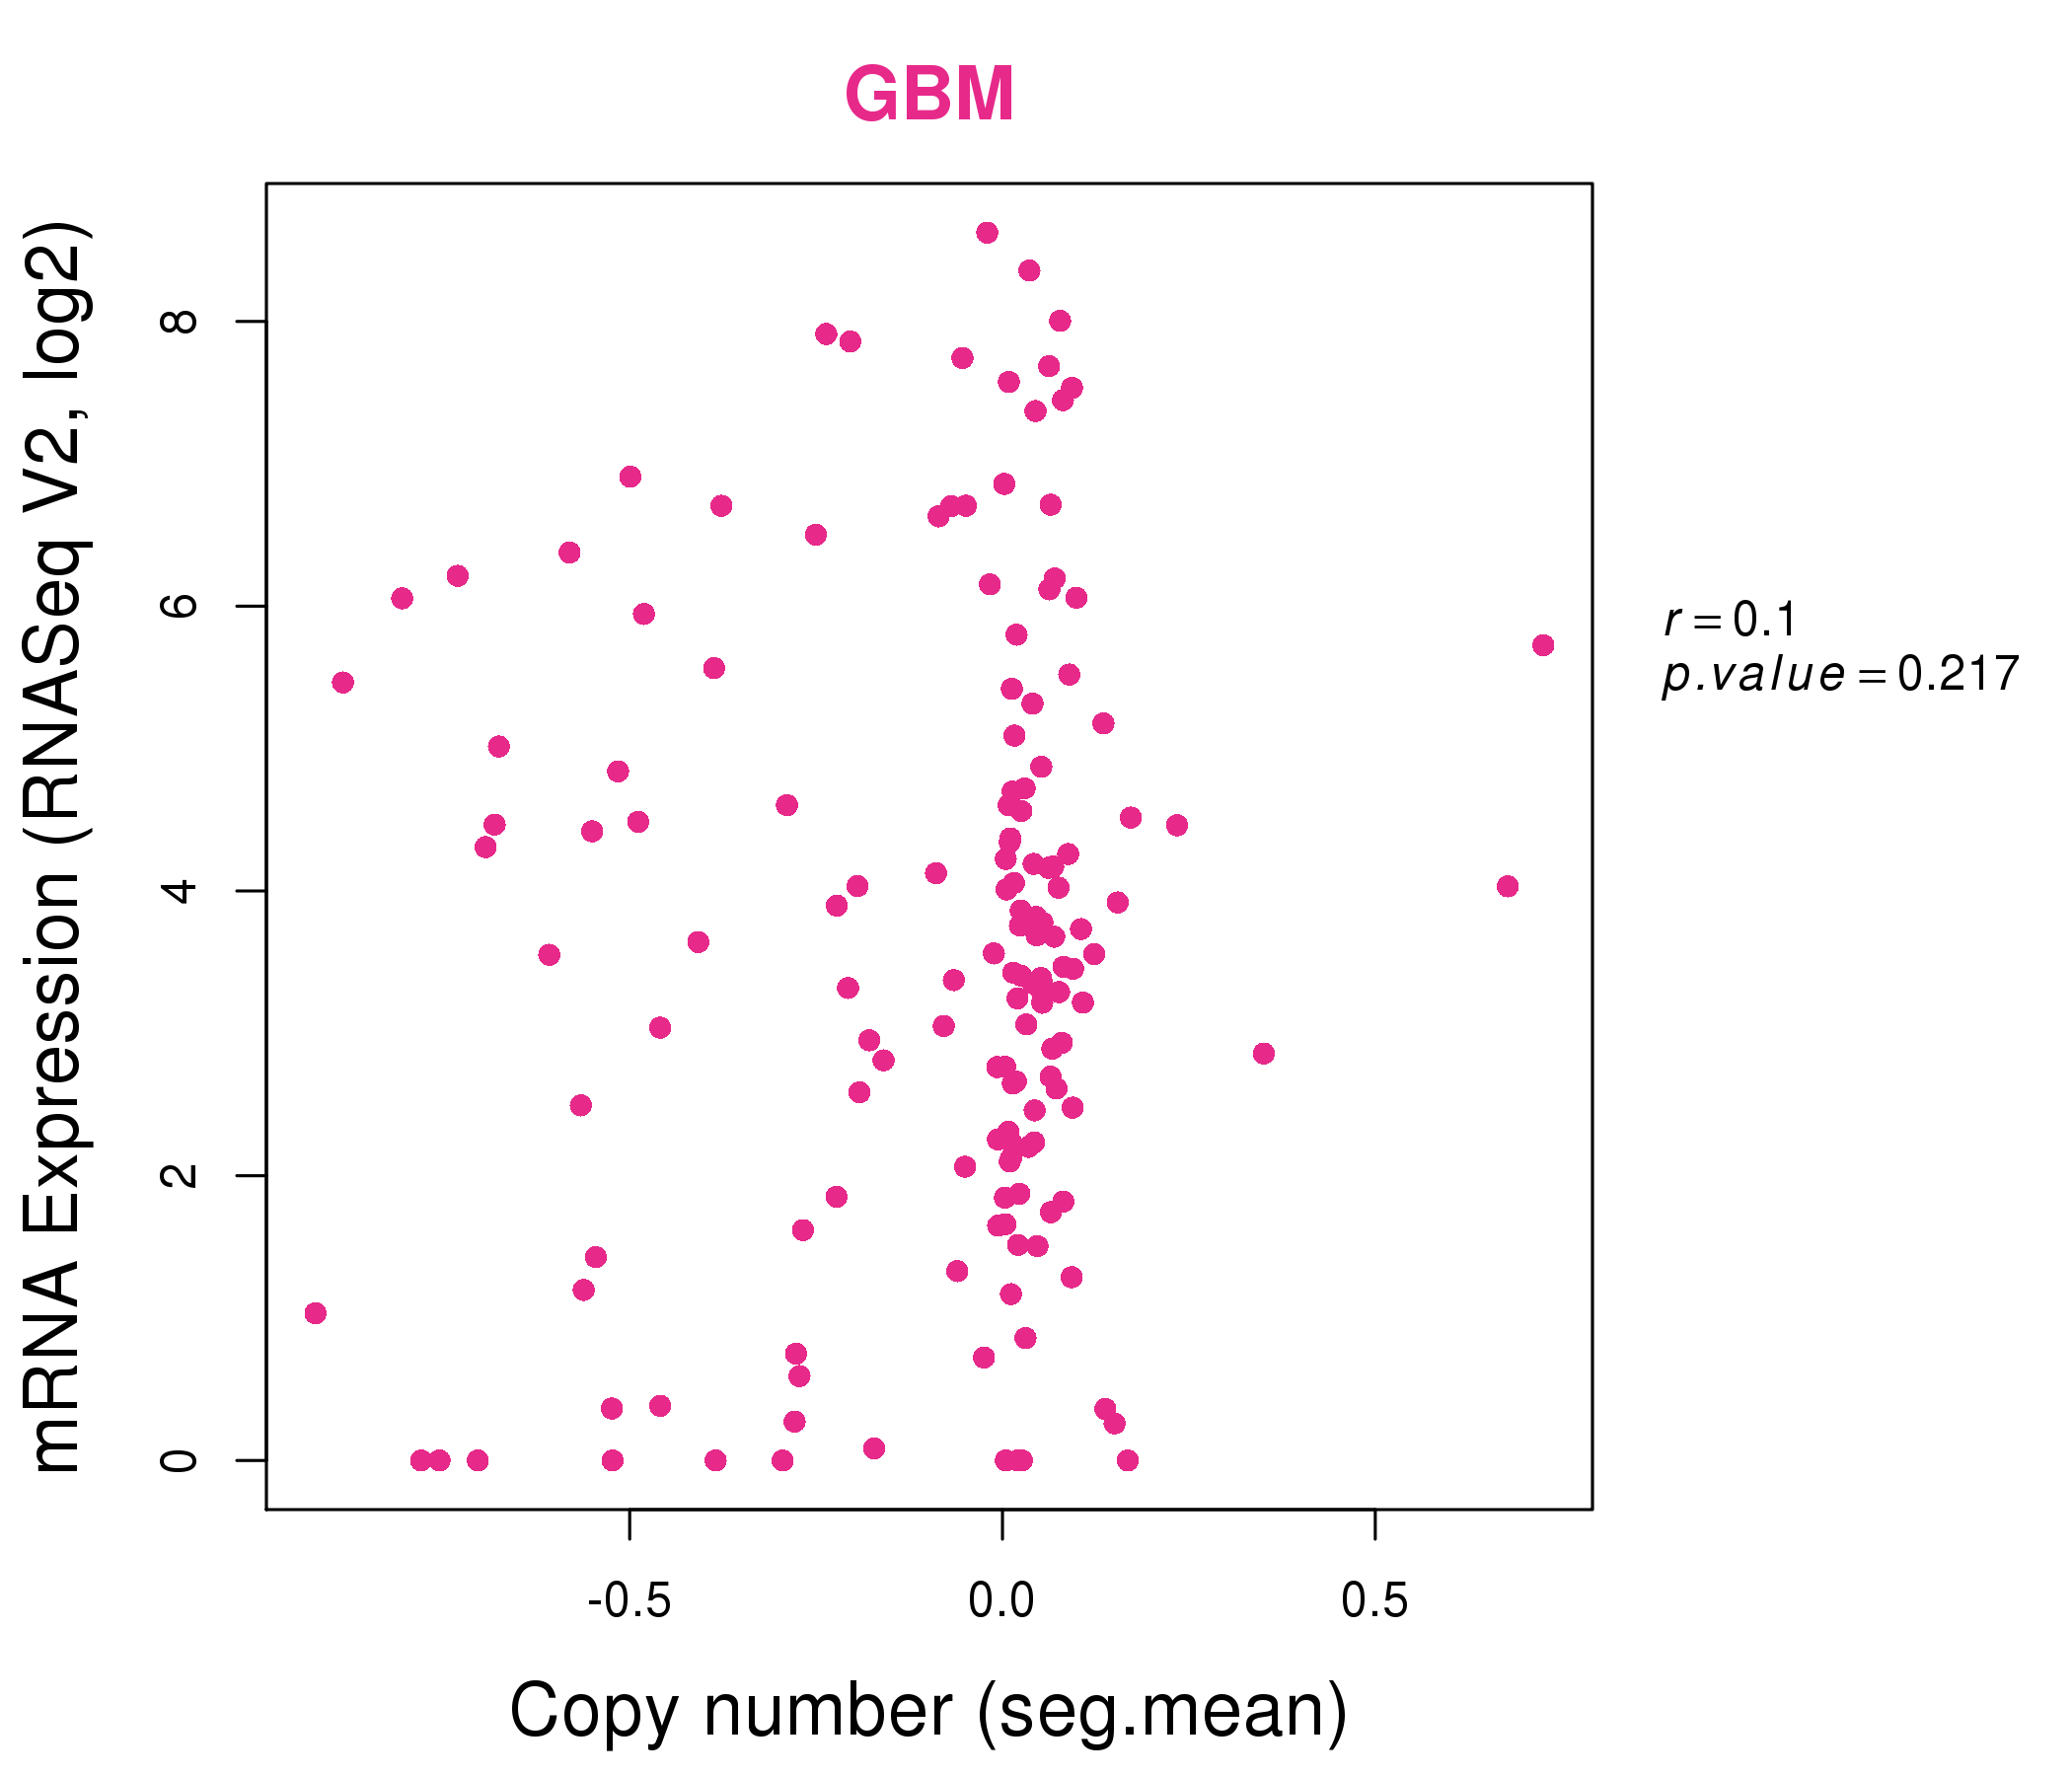
| * Normalized gene expression data of RNASeqV2 was extracted from TCGA using R package TCGA-Assembler. The URLs of all public data files on TCGA DCC data server were gathered at Jan-05-2015. Only eight cancer types have enough normal control samples for differential expression analysis. (t test, adjusted p<0.05 (using Benjamini-Hochberg FDR)) |
 |
| Top |
| * This plots show the correlation between CNV and gene expression. |
: Open all plots for all cancer types
 |
|
 |
|

| Top |
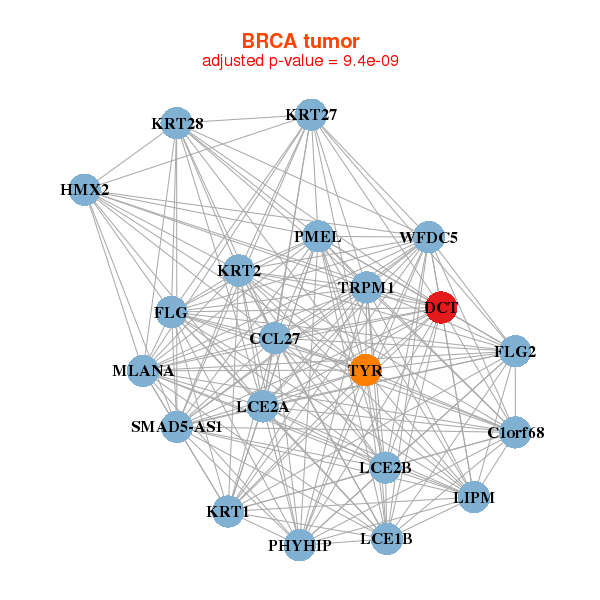
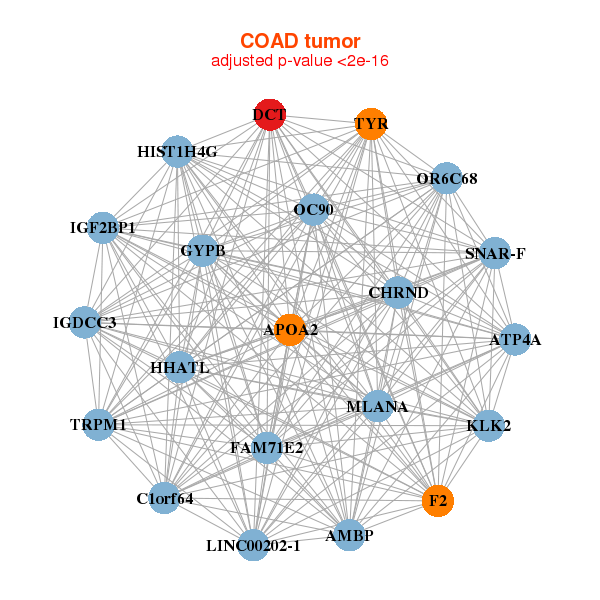
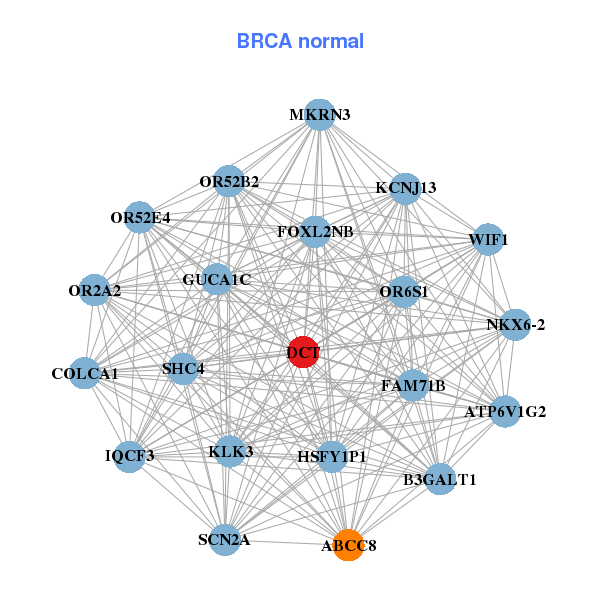
| Gene-Gene Network Information |
| * Co-Expression network figures were drawn using R package igraph. Only the top 20 genes with the highest correlations were shown. Red circle: input gene, orange circle: cell metabolism gene, sky circle: other gene |
: Open all plots for all cancer types
 |
|
| AGA,BBS12,C15orf57,WWC2-AS2,TRAPPC11,CAMLG,CBR4, PRIMPOL,CDKN2AIP,CYP4V2,DCTD,EID1,FBXL5,FBXO8, IRF2,CFAP97,LAMTOR3,OCIAD1,RWDD4,TMEM192,UFSP2 | C6orf48,CDK4,CLTA,DCTD,EEF1A1,EEF1A1P9,ERGIC3, KDELR1,LSM2,LYRM4,POLR2G,PPIA,PRELID1,RAB34, SIGMAR1,SSR2,SSR4,TMEM179B,UBE2I,UFC1,YIPF3 |
 |
|
| ARFIP1,C4orf27,TRAPPC11,TMA16,CASP3,PRIMPOL,CDKN2AIP, DCTD,ENOPH1,FRG1,CFAP97,MRPS18C,PIGY,PLRG1, PPA2,PPID,RAP1GDS1,RWDD4,SPCS3,UBE2D3,UFSP2 | ARMC10,BOD1,CINP,DCTD,DPH5,EEF1A1P9,EIF3E, HSCB,MANEA,MRPS27,ICE2,PDCD2,PDCD2L,PRCP, PRKRIR,RPS8,RSL1D1,SETMAR,TIMM9,TMEM5,ZNF22 |
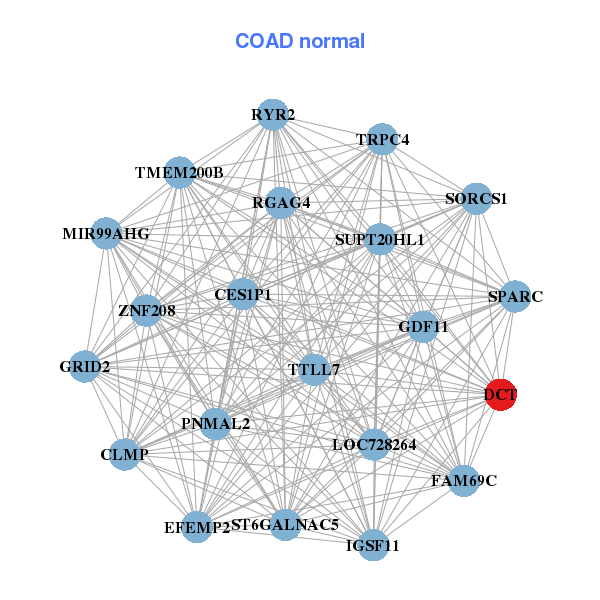
| * Co-Expression network figures were drawn using R package igraph. Only the top 20 genes with the highest correlations were shown. Red circle: input gene, orange circle: cell metabolism gene, sky circle: other gene |
: Open all plots for all cancer types
| Top |
: Open all interacting genes' information including KEGG pathway for all interacting genes from DAVID
| Top |
| Pharmacological Information for DCT |
| There's no related Drug. |
| Top |
| Cross referenced IDs for DCT |
| * We obtained these cross-references from Uniprot database. It covers 150 different DBs, 18 categories. http://www.uniprot.org/help/cross_references_section |
: Open all cross reference information
|
Copyright © 2016-Present - The Univsersity of Texas Health Science Center at Houston @ |