|
||||||||||||||||||||
| |
| Phenotypic Information (metabolism pathway, cancer, disease, phenome) |
| |
| |
| Gene-Gene Network Information: Co-Expression Network, Interacting Genes & KEGG |
| |
|


| Gene Summary for DCP2 |
| Basic gene info. | Gene symbol | DCP2 |
| Gene name | decapping mRNA 2 | |
| Synonyms | NUDT20 | |
| Cytomap | UCSC genome browser: 5q22.2 | |
| Genomic location | chr5 :112312406-112357892 | |
| Type of gene | protein-coding | |
| RefGenes | NM_001242377.1, NM_152624.5,NR_038352.1, | |
| Ensembl id | ENSG00000172795 | |
| Description | DCP2 decapping enzyme homologhDpcm7GpppN-mRNA hydrolasemRNA-decapping enzyme 2nudix (nucleoside diphosphate linked moiety X)-type motif 20 | |
| Modification date | 20141207 | |
| dbXrefs | MIM : 609844 | |
| HGNC : HGNC | ||
| Ensembl : ENSG00000172795 | ||
| HPRD : 13125 | ||
| Vega : OTTHUMG00000162853 | ||
| Protein | UniProt: Q8IU60 go to UniProt's Cross Reference DB Table | |
| Expression | CleanEX: HS_DCP2 | |
| BioGPS: 167227 | ||
| Gene Expression Atlas: ENSG00000172795 | ||
| The Human Protein Atlas: ENSG00000172795 | ||
| Pathway | NCI Pathway Interaction Database: DCP2 | |
| KEGG: DCP2 | ||
| REACTOME: DCP2 | ||
| ConsensusPathDB | ||
| Pathway Commons: DCP2 | ||
| Metabolism | MetaCyc: DCP2 | |
| HUMANCyc: DCP2 | ||
| Regulation | Ensembl's Regulation: ENSG00000172795 | |
| miRBase: chr5 :112,312,406-112,357,892 | ||
| TargetScan: NM_001242377 | ||
| cisRED: ENSG00000172795 | ||
| Context | iHOP: DCP2 | |
| cancer metabolism search in PubMed: DCP2 | ||
| UCL Cancer Institute: DCP2 | ||
| Assigned class in ccmGDB | A - This gene has a literature evidence and it belongs to cancer gene. | |
| References showing role of DCP2 in cancer cell metabolism | 1. Grudzien-Nogalska E, Jemielity J, Kowalska J, Darzynkiewicz E, Rhoads RE (2007) Phosphorothioate cap analogs stabilize mRNA and increase translational efficiency in mammalian cells. RNA 13: 1745-1755. doi: 10.1261/rna.701307. pmid: 1986804. go to article 2. Mencia N, Selga E, Noe V, Ciudad CJ (2011) Underexpression of miR-224 in methotrexate resistant human colon cancer cells. Biochem Pharmacol 82: 1572-1582. doi: 10.1016/j.bcp.2011.08.009. go to article | |
| Top |
| Phenotypic Information for DCP2(metabolism pathway, cancer, disease, phenome) |
| Cancer | CGAP: DCP2 |
| Familial Cancer Database: DCP2 | |
| * This gene is included in those cancer gene databases. |
|
|
|
|
|
| . | ||||||||||||||
Oncogene 1 | Significant driver gene in | |||||||||||||||||||
| cf) number; DB name 1 Oncogene; http://nar.oxfordjournals.org/content/35/suppl_1/D721.long, 2 Tumor Suppressor gene; https://bioinfo.uth.edu/TSGene/, 3 Cancer Gene Census; http://www.nature.com/nrc/journal/v4/n3/abs/nrc1299.html, 4 CancerGenes; http://nar.oxfordjournals.org/content/35/suppl_1/D721.long, 5 Network of Cancer Gene; http://ncg.kcl.ac.uk/index.php, 1Therapeutic Vulnerabilities in Cancer; http://cbio.mskcc.org/cancergenomics/statius/ |
| REACTOME_METABOLISM_OF_MRNA REACTOME_METABOLISM_OF_RNA | |
| OMIM | 609844; gene. |
| Orphanet | |
| Disease | KEGG Disease: DCP2 |
| MedGen: DCP2 (Human Medical Genetics with Condition) | |
| ClinVar: DCP2 | |
| Phenotype | MGI: DCP2 (International Mouse Phenotyping Consortium) |
| PhenomicDB: DCP2 | |
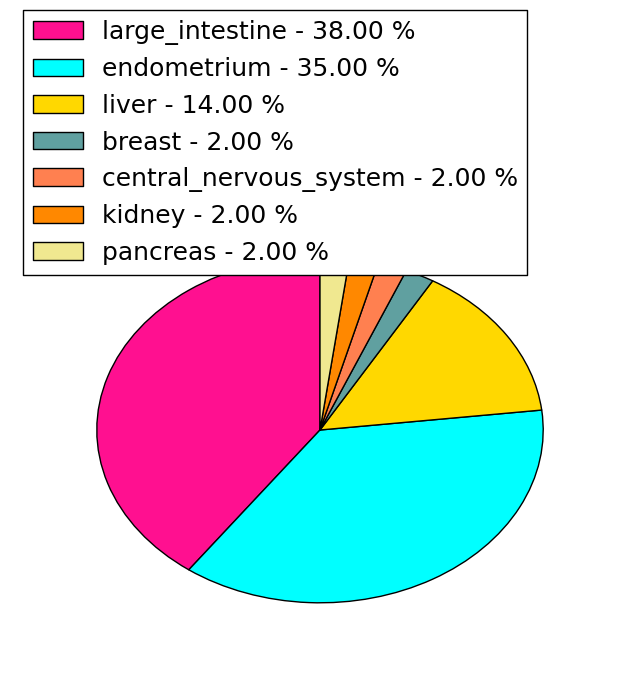
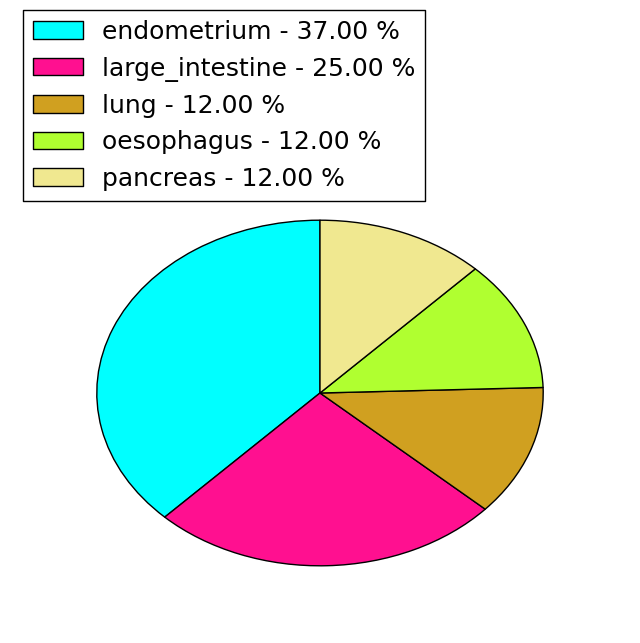
| Mutations for DCP2 |
| * Under tables are showing count per each tissue to give us broad intuition about tissue specific mutation patterns.You can go to the detailed page for each mutation database's web site. |
| - Statistics for Tissue and Mutation type | Top |
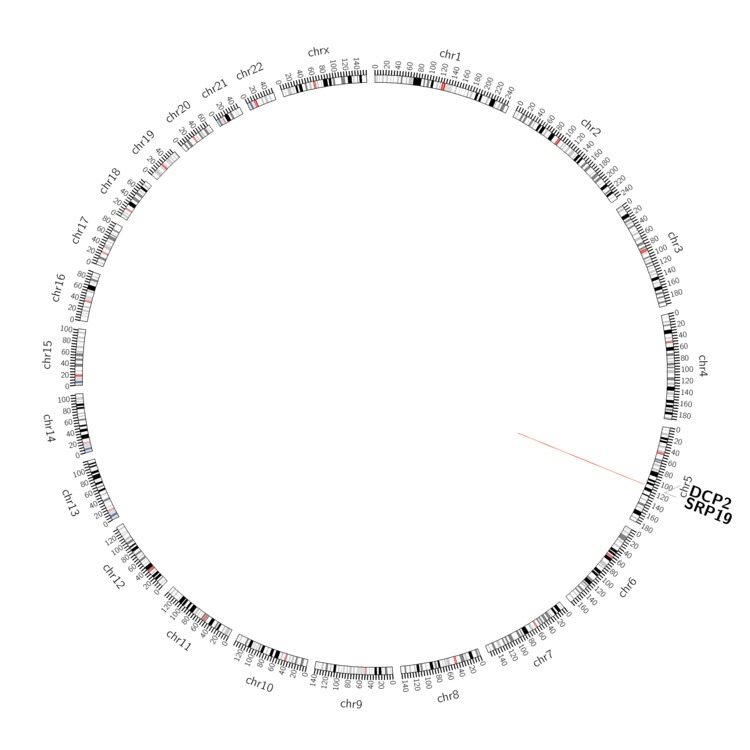 |
| - For Inter-chromosomal Variations |
| There's no inter-chromosomal structural variation. |
| - For Intra-chromosomal Variations |
| * Intra-chromosomal variantions includes 'intrachromosomal amplicon to amplicon', 'intrachromosomal amplicon to non-amplified dna', 'intrachromosomal deletion', 'intrachromosomal fold-back inversion', 'intrachromosomal inversion', 'intrachromosomal tandem duplication', 'Intrachromosomal unknown type', 'intrachromosomal with inverted orientation', 'intrachromosomal with non-inverted orientation'. |
 |
| Sample | Symbol_a | Chr_a | Start_a | End_a | Symbol_b | Chr_b | Start_b | End_b |
| ovary | DCP2 | chr5 | 112337257 | 112337277 | chr5 | 112002066 | 112002086 | |
| ovary | DCP2 | chr5 | 112345642 | 112345662 | DCP2 | chr5 | 112342280 | 112342300 |
| pancreas | DCP2 | chr5 | 112332702 | 112332722 | SRP19 | chr5 | 112224571 | 112224591 |
| cf) Tissue number; Tissue name (1;Breast, 2;Central_nervous_system, 3;Haematopoietic_and_lymphoid_tissue, 4;Large_intestine, 5;Liver, 6;Lung, 7;Ovary, 8;Pancreas, 9;Prostate, 10;Skin, 11;Soft_tissue, 12;Upper_aerodigestive_tract) |
| * From mRNA Sanger sequences, Chitars2.0 arranged chimeric transcripts. This table shows DCP2 related fusion information. |
| ID | Head Gene | Tail Gene | Accession | Gene_a | qStart_a | qEnd_a | Chromosome_a | tStart_a | tEnd_a | Gene_a | qStart_a | qEnd_a | Chromosome_a | tStart_a | tEnd_a |
| AK025019 | KLF11 | 2 | 61 | 2 | 10193819 | 10193878 | DCP2 | 61 | 2511 | 5 | 112354215 | 112356667 | |
| CA945240 | DCP2 | 1 | 220 | 5 | 112356465 | 112357100 | DCP2 | 213 | 308 | 5 | 112356368 | 112356463 | |
| CB852569 | DCP2 | 21 | 226 | 5 | 112320135 | 112320344 | DCP2 | 221 | 369 | 5 | 112320003 | 112320151 | |
| Top |
| There's no copy number variation information in COSMIC data for this gene. |
| Top |
|
 |
| Top |
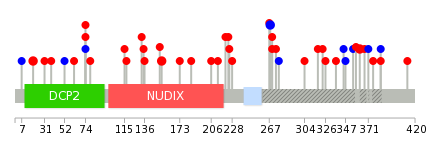
| Stat. for Non-Synonymous SNVs (# total SNVs=34) | (# total SNVs=8) |
 |  |
(# total SNVs=0) | (# total SNVs=0) |
| Top |
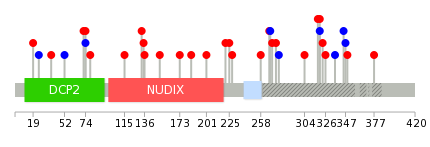
| * When you move the cursor on each content, you can see more deailed mutation information on the Tooltip. Those are primary_site,primary_histology,mutation(aa),pubmedID. |
| GRCh37 position | Mutation(aa) | Unique sampleID count |
| chr5:112336808-112336808 | p.K154E | 2 |
| chr5:112339641-112339641 | p.R270Q | 2 |
| chr5:112346489-112346489 | p.D362Y | 2 |
| chr5:112321534-112321534 | p.R19Q | 2 |
| chr5:112327832-112327832 | p.P74T | 2 |
| chr5:112337369-112337369 | p.L268L | 2 |
| chr5:112343733-112343733 | p.S347S | 1 |
| chr5:112327834-112327834 | p.P74P | 1 |
| chr5:112346470-112346470 | p.L355L | 1 |
| chr5:112327847-112327847 | p.Q79E | 1 |
| Top |
|
 |
| Point Mutation/ Tissue ID | 1 | 2 | 3 | 4 | 5 | 6 | 7 | 8 | 9 | 10 | 11 | 12 | 13 | 14 | 15 | 16 | 17 | 18 | 19 | 20 |
| # sample | 2 | 7 | 1 | 1 | 1 | 5 | 6 | 13 | ||||||||||||
| # mutation | 2 | 7 | 1 | 1 | 1 | 5 | 6 | 13 | ||||||||||||
| nonsynonymous SNV | 2 | 5 | 1 | 1 | 4 | 4 | 10 | |||||||||||||
| synonymous SNV | 2 | 1 | 1 | 2 | 3 |
| cf) Tissue ID; Tissue type (1; BLCA[Bladder Urothelial Carcinoma], 2; BRCA[Breast invasive carcinoma], 3; CESC[Cervical squamous cell carcinoma and endocervical adenocarcinoma], 4; COAD[Colon adenocarcinoma], 5; GBM[Glioblastoma multiforme], 6; Glioma Low Grade, 7; HNSC[Head and Neck squamous cell carcinoma], 8; KICH[Kidney Chromophobe], 9; KIRC[Kidney renal clear cell carcinoma], 10; KIRP[Kidney renal papillary cell carcinoma], 11; LAML[Acute Myeloid Leukemia], 12; LUAD[Lung adenocarcinoma], 13; LUSC[Lung squamous cell carcinoma], 14; OV[Ovarian serous cystadenocarcinoma ], 15; PAAD[Pancreatic adenocarcinoma], 16; PRAD[Prostate adenocarcinoma], 17; SKCM[Skin Cutaneous Melanoma], 18:STAD[Stomach adenocarcinoma], 19:THCA[Thyroid carcinoma], 20:UCEC[Uterine Corpus Endometrial Carcinoma]) |
| Top |
| * We represented just top 10 SNVs. When you move the cursor on each content, you can see more deailed mutation information on the Tooltip. Those are primary_site, primary_histology, mutation(aa), pubmedID. |
| Genomic Position | Mutation(aa) | Unique sampleID count |
| chr5:112328378 | p.G320E | 1 |
| chr5:112337338 | p.A136T,DCP2 | 1 |
| chr5:112343733 | p.Y326H | 1 |
| chr5:112328433 | p.D152Y,DCP2 | 1 |
| chr5:112337364 | p.Q345Q | 1 |
| chr5:112346470 | p.R173C,DCP2 | 1 |
| chr5:112328440 | p.S347S | 1 |
| chr5:112337369 | p.K185N,DCP2 | 1 |
| chr5:112346478 | p.S201C,DCP2 | 1 |
| chr5:112321534 | p.L320L,DCP2 | 1 |
| * Copy number data were extracted from TCGA using R package TCGA-Assembler. The URLs of all public data files on TCGA DCC data server were gathered on Jan-05-2015. Function ProcessCNAData in TCGA-Assembler package was used to obtain gene-level copy number value which is calculated as the average copy number of the genomic region of a gene. |
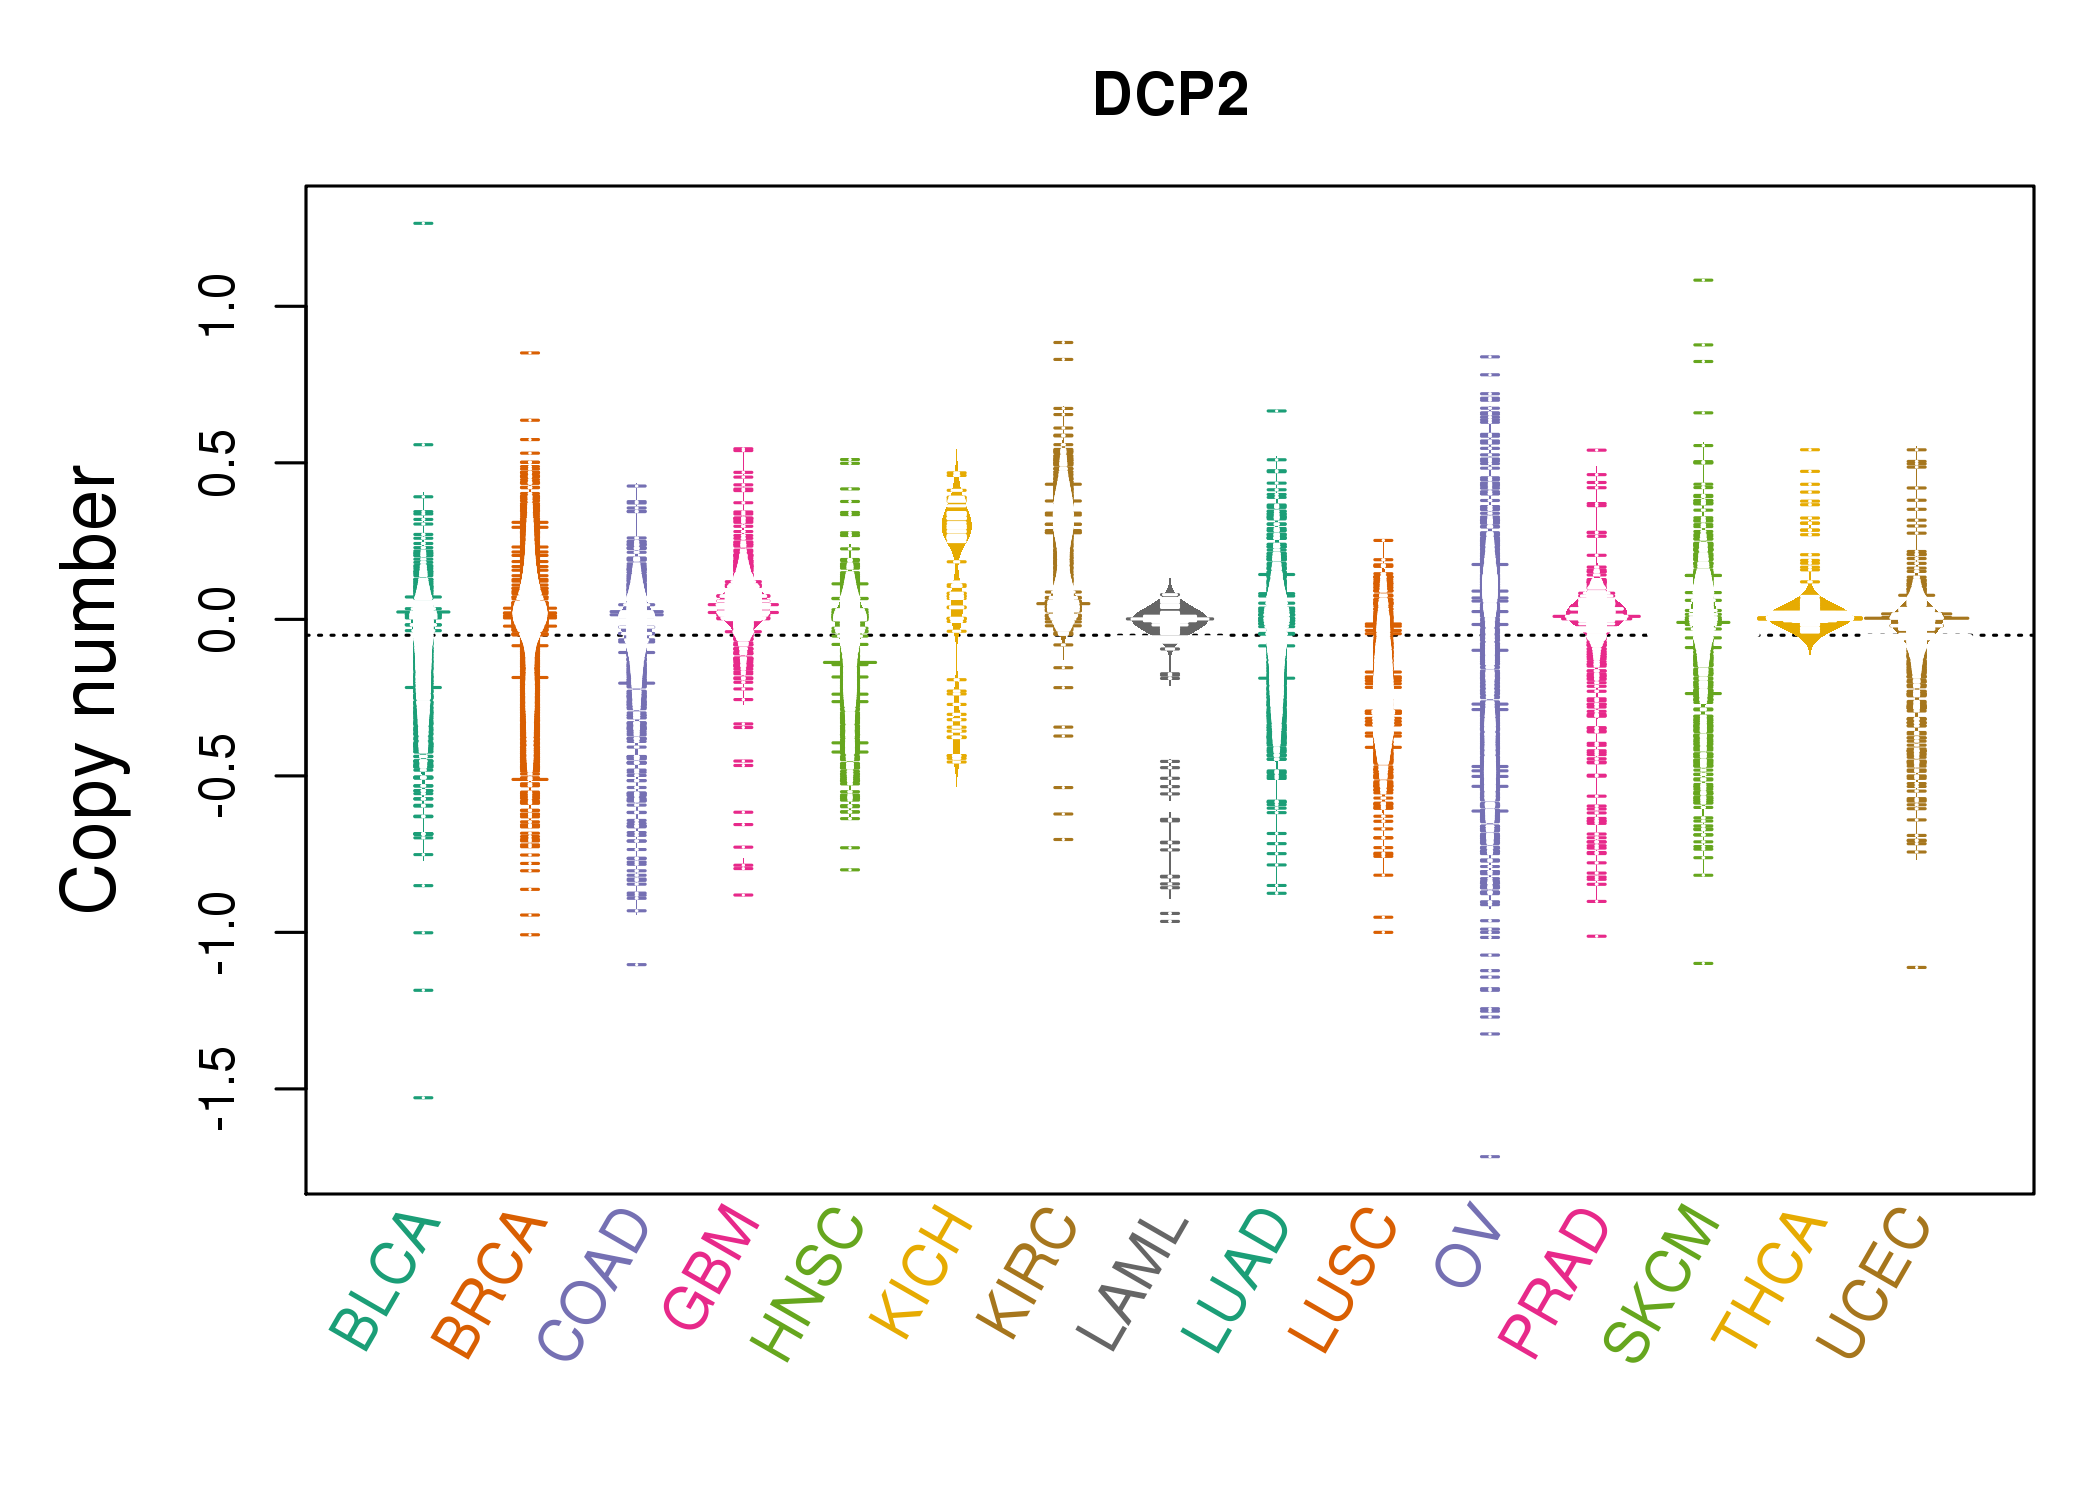 |
| cf) Tissue ID[Tissue type]: BLCA[Bladder Urothelial Carcinoma], BRCA[Breast invasive carcinoma], CESC[Cervical squamous cell carcinoma and endocervical adenocarcinoma], COAD[Colon adenocarcinoma], GBM[Glioblastoma multiforme], Glioma Low Grade, HNSC[Head and Neck squamous cell carcinoma], KICH[Kidney Chromophobe], KIRC[Kidney renal clear cell carcinoma], KIRP[Kidney renal papillary cell carcinoma], LAML[Acute Myeloid Leukemia], LUAD[Lung adenocarcinoma], LUSC[Lung squamous cell carcinoma], OV[Ovarian serous cystadenocarcinoma ], PAAD[Pancreatic adenocarcinoma], PRAD[Prostate adenocarcinoma], SKCM[Skin Cutaneous Melanoma], STAD[Stomach adenocarcinoma], THCA[Thyroid carcinoma], UCEC[Uterine Corpus Endometrial Carcinoma] |
| Top |
| Gene Expression for DCP2 |
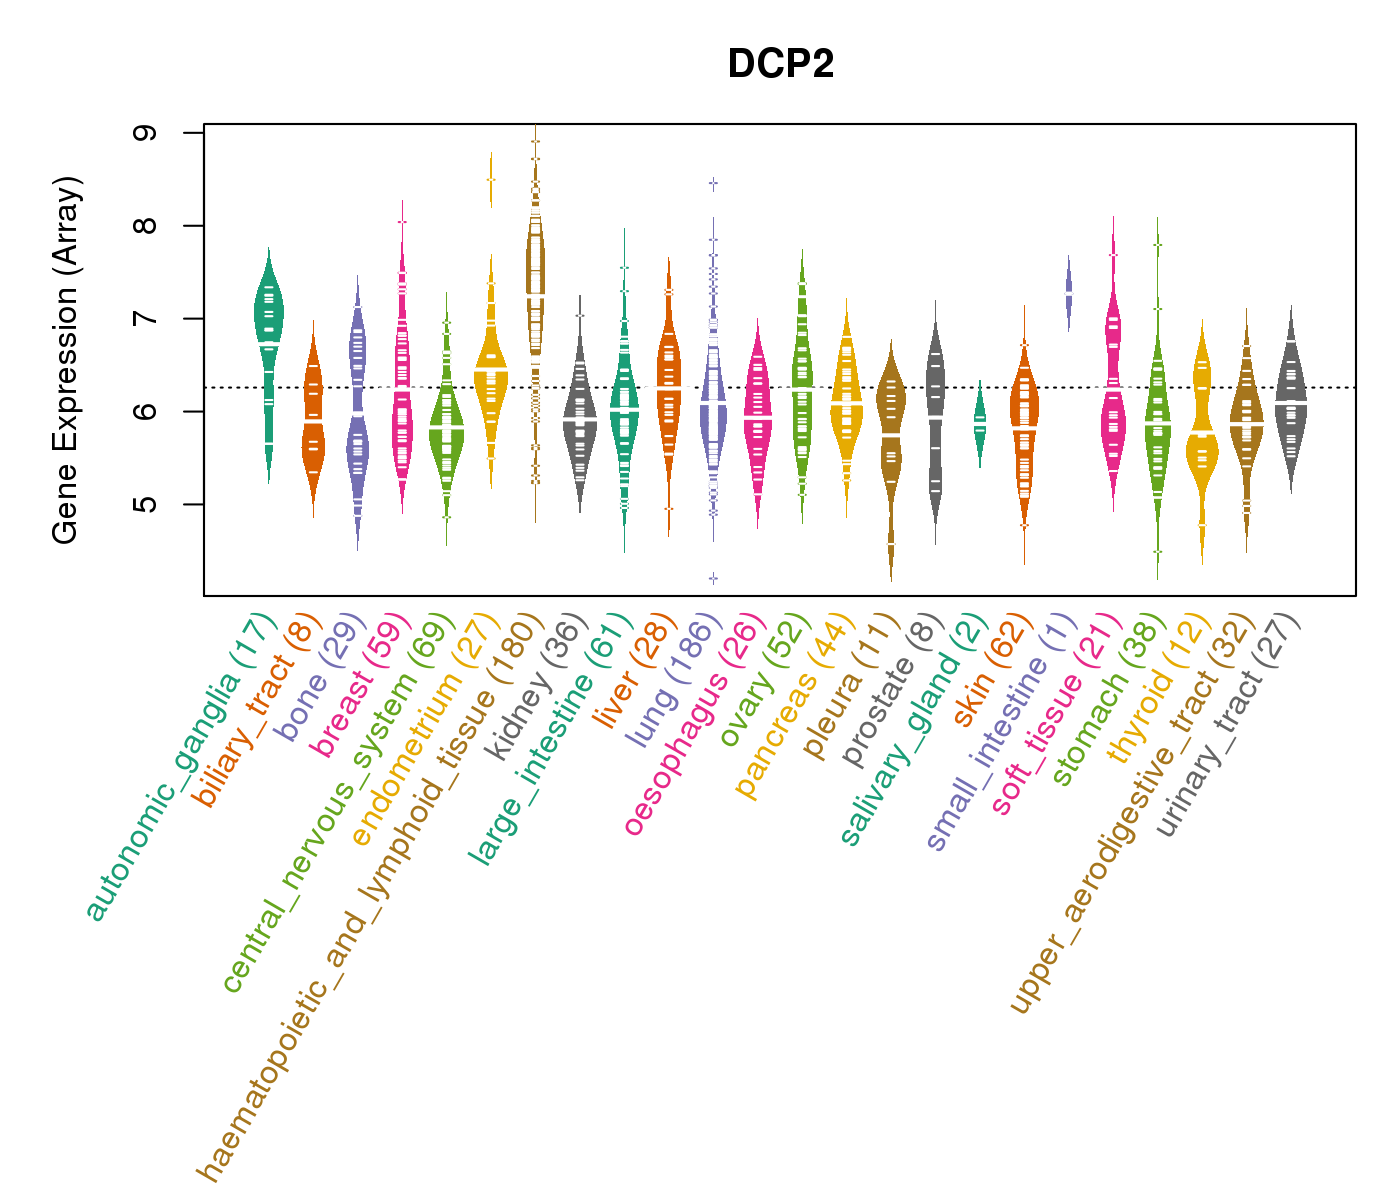
| * CCLE gene expression data were extracted from CCLE_Expression_Entrez_2012-10-18.res: Gene-centric RMA-normalized mRNA expression data. |
 |
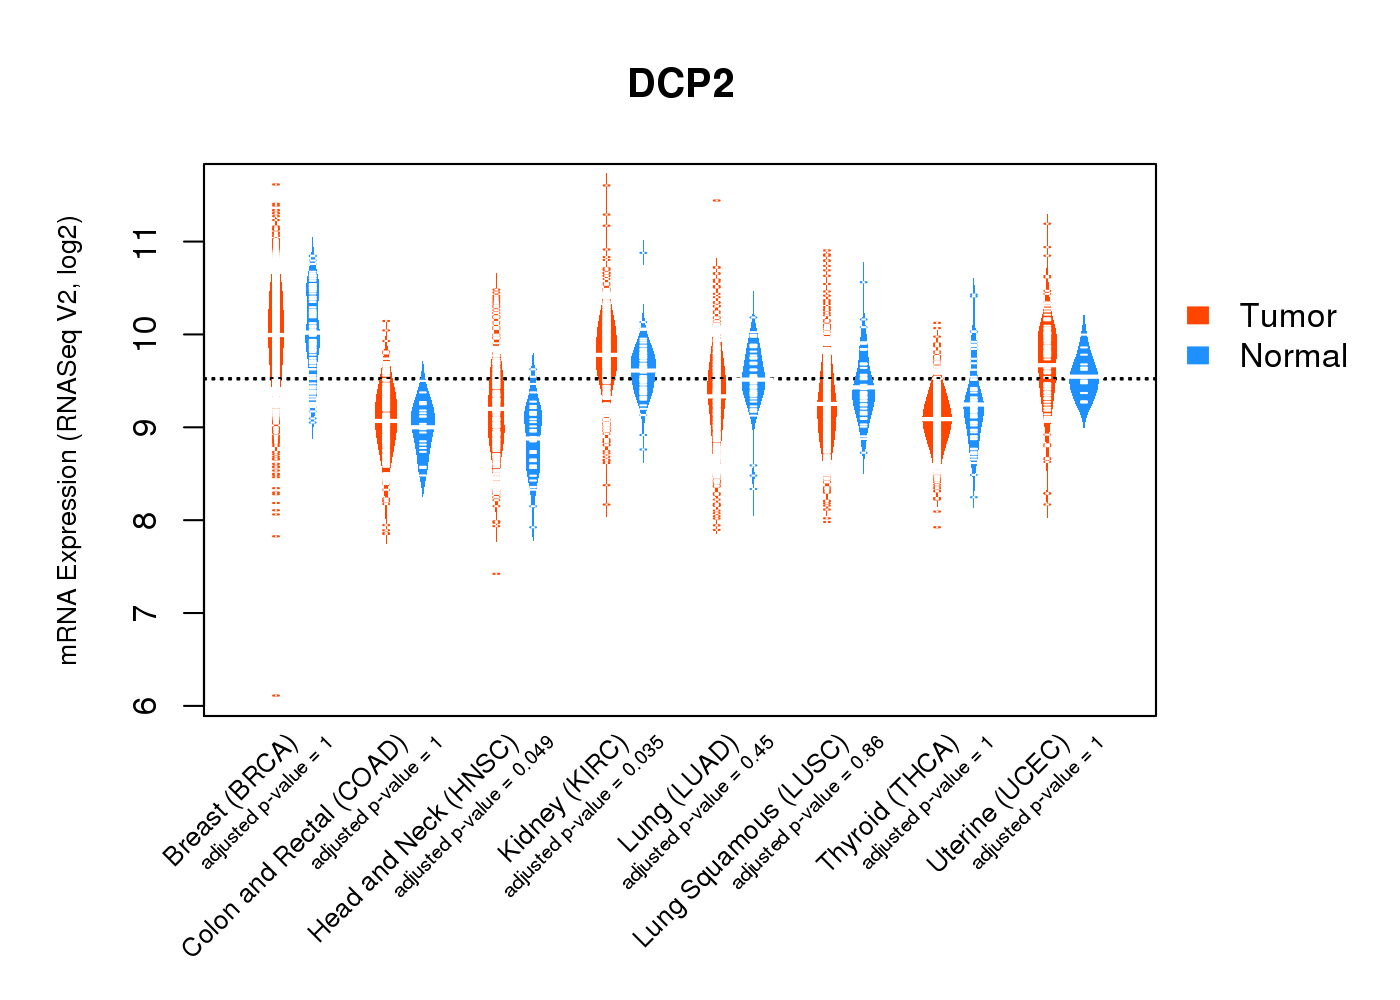
| * Normalized gene expression data of RNASeqV2 was extracted from TCGA using R package TCGA-Assembler. The URLs of all public data files on TCGA DCC data server were gathered at Jan-05-2015. Only eight cancer types have enough normal control samples for differential expression analysis. (t test, adjusted p<0.05 (using Benjamini-Hochberg FDR)) |
 |
| Top |
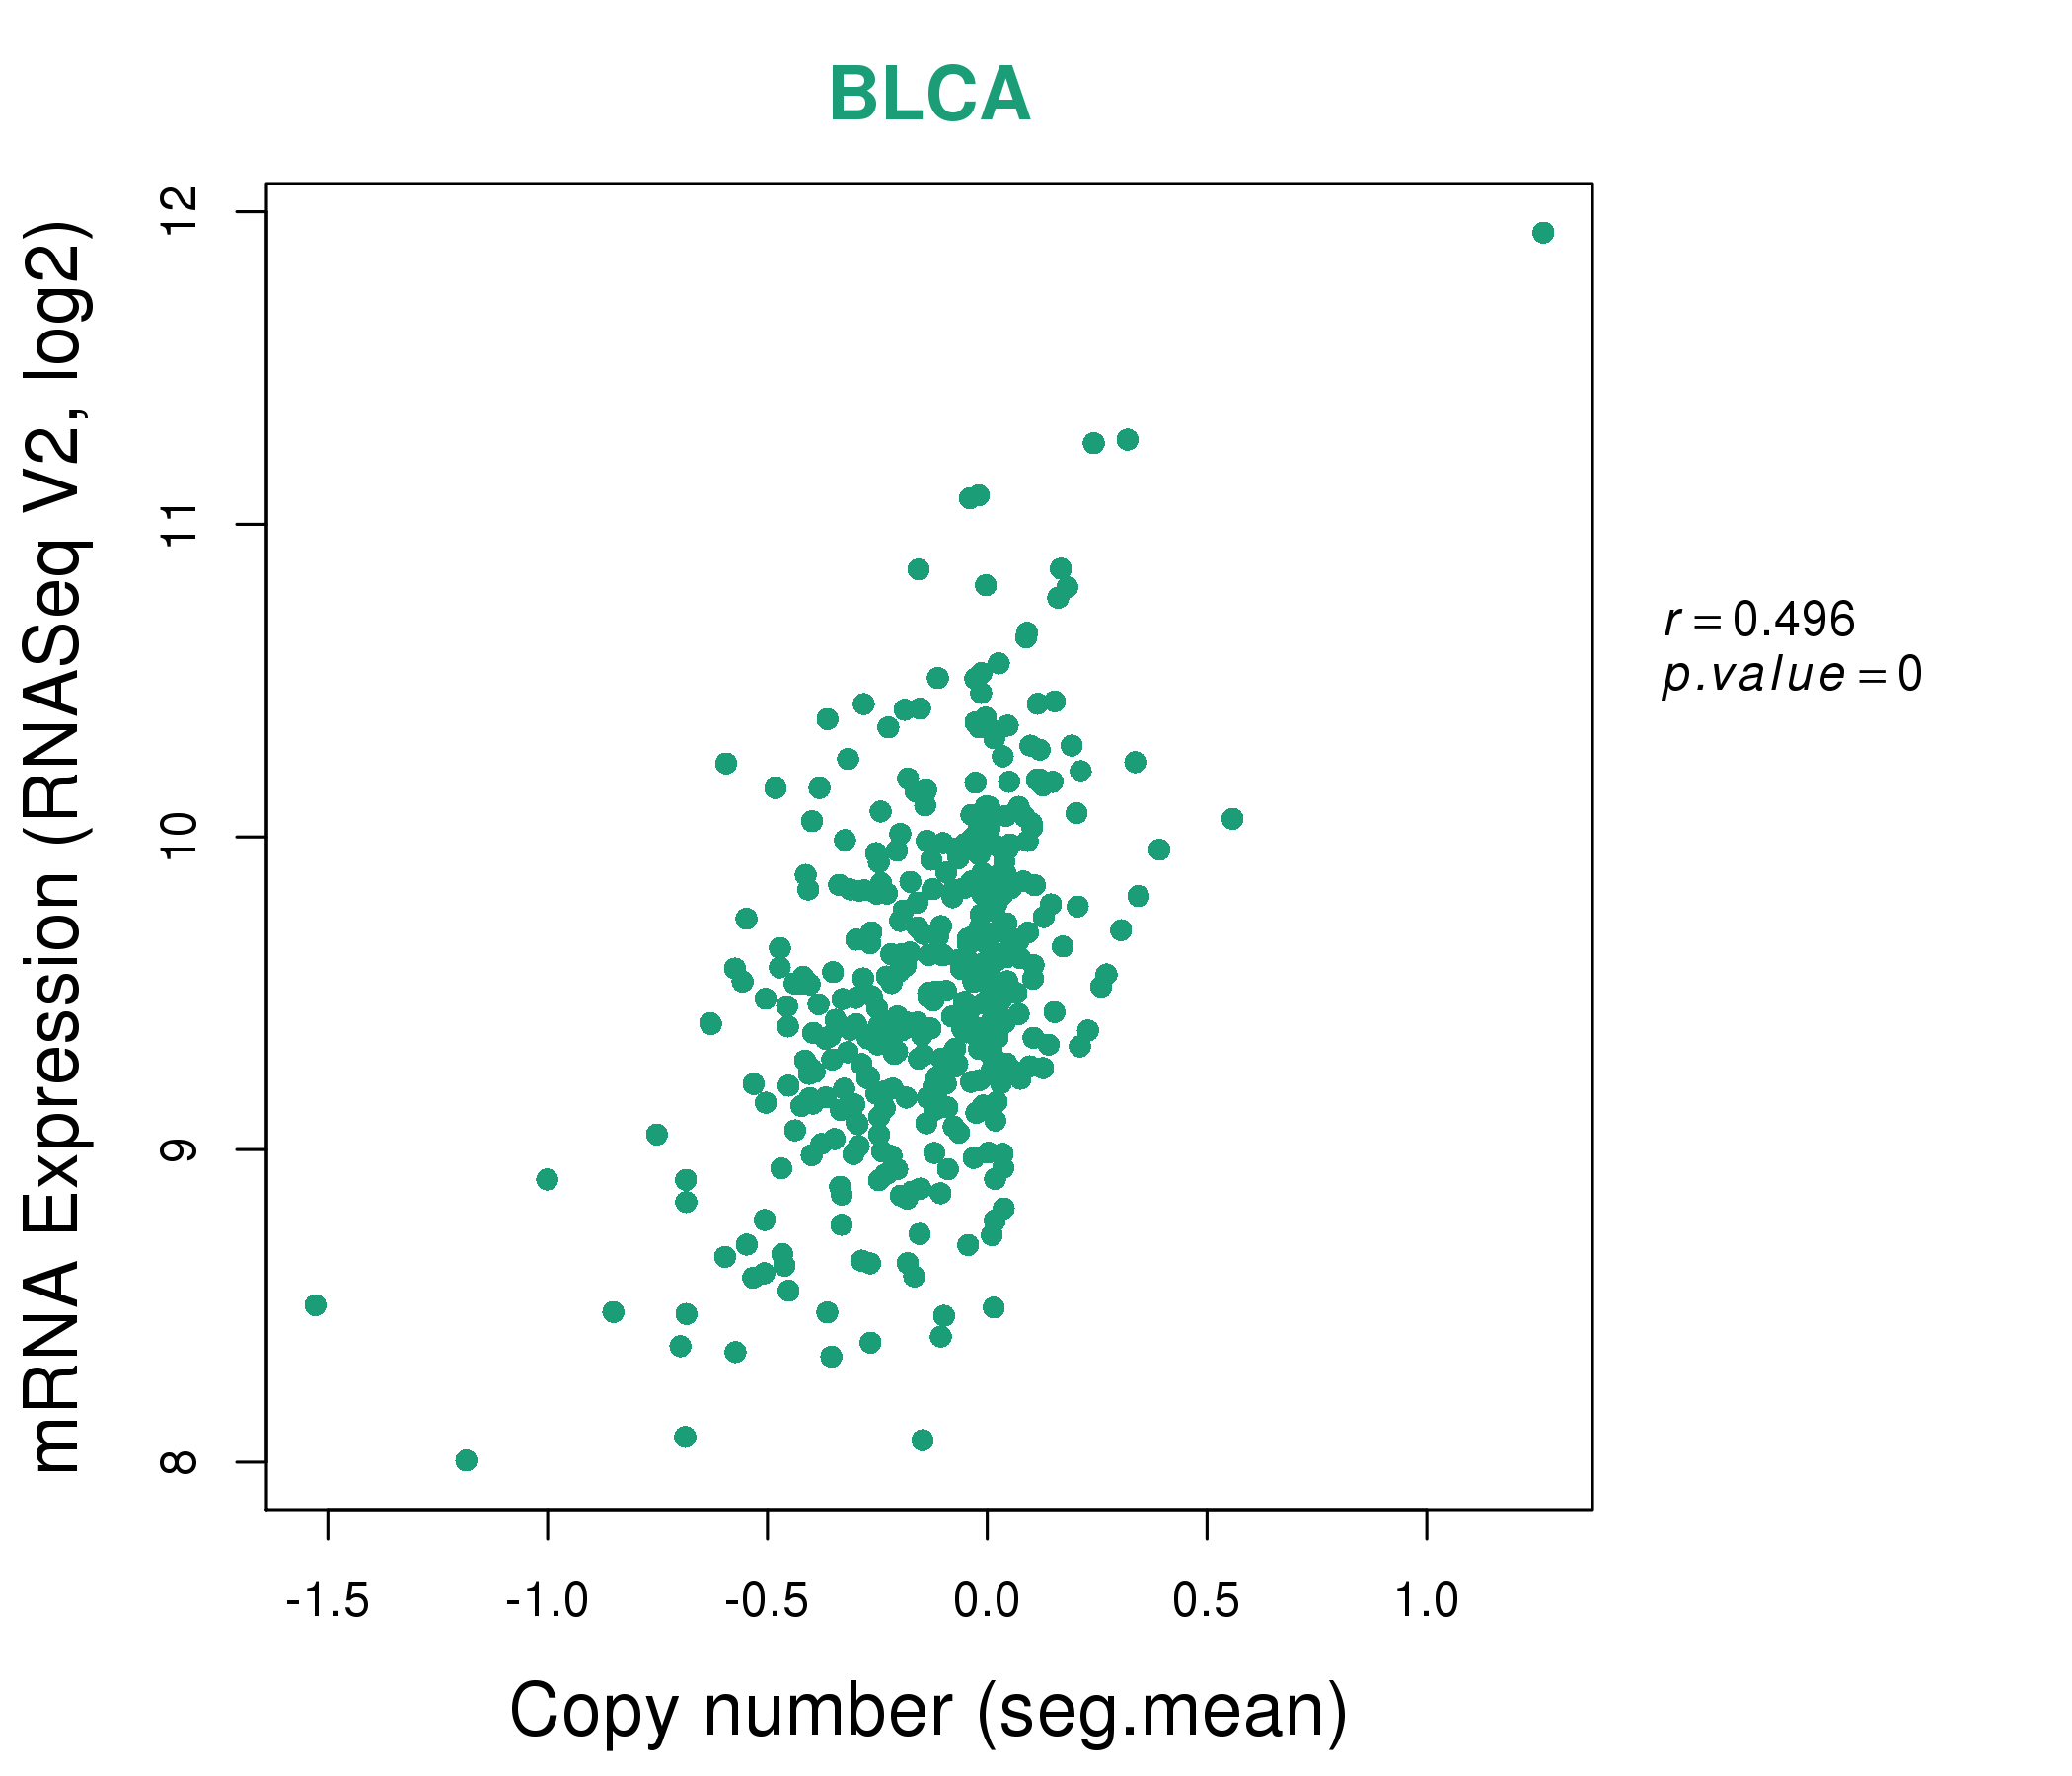
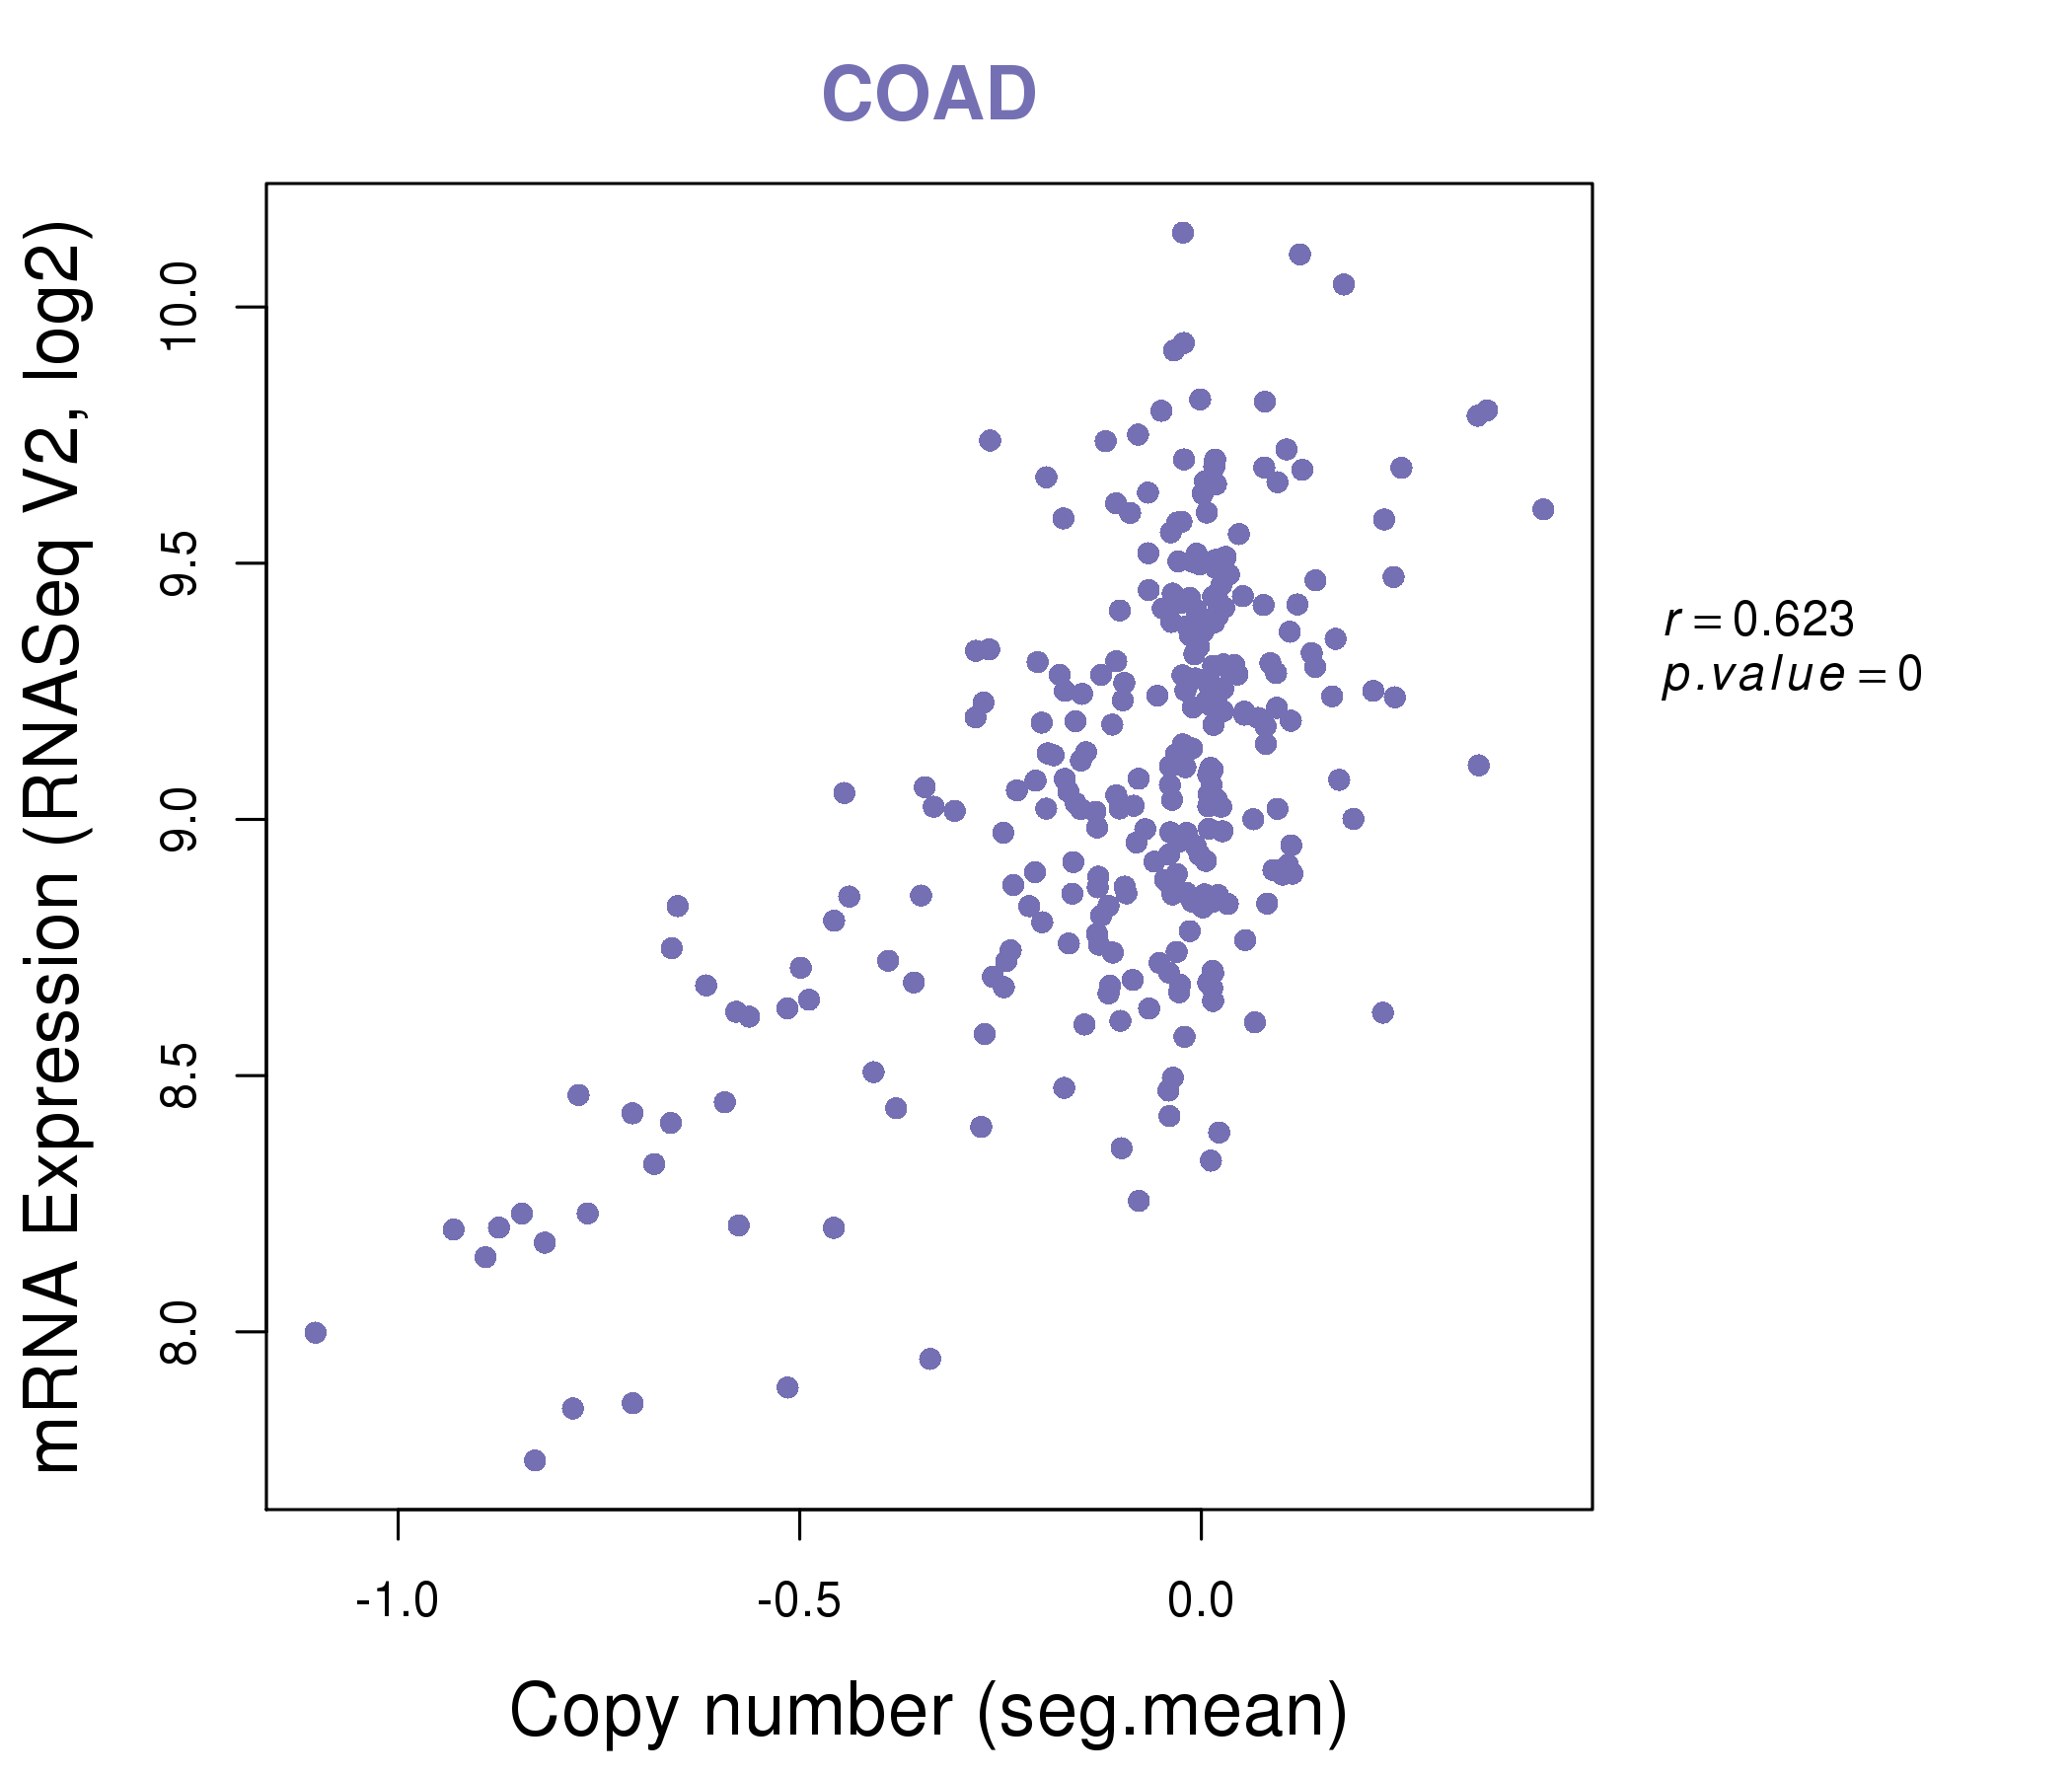
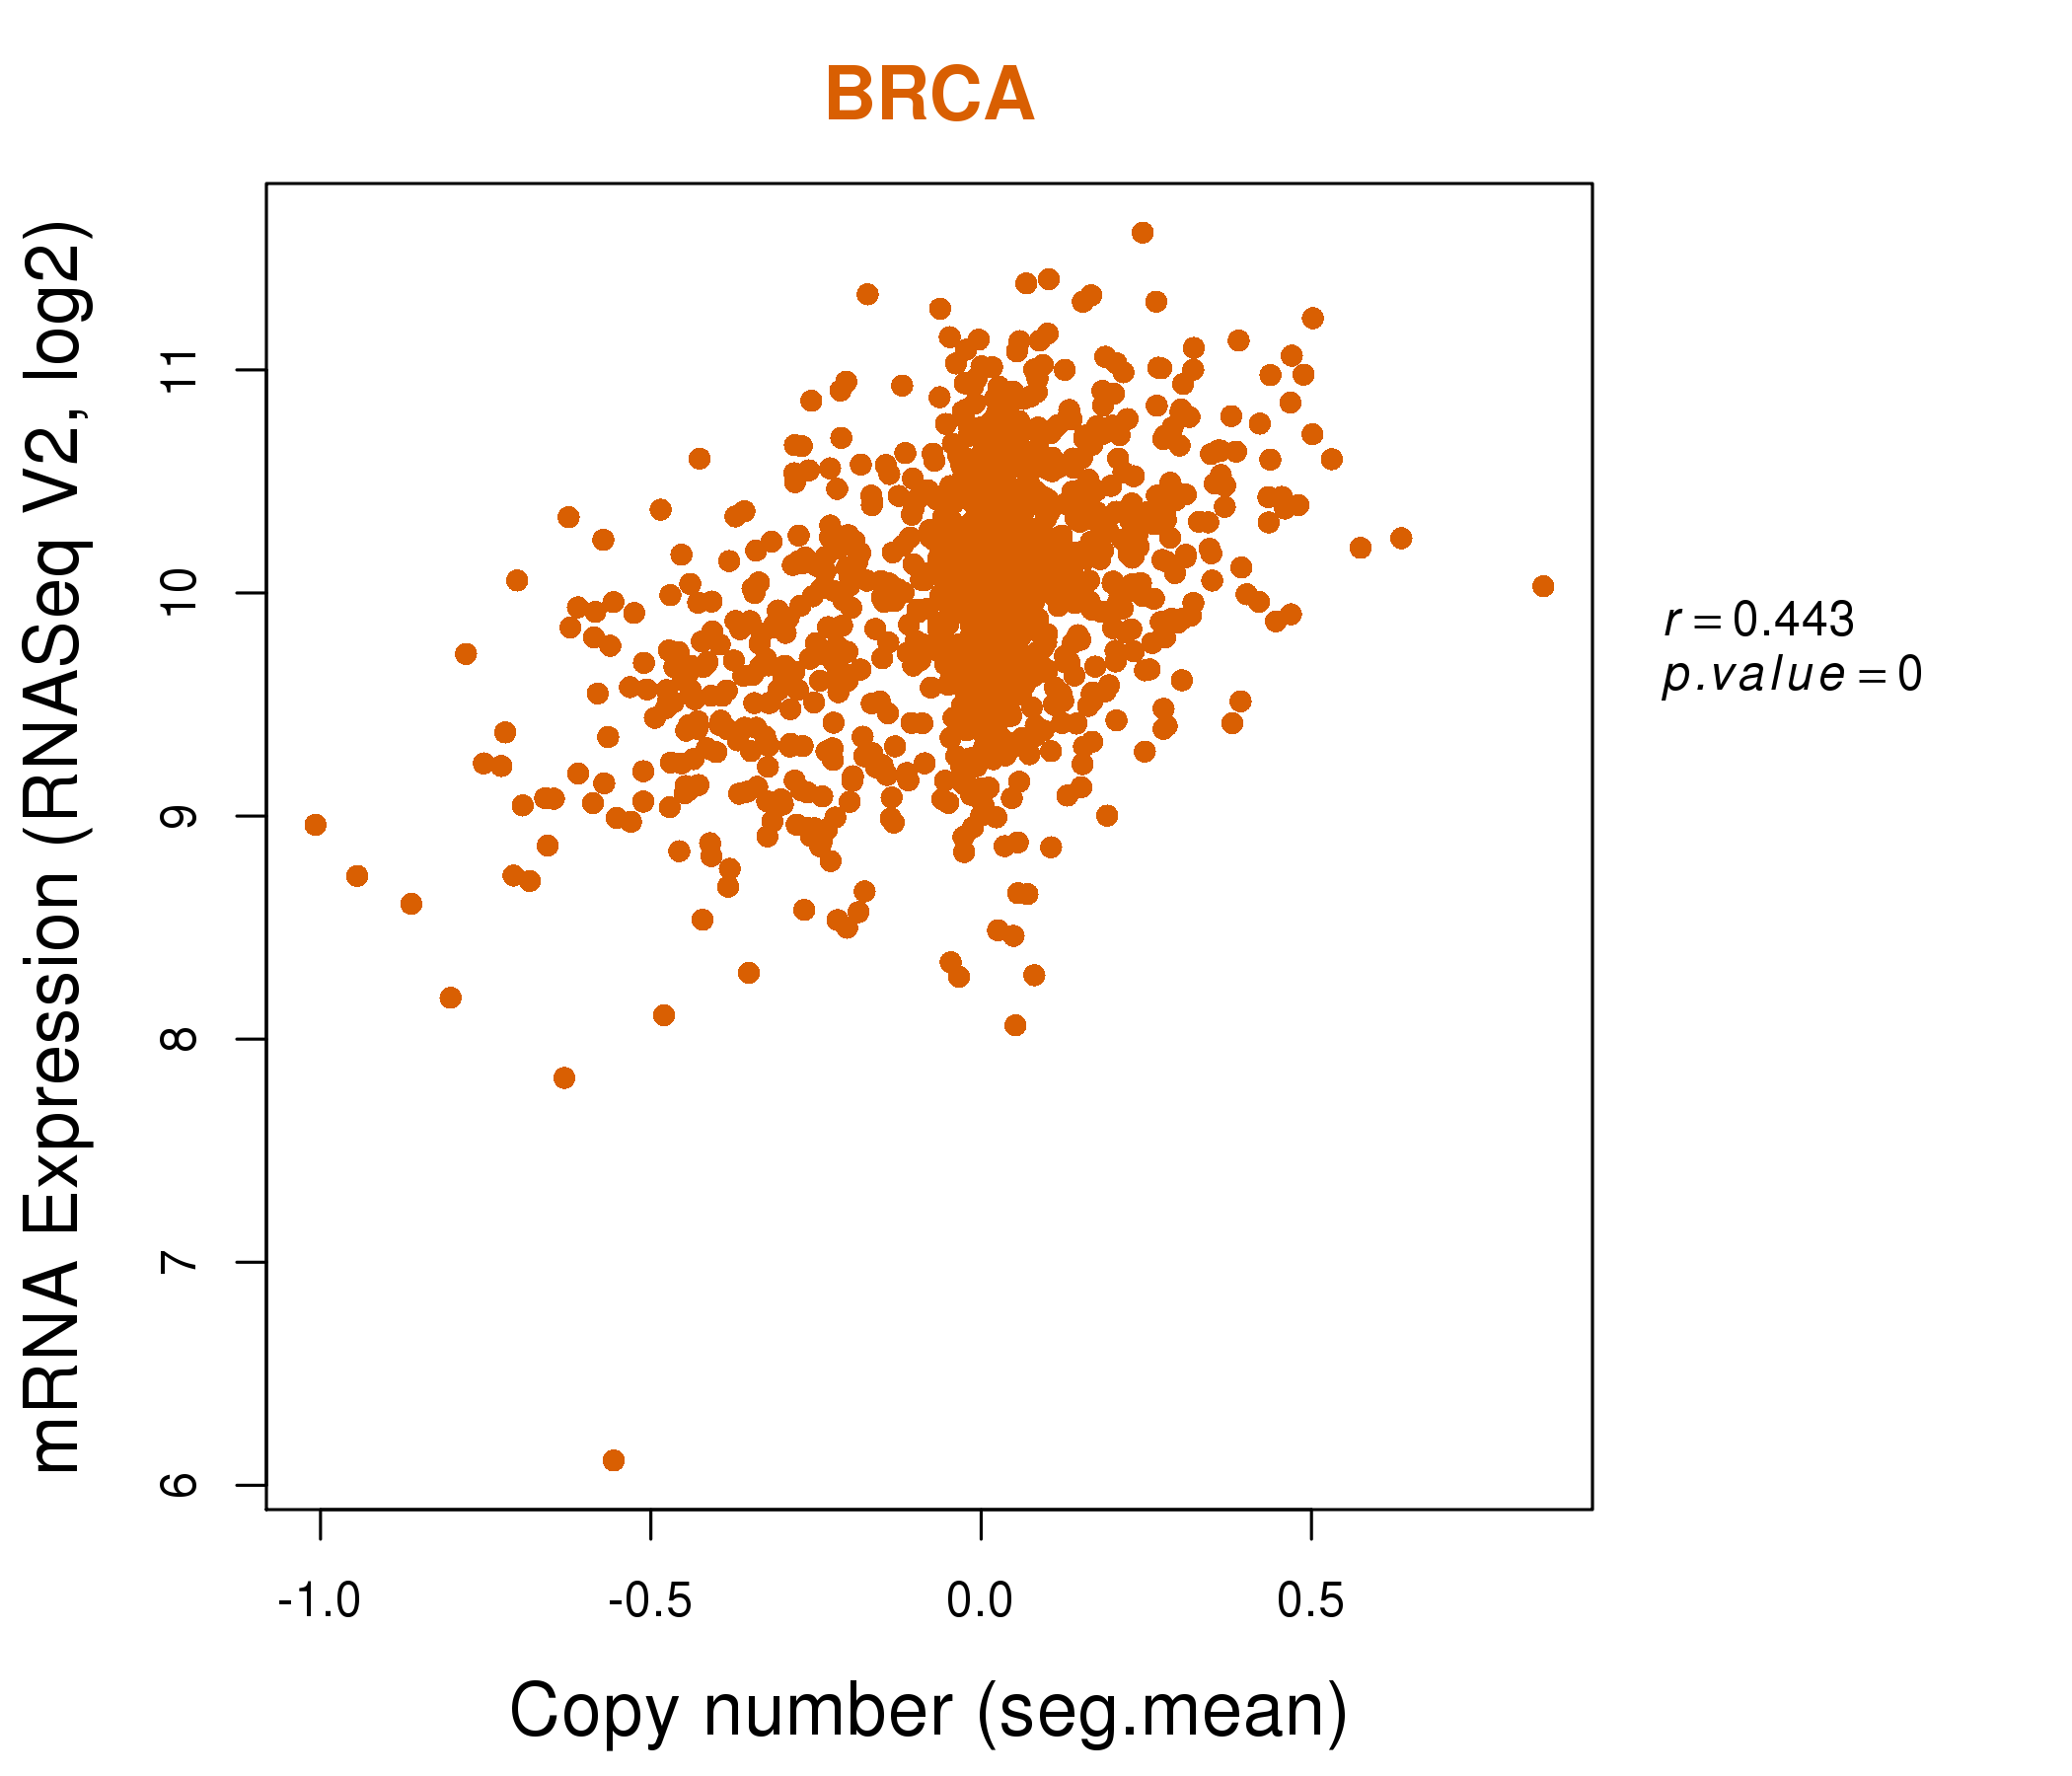
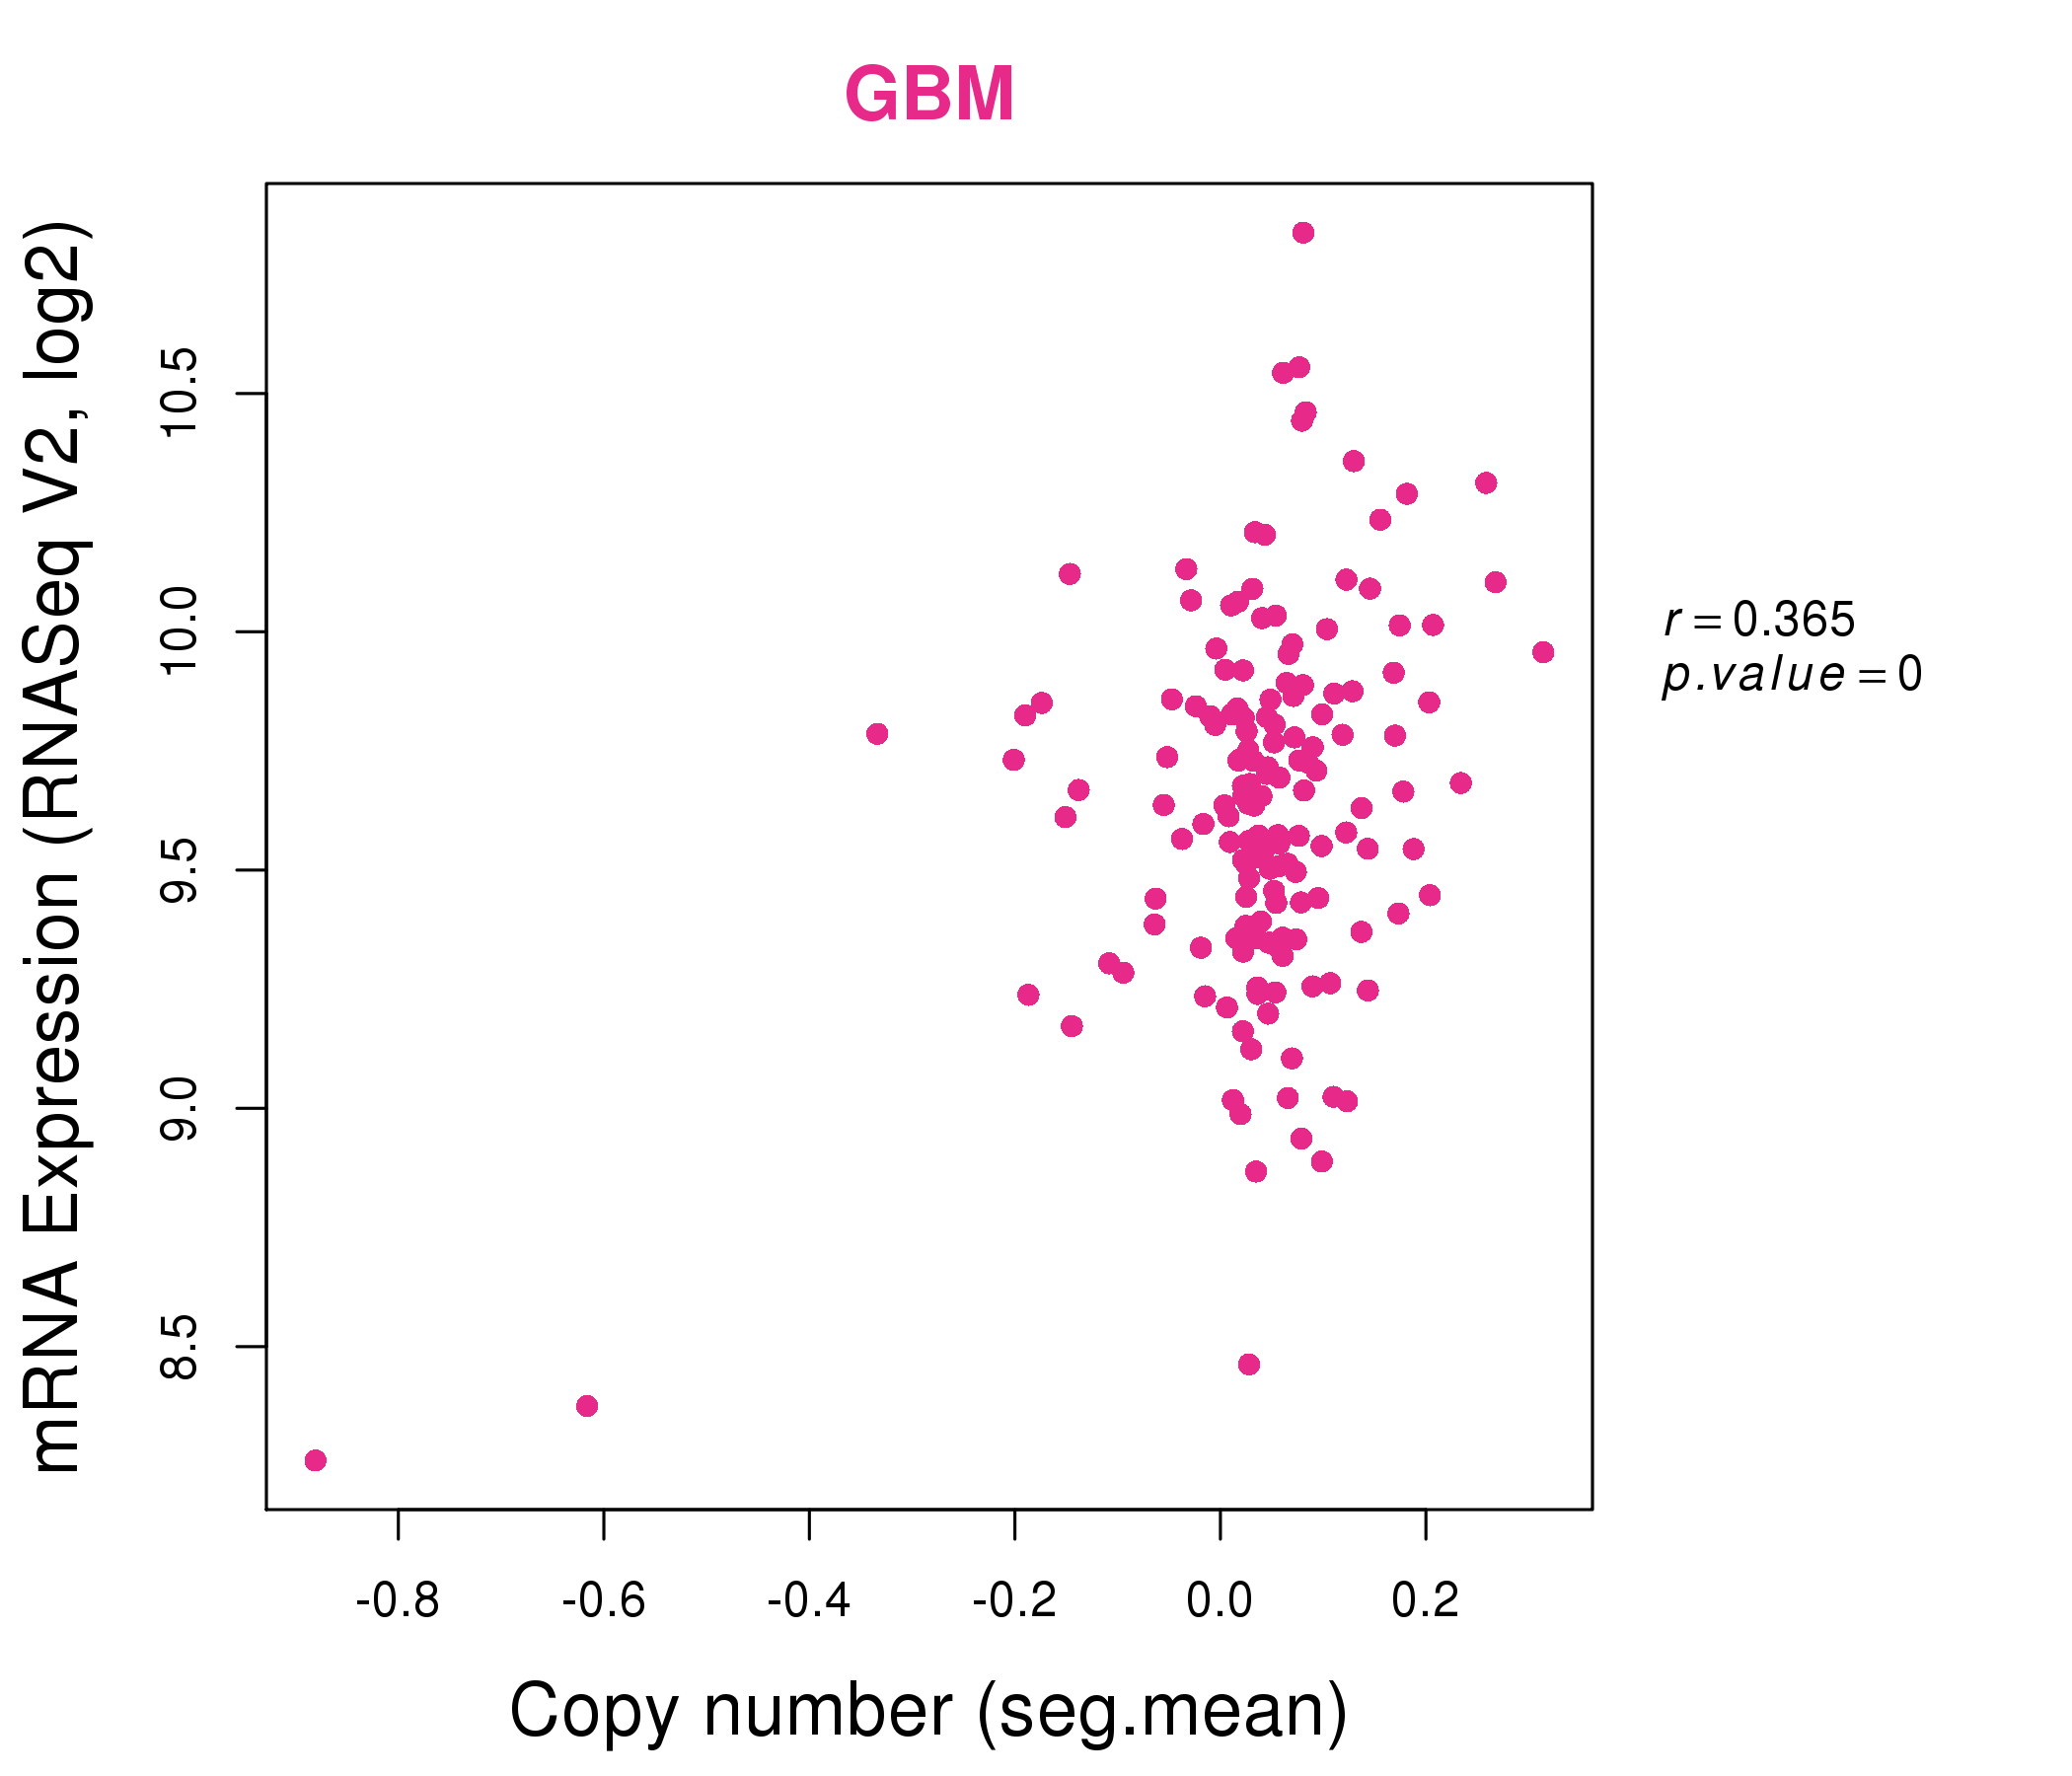
| * This plots show the correlation between CNV and gene expression. |
: Open all plots for all cancer types
 |
|
 |
|
| Top |
| Gene-Gene Network Information |
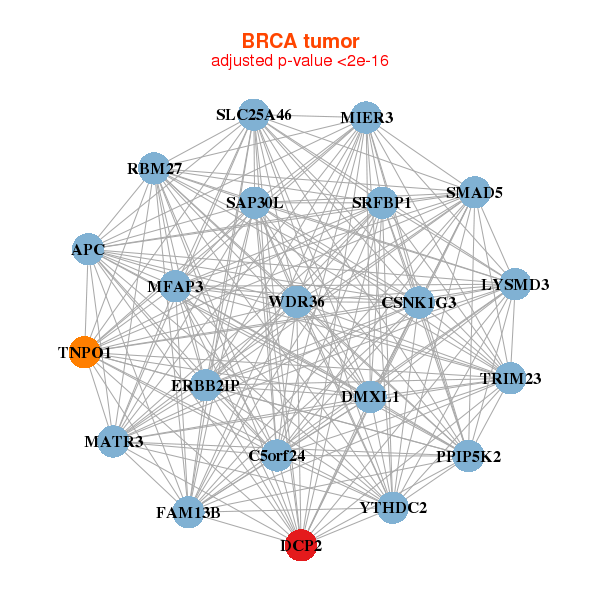
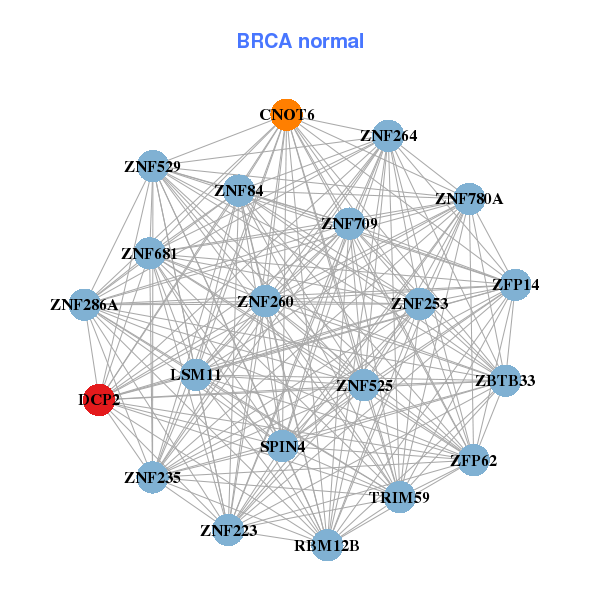
| * Co-Expression network figures were drawn using R package igraph. Only the top 20 genes with the highest correlations were shown. Red circle: input gene, orange circle: cell metabolism gene, sky circle: other gene |
: Open all plots for all cancer types
 |
|
| APC,C5orf24,CSNK1G3,DCP2,DMXL1,ERBB2IP,FAM13B, LYSMD3,MATR3,MFAP3,MIER3,PPIP5K2,RBM27,SAP30L, SLC25A46,SMAD5,SRFBP1,TNPO1,TRIM23,WDR36,YTHDC2 | CNOT6,DCP2,LSM11,RBM12B,SPIN4,TRIM59,ZBTB33, ZFP14,ZFP62,ZNF223,ZNF235,ZNF253,ZNF260,ZNF264, ZNF286A,ZNF525,ZNF529,ZNF681,ZNF709,ZNF780A,ZNF84 |
 |
|
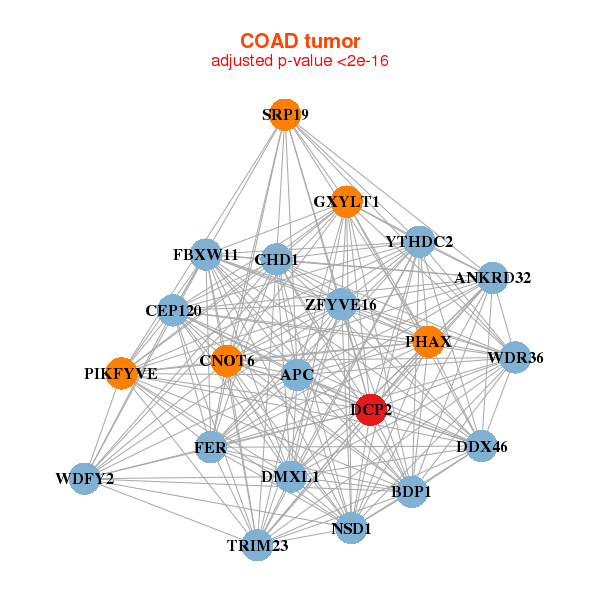
| ANKRD32,APC,BDP1,CEP120,CHD1,CNOT6,DCP2, DDX46,DMXL1,FBXW11,FER,GXYLT1,NSD1,PHAX, PIKFYVE,SRP19,TRIM23,WDFY2,WDR36,YTHDC2,ZFYVE16 | AIM1,CSNK1G1,CSNK2A1,DCP2,DNMT3B,FAM117B,HARS2, KDM4A,NAPEPLD,NLK,OSBP,PANK2,SPG11,SPTLC2, STK4,STRBP,TAF5,VCPIP1,WDFY1,ZNF217,ZNF490 |
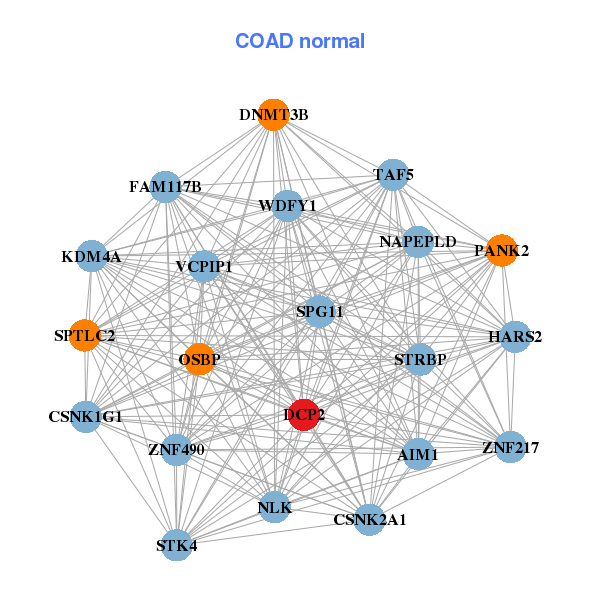
| * Co-Expression network figures were drawn using R package igraph. Only the top 20 genes with the highest correlations were shown. Red circle: input gene, orange circle: cell metabolism gene, sky circle: other gene |
: Open all plots for all cancer types
| Top |
: Open all interacting genes' information including KEGG pathway for all interacting genes from DAVID
| Top |
| Pharmacological Information for DCP2 |
| There's no related Drug. |
| Top |
| Cross referenced IDs for DCP2 |
| * We obtained these cross-references from Uniprot database. It covers 150 different DBs, 18 categories. http://www.uniprot.org/help/cross_references_section |
: Open all cross reference information
|
Copyright © 2016-Present - The Univsersity of Texas Health Science Center at Houston @ |