|
||||||||||||||||||||||||||||||||||||||||||||||||||||||||||||||||||||||||||||||||||||||||||||||||||||||||||||||||||||||||||||||||||||||||||||||||||||||||||||||||||||||||||||||||||||||||||||||||||||||||||||||||||||||||||||||||||||||||||||||||||||||||||||||||||||||||||||||||||||||||||||||||||||||||||||||||||||||||||
| |
| Phenotypic Information (metabolism pathway, cancer, disease, phenome) |
| |
| |
| Gene-Gene Network Information: Co-Expression Network, Interacting Genes & KEGG |
| |
|


| Gene Summary for GALNTL5 |
| Basic gene info. | Gene symbol | GALNTL5 |
| Gene name | polypeptide N-acetylgalactosaminyltransferase-like 5 | |
| Synonyms | GALNACT19|GALNT15|GalNAc-T5L | |
| Cytomap | UCSC genome browser: 7q36.1 | |
| Genomic location | chr7 :151653463-151717019 | |
| Type of gene | protein-coding | |
| RefGenes | NM_145292.3, NR_033169.1, | |
| Ensembl id | ENSG00000106648 | |
| Description | UDP-GalNAc:polypeptide N-acetylgalactosaminyltransferase 15UDP-N-acetyl-alpha-D-galactosamine:polypeptide N-acetylgalactosaminyltransferase-like 5galNAc-T15inactive polypeptide N-acetylgalactosaminyltransferase-like protein 5polypeptide GalNAc transfe | |
| Modification date | 20141207 | |
| dbXrefs | MIM : 615133 | |
| HGNC : HGNC | ||
| Ensembl : ENSG00000106648 | ||
| HPRD : 13565 | ||
| Vega : OTTHUMG00000157306 | ||
| Protein | UniProt: go to UniProt's Cross Reference DB Table | |
| Expression | CleanEX: HS_GALNTL5 | |
| BioGPS: 168391 | ||
| Gene Expression Atlas: ENSG00000106648 | ||
| The Human Protein Atlas: ENSG00000106648 | ||
| Pathway | NCI Pathway Interaction Database: GALNTL5 | |
| KEGG: GALNTL5 | ||
| REACTOME: GALNTL5 | ||
| ConsensusPathDB | ||
| Pathway Commons: GALNTL5 | ||
| Metabolism | MetaCyc: GALNTL5 | |
| HUMANCyc: GALNTL5 | ||
| Regulation | Ensembl's Regulation: ENSG00000106648 | |
| miRBase: chr7 :151,653,463-151,717,019 | ||
| TargetScan: NM_145292 | ||
| cisRED: ENSG00000106648 | ||
| Context | iHOP: GALNTL5 | |
| cancer metabolism search in PubMed: GALNTL5 | ||
| UCL Cancer Institute: GALNTL5 | ||
| Assigned class in ccmGDB | C | |
| Top |
| Phenotypic Information for GALNTL5(metabolism pathway, cancer, disease, phenome) |
| Cancer | CGAP: GALNTL5 |
| Familial Cancer Database: GALNTL5 | |
| * This gene is included in those cancer gene databases. |
|
|
|
|
|
| . | ||||||||||||||||||||||||||||||||||||||||||||||||||||||||||||||||||||||||||||||||||||||||||||||||||||||||||||||||||||||||||||||||||||||||||||||||||||||||||||||||||||||||||||||||||||||||||||||||||||||||||||||||||||||||||||||||||||||||||||||||||||||||||||||||||||||||||||||||||||||||||||||||||||||||||||||||||||
Oncogene 1 | Significant driver gene in | |||||||||||||||||||||||||||||||||||||||||||||||||||||||||||||||||||||||||||||||||||||||||||||||||||||||||||||||||||||||||||||||||||||||||||||||||||||||||||||||||||||||||||||||||||||||||||||||||||||||||||||||||||||||||||||||||||||||||||||||||||||||||||||||||||||||||||||||||||||||||||||||||||||||||||||||||||||||||
| cf) number; DB name 1 Oncogene; http://nar.oxfordjournals.org/content/35/suppl_1/D721.long, 2 Tumor Suppressor gene; https://bioinfo.uth.edu/TSGene/, 3 Cancer Gene Census; http://www.nature.com/nrc/journal/v4/n3/abs/nrc1299.html, 4 CancerGenes; http://nar.oxfordjournals.org/content/35/suppl_1/D721.long, 5 Network of Cancer Gene; http://ncg.kcl.ac.uk/index.php, 1Therapeutic Vulnerabilities in Cancer; http://cbio.mskcc.org/cancergenomics/statius/ |
| REACTOME_METABOLISM_OF_PROTEINS | |
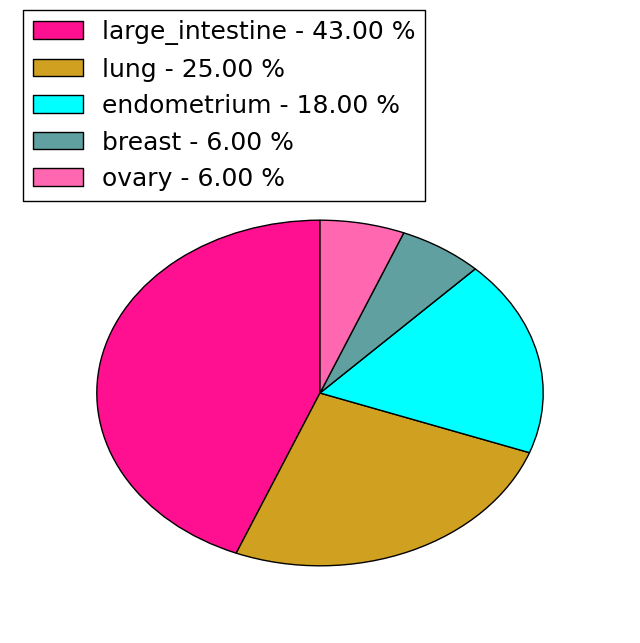
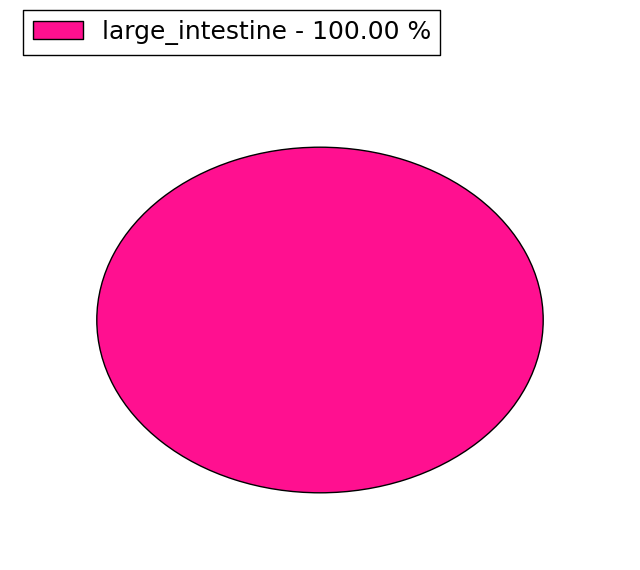
| Mutations for GALNTL5 |
| * Under tables are showing count per each tissue to give us broad intuition about tissue specific mutation patterns.You can go to the detailed page for each mutation database's web site. |
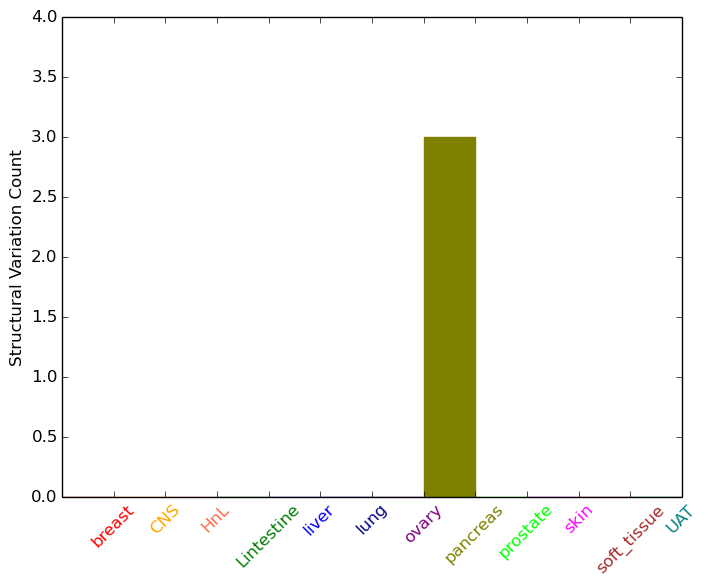
| - Statistics for Tissue and Mutation type | Top |
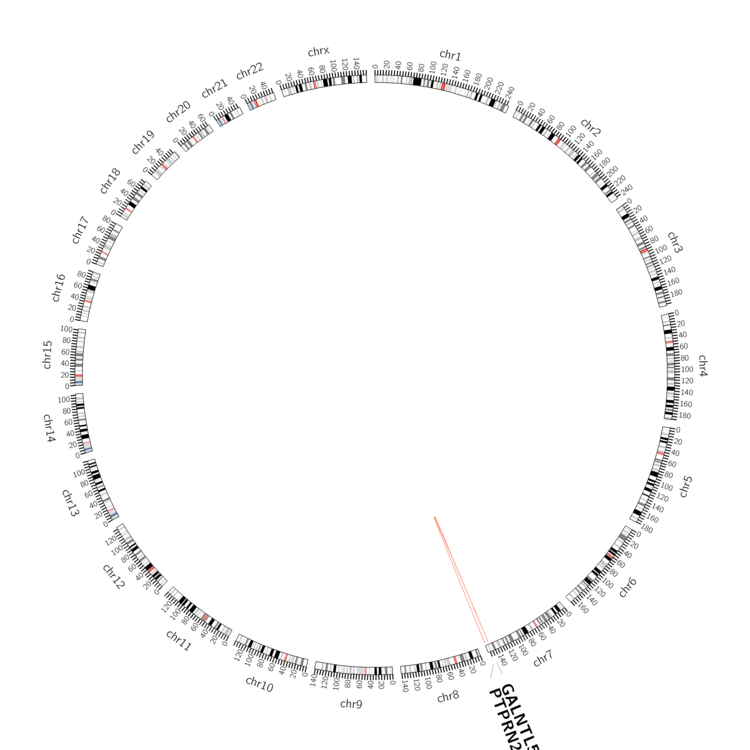 |
| - For Inter-chromosomal Variations |
| There's no inter-chromosomal structural variation. |
| - For Intra-chromosomal Variations |
| * Intra-chromosomal variantions includes 'intrachromosomal amplicon to amplicon', 'intrachromosomal amplicon to non-amplified dna', 'intrachromosomal deletion', 'intrachromosomal fold-back inversion', 'intrachromosomal inversion', 'intrachromosomal tandem duplication', 'Intrachromosomal unknown type', 'intrachromosomal with inverted orientation', 'intrachromosomal with non-inverted orientation'. |
 |
| Sample | Symbol_a | Chr_a | Start_a | End_a | Symbol_b | Chr_b | Start_b | End_b |
| pancreas | GALNTL5 | chr7 | 151671188 | 151671208 | GALNTL5 | chr7 | 151671365 | 151671385 |
| pancreas | GALNTL5 | chr7 | 151671192 | 151671212 | GALNTL5 | chr7 | 151671365 | 151671385 |
| pancreas | GALNTL5 | chr7 | 151700869 | 151700889 | PTPRN2 | chr7 | 158241548 | 158241568 |
| cf) Tissue number; Tissue name (1;Breast, 2;Central_nervous_system, 3;Haematopoietic_and_lymphoid_tissue, 4;Large_intestine, 5;Liver, 6;Lung, 7;Ovary, 8;Pancreas, 9;Prostate, 10;Skin, 11;Soft_tissue, 12;Upper_aerodigestive_tract) |
| * From mRNA Sanger sequences, Chitars2.0 arranged chimeric transcripts. This table shows GALNTL5 related fusion information. |
| ID | Head Gene | Tail Gene | Accession | Gene_a | qStart_a | qEnd_a | Chromosome_a | tStart_a | tEnd_a | Gene_a | qStart_a | qEnd_a | Chromosome_a | tStart_a | tEnd_a |
| Top |
| Mutation type/ Tissue ID | brca | cns | cerv | endome | haematopo | kidn | Lintest | liver | lung | ns | ovary | pancre | prost | skin | stoma | thyro | urina | |||
| Total # sample | 1 | 1 | 1 | |||||||||||||||||
| GAIN (# sample) | 1 | |||||||||||||||||||
| LOSS (# sample) | 1 | 1 |
| cf) Tissue ID; Tissue type (1; Breast, 2; Central_nervous_system, 3; Cervix, 4; Endometrium, 5; Haematopoietic_and_lymphoid_tissue, 6; Kidney, 7; Large_intestine, 8; Liver, 9; Lung, 10; NS, 11; Ovary, 12; Pancreas, 13; Prostate, 14; Skin, 15; Stomach, 16; Thyroid, 17; Urinary_tract) |
| Top |
|
 |
| Top |
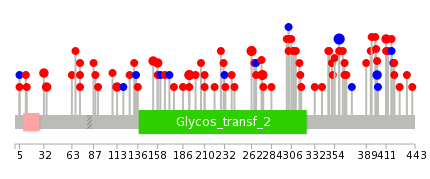
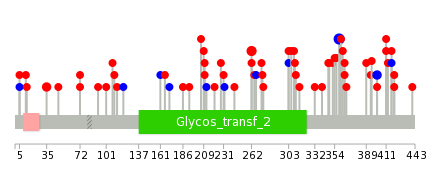
| Stat. for Non-Synonymous SNVs (# total SNVs=68) | (# total SNVs=16) |
 |  |
(# total SNVs=2) | (# total SNVs=0) |
 |
| Top |
| * When you move the cursor on each content, you can see more deailed mutation information on the Tooltip. Those are primary_site,primary_histology,mutation(aa),pubmedID. |
| GRCh37 position | Mutation(aa) | Unique sampleID count |
| chr7:151711779-151711779 | p.G359G | 5 |
| chr7:151716746-151716746 | p.R398* | 3 |
| chr7:151699925-151699925 | p.R262I | 3 |
| chr7:151699961-151699961 | p.G274E | 3 |
| chr7:151684285-151684285 | p.R193W | 3 |
| chr7:151716805-151716805 | p.R417S | 2 |
| chr7:151680175-151680175 | p.T158M | 2 |
| chr7:151664426-151664426 | p.V32A | 2 |
| chr7:151664434-151664434 | p.W35R | 2 |
| chr7:151668119-151668119 | p.E113K | 2 |
| Top |
|
 |
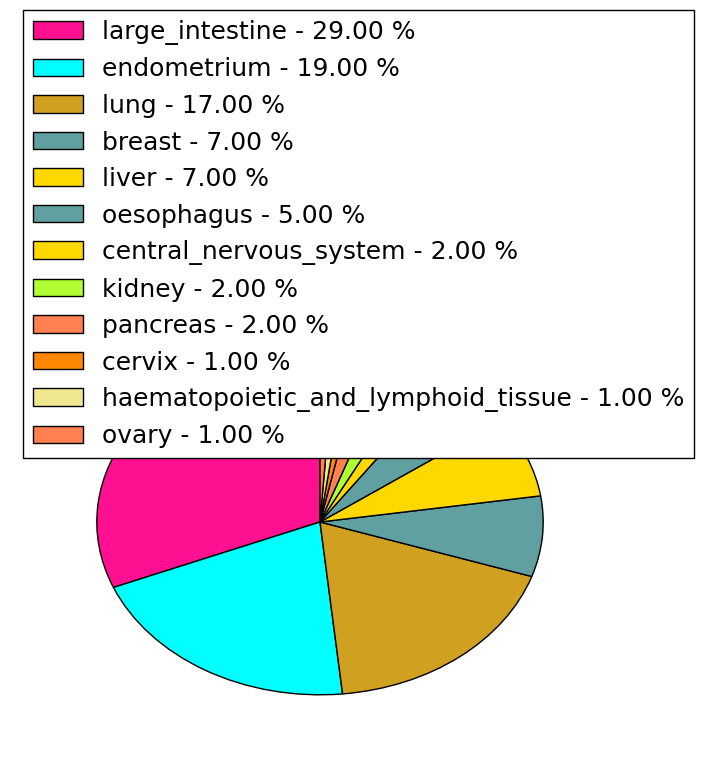
| Point Mutation/ Tissue ID | 1 | 2 | 3 | 4 | 5 | 6 | 7 | 8 | 9 | 10 | 11 | 12 | 13 | 14 | 15 | 16 | 17 | 18 | 19 | 20 |
| # sample | 1 | 2 | 1 | 19 | 5 | 2 | 8 | 4 | 2 | 1 | 9 | 4 | 9 | |||||||
| # mutation | 1 | 2 | 1 | 13 | 5 | 2 | 8 | 4 | 2 | 2 | 13 | 4 | 12 | |||||||
| nonsynonymous SNV | 1 | 2 | 1 | 10 | 4 | 2 | 7 | 3 | 1 | 2 | 11 | 4 | 9 | |||||||
| synonymous SNV | 3 | 1 | 1 | 1 | 1 | 2 | 3 |
| cf) Tissue ID; Tissue type (1; BLCA[Bladder Urothelial Carcinoma], 2; BRCA[Breast invasive carcinoma], 3; CESC[Cervical squamous cell carcinoma and endocervical adenocarcinoma], 4; COAD[Colon adenocarcinoma], 5; GBM[Glioblastoma multiforme], 6; Glioma Low Grade, 7; HNSC[Head and Neck squamous cell carcinoma], 8; KICH[Kidney Chromophobe], 9; KIRC[Kidney renal clear cell carcinoma], 10; KIRP[Kidney renal papillary cell carcinoma], 11; LAML[Acute Myeloid Leukemia], 12; LUAD[Lung adenocarcinoma], 13; LUSC[Lung squamous cell carcinoma], 14; OV[Ovarian serous cystadenocarcinoma ], 15; PAAD[Pancreatic adenocarcinoma], 16; PRAD[Prostate adenocarcinoma], 17; SKCM[Skin Cutaneous Melanoma], 18:STAD[Stomach adenocarcinoma], 19:THCA[Thyroid carcinoma], 20:UCEC[Uterine Corpus Endometrial Carcinoma]) |
| Top |
| * We represented just top 10 SNVs. When you move the cursor on each content, you can see more deailed mutation information on the Tooltip. Those are primary_site, primary_histology, mutation(aa), pubmedID. |
| Genomic Position | Mutation(aa) | Unique sampleID count |
| chr7:151711779 | p.G359G | 5 |
| chr7:151699925 | p.R262I | 4 |
| chr7:151664434 | p.W35R | 2 |
| chr7:151716757 | p.G401G | 2 |
| chr7:151716805 | p.R417S | 2 |
| chr7:151664346 | p.I5M | 2 |
| chr7:151664369 | p.K363E | 1 |
| chr7:151700048 | p.S13Y | 1 |
| chr7:151680185 | p.G206R | 1 |
| chr7:151711757 | p.R303Q | 1 |
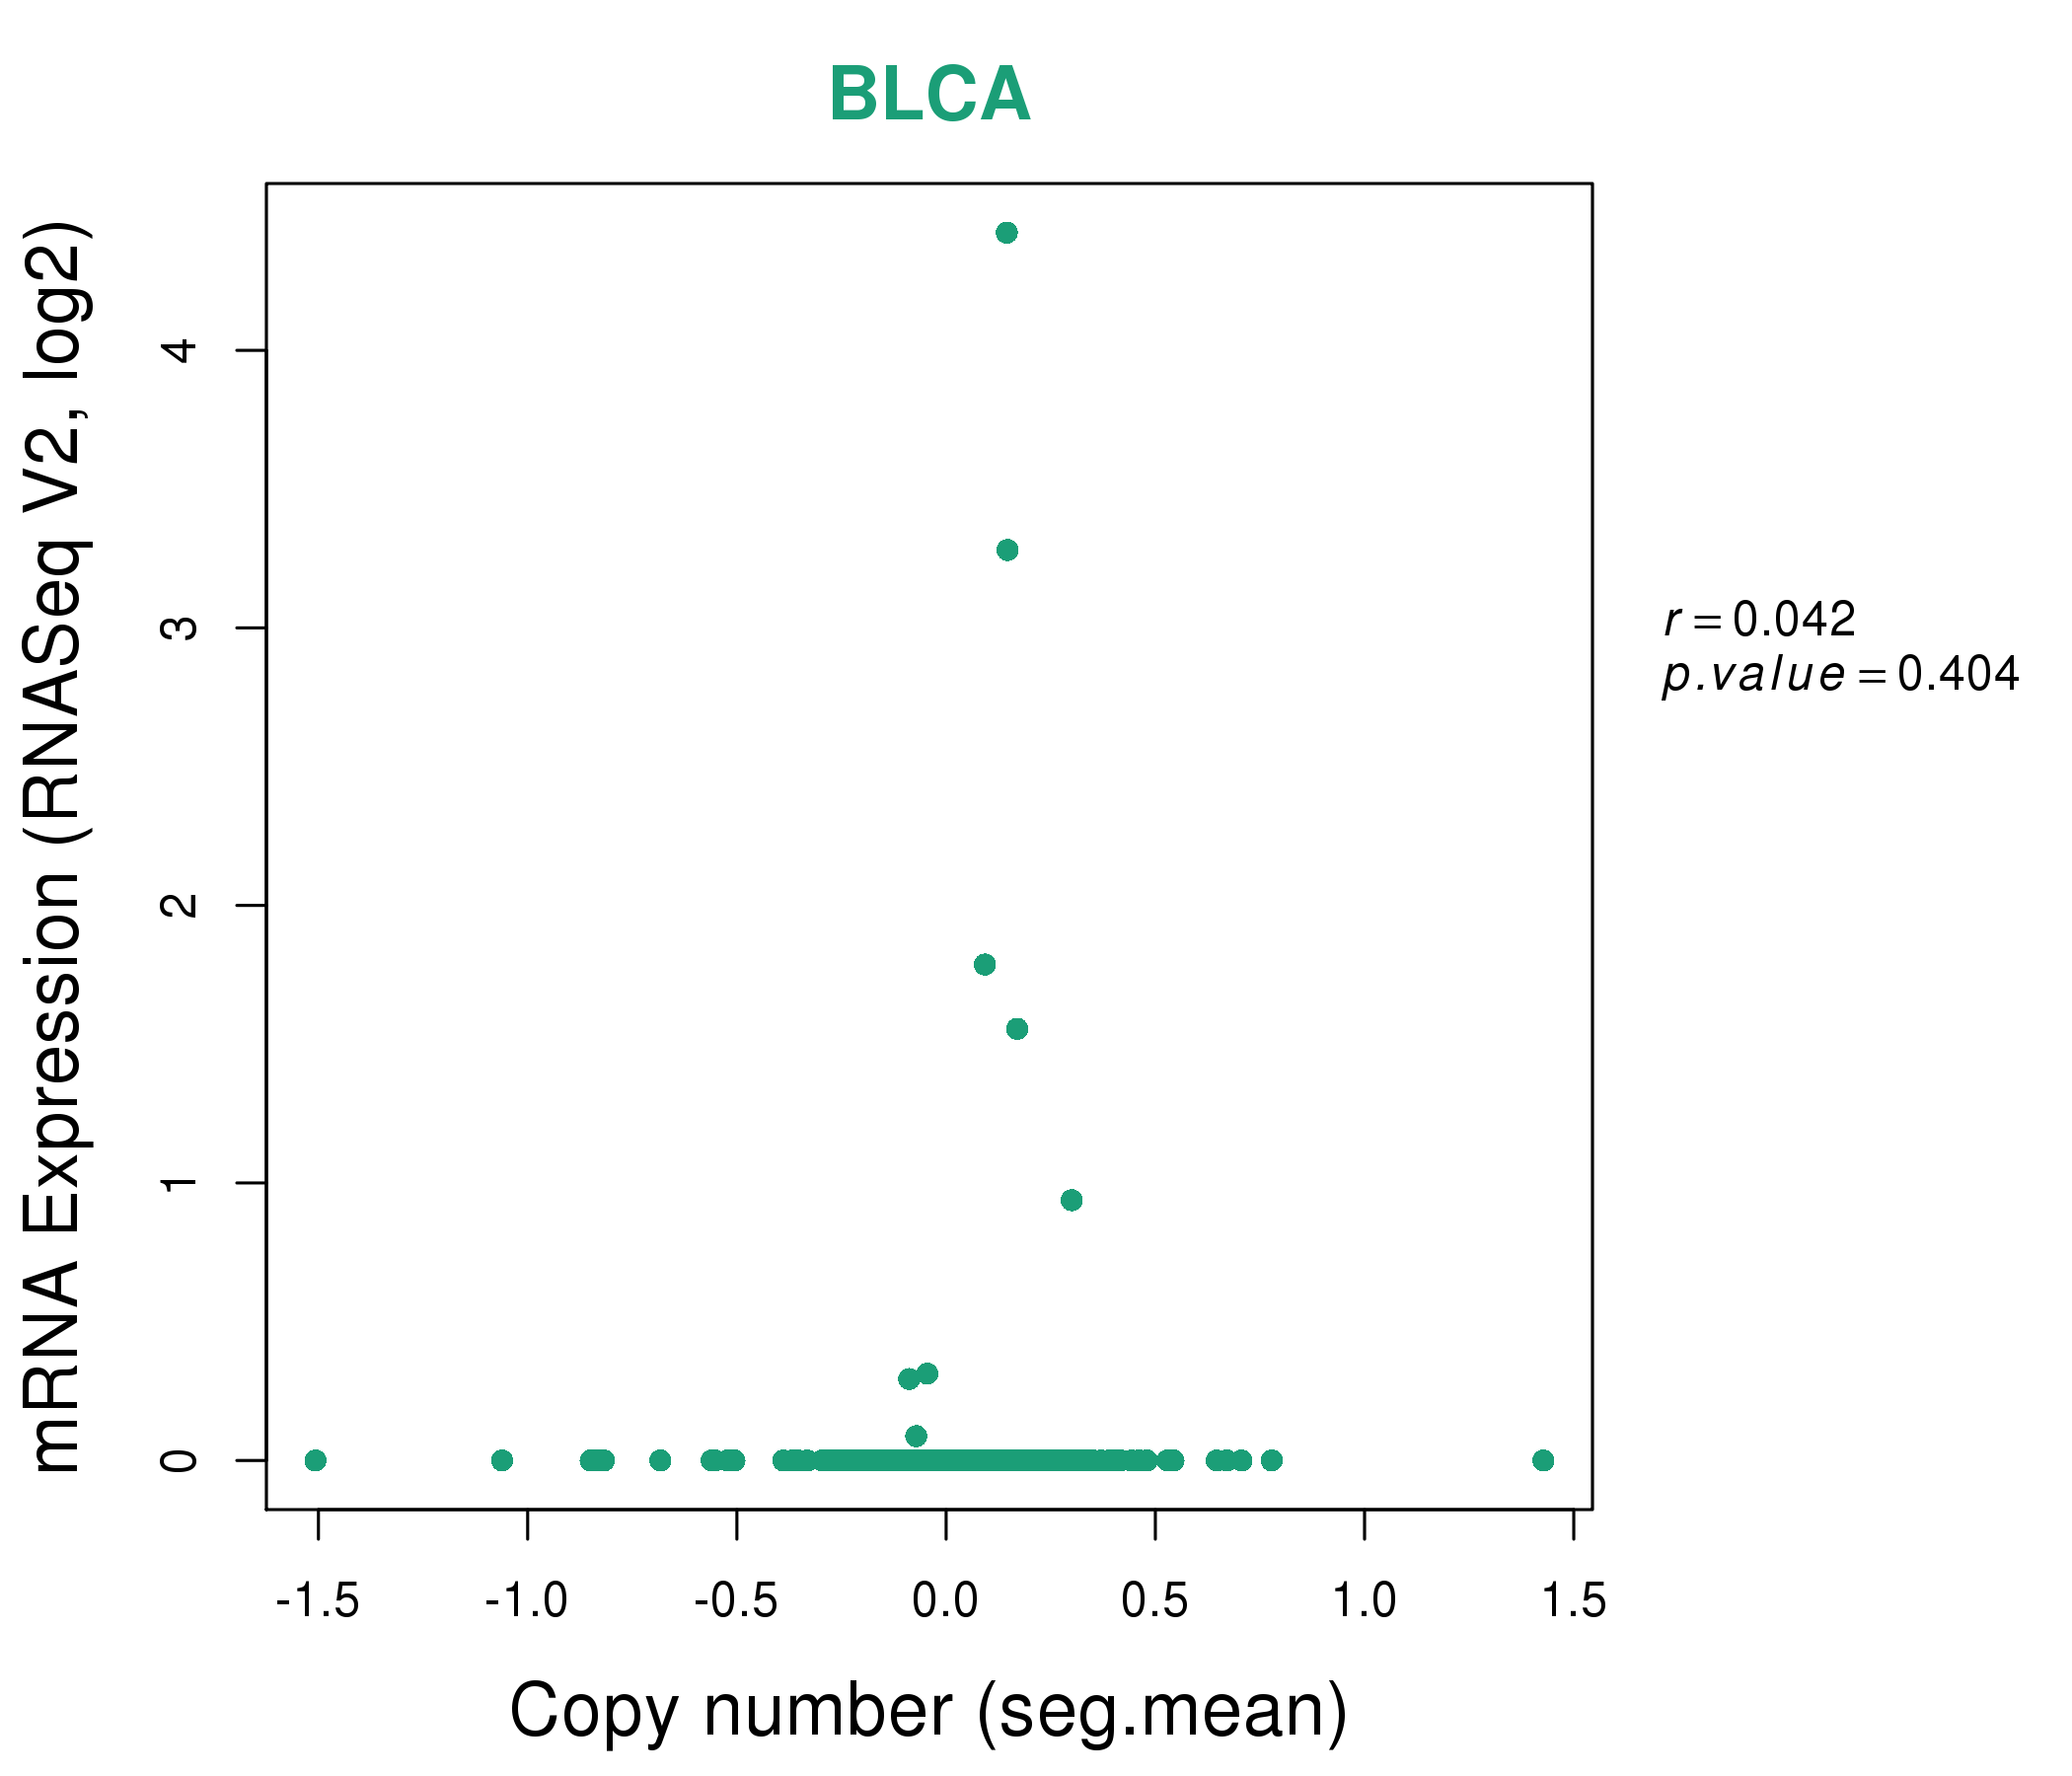
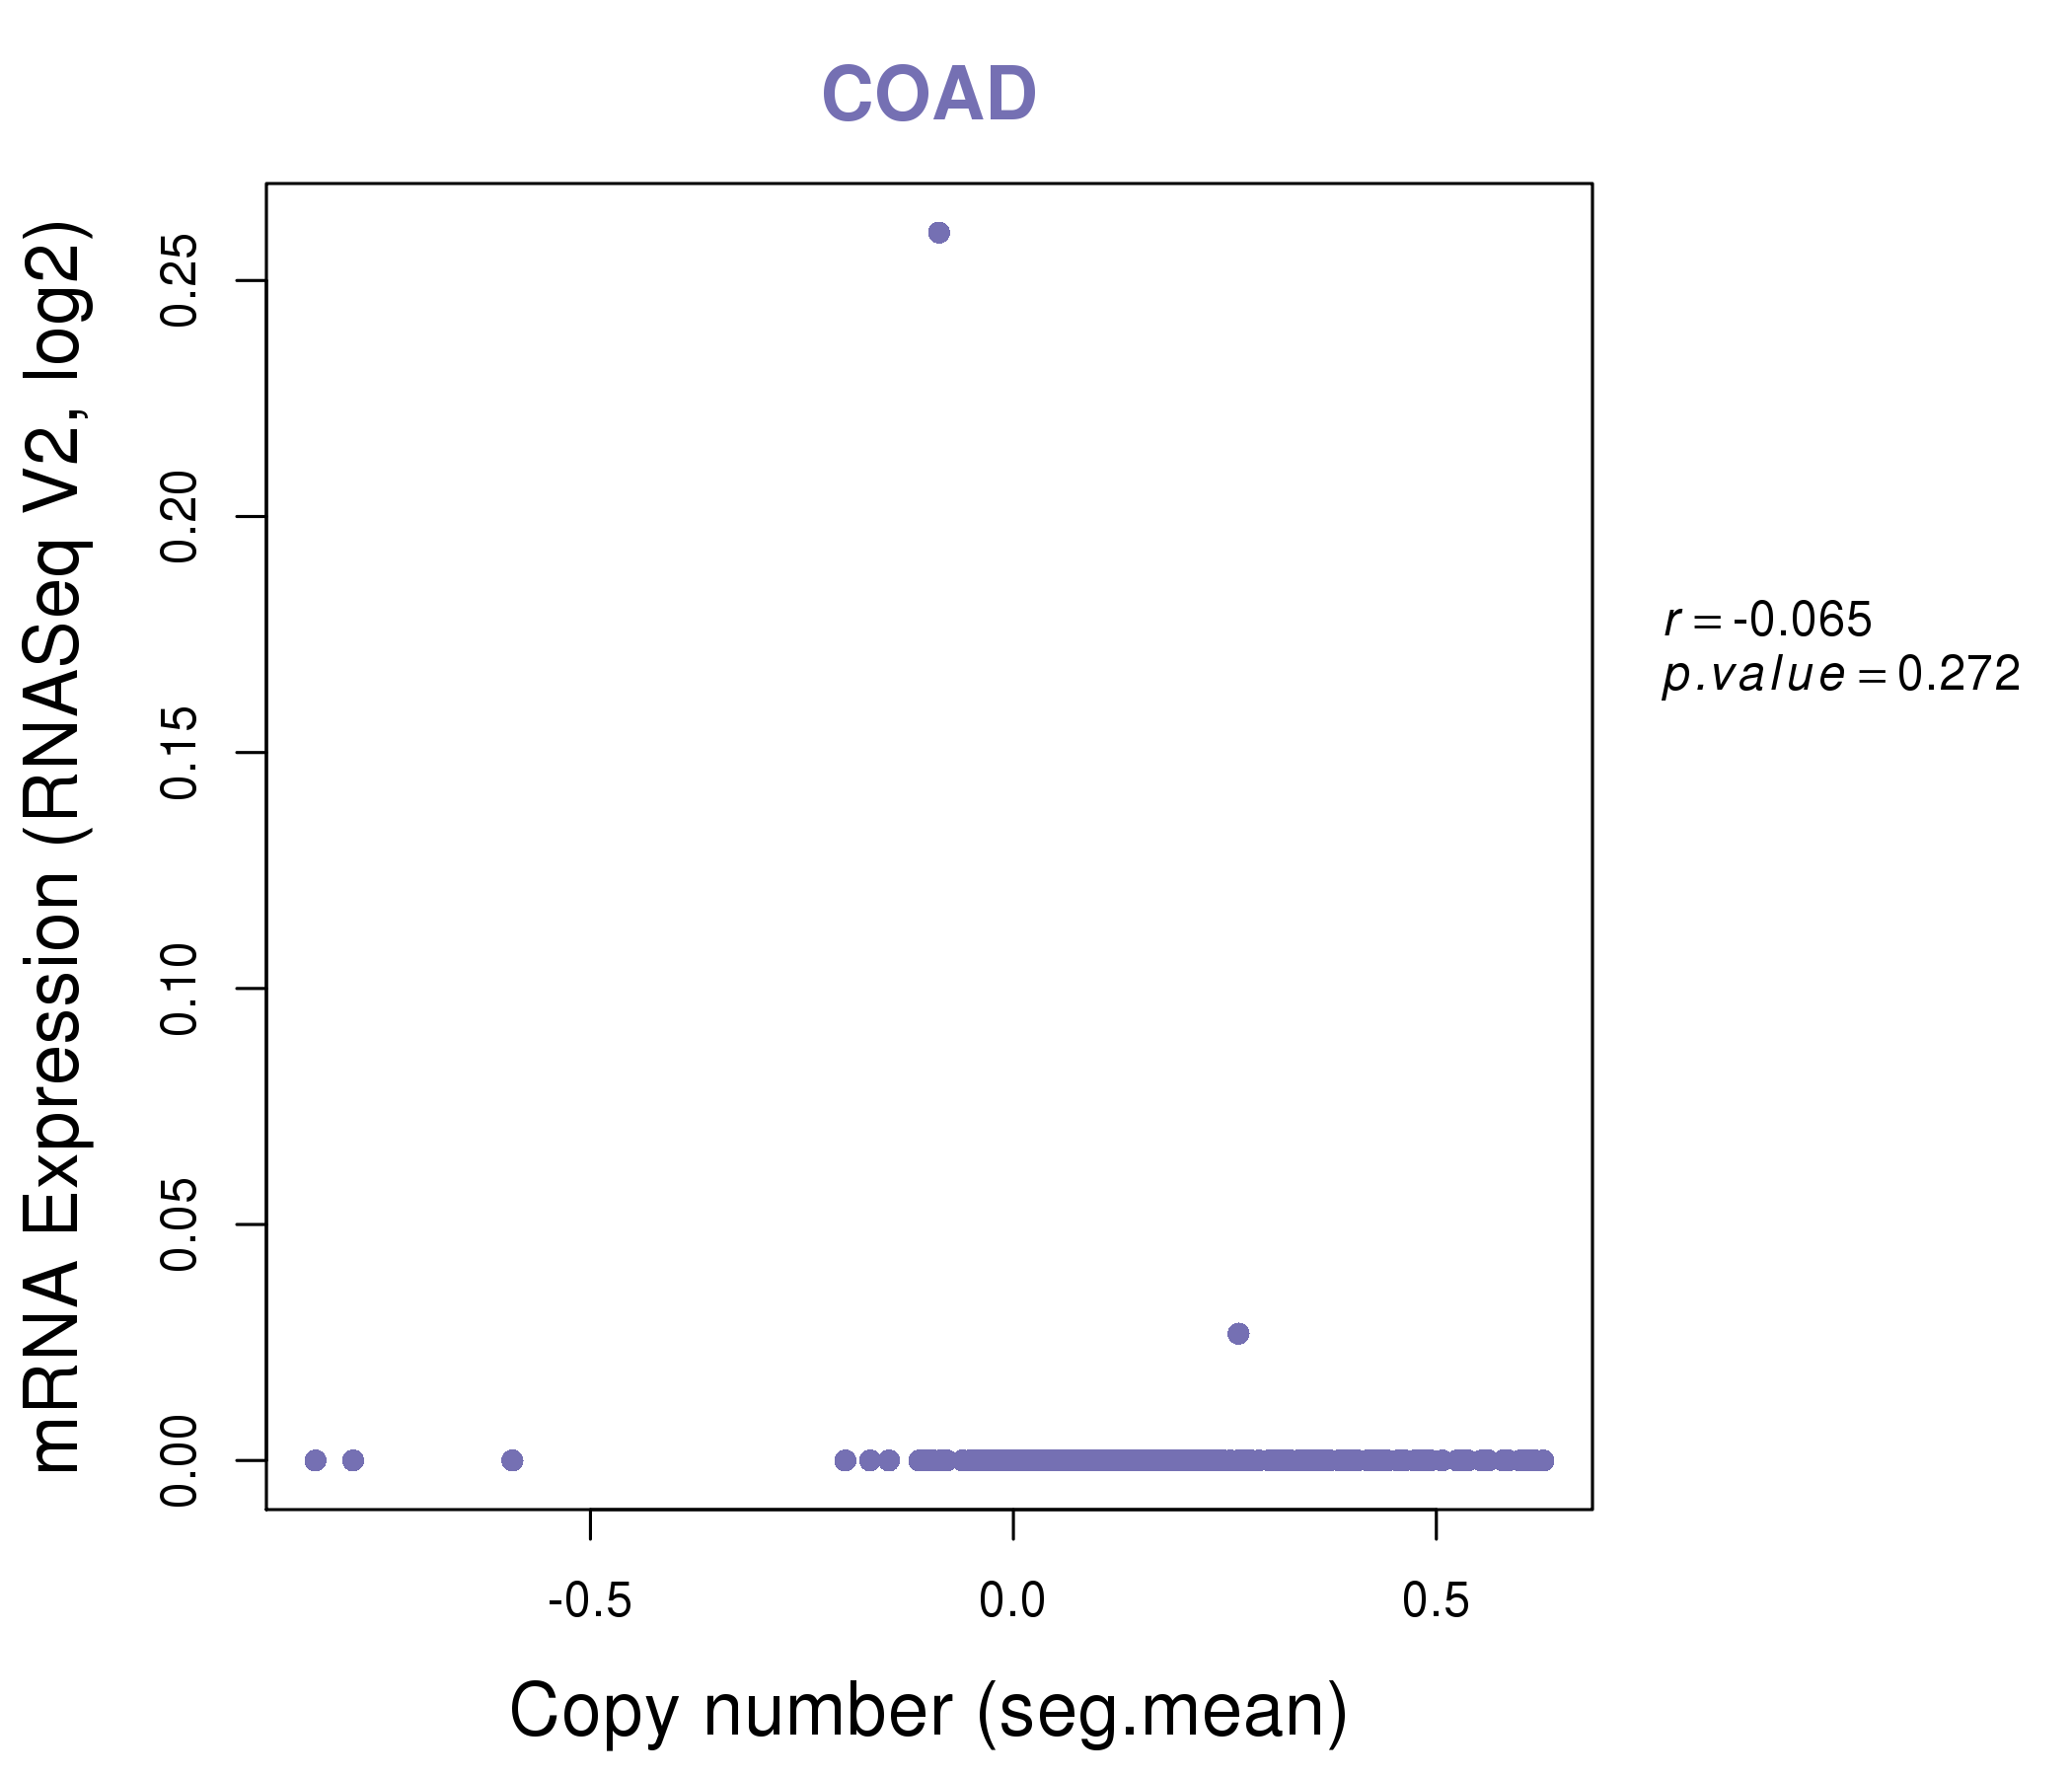
| * Copy number data were extracted from TCGA using R package TCGA-Assembler. The URLs of all public data files on TCGA DCC data server were gathered on Jan-05-2015. Function ProcessCNAData in TCGA-Assembler package was used to obtain gene-level copy number value which is calculated as the average copy number of the genomic region of a gene. |
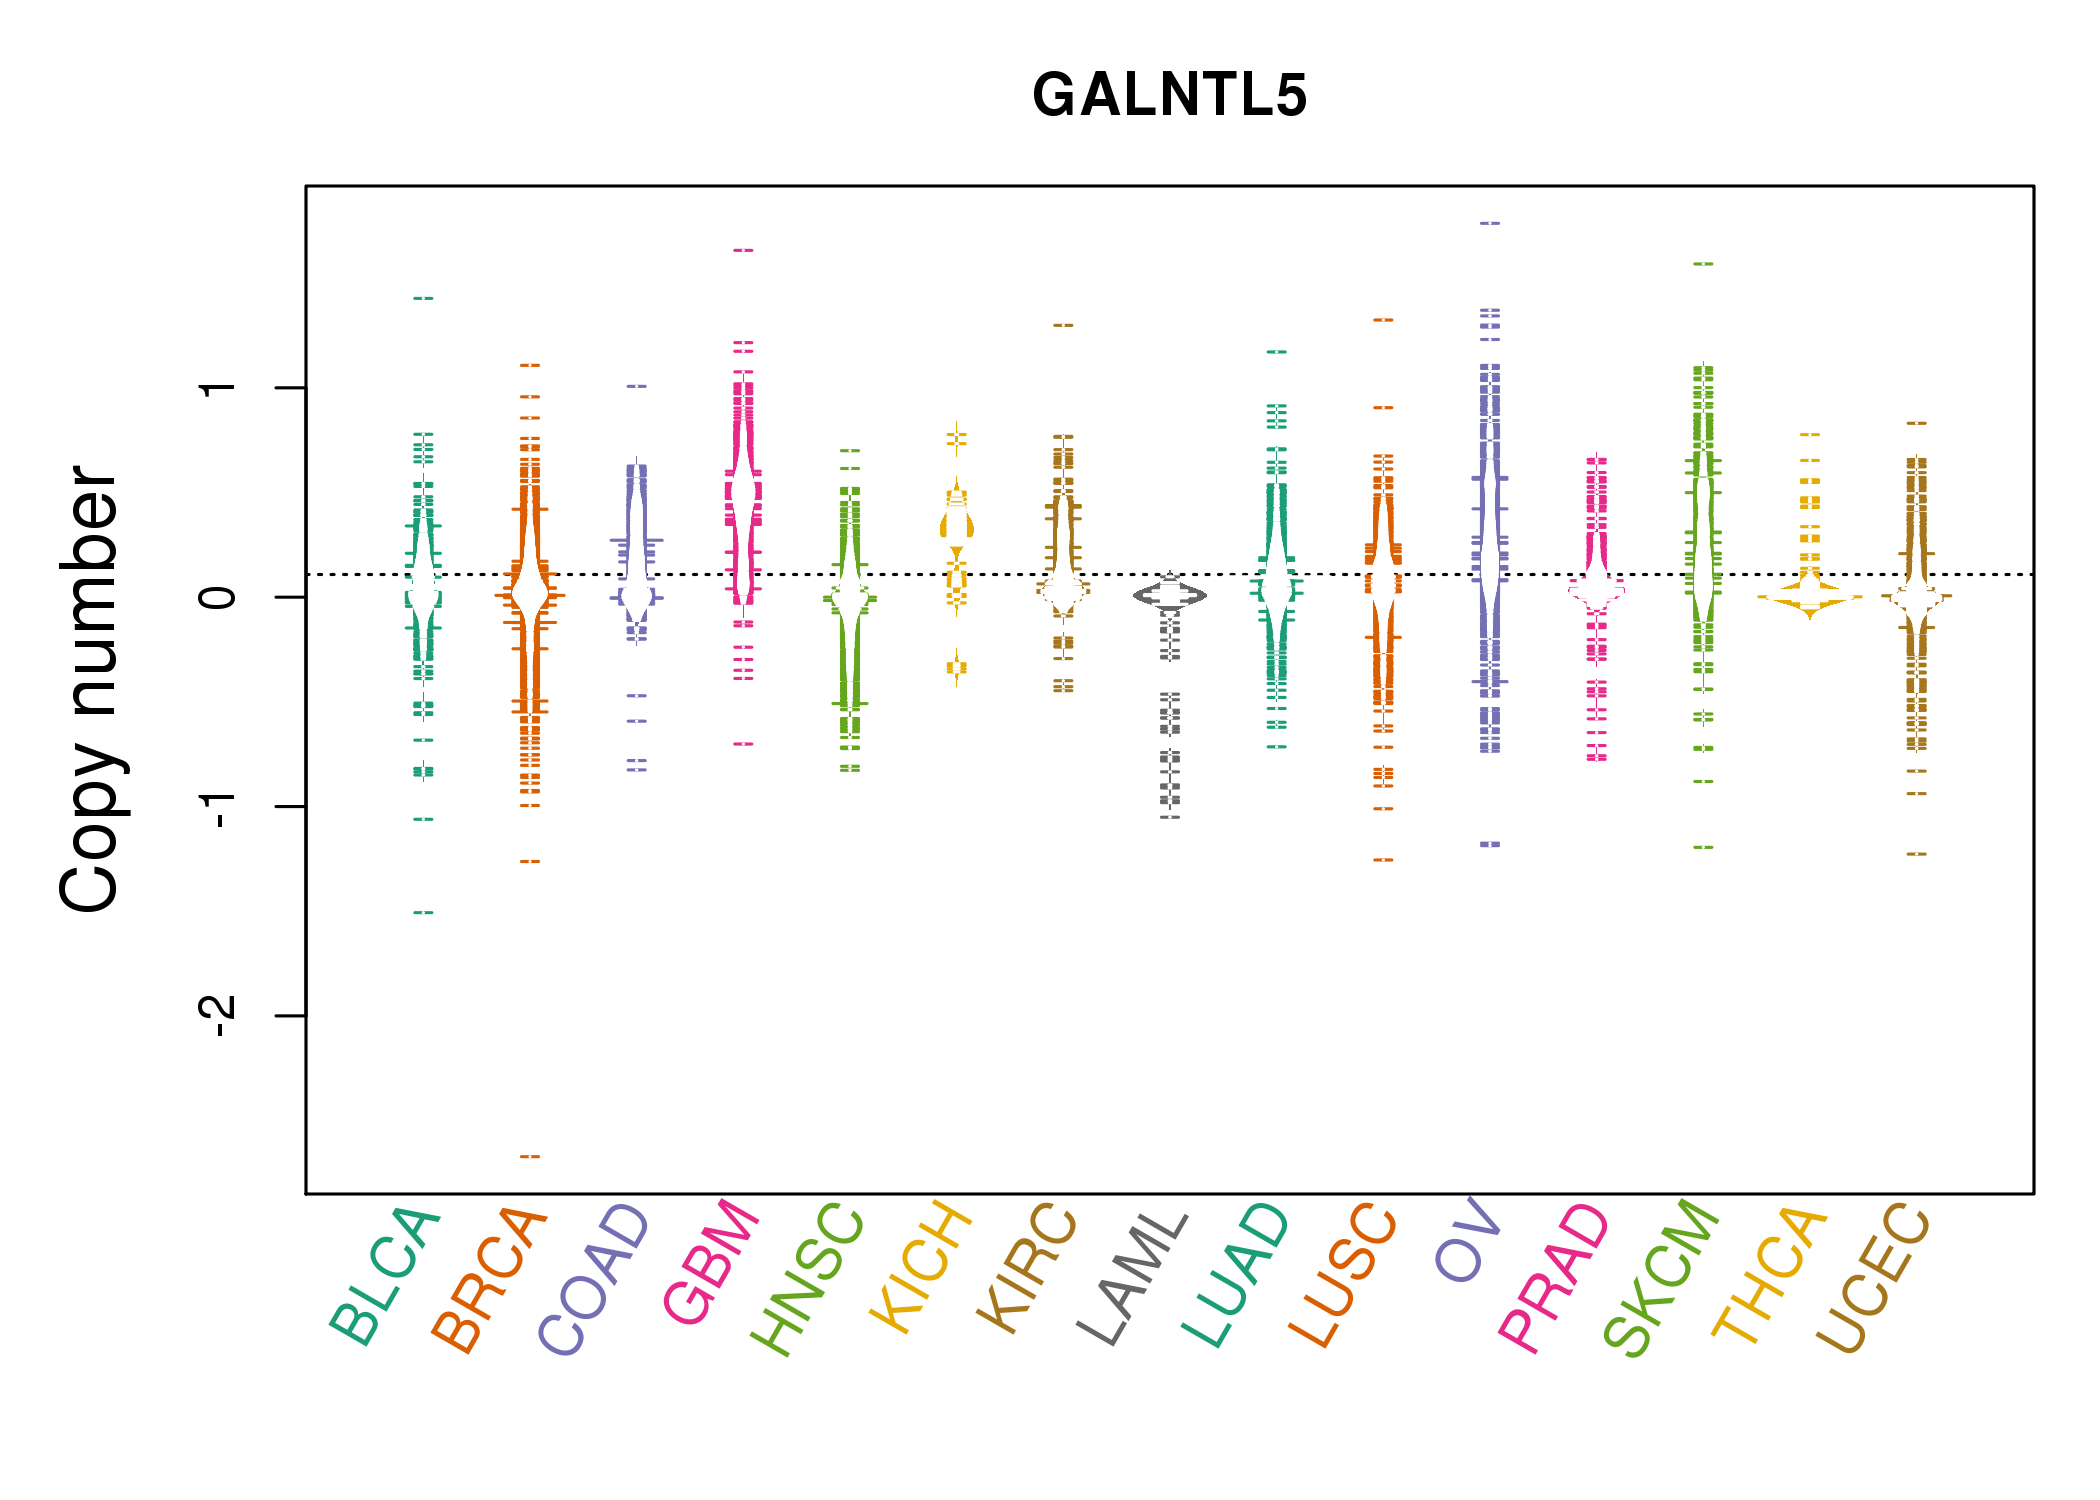 |
| cf) Tissue ID[Tissue type]: BLCA[Bladder Urothelial Carcinoma], BRCA[Breast invasive carcinoma], CESC[Cervical squamous cell carcinoma and endocervical adenocarcinoma], COAD[Colon adenocarcinoma], GBM[Glioblastoma multiforme], Glioma Low Grade, HNSC[Head and Neck squamous cell carcinoma], KICH[Kidney Chromophobe], KIRC[Kidney renal clear cell carcinoma], KIRP[Kidney renal papillary cell carcinoma], LAML[Acute Myeloid Leukemia], LUAD[Lung adenocarcinoma], LUSC[Lung squamous cell carcinoma], OV[Ovarian serous cystadenocarcinoma ], PAAD[Pancreatic adenocarcinoma], PRAD[Prostate adenocarcinoma], SKCM[Skin Cutaneous Melanoma], STAD[Stomach adenocarcinoma], THCA[Thyroid carcinoma], UCEC[Uterine Corpus Endometrial Carcinoma] |
| Top |
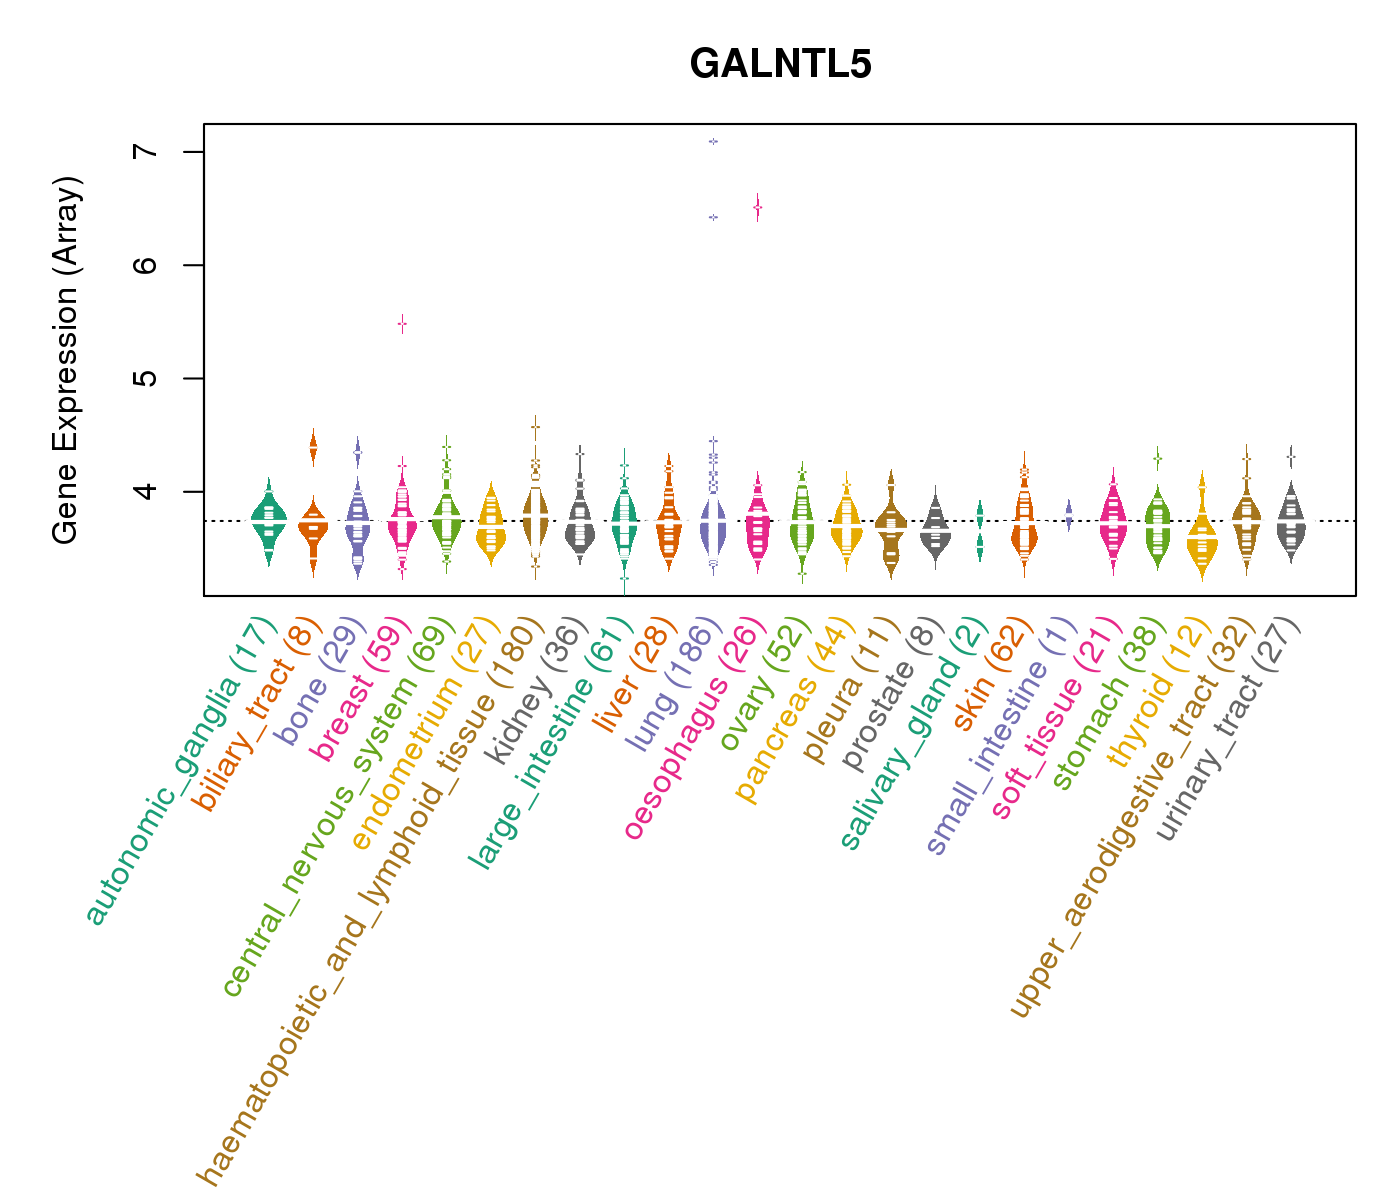
| Gene Expression for GALNTL5 |
| * CCLE gene expression data were extracted from CCLE_Expression_Entrez_2012-10-18.res: Gene-centric RMA-normalized mRNA expression data. |
 |
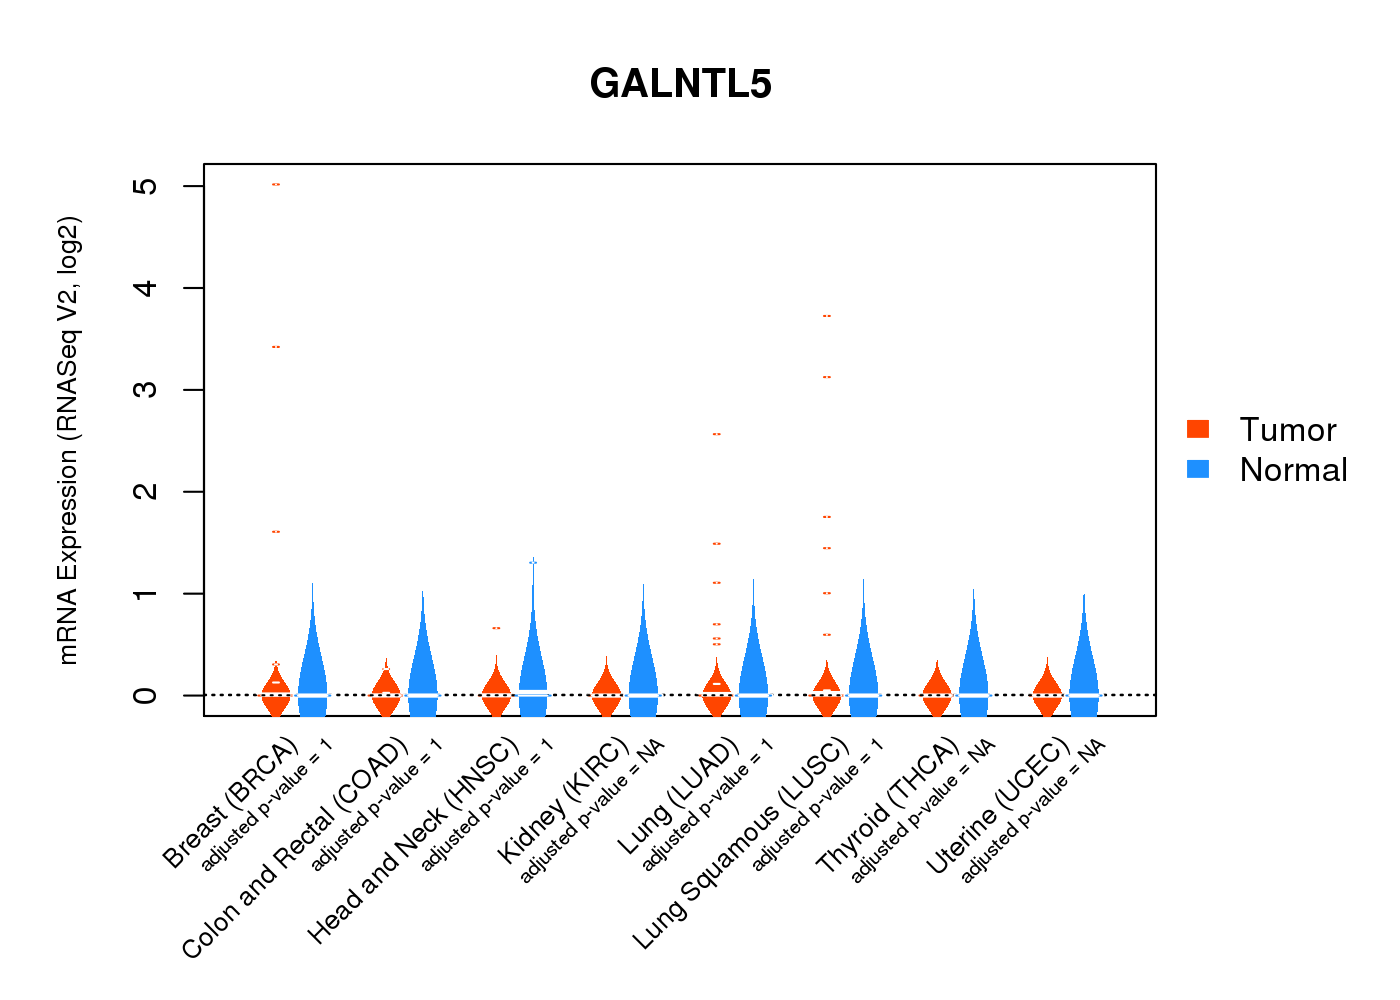
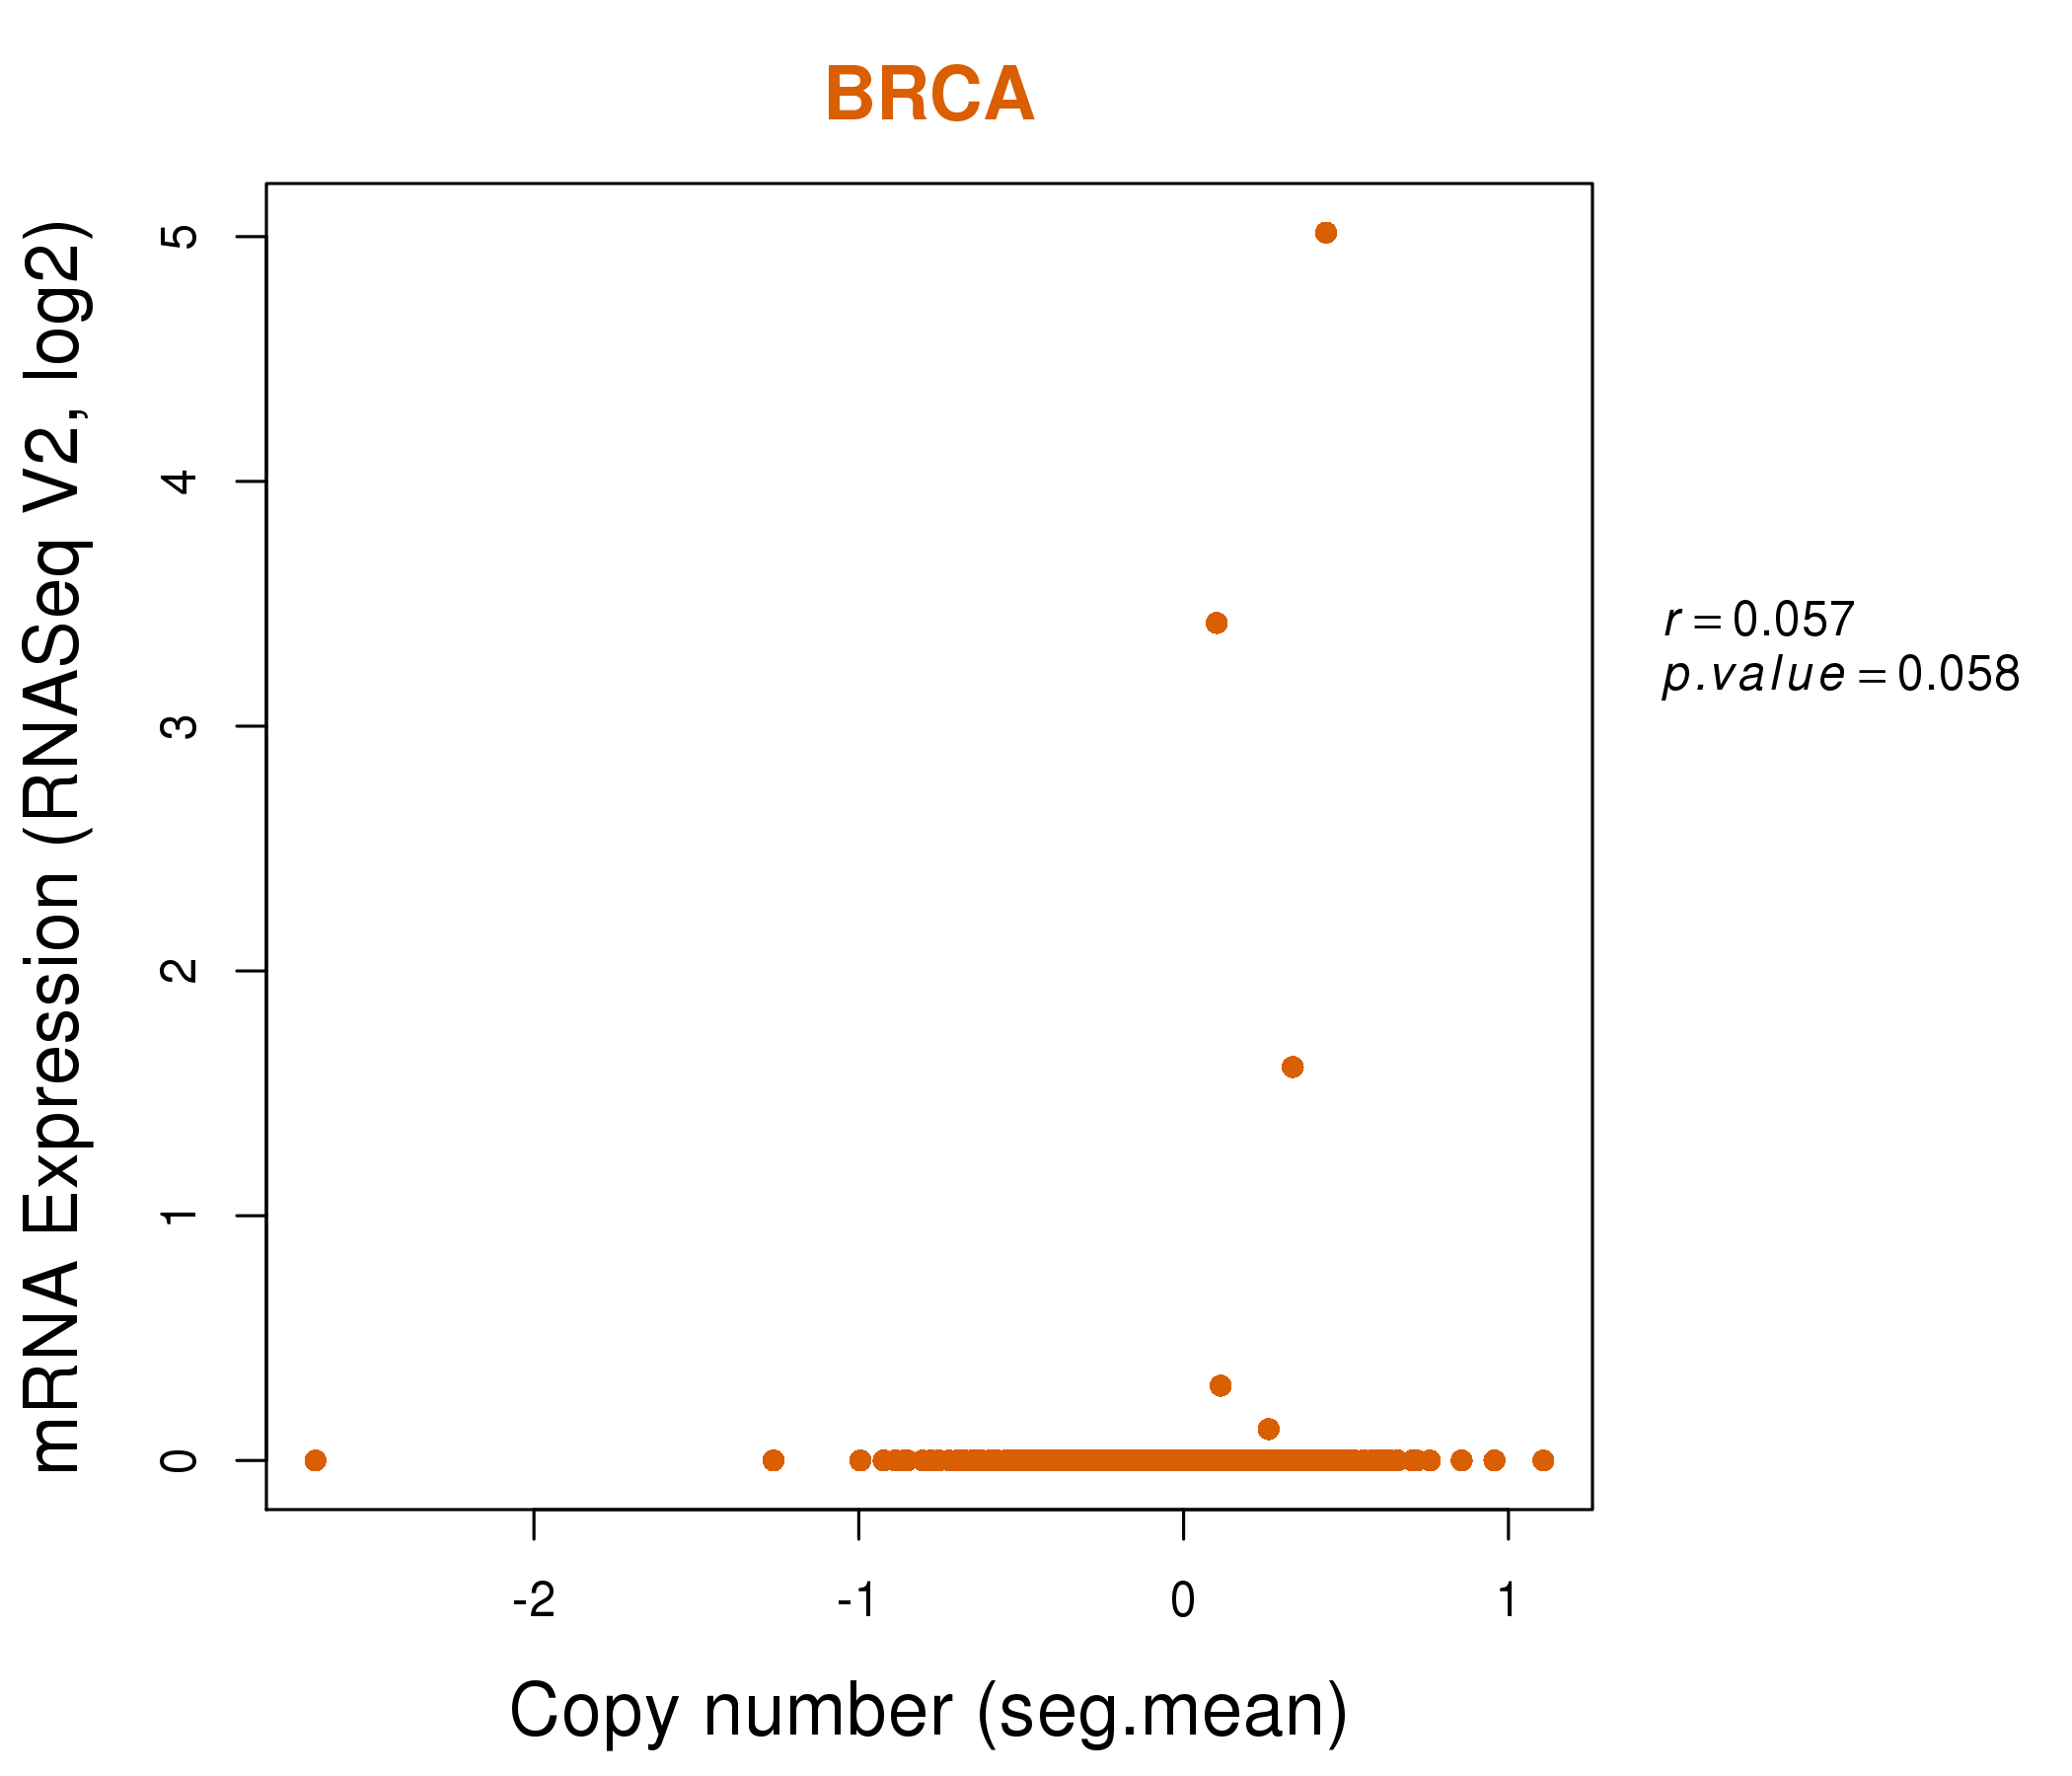
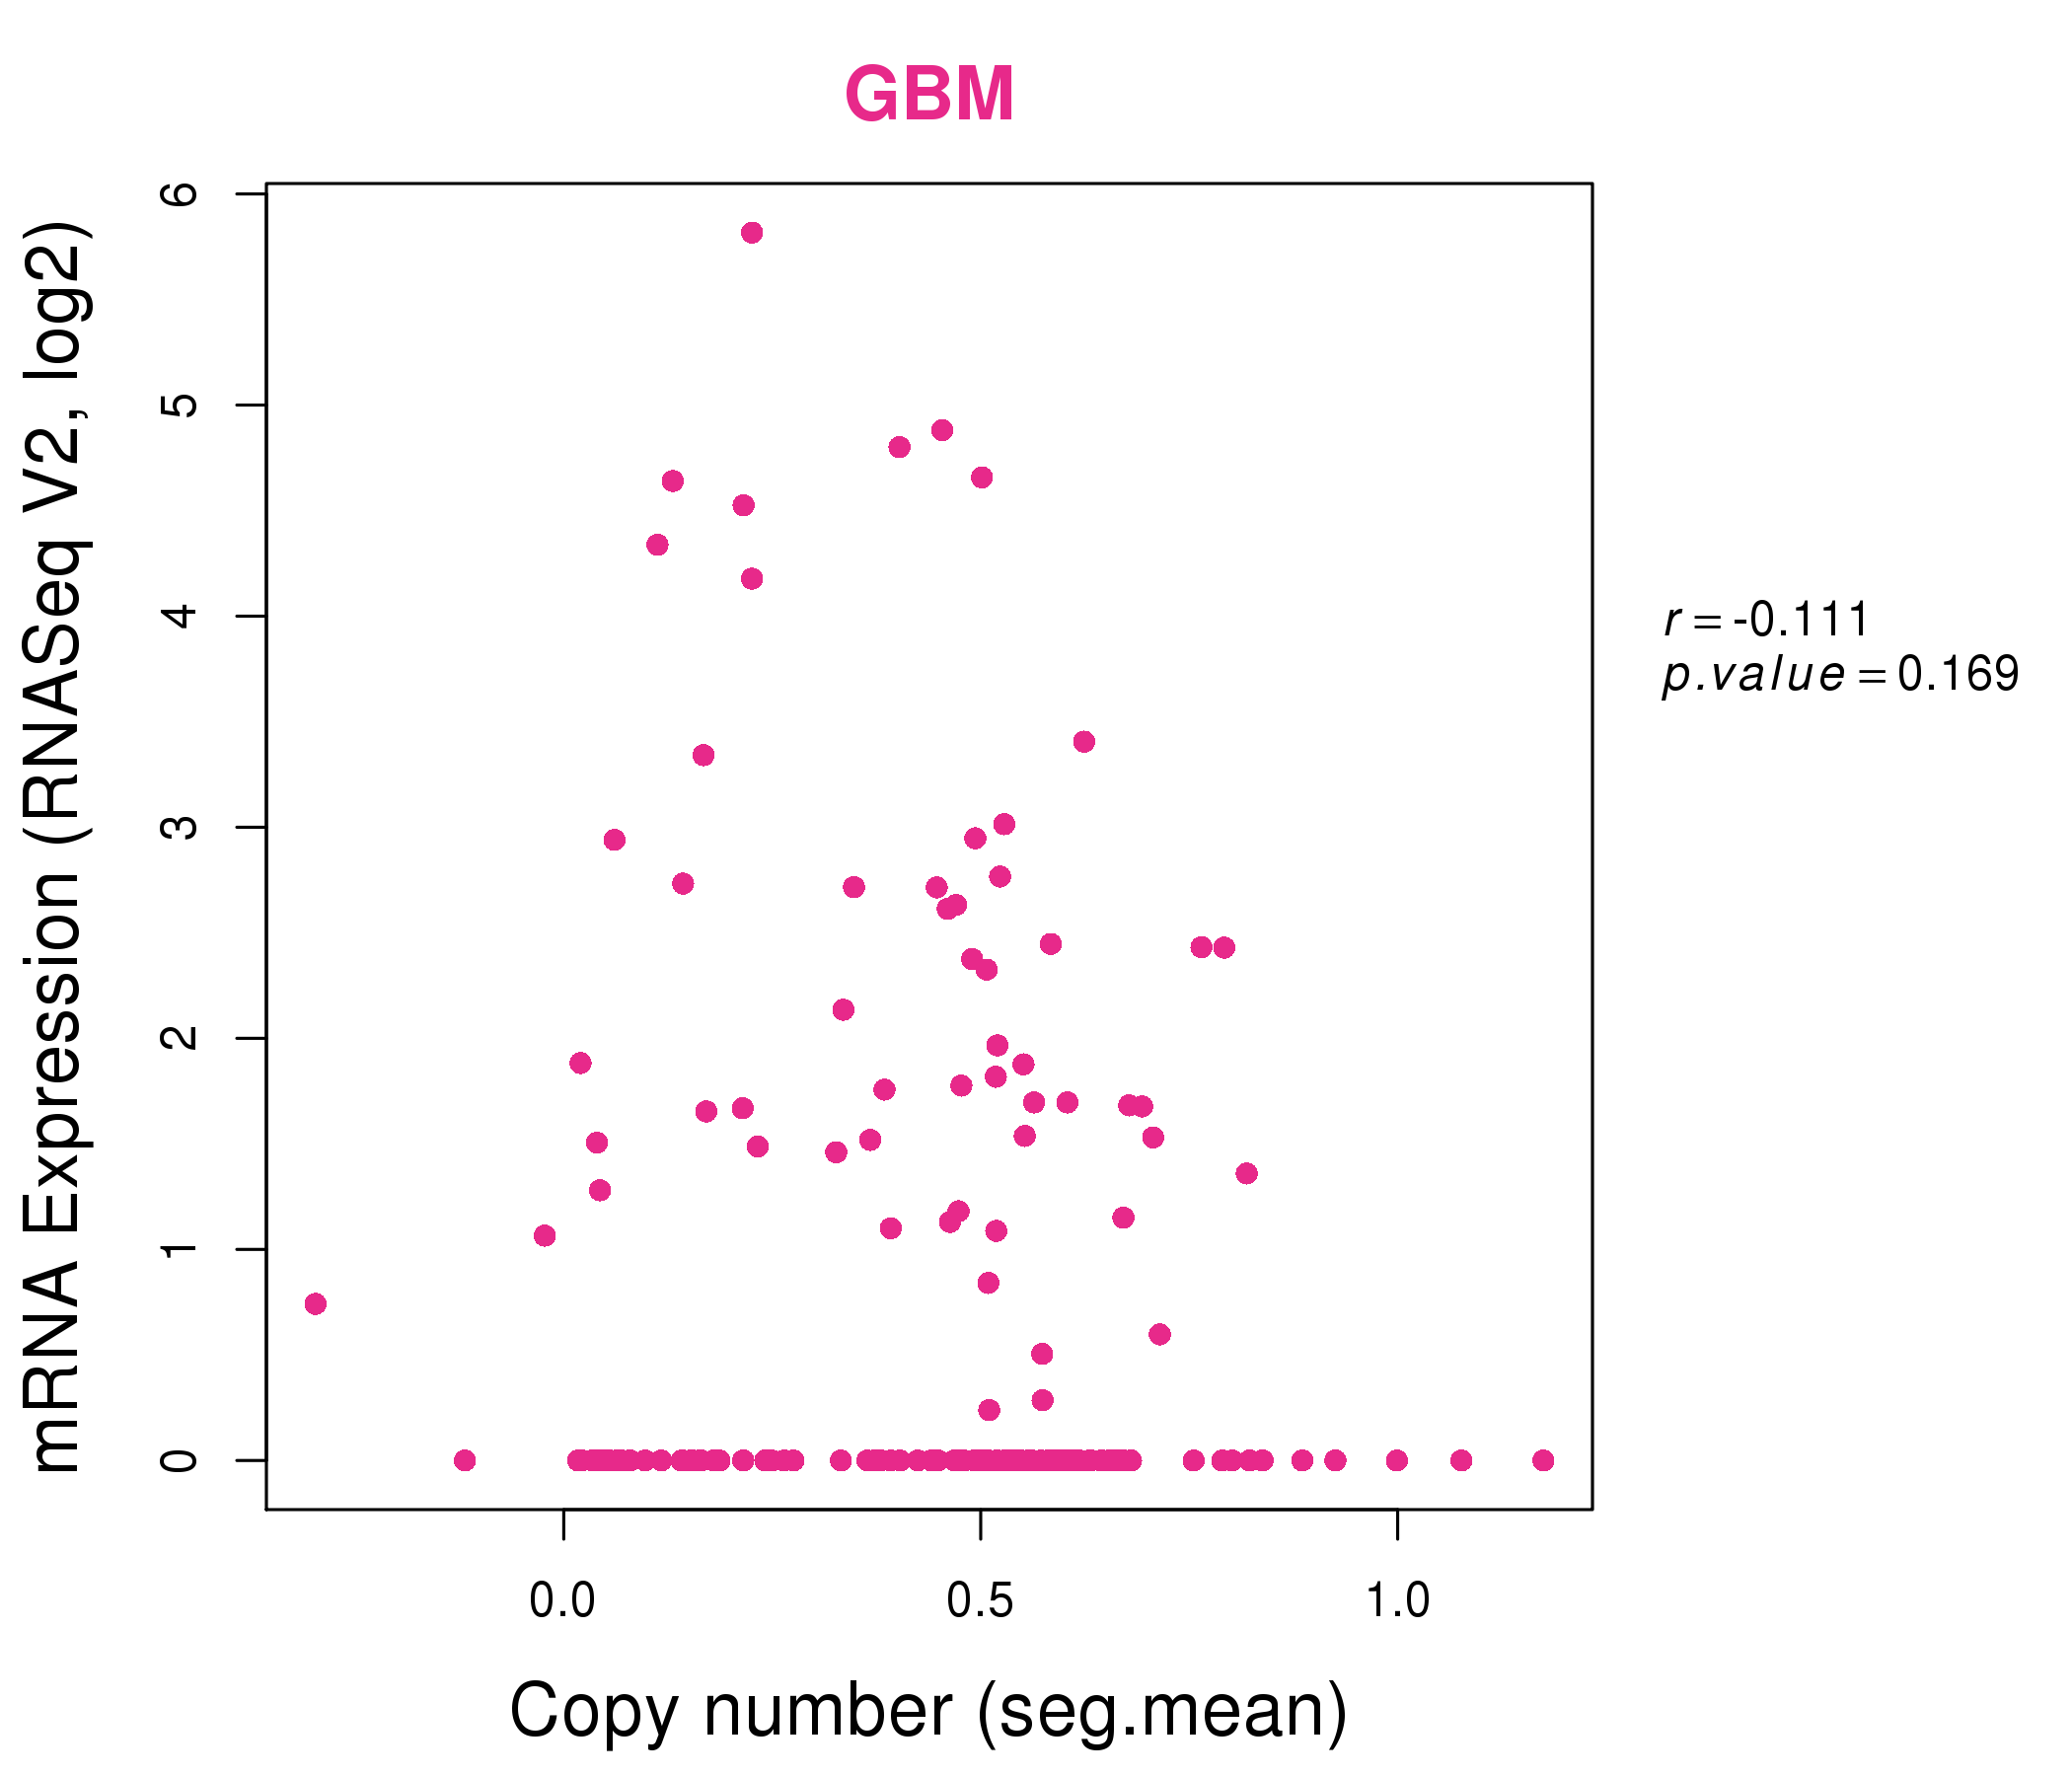
| * Normalized gene expression data of RNASeqV2 was extracted from TCGA using R package TCGA-Assembler. The URLs of all public data files on TCGA DCC data server were gathered at Jan-05-2015. Only eight cancer types have enough normal control samples for differential expression analysis. (t test, adjusted p<0.05 (using Benjamini-Hochberg FDR)) |
 |
| Top |
| * This plots show the correlation between CNV and gene expression. |
: Open all plots for all cancer types
 |
|
 |
|
| Top |
| Gene-Gene Network Information |
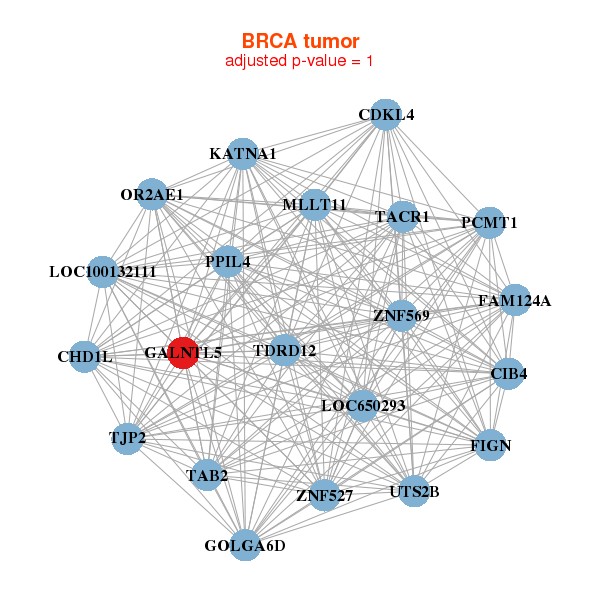
| * Co-Expression network figures were drawn using R package igraph. Only the top 20 genes with the highest correlations were shown. Red circle: input gene, orange circle: cell metabolism gene, sky circle: other gene |
: Open all plots for all cancer types
 |
|
| CDKL4,CHD1L,CIB4,FAM124A,FIGN,GALNTL5,GOLGA6D, KATNA1,LOC100132111,LOC650293,MLLT11,OR2AE1,PCMT1,PPIL4, TAB2,TACR1,TDRD12,TJP2,UTS2B,ZNF527,ZNF569 | ATP12A,CDH7,CXADRP3,CYP1A1,CYP4F8,GALNTL5,GIF, GPX5,IL23R,LTK,MRGPRX2,NKX6-3,OR14C36,OR4D11, OR4K2,OR7A10,PRG3,PRM3,SLITRK3,SNORA9,ZP4 |
 |
|
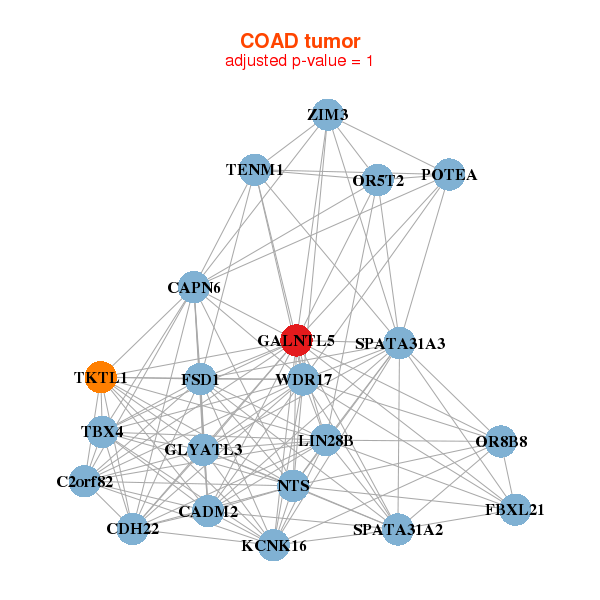
| C2orf82,CADM2,CAPN6,CDH22,SPATA31A2,SPATA31A3,FBXL21, FSD1,GALNTL5,GLYATL3,KCNK16,LIN28B,NTS,TENM1, OR5T2,OR8B8,POTEA,TBX4,TKTL1,WDR17,ZIM3 | NA,NA,NA,NA,NA,NA,NA, NA,NA,NA,NA,NA,NA,NA, NA,NA,NA,NA,NA,NA,NA |
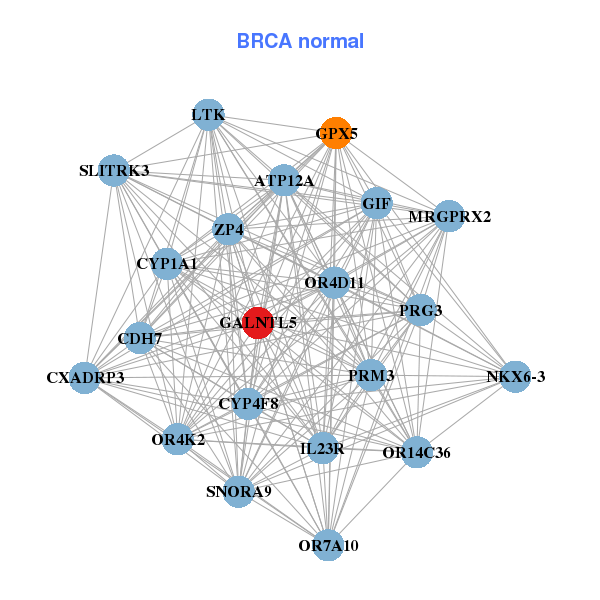
| * Co-Expression network figures were drawn using R package igraph. Only the top 20 genes with the highest correlations were shown. Red circle: input gene, orange circle: cell metabolism gene, sky circle: other gene |
: Open all plots for all cancer types
| Top |
: Open all interacting genes' information including KEGG pathway for all interacting genes from DAVID
| Top |
| Pharmacological Information for GALNTL5 |
| There's no related Drug. |
| Top |
| Cross referenced IDs for GALNTL5 |
| * We obtained these cross-references from Uniprot database. It covers 150 different DBs, 18 categories. http://www.uniprot.org/help/cross_references_section |
: Open all cross reference information
|
Copyright © 2016-Present - The Univsersity of Texas Health Science Center at Houston @ |