|
||||||||||||||||||||||||||||||||||||||||||||||||||||||||||||||||||||||||||||||||||||||||||||||||||||||||||||||||||||||||||||||||||||||||||||||||||||||||||||||||||||||||||||||||||||||||||||||||||||||||||||||||||||||||||||||||||||||||||||||||||||||||||||||||||||||||||||||||||||||||||||||||||||||||||||||||||||||||||
| |
| Phenotypic Information (metabolism pathway, cancer, disease, phenome) |
| |
| |
| Gene-Gene Network Information: Co-Expression Network, Interacting Genes & KEGG |
| |
|


| Gene Summary for IDO2 |
| Basic gene info. | Gene symbol | IDO2 |
| Gene name | indoleamine 2,3-dioxygenase 2 | |
| Synonyms | INDOL1 | |
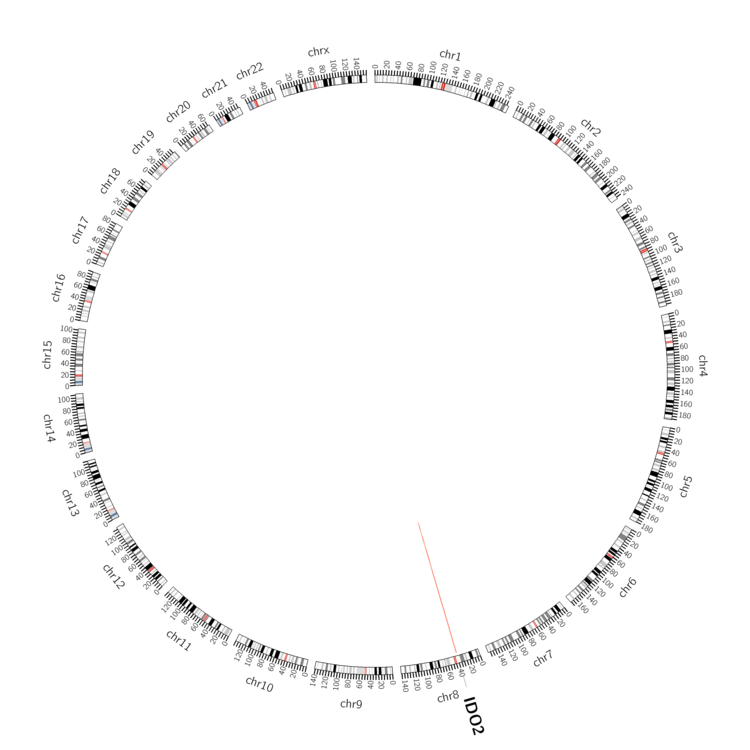
| Cytomap | UCSC genome browser: 8p11.21 | |
| Genomic location | chr8 :39792473-39873910 | |
| Type of gene | protein-coding | |
| RefGenes | NM_194294.2, | |
| Ensembl id | ENSG00000188676 | |
| Description | IDO-2indoleamine 2,3-dioxygenase-like 1 proteinindoleamine 2,3-dioxygenase-like protein 1indoleamine-pyrrole 2,3 dioxygenase-like 1indoleamine-pyrrole 2,3-dioxygenase-like protein 1 | |
| Modification date | 20141211 | |
| dbXrefs | MIM : 612129 | |
| HGNC : HGNC | ||
| Ensembl : ENSG00000188676 | ||
| HPRD : 14113 | ||
| Protein | UniProt: go to UniProt's Cross Reference DB Table | |
| Expression | CleanEX: HS_IDO2 | |
| BioGPS: 169355 | ||
| Gene Expression Atlas: ENSG00000188676 | ||
| The Human Protein Atlas: ENSG00000188676 | ||
| Pathway | NCI Pathway Interaction Database: IDO2 | |
| KEGG: IDO2 | ||
| REACTOME: IDO2 | ||
| ConsensusPathDB | ||
| Pathway Commons: IDO2 | ||
| Metabolism | MetaCyc: IDO2 | |
| HUMANCyc: IDO2 | ||
| Regulation | Ensembl's Regulation: ENSG00000188676 | |
| miRBase: chr8 :39,792,473-39,873,910 | ||
| TargetScan: NM_194294 | ||
| cisRED: ENSG00000188676 | ||
| Context | iHOP: IDO2 | |
| cancer metabolism search in PubMed: IDO2 | ||
| UCL Cancer Institute: IDO2 | ||
| Assigned class in ccmGDB | C | |
| Top |
| Phenotypic Information for IDO2(metabolism pathway, cancer, disease, phenome) |
| Cancer | CGAP: IDO2 |
| Familial Cancer Database: IDO2 | |
| * This gene is included in those cancer gene databases. |
|
|
|
|
|
|
| ||||||||||||||||||||||||||||||||||||||||||||||||||||||||||||||||||||||||||||||||||||||||||||||||||||||||||||||||||||||||||||||||||||||||||||||||||||||||||||||||||||||||||||||||||||||||||||||||||||||||||||||||||||||||||||||||||||||||||||||||||||||||||||||||||||||||||||||||||||||||||||||||||||||||||||||||||||
Oncogene 1 | Significant driver gene in | |||||||||||||||||||||||||||||||||||||||||||||||||||||||||||||||||||||||||||||||||||||||||||||||||||||||||||||||||||||||||||||||||||||||||||||||||||||||||||||||||||||||||||||||||||||||||||||||||||||||||||||||||||||||||||||||||||||||||||||||||||||||||||||||||||||||||||||||||||||||||||||||||||||||||||||||||||||||||
| cf) number; DB name 1 Oncogene; http://nar.oxfordjournals.org/content/35/suppl_1/D721.long, 2 Tumor Suppressor gene; https://bioinfo.uth.edu/TSGene/, 3 Cancer Gene Census; http://www.nature.com/nrc/journal/v4/n3/abs/nrc1299.html, 4 CancerGenes; http://nar.oxfordjournals.org/content/35/suppl_1/D721.long, 5 Network of Cancer Gene; http://ncg.kcl.ac.uk/index.php, 1Therapeutic Vulnerabilities in Cancer; http://cbio.mskcc.org/cancergenomics/statius/ |
| KEGG_TRYPTOPHAN_METABOLISM REACTOME_METABOLISM_OF_AMINO_ACIDS_AND_DERIVATIVES | |
| OMIM | |
| Orphanet | |
| Disease | KEGG Disease: IDO2 |
| MedGen: IDO2 (Human Medical Genetics with Condition) | |
| ClinVar: IDO2 | |
| Phenotype | MGI: IDO2 (International Mouse Phenotyping Consortium) |
| PhenomicDB: IDO2 | |
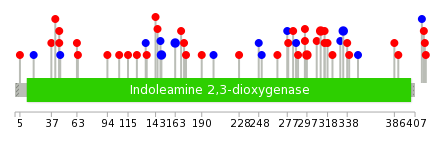
| Mutations for IDO2 |
| * Under tables are showing count per each tissue to give us broad intuition about tissue specific mutation patterns.You can go to the detailed page for each mutation database's web site. |
| - Statistics for Tissue and Mutation type | Top |
 |
| - For Inter-chromosomal Variations |
| There's no inter-chromosomal structural variation. |
| - For Intra-chromosomal Variations |
| * Intra-chromosomal variantions includes 'intrachromosomal amplicon to amplicon', 'intrachromosomal amplicon to non-amplified dna', 'intrachromosomal deletion', 'intrachromosomal fold-back inversion', 'intrachromosomal inversion', 'intrachromosomal tandem duplication', 'Intrachromosomal unknown type', 'intrachromosomal with inverted orientation', 'intrachromosomal with non-inverted orientation'. |
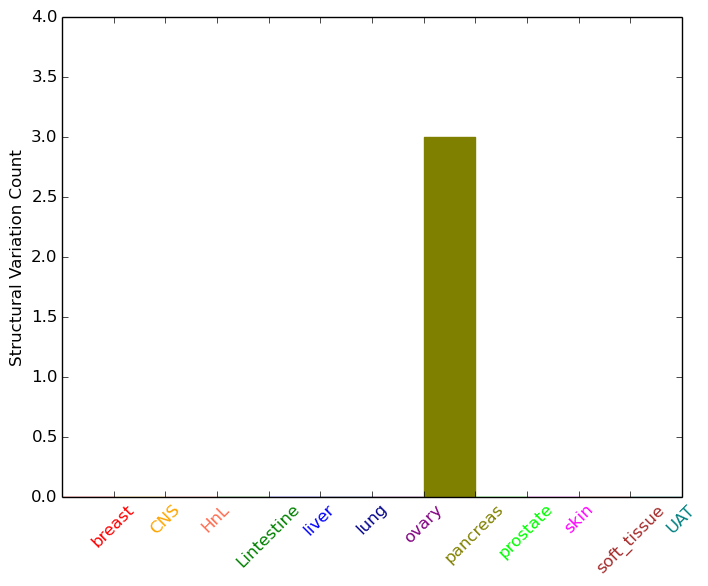 |
| Sample | Symbol_a | Chr_a | Start_a | End_a | Symbol_b | Chr_b | Start_b | End_b |
| pancreas | IDO2 | chr8 | 39793055 | 39793055 | chr8 | 40261878 | 40261878 | |
| pancreas | IDO2 | chr8 | 39851289 | 39851309 | IDO2 | chr8 | 39828200 | 39828220 |
| cf) Tissue number; Tissue name (1;Breast, 2;Central_nervous_system, 3;Haematopoietic_and_lymphoid_tissue, 4;Large_intestine, 5;Liver, 6;Lung, 7;Ovary, 8;Pancreas, 9;Prostate, 10;Skin, 11;Soft_tissue, 12;Upper_aerodigestive_tract) |
| * From mRNA Sanger sequences, Chitars2.0 arranged chimeric transcripts. This table shows IDO2 related fusion information. |
| ID | Head Gene | Tail Gene | Accession | Gene_a | qStart_a | qEnd_a | Chromosome_a | tStart_a | tEnd_a | Gene_a | qStart_a | qEnd_a | Chromosome_a | tStart_a | tEnd_a |
| BG007180 | AQPEP | 5 | 167 | 5 | 115314559 | 115314720 | IDO2 | 158 | 362 | 8 | 39810708 | 39810912 | |
| Top |
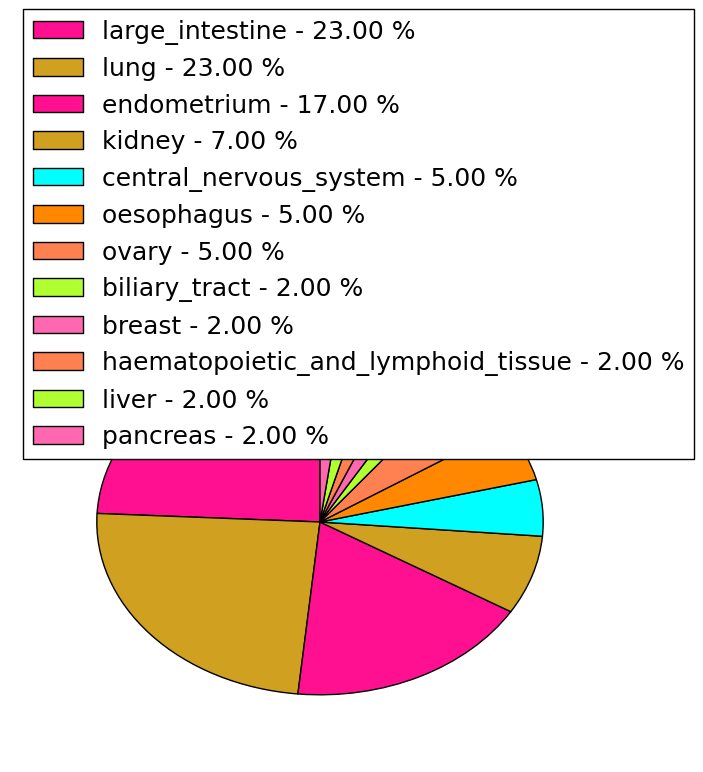
| Mutation type/ Tissue ID | brca | cns | cerv | endome | haematopo | kidn | Lintest | liver | lung | ns | ovary | pancre | prost | skin | stoma | thyro | urina | |||
| Total # sample | 11 | 2 | 6 | 5 | 1 | 1 | 1 | |||||||||||||
| GAIN (# sample) | 11 | 2 | 5 | 3 | 1 | 1 | 1 | |||||||||||||
| LOSS (# sample) | 1 | 2 |
| cf) Tissue ID; Tissue type (1; Breast, 2; Central_nervous_system, 3; Cervix, 4; Endometrium, 5; Haematopoietic_and_lymphoid_tissue, 6; Kidney, 7; Large_intestine, 8; Liver, 9; Lung, 10; NS, 11; Ovary, 12; Pancreas, 13; Prostate, 14; Skin, 15; Stomach, 16; Thyroid, 17; Urinary_tract) |
| Top |
|
 |
| Top |
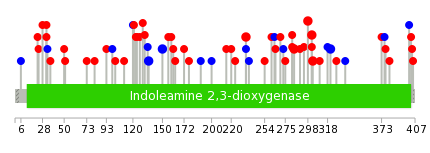
| Stat. for Non-Synonymous SNVs (# total SNVs=39) | (# total SNVs=12) |
 |  |
(# total SNVs=0) | (# total SNVs=0) |
| Top |
| * When you move the cursor on each content, you can see more deailed mutation information on the Tooltip. Those are primary_site,primary_histology,mutation(aa),pubmedID. |
| GRCh37 position | Mutation(aa) | Unique sampleID count |
| chr8:39840263-39840263 | p.T136T | 2 |
| chr8:39872789-39872789 | p.D298N | 2 |
| chr8:39806779-39806779 | p.S32F | 2 |
| chr8:39872801-39872801 | p.P302S | 2 |
| chr8:39845390-39845390 | p.G150G | 2 |
| chr8:39872805-39872805 | p.S303F | 2 |
| chr8:39872860-39872860 | p.I321I | 2 |
| chr8:39862881-39862881 | p.R235W | 2 |
| chr8:39871208-39871208 | p.G282C | 2 |
| chr8:39871214-39871214 | p.R284C | 2 |
| Top |
|
 |
| Point Mutation/ Tissue ID | 1 | 2 | 3 | 4 | 5 | 6 | 7 | 8 | 9 | 10 | 11 | 12 | 13 | 14 | 15 | 16 | 17 | 18 | 19 | 20 |
| # sample | 1 | 2 | 6 | 3 | 4 | 3 | 2 | 15 | 5 | 8 | ||||||||||
| # mutation | 1 | 2 | 6 | 3 | 4 | 4 | 2 | 19 | 5 | 11 | ||||||||||
| nonsynonymous SNV | 1 | 1 | 6 | 3 | 4 | 2 | 2 | 12 | 3 | 6 | ||||||||||
| synonymous SNV | 1 | 2 | 7 | 2 | 5 |
| cf) Tissue ID; Tissue type (1; BLCA[Bladder Urothelial Carcinoma], 2; BRCA[Breast invasive carcinoma], 3; CESC[Cervical squamous cell carcinoma and endocervical adenocarcinoma], 4; COAD[Colon adenocarcinoma], 5; GBM[Glioblastoma multiforme], 6; Glioma Low Grade, 7; HNSC[Head and Neck squamous cell carcinoma], 8; KICH[Kidney Chromophobe], 9; KIRC[Kidney renal clear cell carcinoma], 10; KIRP[Kidney renal papillary cell carcinoma], 11; LAML[Acute Myeloid Leukemia], 12; LUAD[Lung adenocarcinoma], 13; LUSC[Lung squamous cell carcinoma], 14; OV[Ovarian serous cystadenocarcinoma ], 15; PAAD[Pancreatic adenocarcinoma], 16; PRAD[Prostate adenocarcinoma], 17; SKCM[Skin Cutaneous Melanoma], 18:STAD[Stomach adenocarcinoma], 19:THCA[Thyroid carcinoma], 20:UCEC[Uterine Corpus Endometrial Carcinoma]) |
| Top |
| * We represented just top 10 SNVs. When you move the cursor on each content, you can see more deailed mutation information on the Tooltip. Those are primary_site, primary_histology, mutation(aa), pubmedID. |
| Genomic Position | Mutation(aa) | Unique sampleID count |
| chr8:39806779 | p.S45F | 2 |
| chr8:39872789 | p.D311N | 2 |
| chr8:39840263 | p.I334I | 2 |
| chr8:39845390 | p.T149T | 2 |
| chr8:39872860 | p.G295C | 2 |
| chr8:39871208 | p.G163G | 2 |
| chr8:39871214 | p.R297C | 2 |
| chr8:39847333 | p.L41V | 1 |
| chr8:39806766 | p.I169V | 1 |
| chr8:39872778 | p.Y307C | 1 |
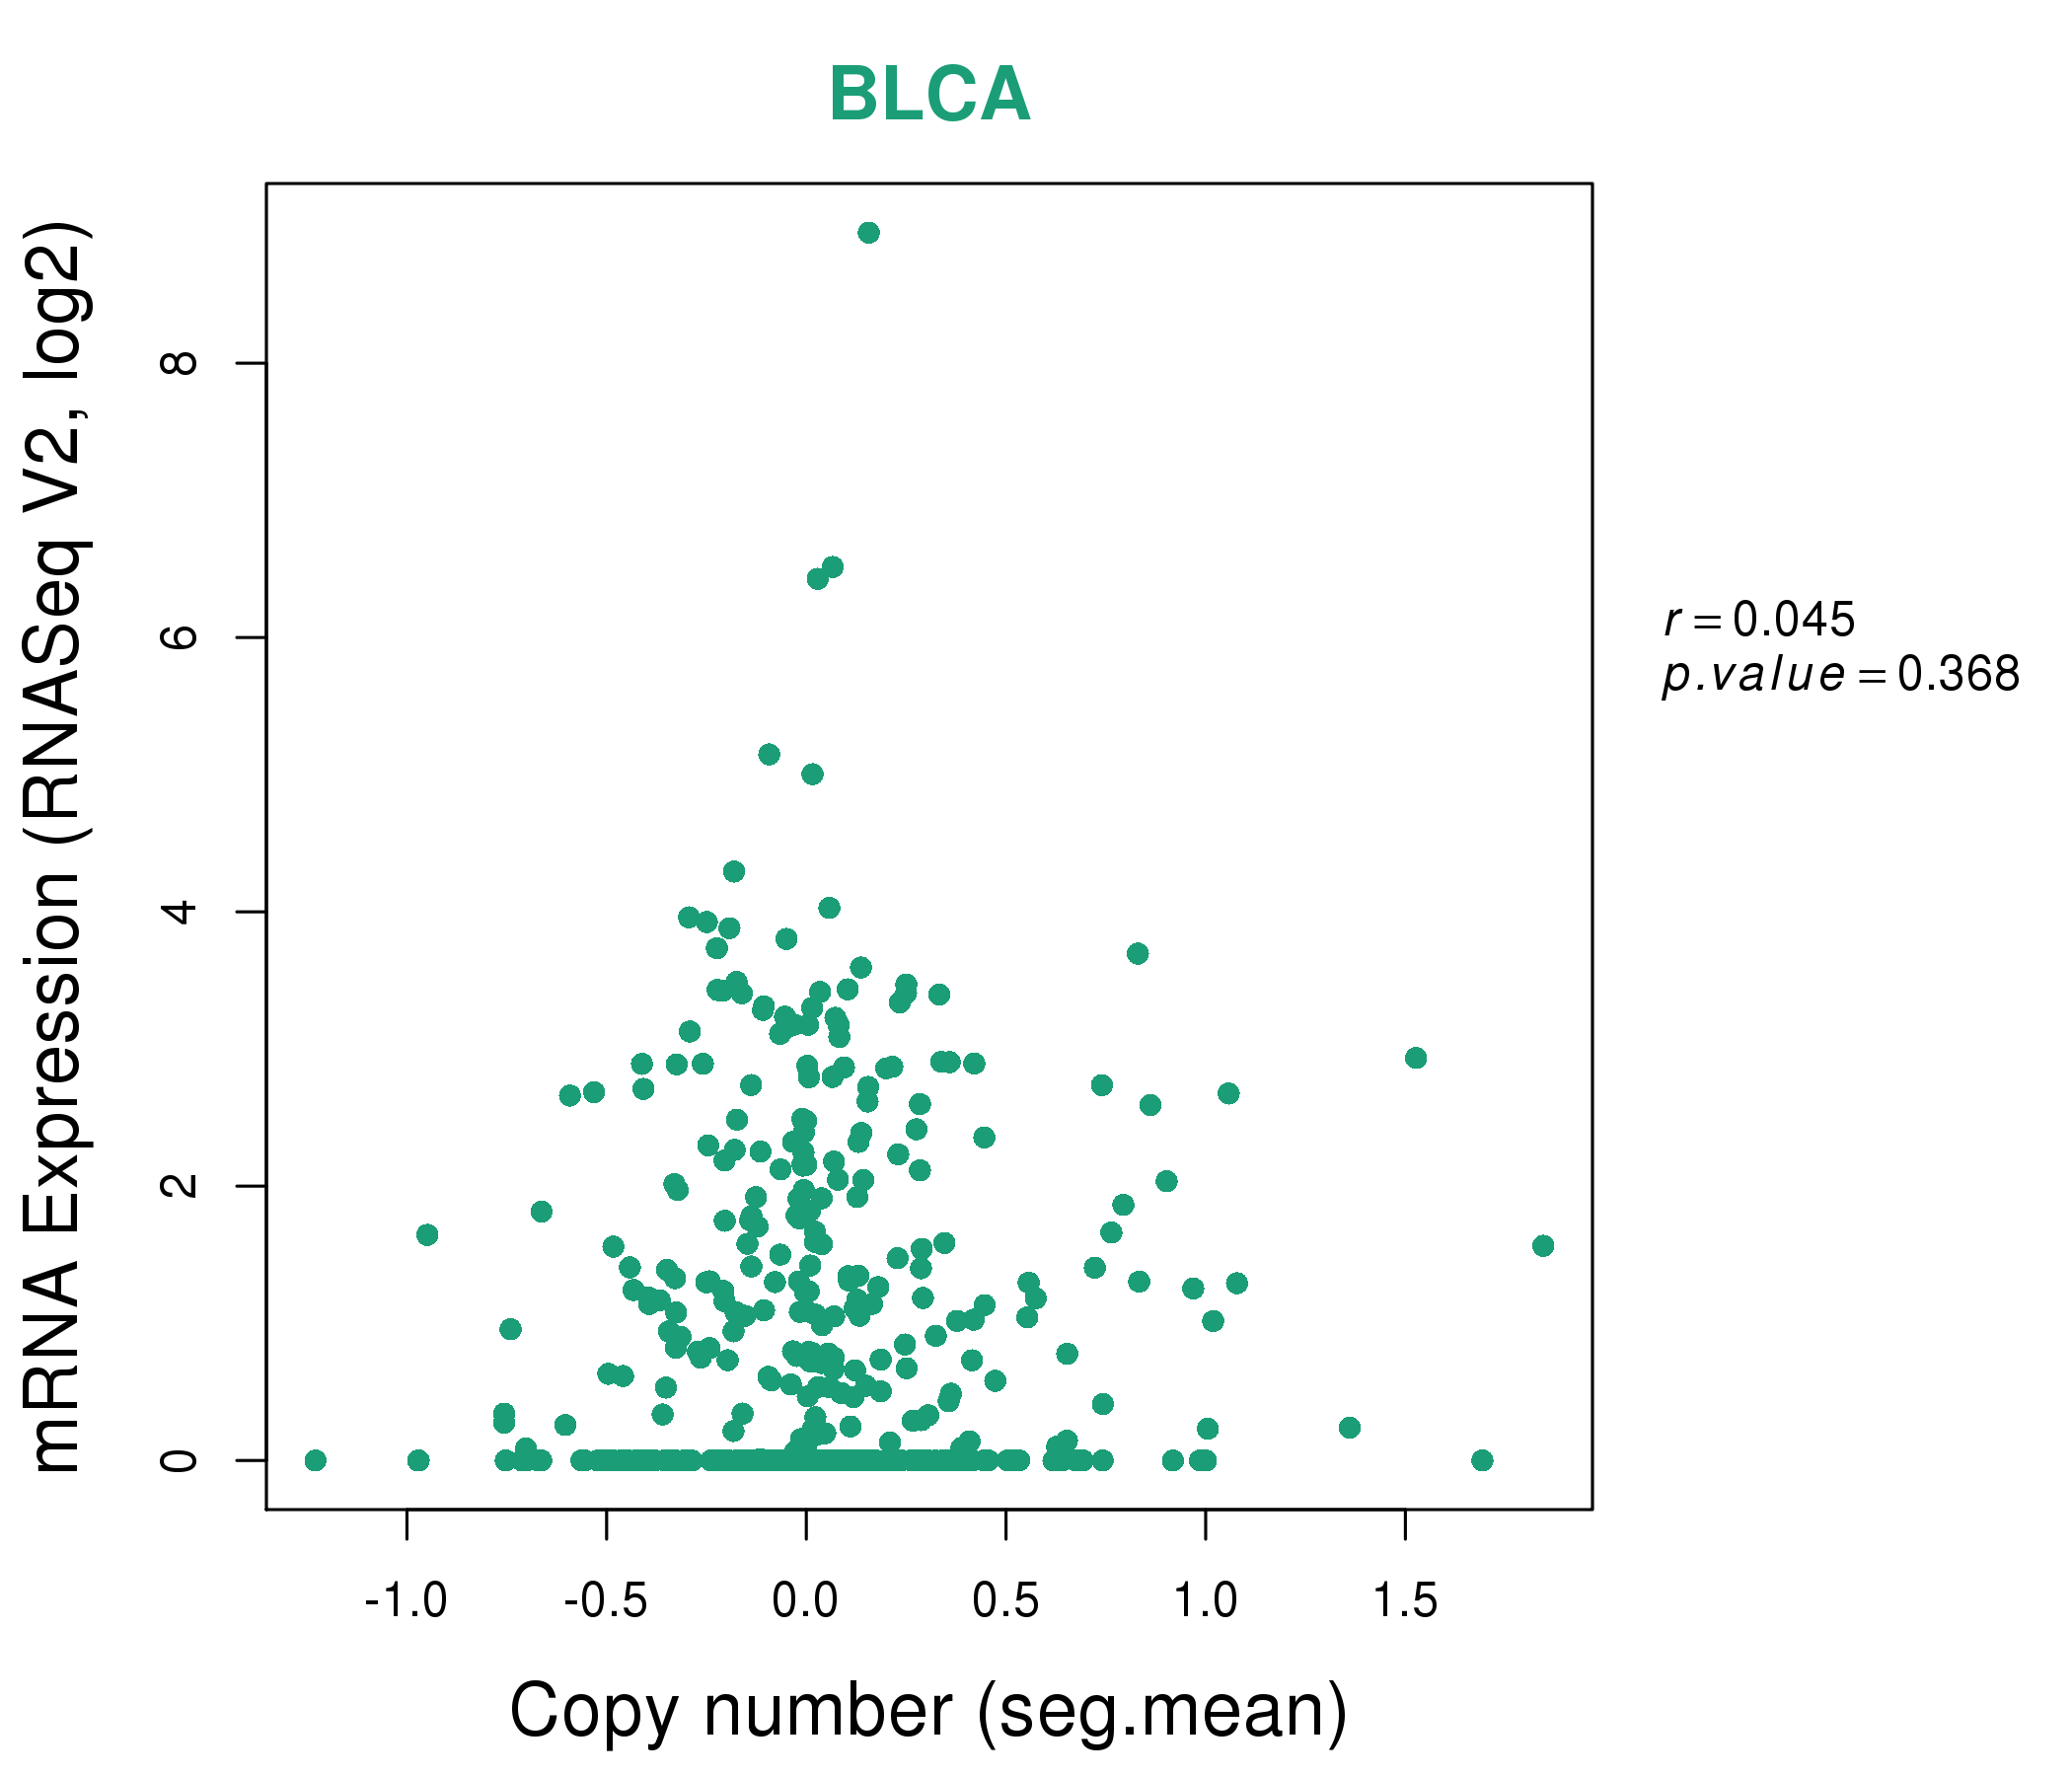
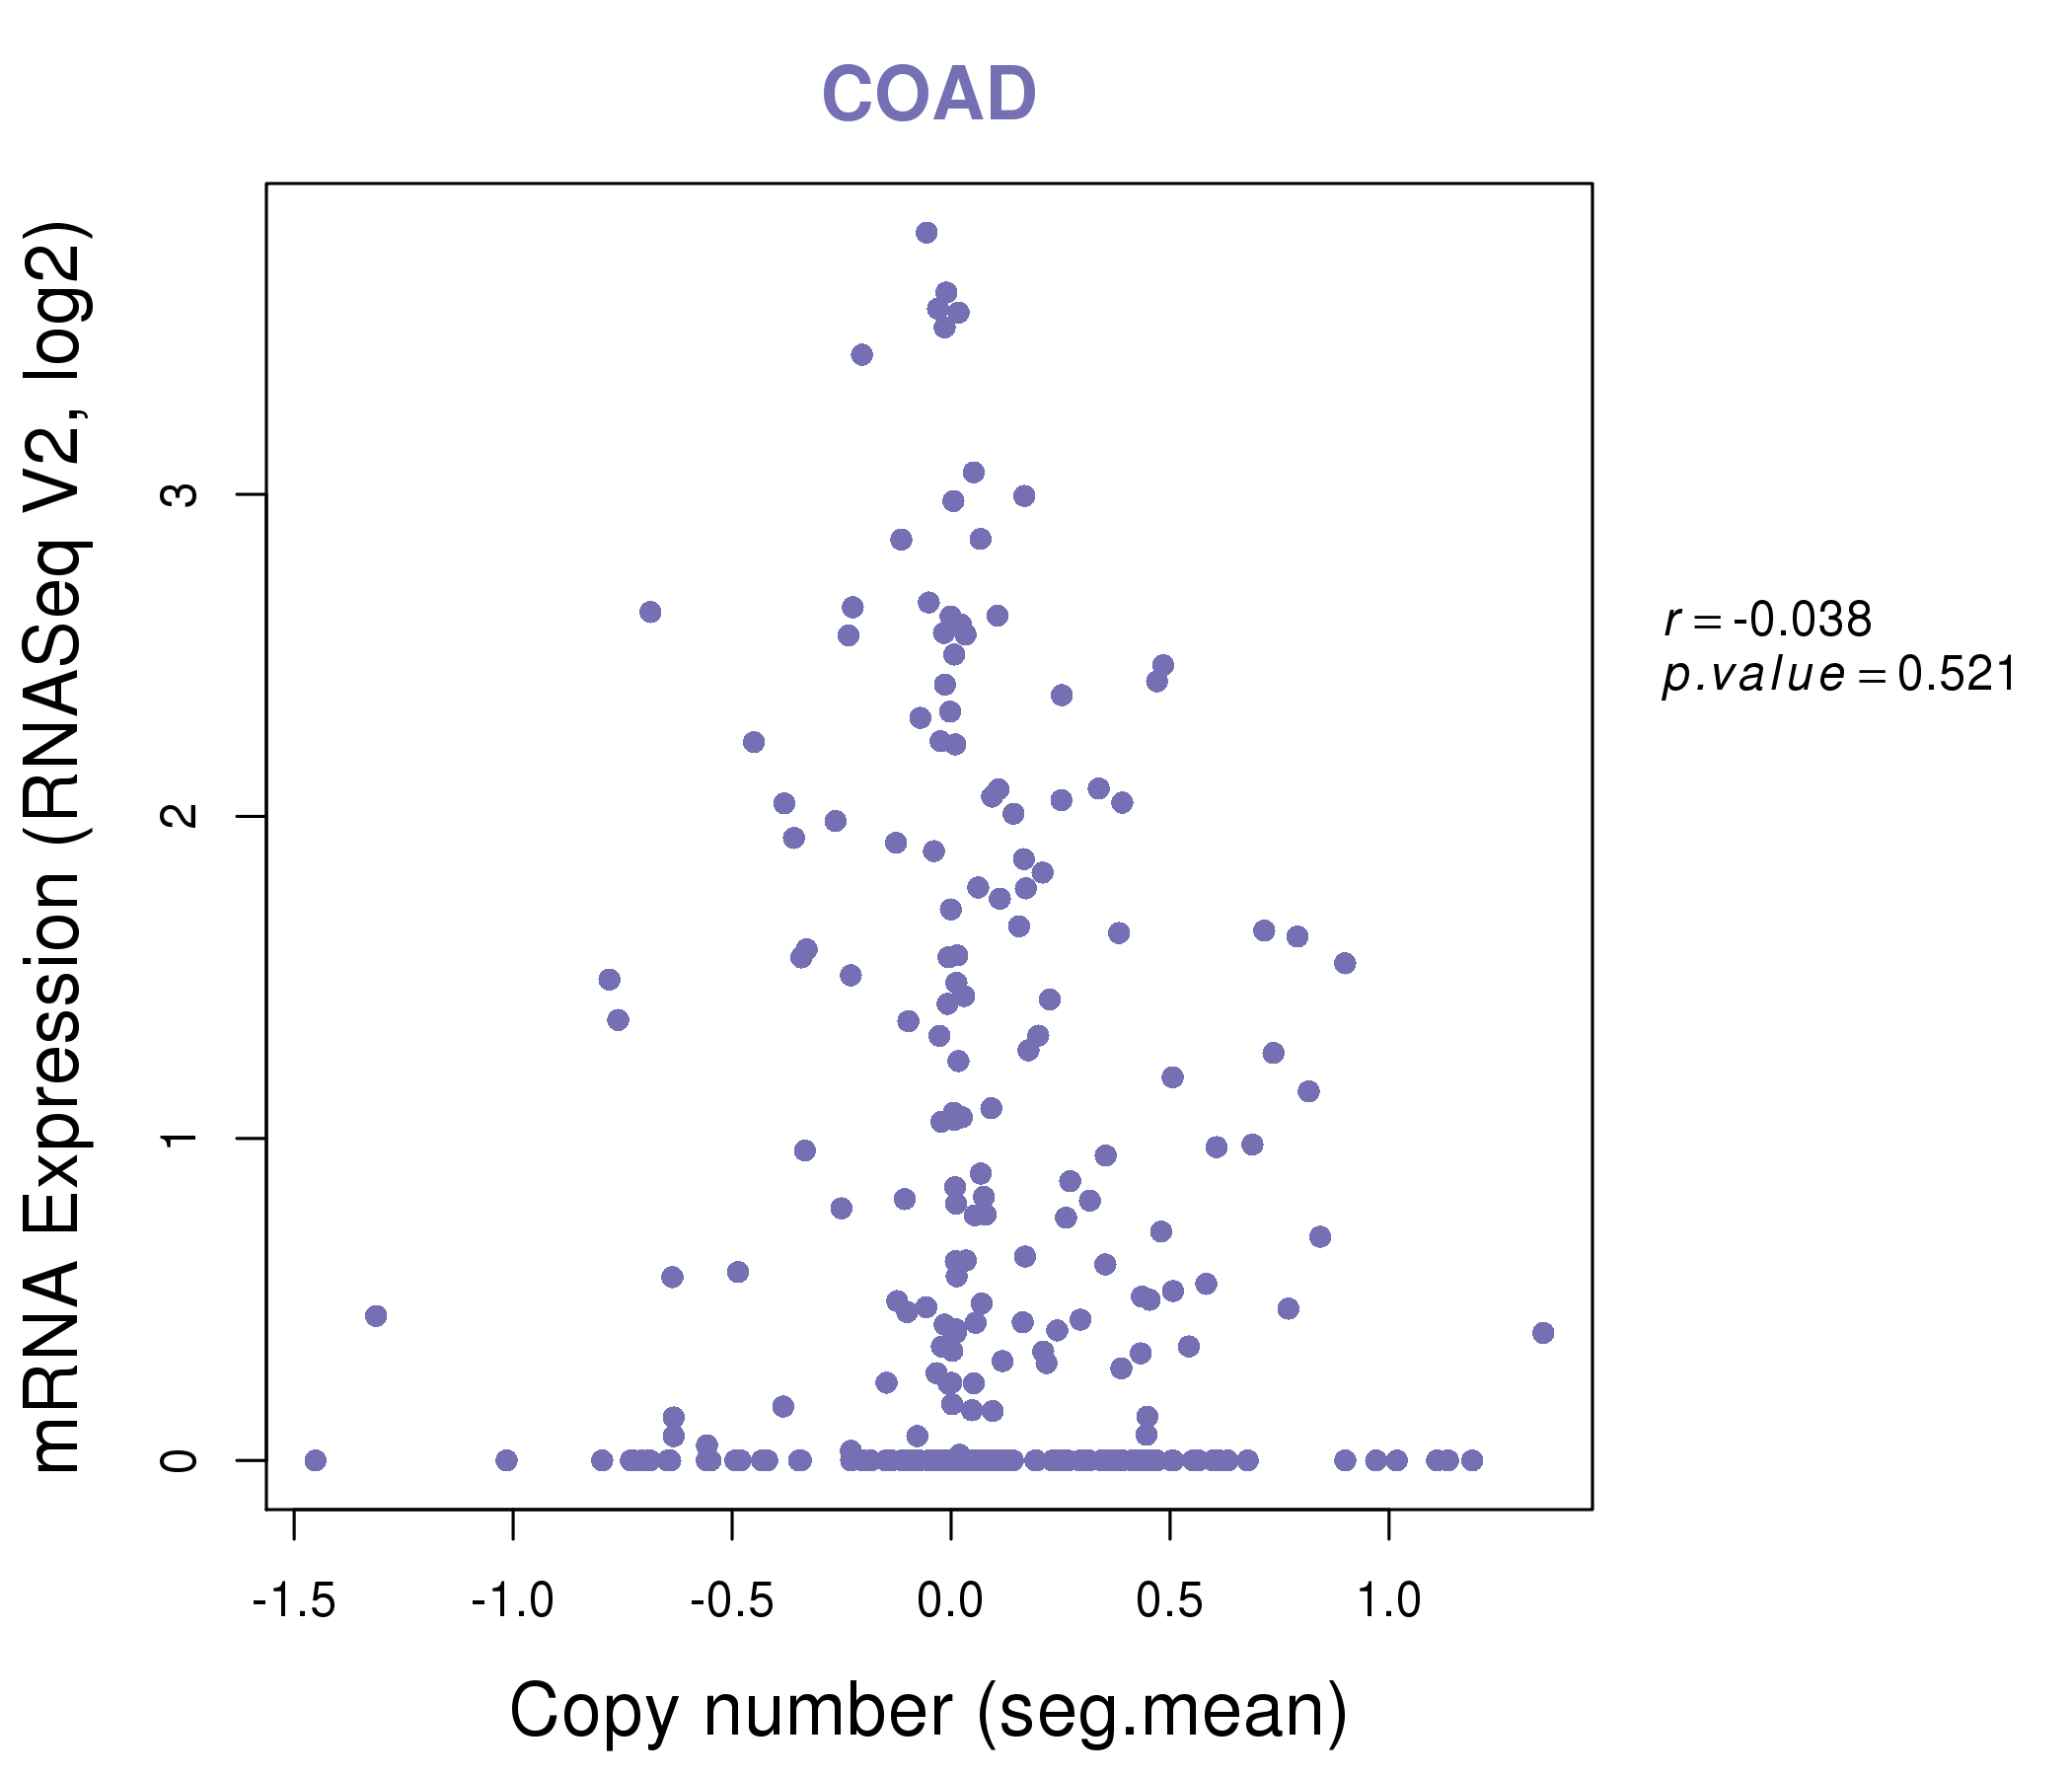
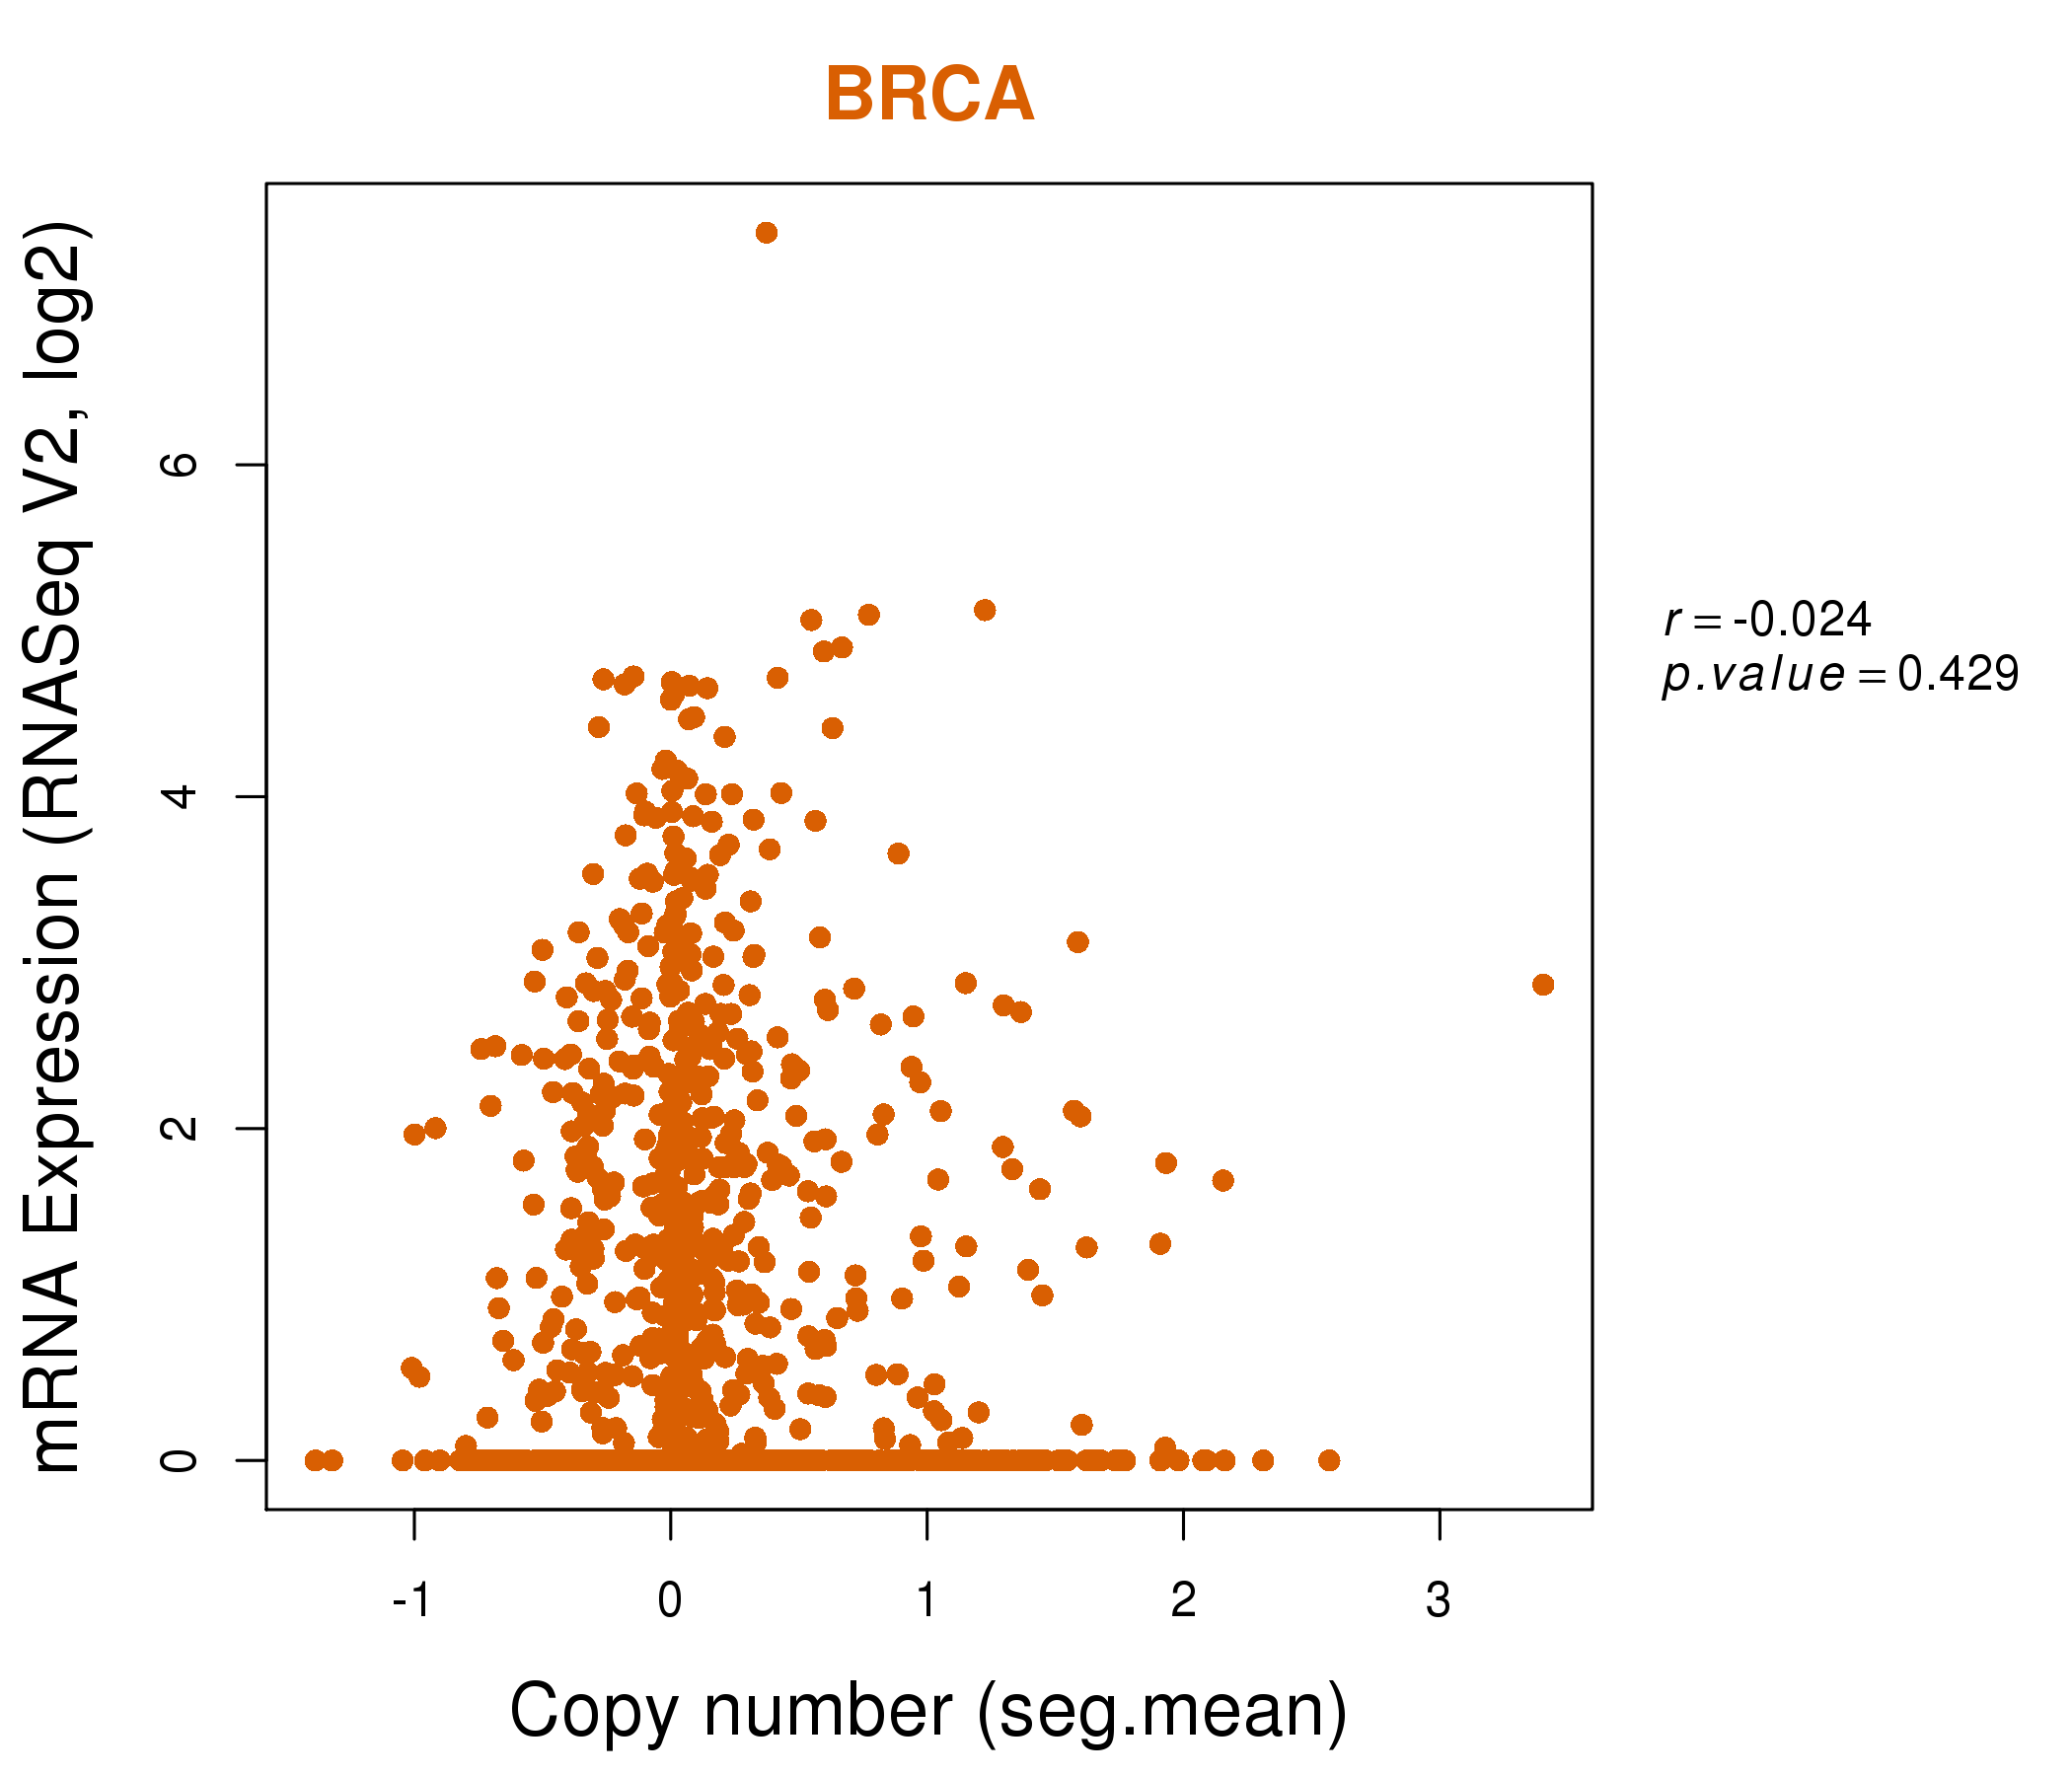
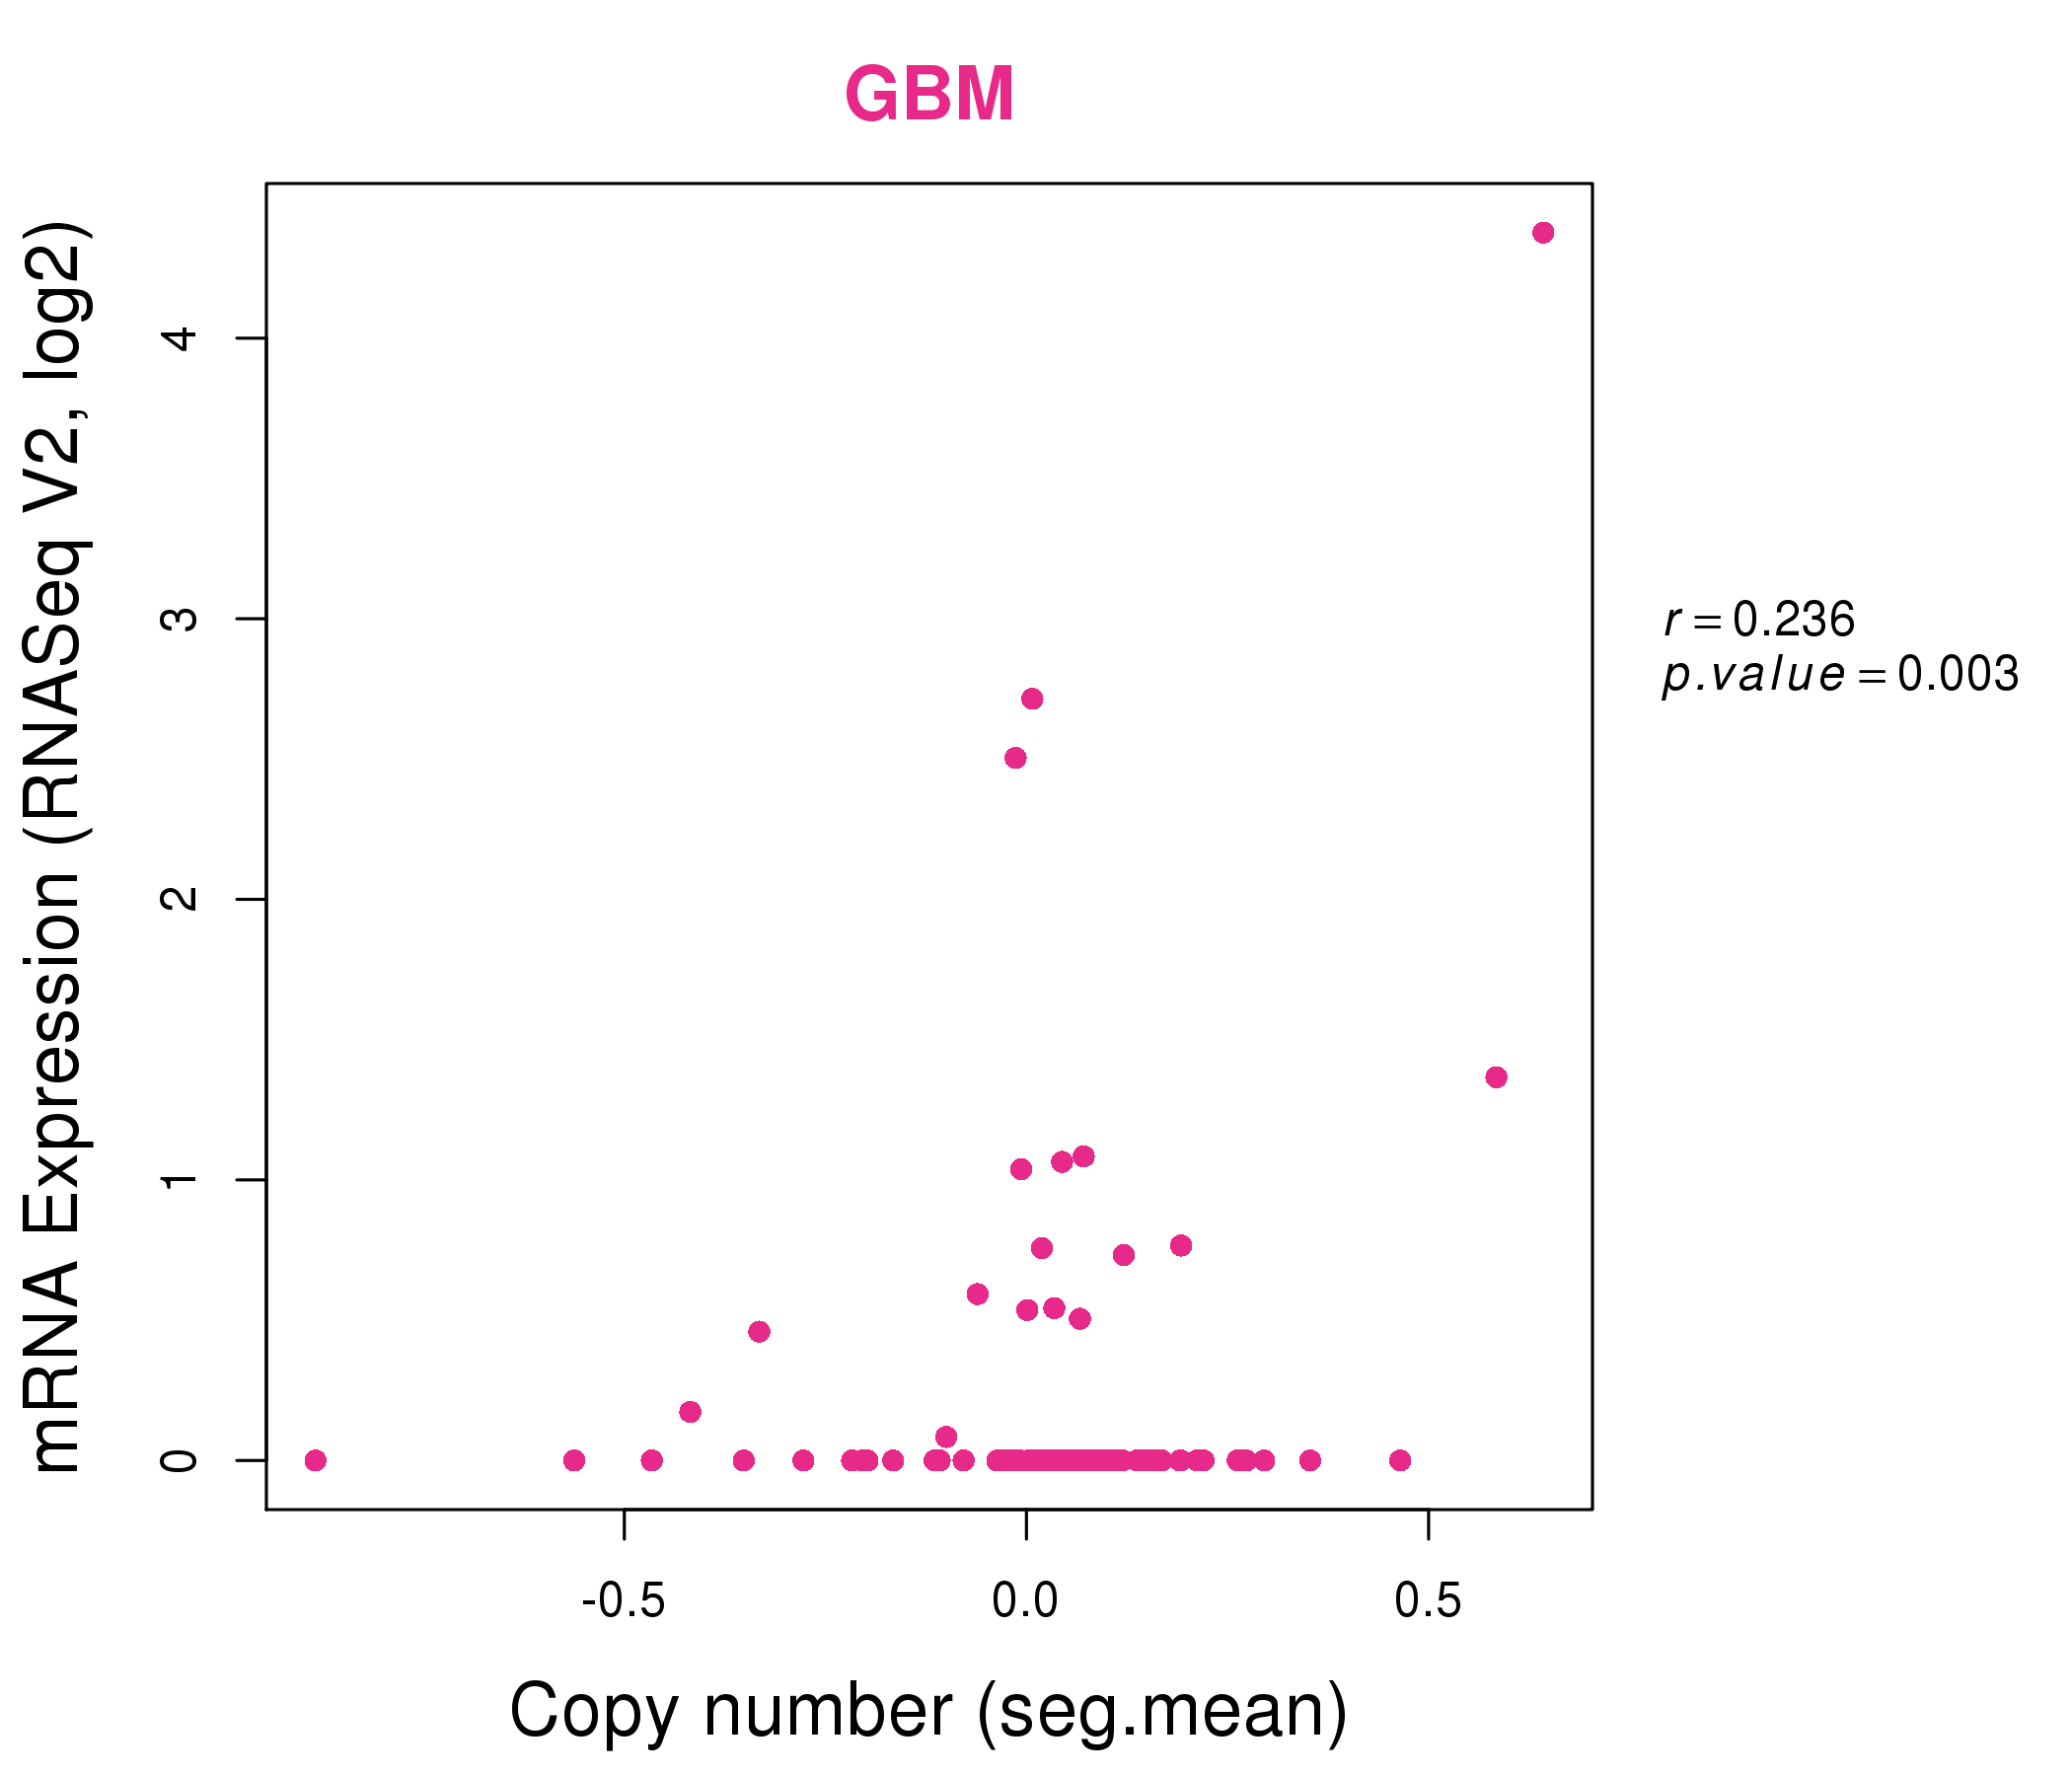
| * Copy number data were extracted from TCGA using R package TCGA-Assembler. The URLs of all public data files on TCGA DCC data server were gathered on Jan-05-2015. Function ProcessCNAData in TCGA-Assembler package was used to obtain gene-level copy number value which is calculated as the average copy number of the genomic region of a gene. |
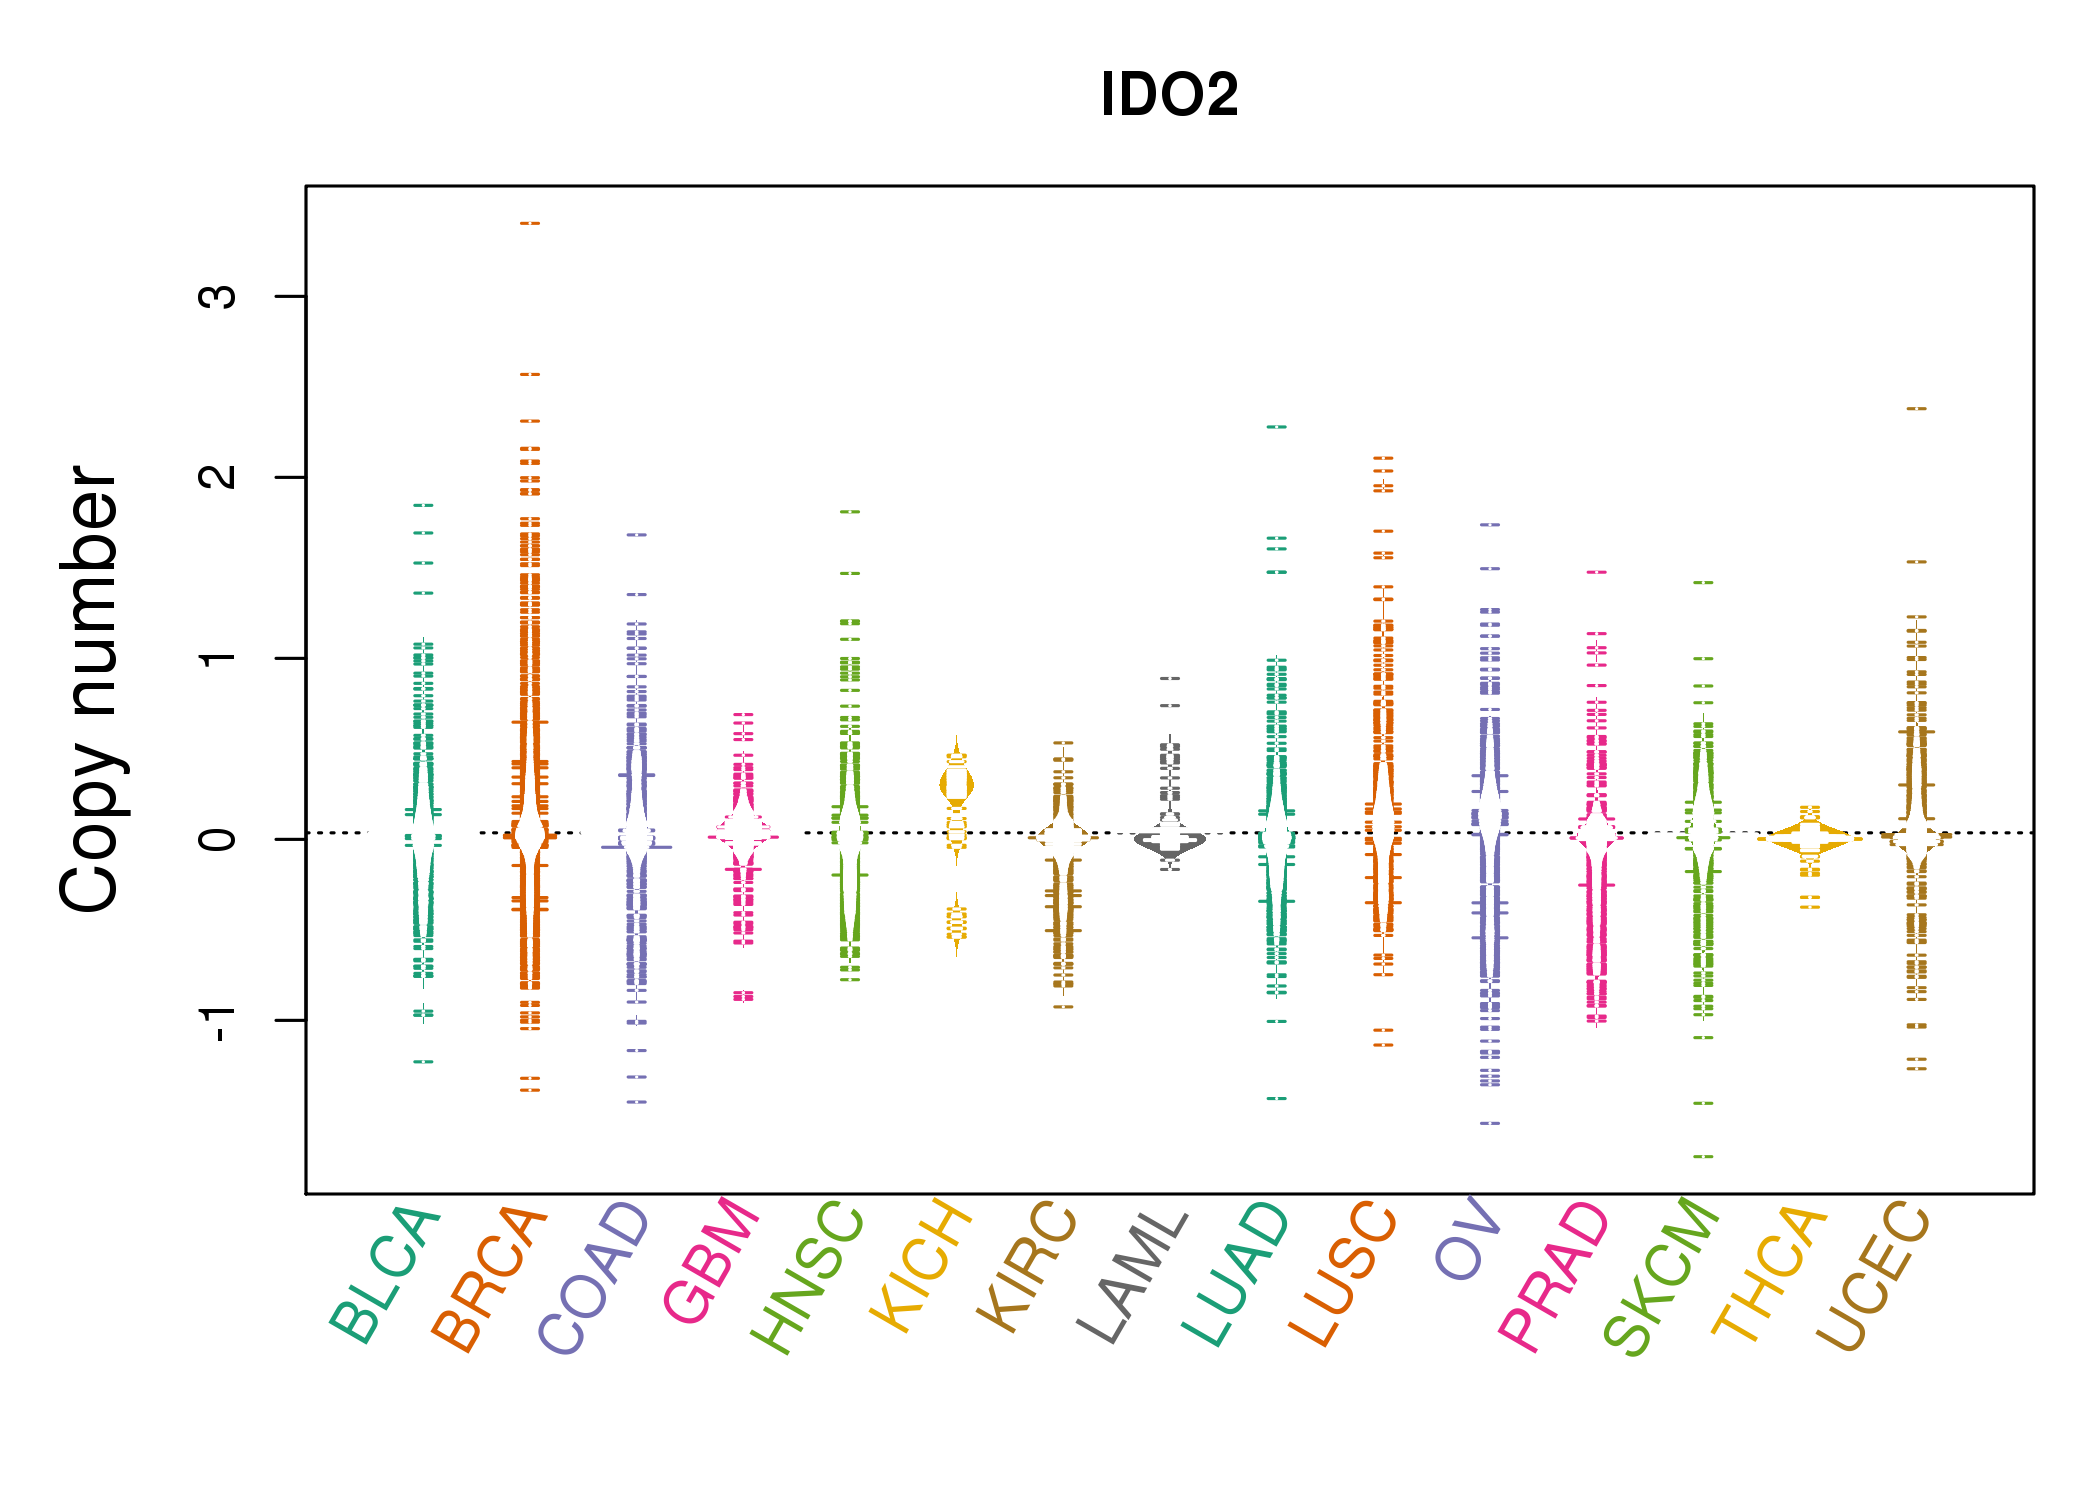 |
| cf) Tissue ID[Tissue type]: BLCA[Bladder Urothelial Carcinoma], BRCA[Breast invasive carcinoma], CESC[Cervical squamous cell carcinoma and endocervical adenocarcinoma], COAD[Colon adenocarcinoma], GBM[Glioblastoma multiforme], Glioma Low Grade, HNSC[Head and Neck squamous cell carcinoma], KICH[Kidney Chromophobe], KIRC[Kidney renal clear cell carcinoma], KIRP[Kidney renal papillary cell carcinoma], LAML[Acute Myeloid Leukemia], LUAD[Lung adenocarcinoma], LUSC[Lung squamous cell carcinoma], OV[Ovarian serous cystadenocarcinoma ], PAAD[Pancreatic adenocarcinoma], PRAD[Prostate adenocarcinoma], SKCM[Skin Cutaneous Melanoma], STAD[Stomach adenocarcinoma], THCA[Thyroid carcinoma], UCEC[Uterine Corpus Endometrial Carcinoma] |
| Top |
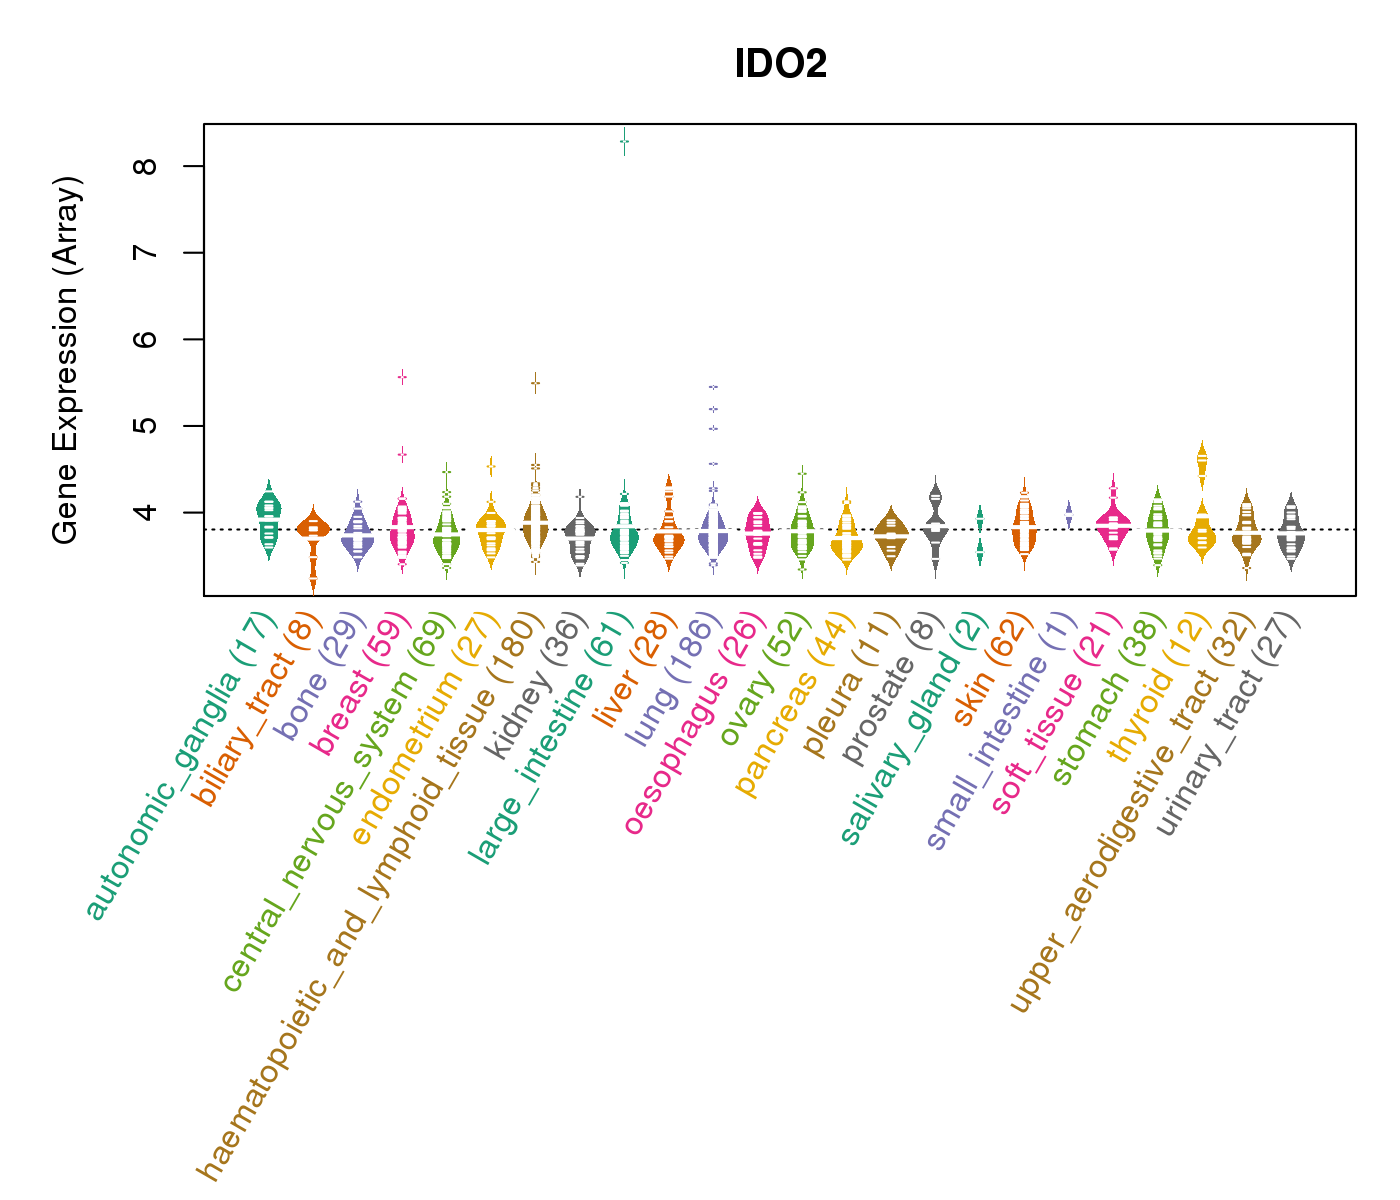
| Gene Expression for IDO2 |
| * CCLE gene expression data were extracted from CCLE_Expression_Entrez_2012-10-18.res: Gene-centric RMA-normalized mRNA expression data. |
 |
| * Normalized gene expression data of RNASeqV2 was extracted from TCGA using R package TCGA-Assembler. The URLs of all public data files on TCGA DCC data server were gathered at Jan-05-2015. Only eight cancer types have enough normal control samples for differential expression analysis. (t test, adjusted p<0.05 (using Benjamini-Hochberg FDR)) |
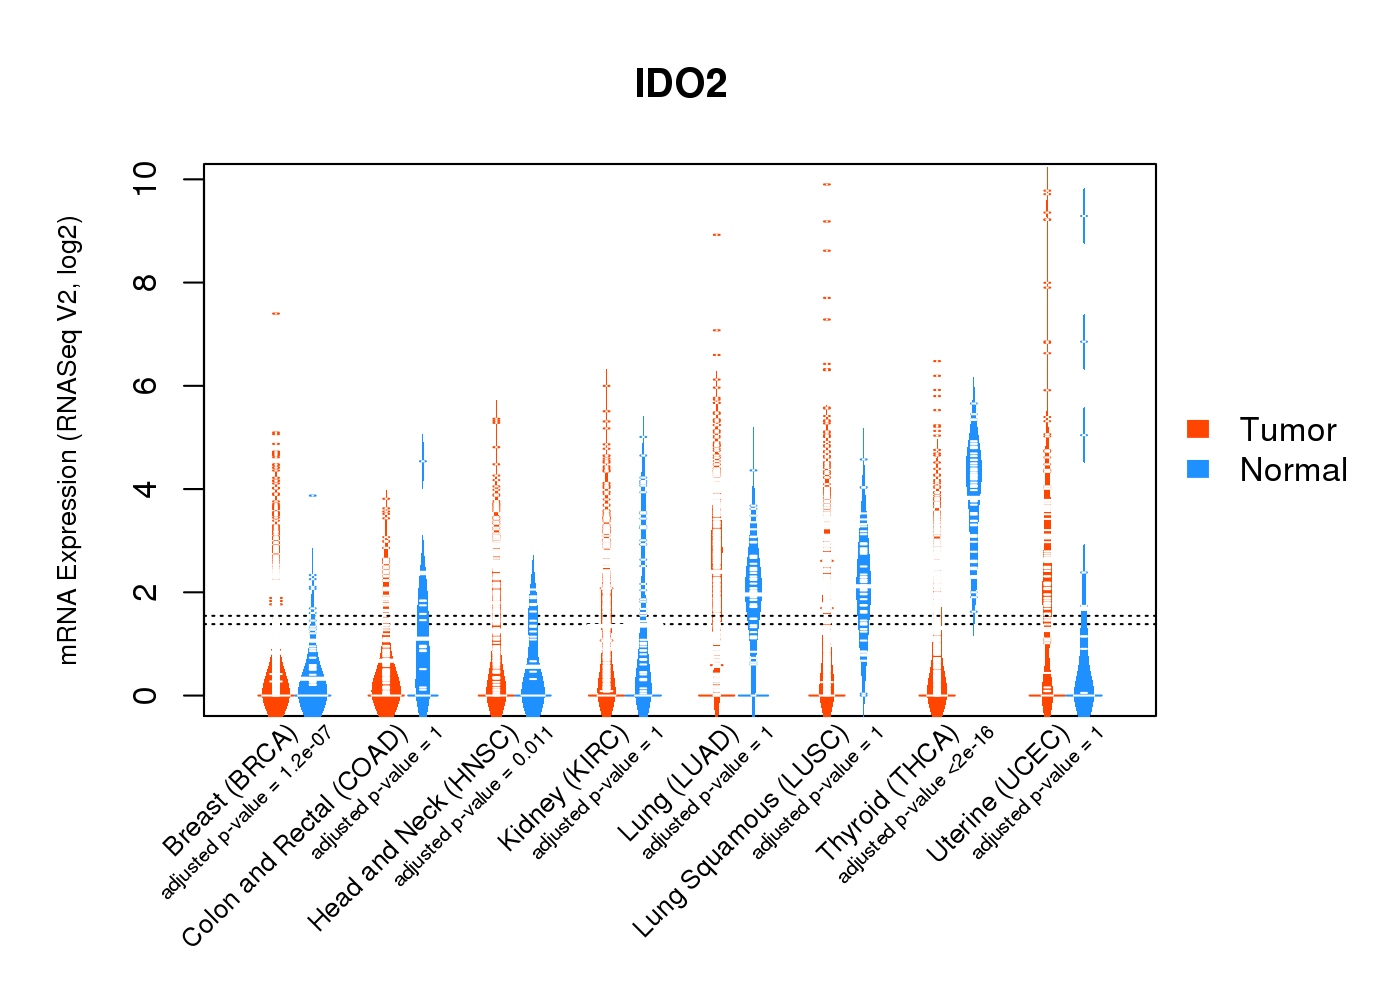 |
| Top |
| * This plots show the correlation between CNV and gene expression. |
: Open all plots for all cancer types
 |
|
 |
|
| Top |
| Gene-Gene Network Information |
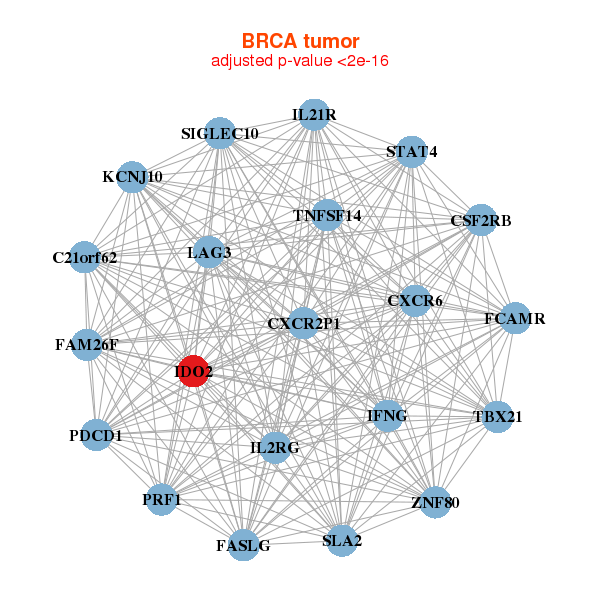
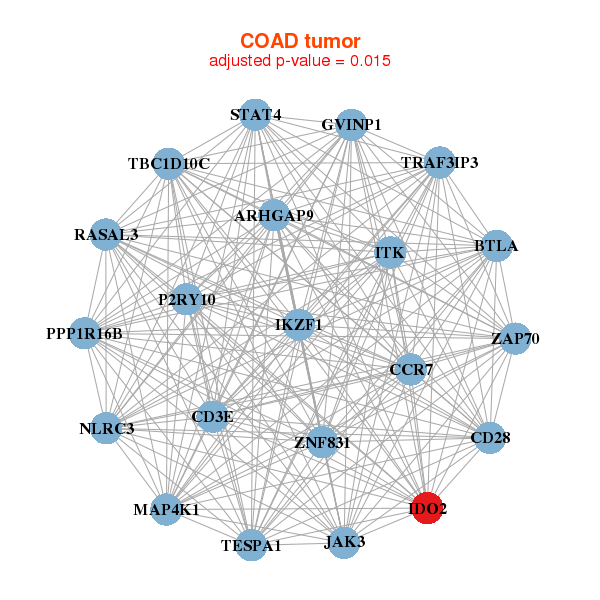
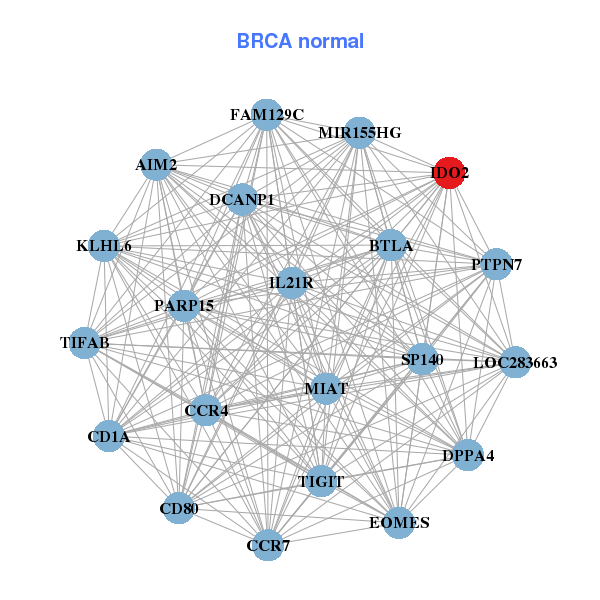
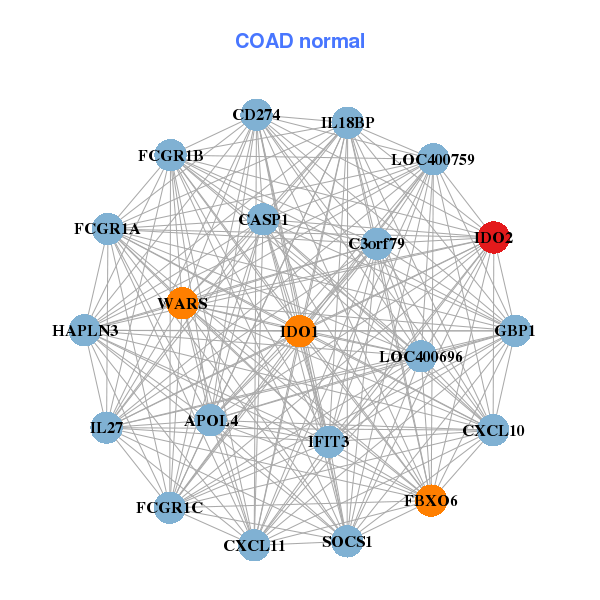
| * Co-Expression network figures were drawn using R package igraph. Only the top 20 genes with the highest correlations were shown. Red circle: input gene, orange circle: cell metabolism gene, sky circle: other gene |
: Open all plots for all cancer types
 |
|
| C21orf62,CSF2RB,CXCR2P1,CXCR6,FAM26F,FASLG,FCAMR, IDO2,IFNG,IL21R,IL2RG,KCNJ10,LAG3,PDCD1, PRF1,SIGLEC10,SLA2,STAT4,TBX21,TNFSF14,ZNF80 | AIM2,BTLA,DCANP1,CCR4,CCR7,CD1A,CD80, DPPA4,EOMES,FAM129C,IDO2,IL21R,KLHL6,LOC283663, MIAT,MIR155HG,PARP15,PTPN7,SP140,TIFAB,TIGIT |
 |
|
| ARHGAP9,BTLA,CCR7,CD28,CD3E,GVINP1,IDO2, IKZF1,ITK,JAK3,TESPA1,MAP4K1,NLRC3,P2RY10, PPP1R16B,RASAL3,STAT4,TBC1D10C,TRAF3IP3,ZAP70,ZNF831 | APOL4,C3orf79,CASP1,CD274,CXCL10,CXCL11,FBXO6, FCGR1A,FCGR1B,FCGR1C,GBP1,HAPLN3,IDO1,IDO2, IFIT3,IL18BP,IL27,LOC400696,LOC400759,SOCS1,WARS |
| * Co-Expression network figures were drawn using R package igraph. Only the top 20 genes with the highest correlations were shown. Red circle: input gene, orange circle: cell metabolism gene, sky circle: other gene |
: Open all plots for all cancer types
| Top |
: Open all interacting genes' information including KEGG pathway for all interacting genes from DAVID
| Top |
| Pharmacological Information for IDO2 |
| There's no related Drug. |
| Top |
| Cross referenced IDs for IDO2 |
| * We obtained these cross-references from Uniprot database. It covers 150 different DBs, 18 categories. http://www.uniprot.org/help/cross_references_section |
: Open all cross reference information
|
Copyright © 2016-Present - The Univsersity of Texas Health Science Center at Houston @ |