|
|||||||||||||||||||||||||||||||||||||||||||||||||||||||||||||||||||||||||||||||||||||||||||||||||||||||||||||||||||||||||||||||||||||||||||||||||||||||||||||||||||||||||||||||||||||||||||||||||||||||||||||||||||||||||||||||||||||||||||||||||||||||||||||||||||||||||||||||||||||||||||||||||||||||||||||||||||||||||||||||||||||||||||||
| |
| Phenotypic Information (metabolism pathway, cancer, disease, phenome) |
| |
| |
| Gene-Gene Network Information: Co-Expression Network, Interacting Genes & KEGG |
| |
|


| Gene Summary for DHCR7 |
| Top |
| Phenotypic Information for DHCR7(metabolism pathway, cancer, disease, phenome) |
| Cancer | CGAP: DHCR7 |
| Familial Cancer Database: DHCR7 | |
| * This gene is included in those cancer gene databases. |
|
|
|
|
|
| . | |||||||||||||||||||||||||||||||||||||||||||||||||||||||||||||||||||||||||||||||||||||||||||||||||||||||||||||||||||||||||||||||||||||||||||||||||||||||||||||||||||||||||||||||||||||||||||||||||||||||||||||||||||||||||||||||||||||||||||||||||||||||||||||||||||||||||||||||||||||||||||||||||||||||||||||||||||||||||||||||||||||||
Oncogene 1 | Significant driver gene in | ||||||||||||||||||||||||||||||||||||||||||||||||||||||||||||||||||||||||||||||||||||||||||||||||||||||||||||||||||||||||||||||||||||||||||||||||||||||||||||||||||||||||||||||||||||||||||||||||||||||||||||||||||||||||||||||||||||||||||||||||||||||||||||||||||||||||||||||||||||||||||||||||||||||||||||||||||||||||||||||||||||||||||||
| cf) number; DB name 1 Oncogene; http://nar.oxfordjournals.org/content/35/suppl_1/D721.long, 2 Tumor Suppressor gene; https://bioinfo.uth.edu/TSGene/, 3 Cancer Gene Census; http://www.nature.com/nrc/journal/v4/n3/abs/nrc1299.html, 4 CancerGenes; http://nar.oxfordjournals.org/content/35/suppl_1/D721.long, 5 Network of Cancer Gene; http://ncg.kcl.ac.uk/index.php, 1Therapeutic Vulnerabilities in Cancer; http://cbio.mskcc.org/cancergenomics/statius/ |
| REACTOME_METABOLISM_OF_LIPIDS_AND_LIPOPROTEINS | |
| OMIM | |
| Orphanet | |
| Disease | KEGG Disease: DHCR7 |
| MedGen: DHCR7 (Human Medical Genetics with Condition) | |
| ClinVar: DHCR7 | |
| Phenotype | MGI: DHCR7 (International Mouse Phenotyping Consortium) |
| PhenomicDB: DHCR7 | |
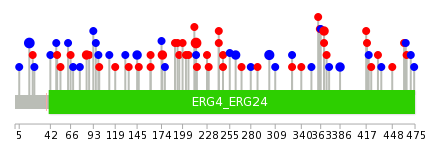
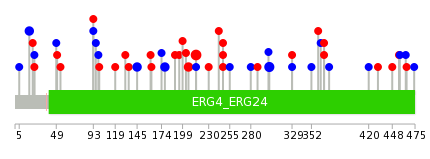
| Mutations for DHCR7 |
| * Under tables are showing count per each tissue to give us broad intuition about tissue specific mutation patterns.You can go to the detailed page for each mutation database's web site. |
| There's no structural variation information in COSMIC data for this gene. |
| * From mRNA Sanger sequences, Chitars2.0 arranged chimeric transcripts. This table shows DHCR7 related fusion information. |
| ID | Head Gene | Tail Gene | Accession | Gene_a | qStart_a | qEnd_a | Chromosome_a | tStart_a | tEnd_a | Gene_a | qStart_a | qEnd_a | Chromosome_a | tStart_a | tEnd_a |
| BI038607 | DENND4B | 26 | 294 | 1 | 153915197 | 153915466 | DHCR7 | 289 | 372 | 11 | 71146005 | 71146088 | |
| CR741097 | DHCR7 | 66 | 101 | 11 | 71145840 | 71145875 | DHCR7 | 95 | 178 | 11 | 71145769 | 71145852 | |
| Top |
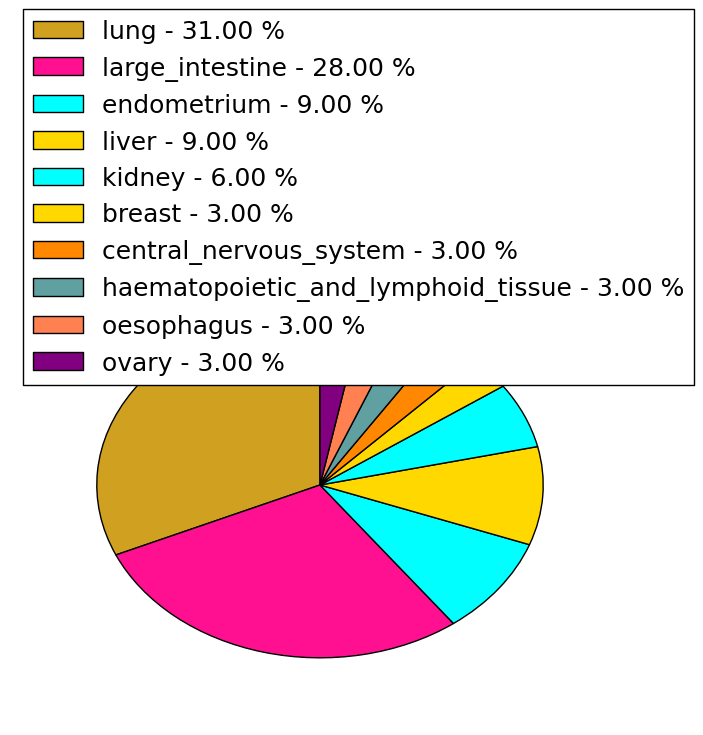
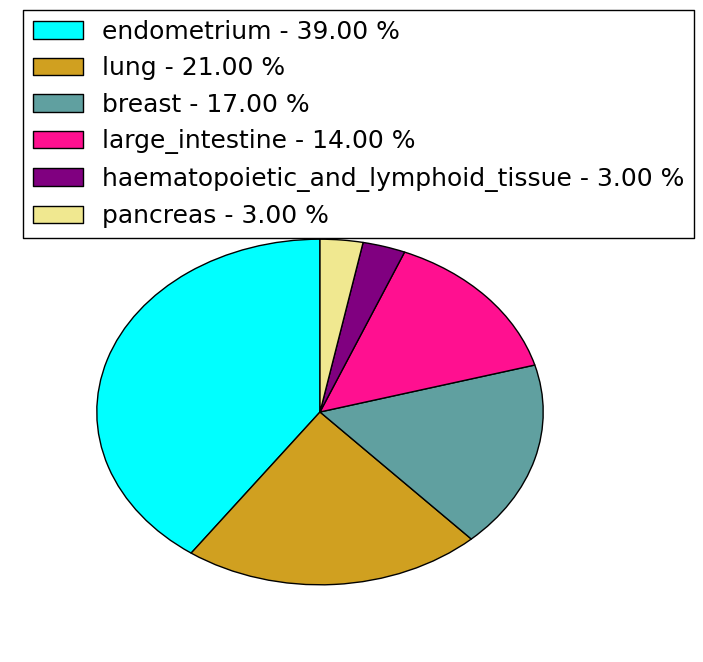
| Mutation type/ Tissue ID | brca | cns | cerv | endome | haematopo | kidn | Lintest | liver | lung | ns | ovary | pancre | prost | skin | stoma | thyro | urina | |||
| Total # sample | 1 | |||||||||||||||||||
| GAIN (# sample) | 1 | |||||||||||||||||||
| LOSS (# sample) |
| cf) Tissue ID; Tissue type (1; Breast, 2; Central_nervous_system, 3; Cervix, 4; Endometrium, 5; Haematopoietic_and_lymphoid_tissue, 6; Kidney, 7; Large_intestine, 8; Liver, 9; Lung, 10; NS, 11; Ovary, 12; Pancreas, 13; Prostate, 14; Skin, 15; Stomach, 16; Thyroid, 17; Urinary_tract) |
| Top |
|
 |
| Top |
| Stat. for Non-Synonymous SNVs (# total SNVs=32) | (# total SNVs=28) |
 |  |
(# total SNVs=0) | (# total SNVs=0) |
| Top |
| * When you move the cursor on each content, you can see more deailed mutation information on the Tooltip. Those are primary_site,primary_histology,mutation(aa),pubmedID. |
| GRCh37 position | Mutation(aa) | Unique sampleID count |
| chr11:71150111-71150111 | p.F215L | 5 |
| chr11:71155948-71155948 | p.G17G | 4 |
| chr11:71148915-71148915 | p.F302F | 3 |
| chr11:71155106-71155106 | p.I85S | 2 |
| chr11:71150017-71150017 | p.A247T | 2 |
| chr11:71146691-71146691 | p.D386D | 2 |
| chr11:71152376-71152376 | p.D175Y | 2 |
| chr11:71146749-71146749 | p.R367H | 2 |
| chr11:71152418-71152418 | p.N161H | 2 |
| chr11:71152464-71152464 | p.I145I | 2 |
| Top |
|
 |
| Point Mutation/ Tissue ID | 1 | 2 | 3 | 4 | 5 | 6 | 7 | 8 | 9 | 10 | 11 | 12 | 13 | 14 | 15 | 16 | 17 | 18 | 19 | 20 |
| # sample | 1 | 2 | 6 | 1 | 2 | 2 | 6 | 4 | 1 | 15 | 4 | 10 | ||||||||
| # mutation | 1 | 2 | 6 | 1 | 2 | 2 | 5 | 5 | 1 | 16 | 4 | 10 | ||||||||
| nonsynonymous SNV | 4 | 1 | 1 | 2 | 3 | 3 | 1 | 10 | 3 | 2 | ||||||||||
| synonymous SNV | 1 | 2 | 2 | 1 | 2 | 2 | 6 | 1 | 8 |
| cf) Tissue ID; Tissue type (1; BLCA[Bladder Urothelial Carcinoma], 2; BRCA[Breast invasive carcinoma], 3; CESC[Cervical squamous cell carcinoma and endocervical adenocarcinoma], 4; COAD[Colon adenocarcinoma], 5; GBM[Glioblastoma multiforme], 6; Glioma Low Grade, 7; HNSC[Head and Neck squamous cell carcinoma], 8; KICH[Kidney Chromophobe], 9; KIRC[Kidney renal clear cell carcinoma], 10; KIRP[Kidney renal papillary cell carcinoma], 11; LAML[Acute Myeloid Leukemia], 12; LUAD[Lung adenocarcinoma], 13; LUSC[Lung squamous cell carcinoma], 14; OV[Ovarian serous cystadenocarcinoma ], 15; PAAD[Pancreatic adenocarcinoma], 16; PRAD[Prostate adenocarcinoma], 17; SKCM[Skin Cutaneous Melanoma], 18:STAD[Stomach adenocarcinoma], 19:THCA[Thyroid carcinoma], 20:UCEC[Uterine Corpus Endometrial Carcinoma]) |
| Top |
| * We represented just top 10 SNVs. When you move the cursor on each content, you can see more deailed mutation information on the Tooltip. Those are primary_site, primary_histology, mutation(aa), pubmedID. |
| Genomic Position | Mutation(aa) | Unique sampleID count |
| chr11:71150111 | p.F215L,DHCR7 | 5 |
| chr11:71150017 | p.F302F,DHCR7 | 3 |
| chr11:71148915 | p.A247P,DHCR7 | 3 |
| chr11:71152365 | p.I178I,DHCR7 | 2 |
| chr11:71152464 | p.G17G,DHCR7 | 2 |
| chr11:71152283 | p.I145I,DHCR7 | 2 |
| chr11:71155948 | p.A206T,DHCR7 | 2 |
| chr11:71155072 | p.G199C,DHCR7 | 1 |
| chr11:71146730 | p.V54I,DHCR7 | 1 |
| chr11:71148981 | p.R363R,DHCR7 | 1 |
| * Copy number data were extracted from TCGA using R package TCGA-Assembler. The URLs of all public data files on TCGA DCC data server were gathered on Jan-05-2015. Function ProcessCNAData in TCGA-Assembler package was used to obtain gene-level copy number value which is calculated as the average copy number of the genomic region of a gene. |
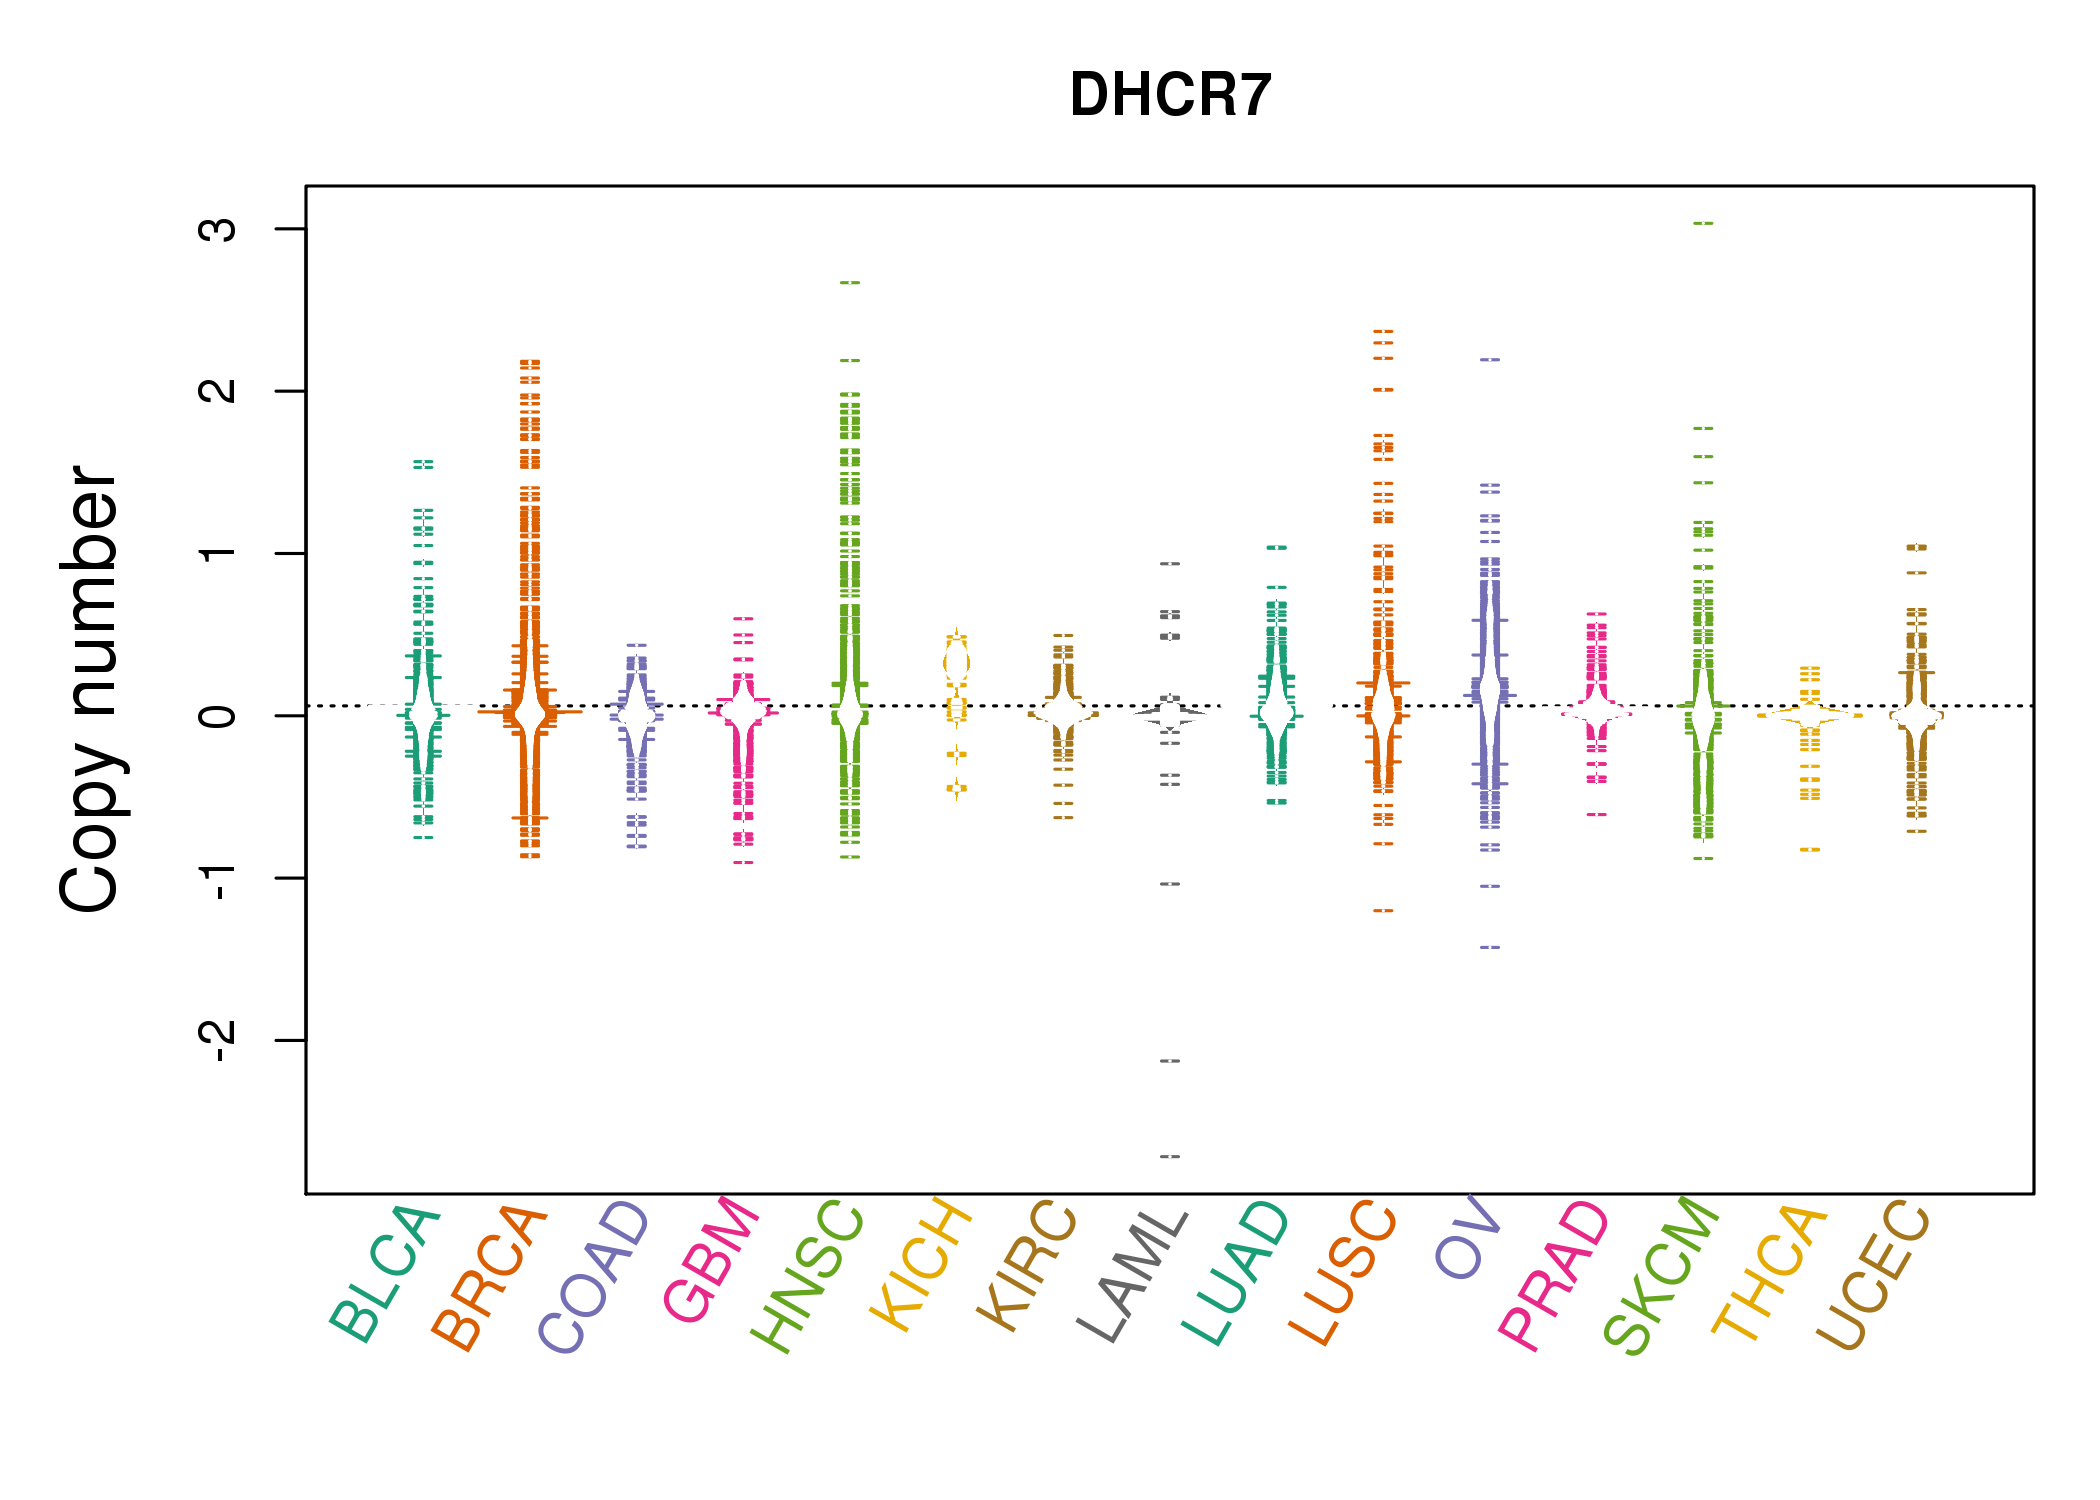 |
| cf) Tissue ID[Tissue type]: BLCA[Bladder Urothelial Carcinoma], BRCA[Breast invasive carcinoma], CESC[Cervical squamous cell carcinoma and endocervical adenocarcinoma], COAD[Colon adenocarcinoma], GBM[Glioblastoma multiforme], Glioma Low Grade, HNSC[Head and Neck squamous cell carcinoma], KICH[Kidney Chromophobe], KIRC[Kidney renal clear cell carcinoma], KIRP[Kidney renal papillary cell carcinoma], LAML[Acute Myeloid Leukemia], LUAD[Lung adenocarcinoma], LUSC[Lung squamous cell carcinoma], OV[Ovarian serous cystadenocarcinoma ], PAAD[Pancreatic adenocarcinoma], PRAD[Prostate adenocarcinoma], SKCM[Skin Cutaneous Melanoma], STAD[Stomach adenocarcinoma], THCA[Thyroid carcinoma], UCEC[Uterine Corpus Endometrial Carcinoma] |
| Top |
| Gene Expression for DHCR7 |
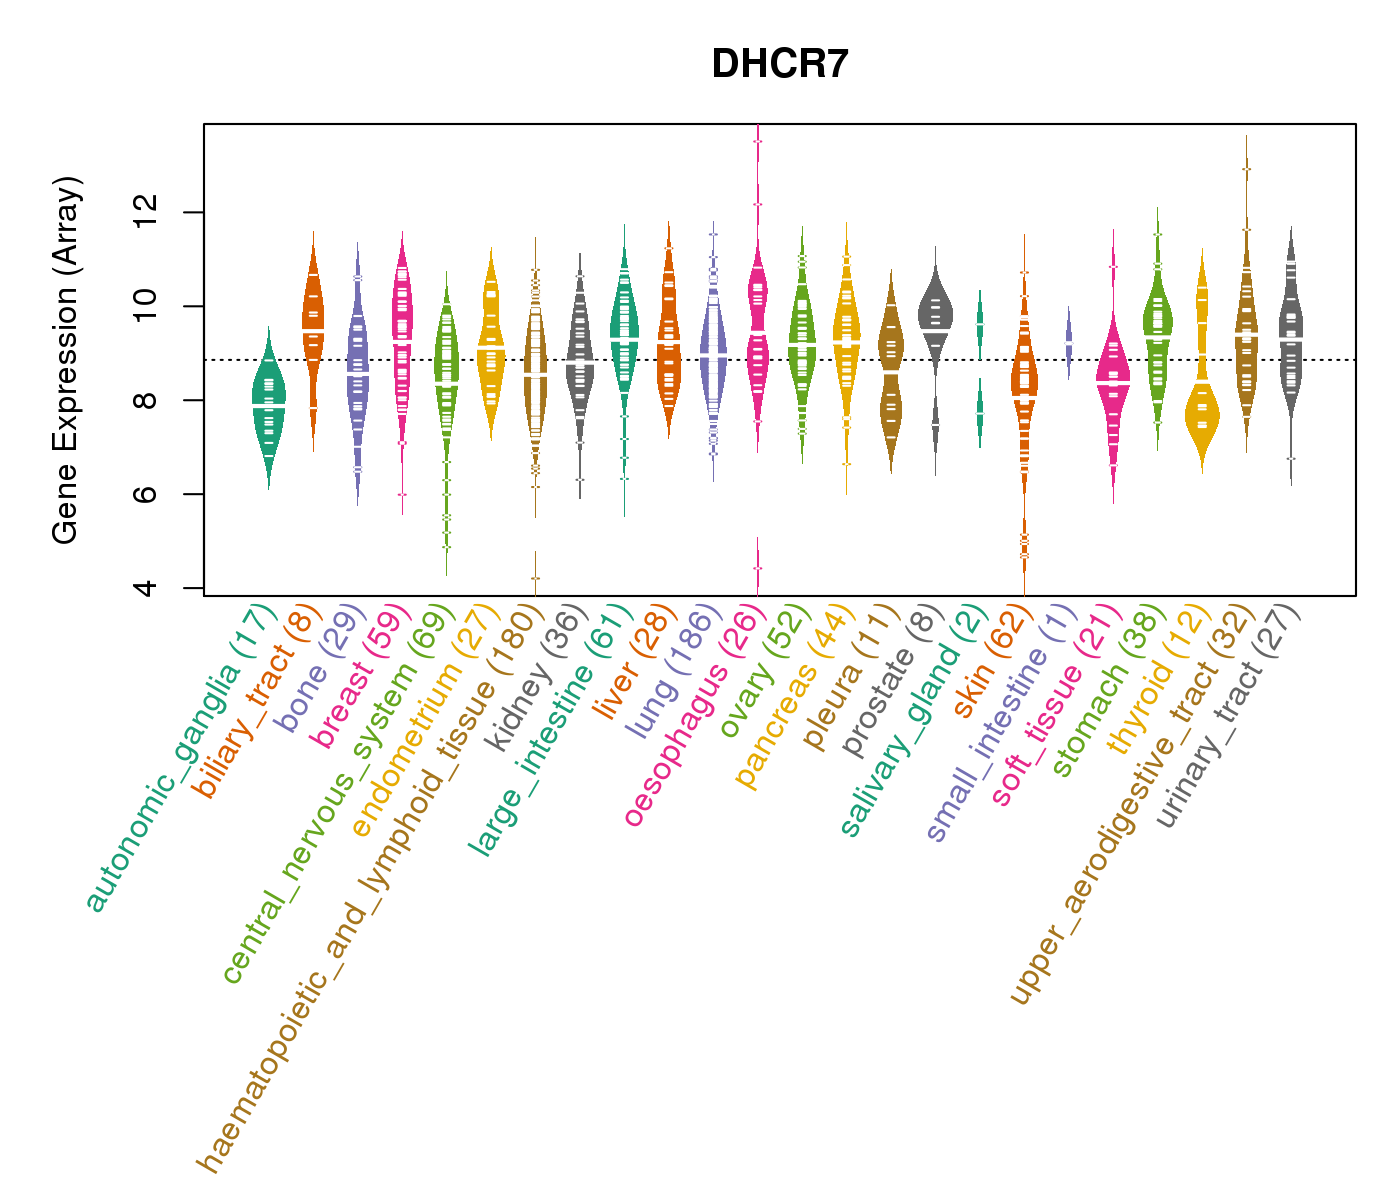
| * CCLE gene expression data were extracted from CCLE_Expression_Entrez_2012-10-18.res: Gene-centric RMA-normalized mRNA expression data. |
 |
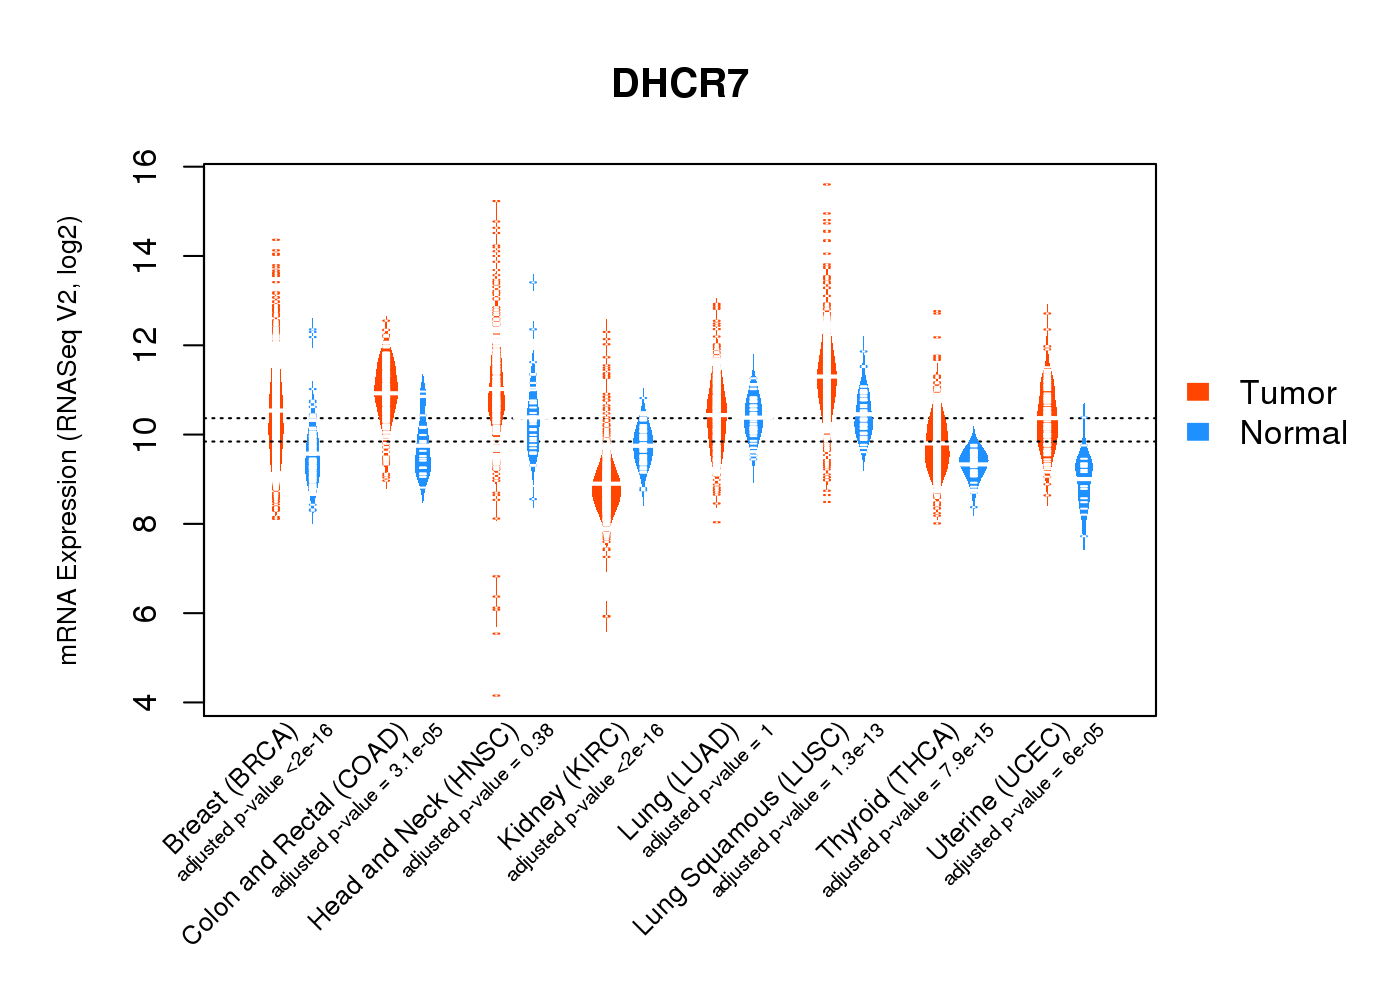
| * Normalized gene expression data of RNASeqV2 was extracted from TCGA using R package TCGA-Assembler. The URLs of all public data files on TCGA DCC data server were gathered at Jan-05-2015. Only eight cancer types have enough normal control samples for differential expression analysis. (t test, adjusted p<0.05 (using Benjamini-Hochberg FDR)) |
 |
| Top |
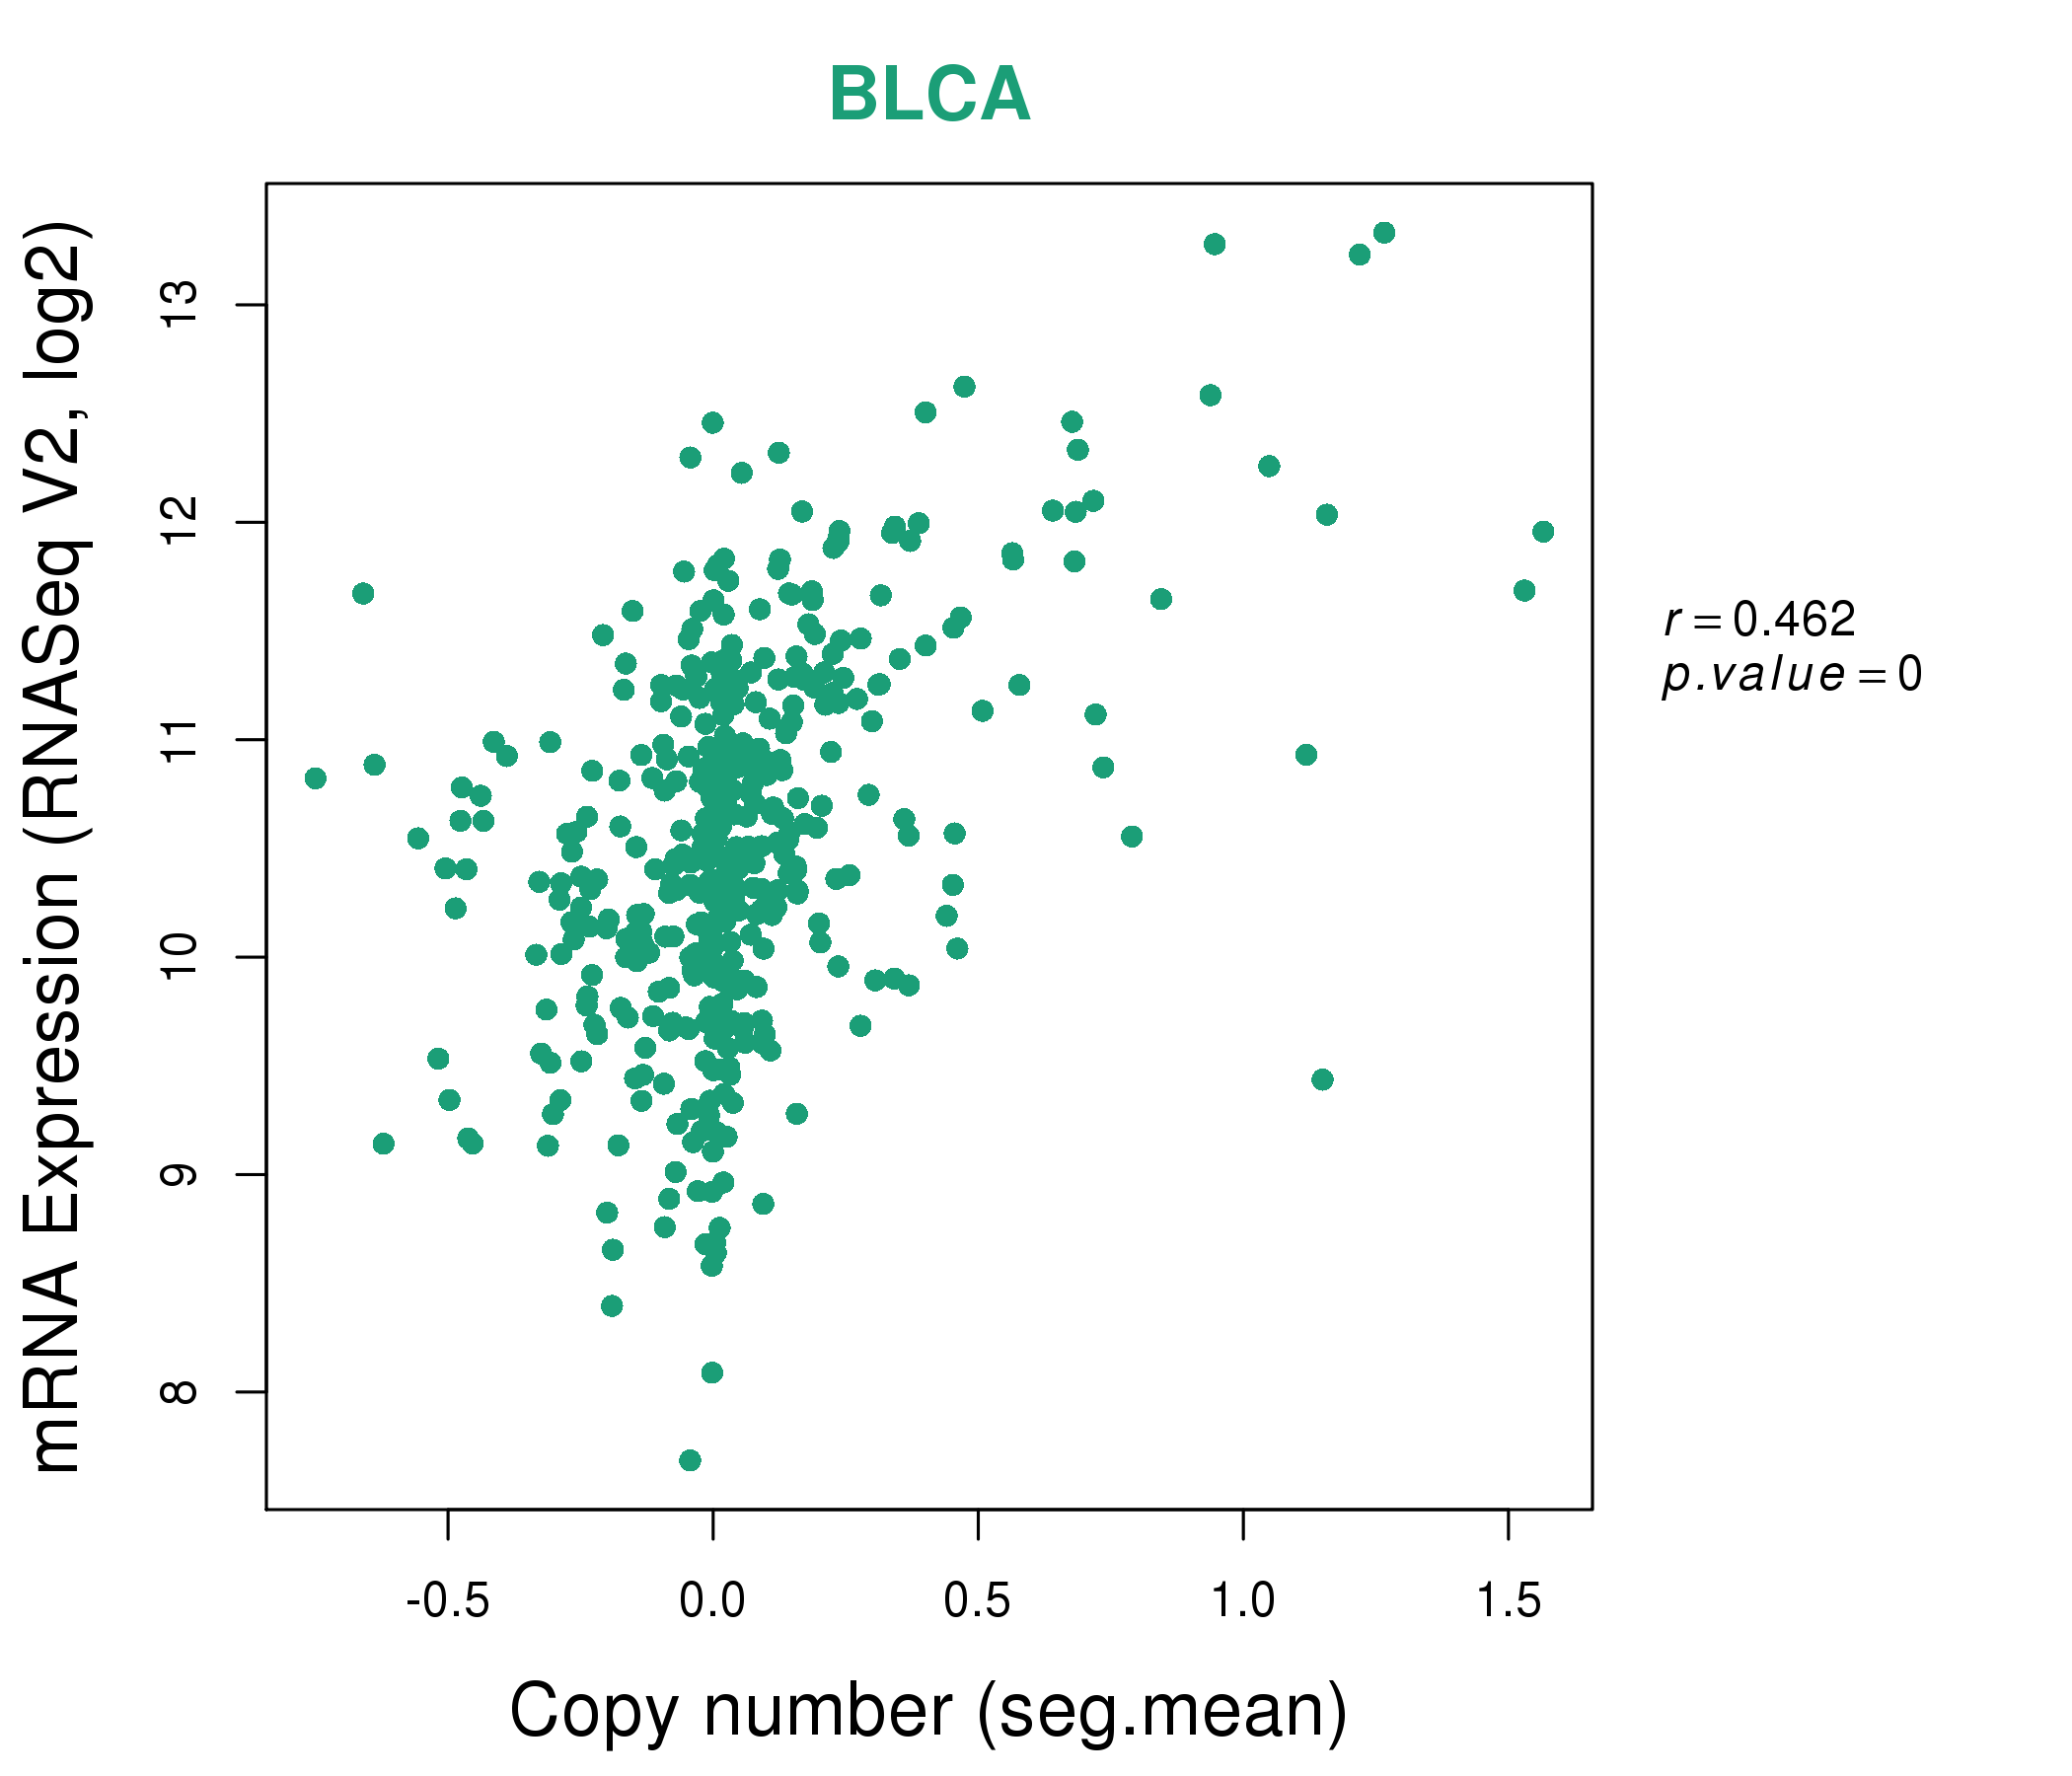
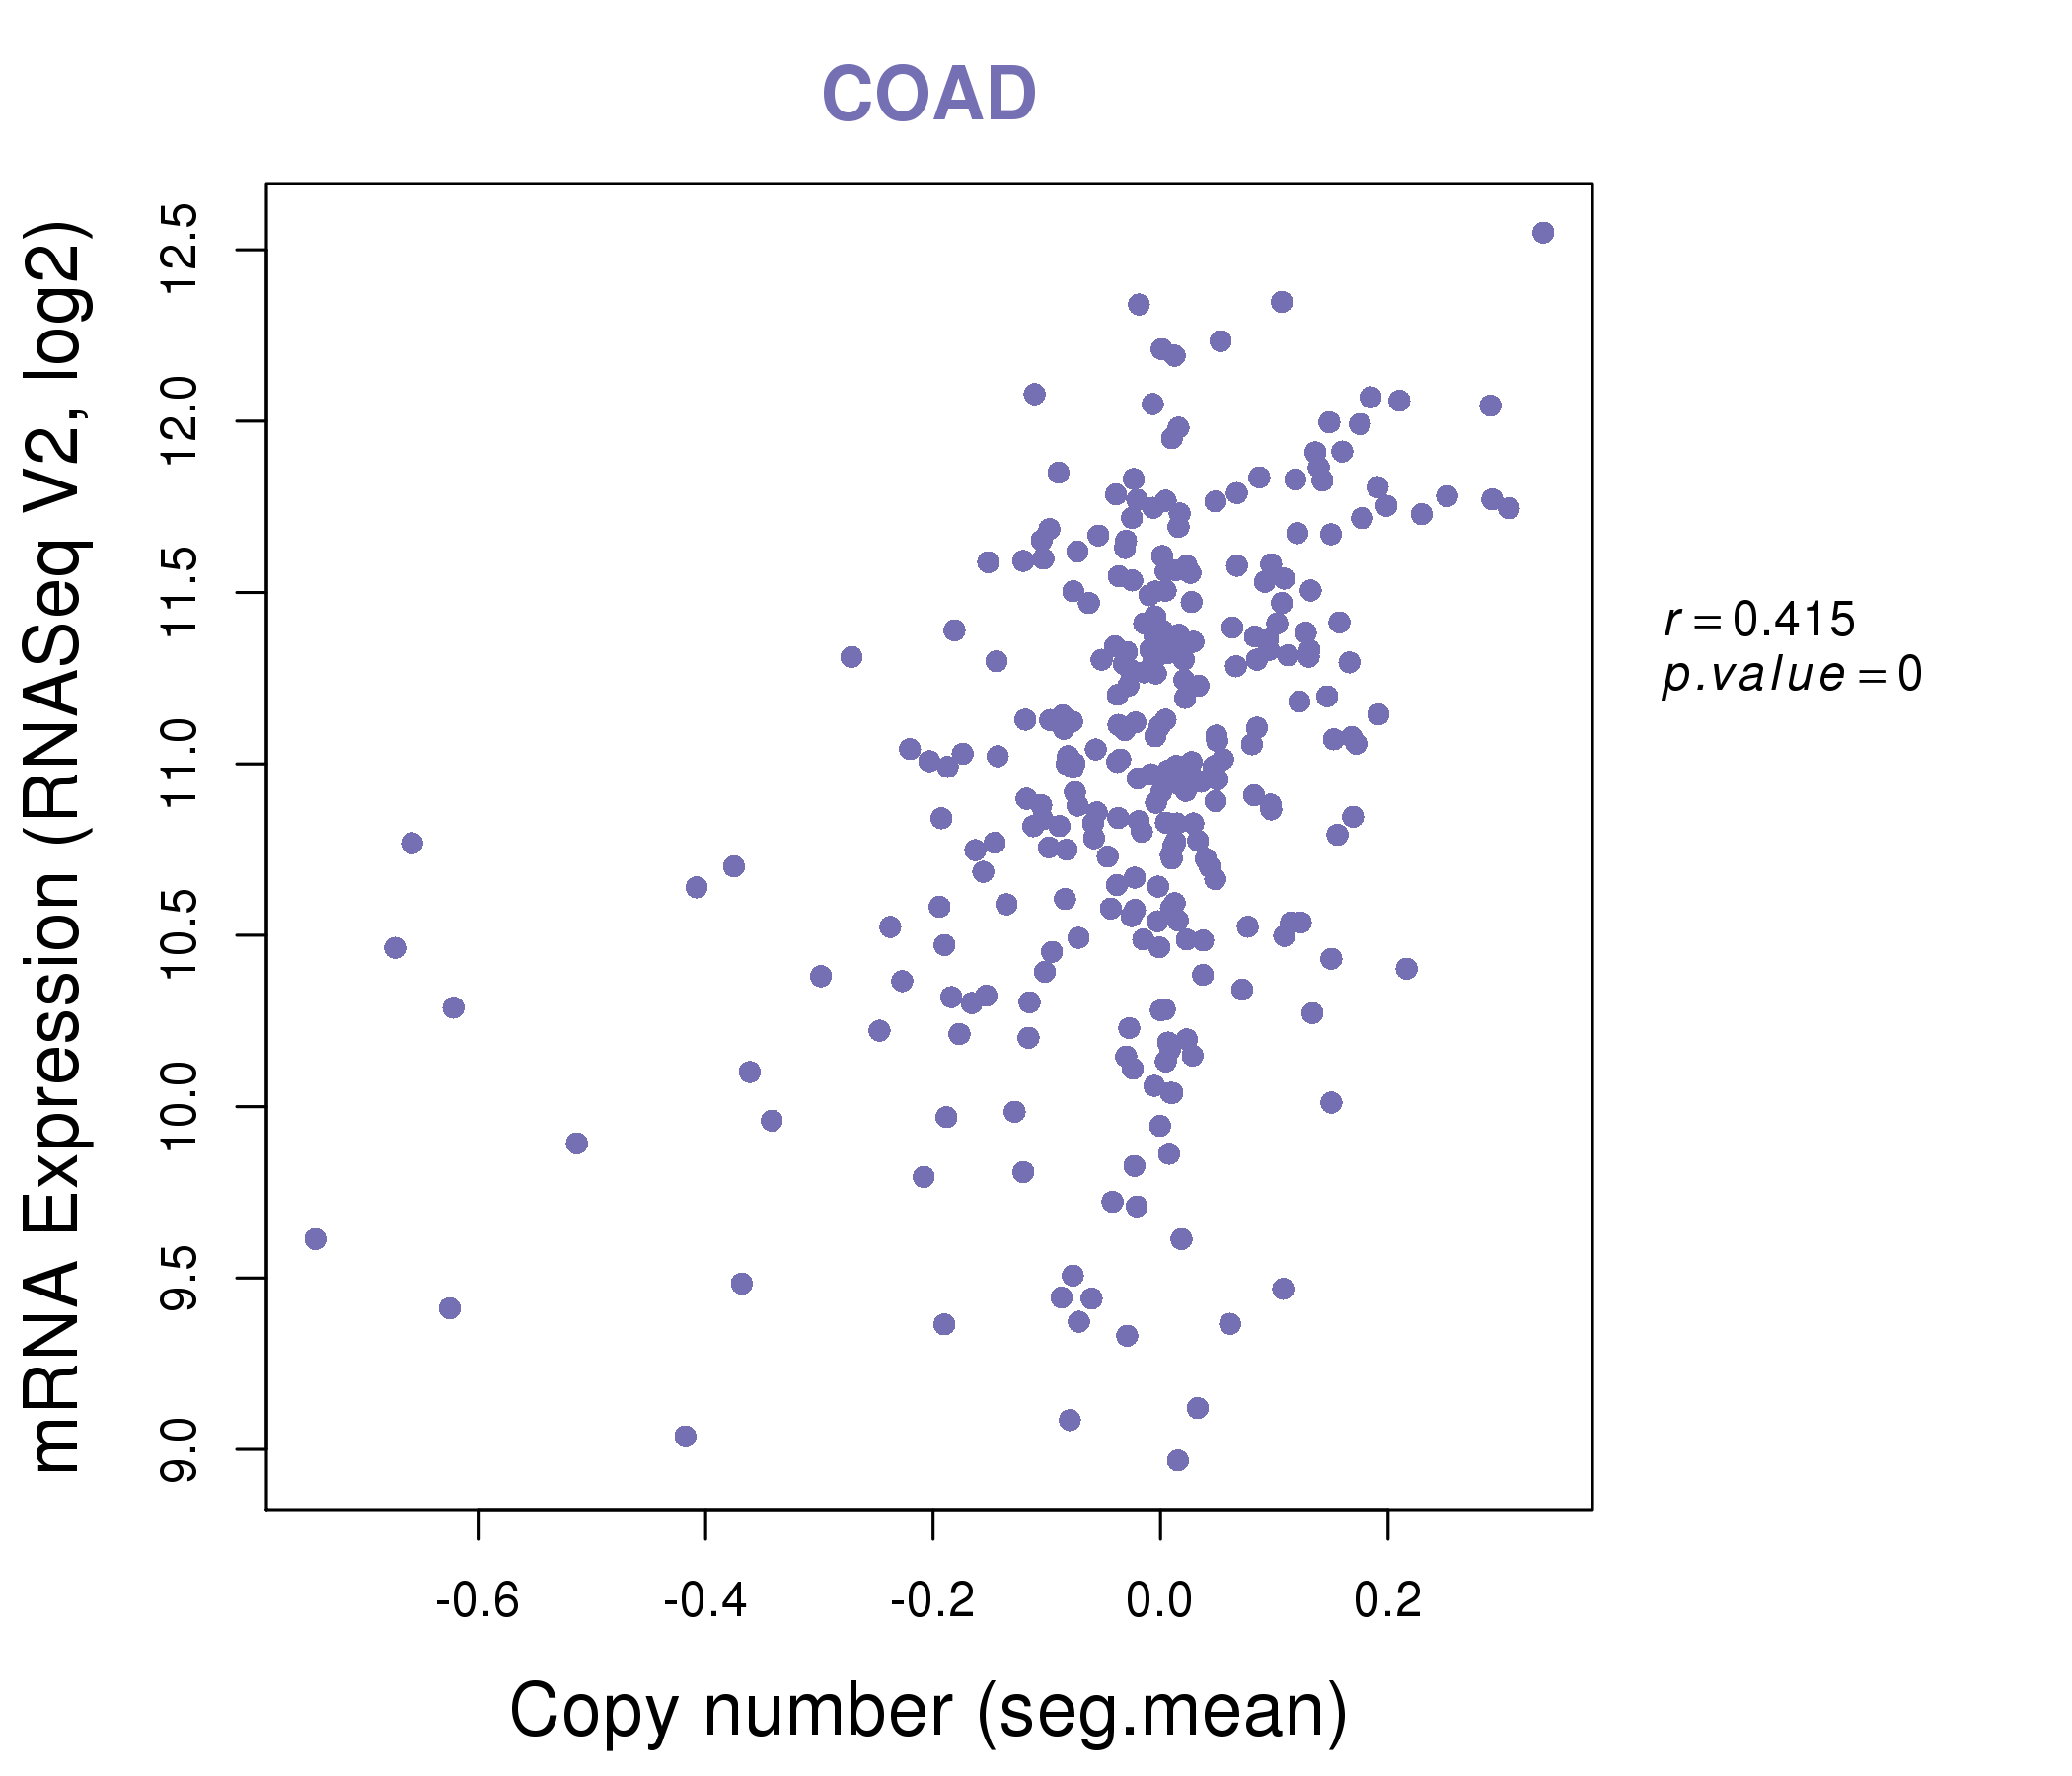
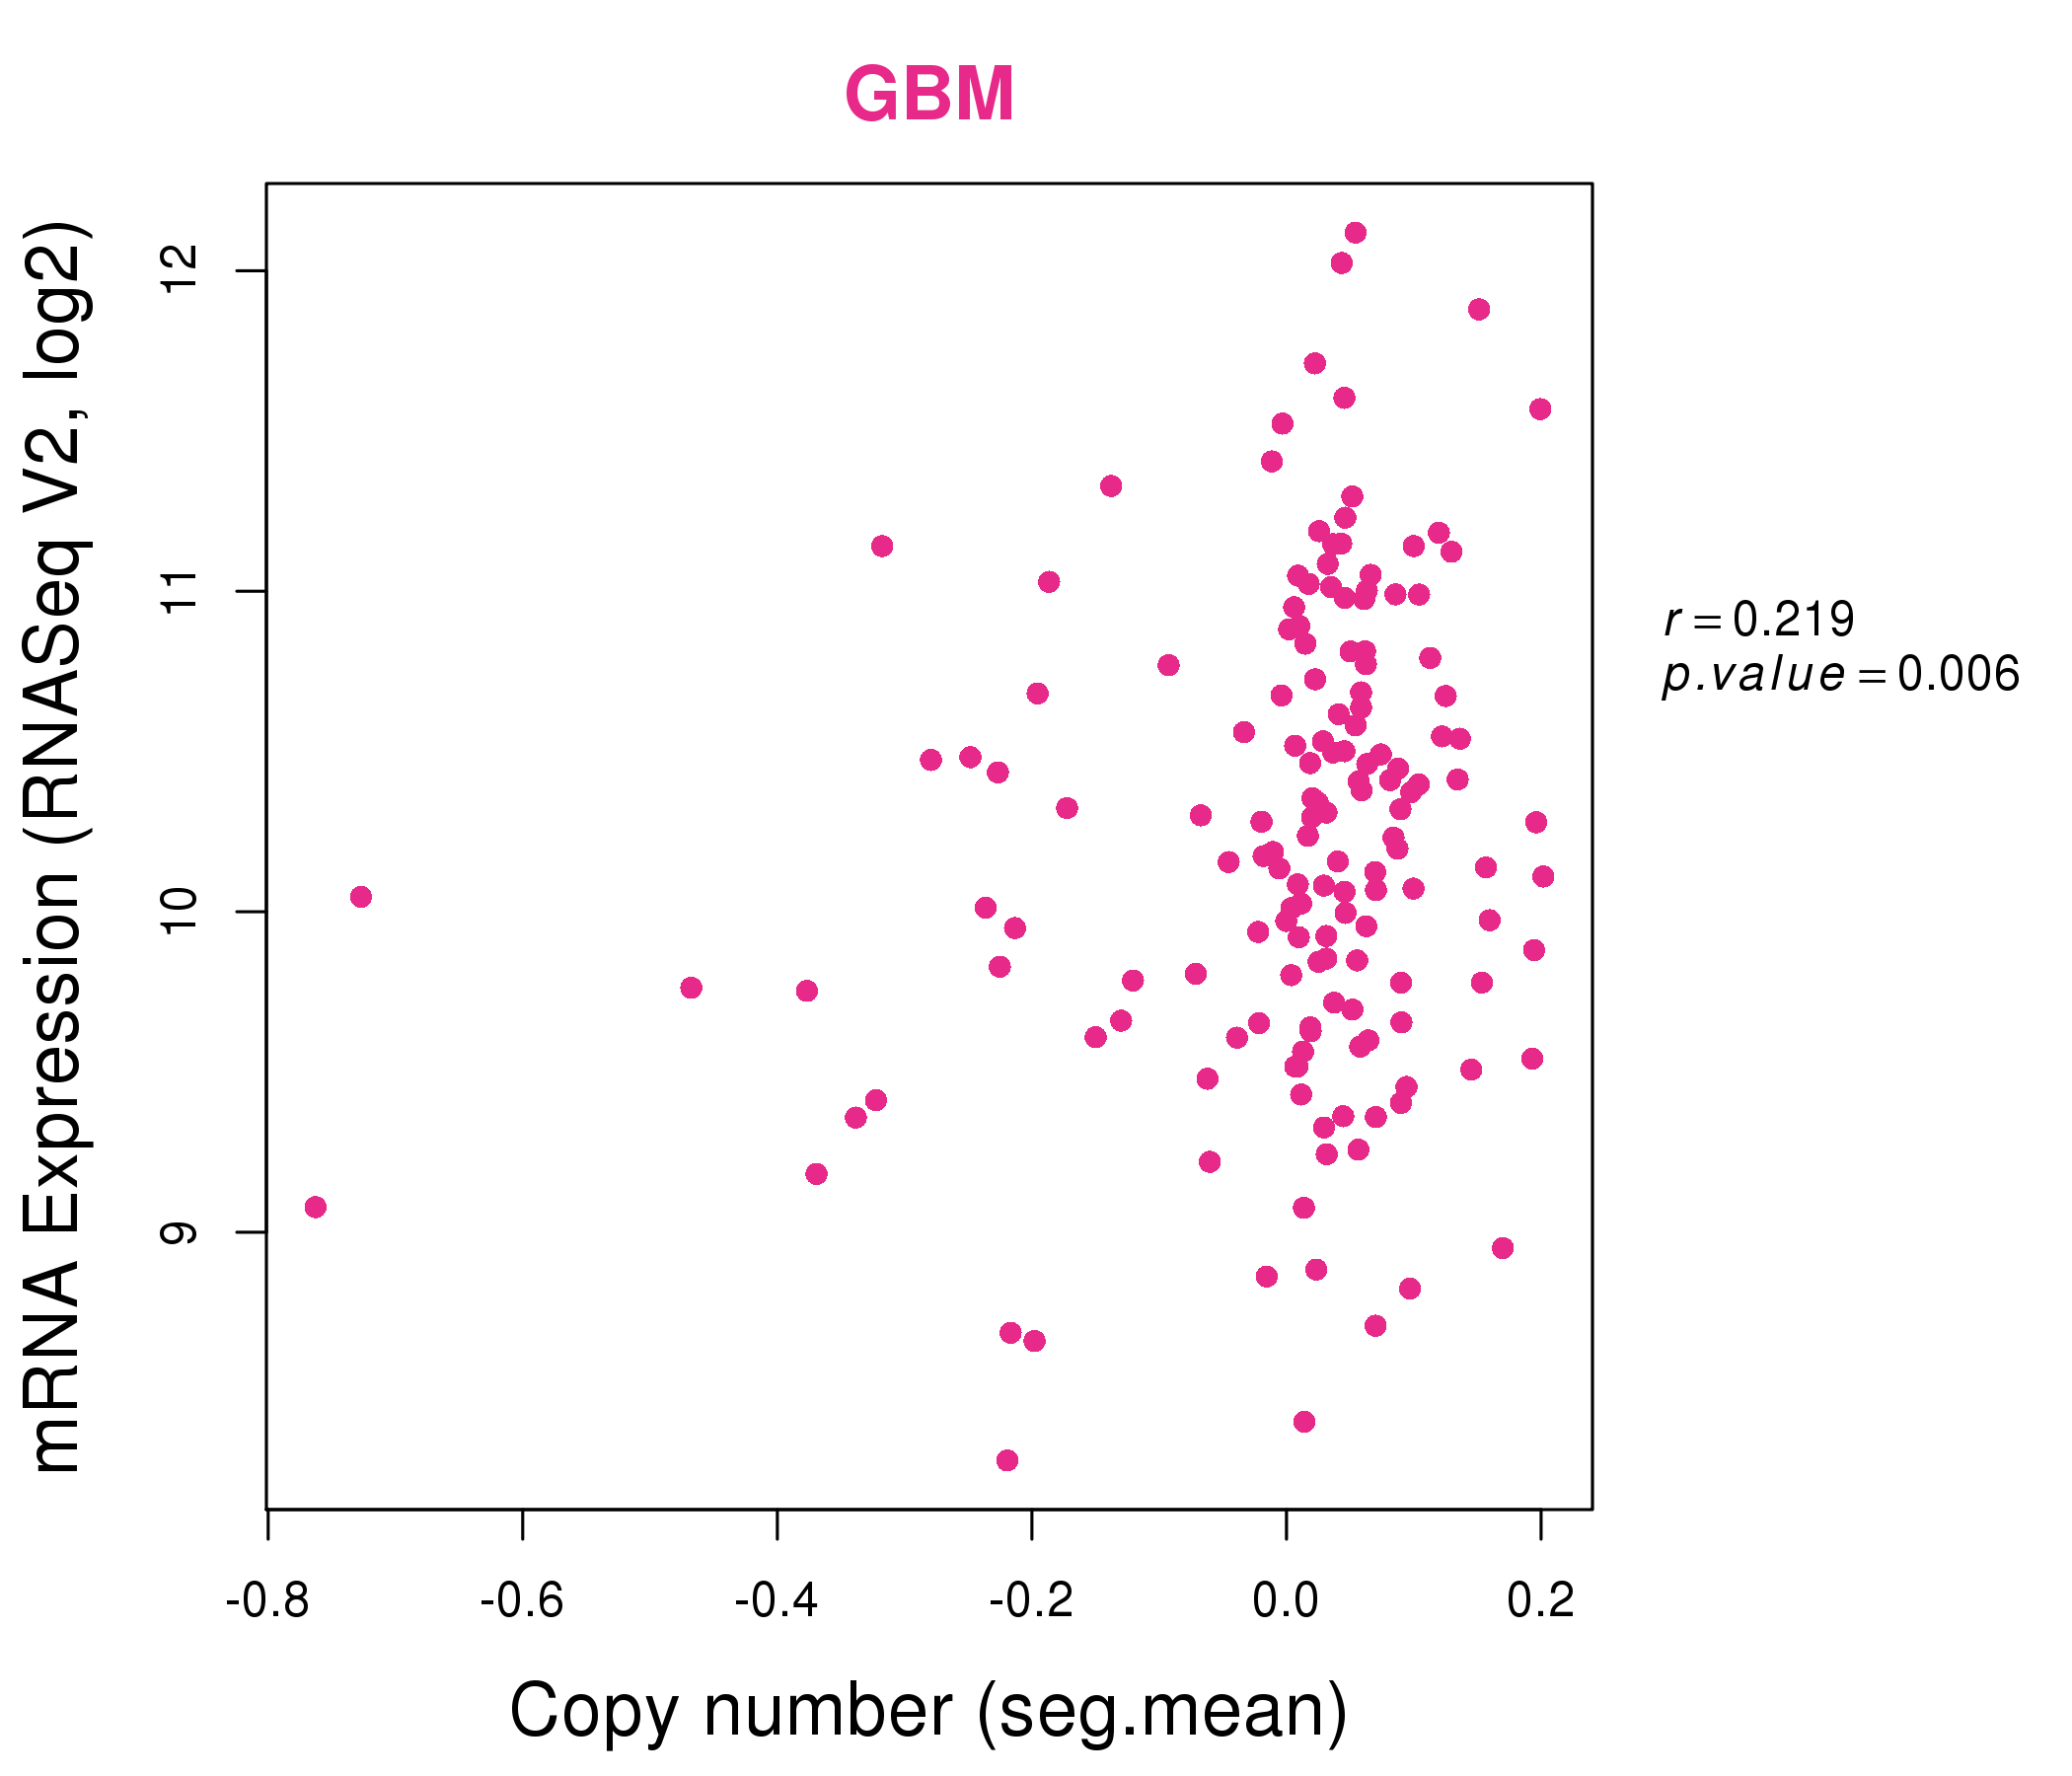
| * This plots show the correlation between CNV and gene expression. |
: Open all plots for all cancer types
 |
|
 |
|

| Top |
| Gene-Gene Network Information |
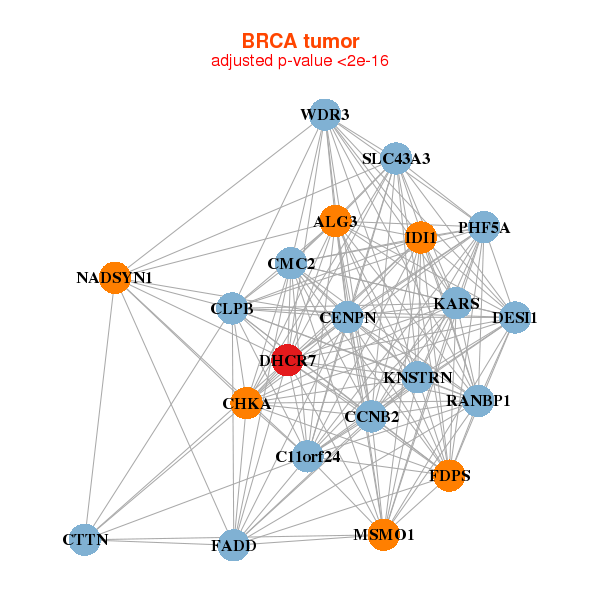
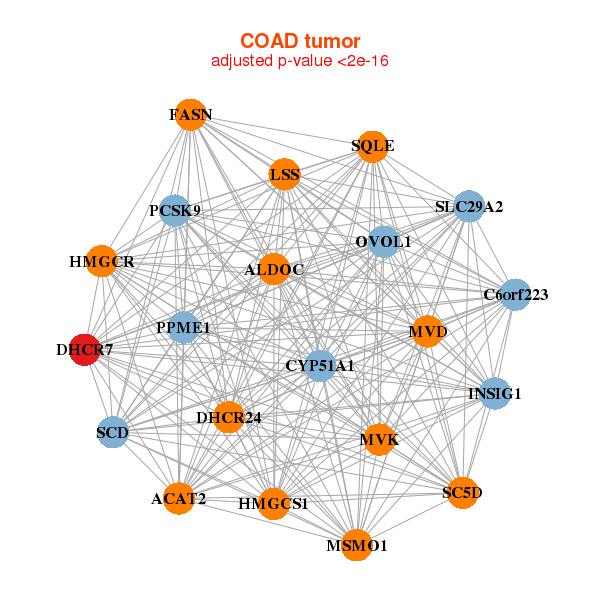
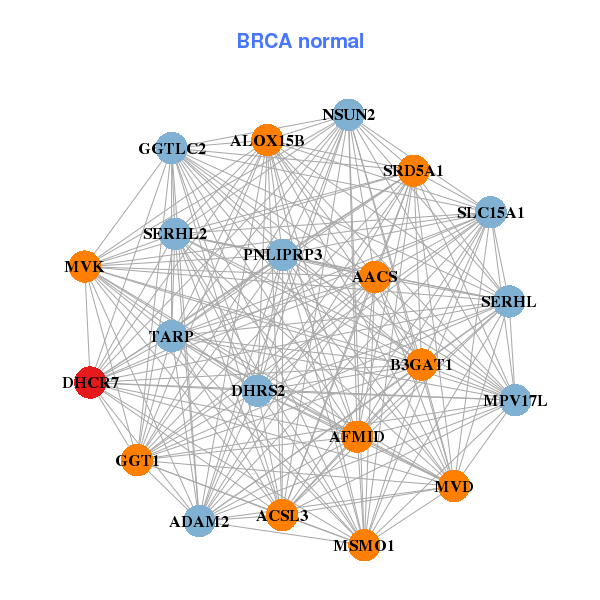
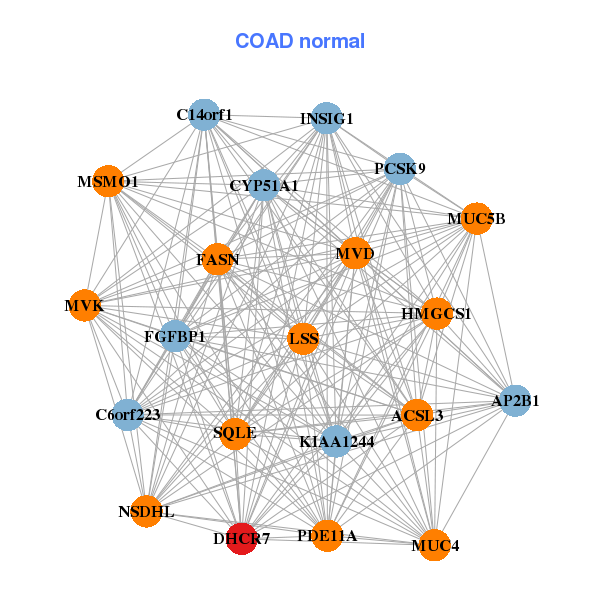
| * Co-Expression network figures were drawn using R package igraph. Only the top 20 genes with the highest correlations were shown. Red circle: input gene, orange circle: cell metabolism gene, sky circle: other gene |
: Open all plots for all cancer types
 |
| ||||
| ALG3,C11orf24,KNSTRN,CMC2,CCNB2,CENPN,CHKA, CLPB,CTTN,DHCR7,FADD,FDPS,IDI1,KARS, NADSYN1,PHF5A,DESI1,RANBP1,MSMO1,SLC43A3,WDR3 | AACS,ACSL3,ADAM2,AFMID,ALOX15B,B3GAT1,DHCR7, DHRS2,GGT1,GGTLC2,MPV17L,MVD,MVK,NSUN2, PNLIPRP3,MSMO1,SERHL2,SERHL,SLC15A1,SRD5A1,TARP | ||||
 |
| ||||
| ACAT2,ALDOC,C6orf223,CYP51A1,DHCR24,DHCR7,FASN, HMGCR,HMGCS1,INSIG1,LSS,MVD,MVK,OVOL1, PCSK9,PPME1,MSMO1,SC5D,SCD,SLC29A2,SQLE | ACSL3,AP2B1,C14orf1,C6orf223,CYP51A1,DHCR7,FASN, FGFBP1,HMGCS1,INSIG1,KIAA1244,LSS,MUC4,MUC5B, MVD,MVK,NSDHL,PCSK9,PDE11A,MSMO1,SQLE |
| * Co-Expression network figures were drawn using R package igraph. Only the top 20 genes with the highest correlations were shown. Red circle: input gene, orange circle: cell metabolism gene, sky circle: other gene |
: Open all plots for all cancer types
| Top |
: Open all interacting genes' information including KEGG pathway for all interacting genes from DAVID
| Top |
| Pharmacological Information for DHCR7 |
| DB Category | DB Name | DB's ID and Url link |
| * Gene Centered Interaction Network. |
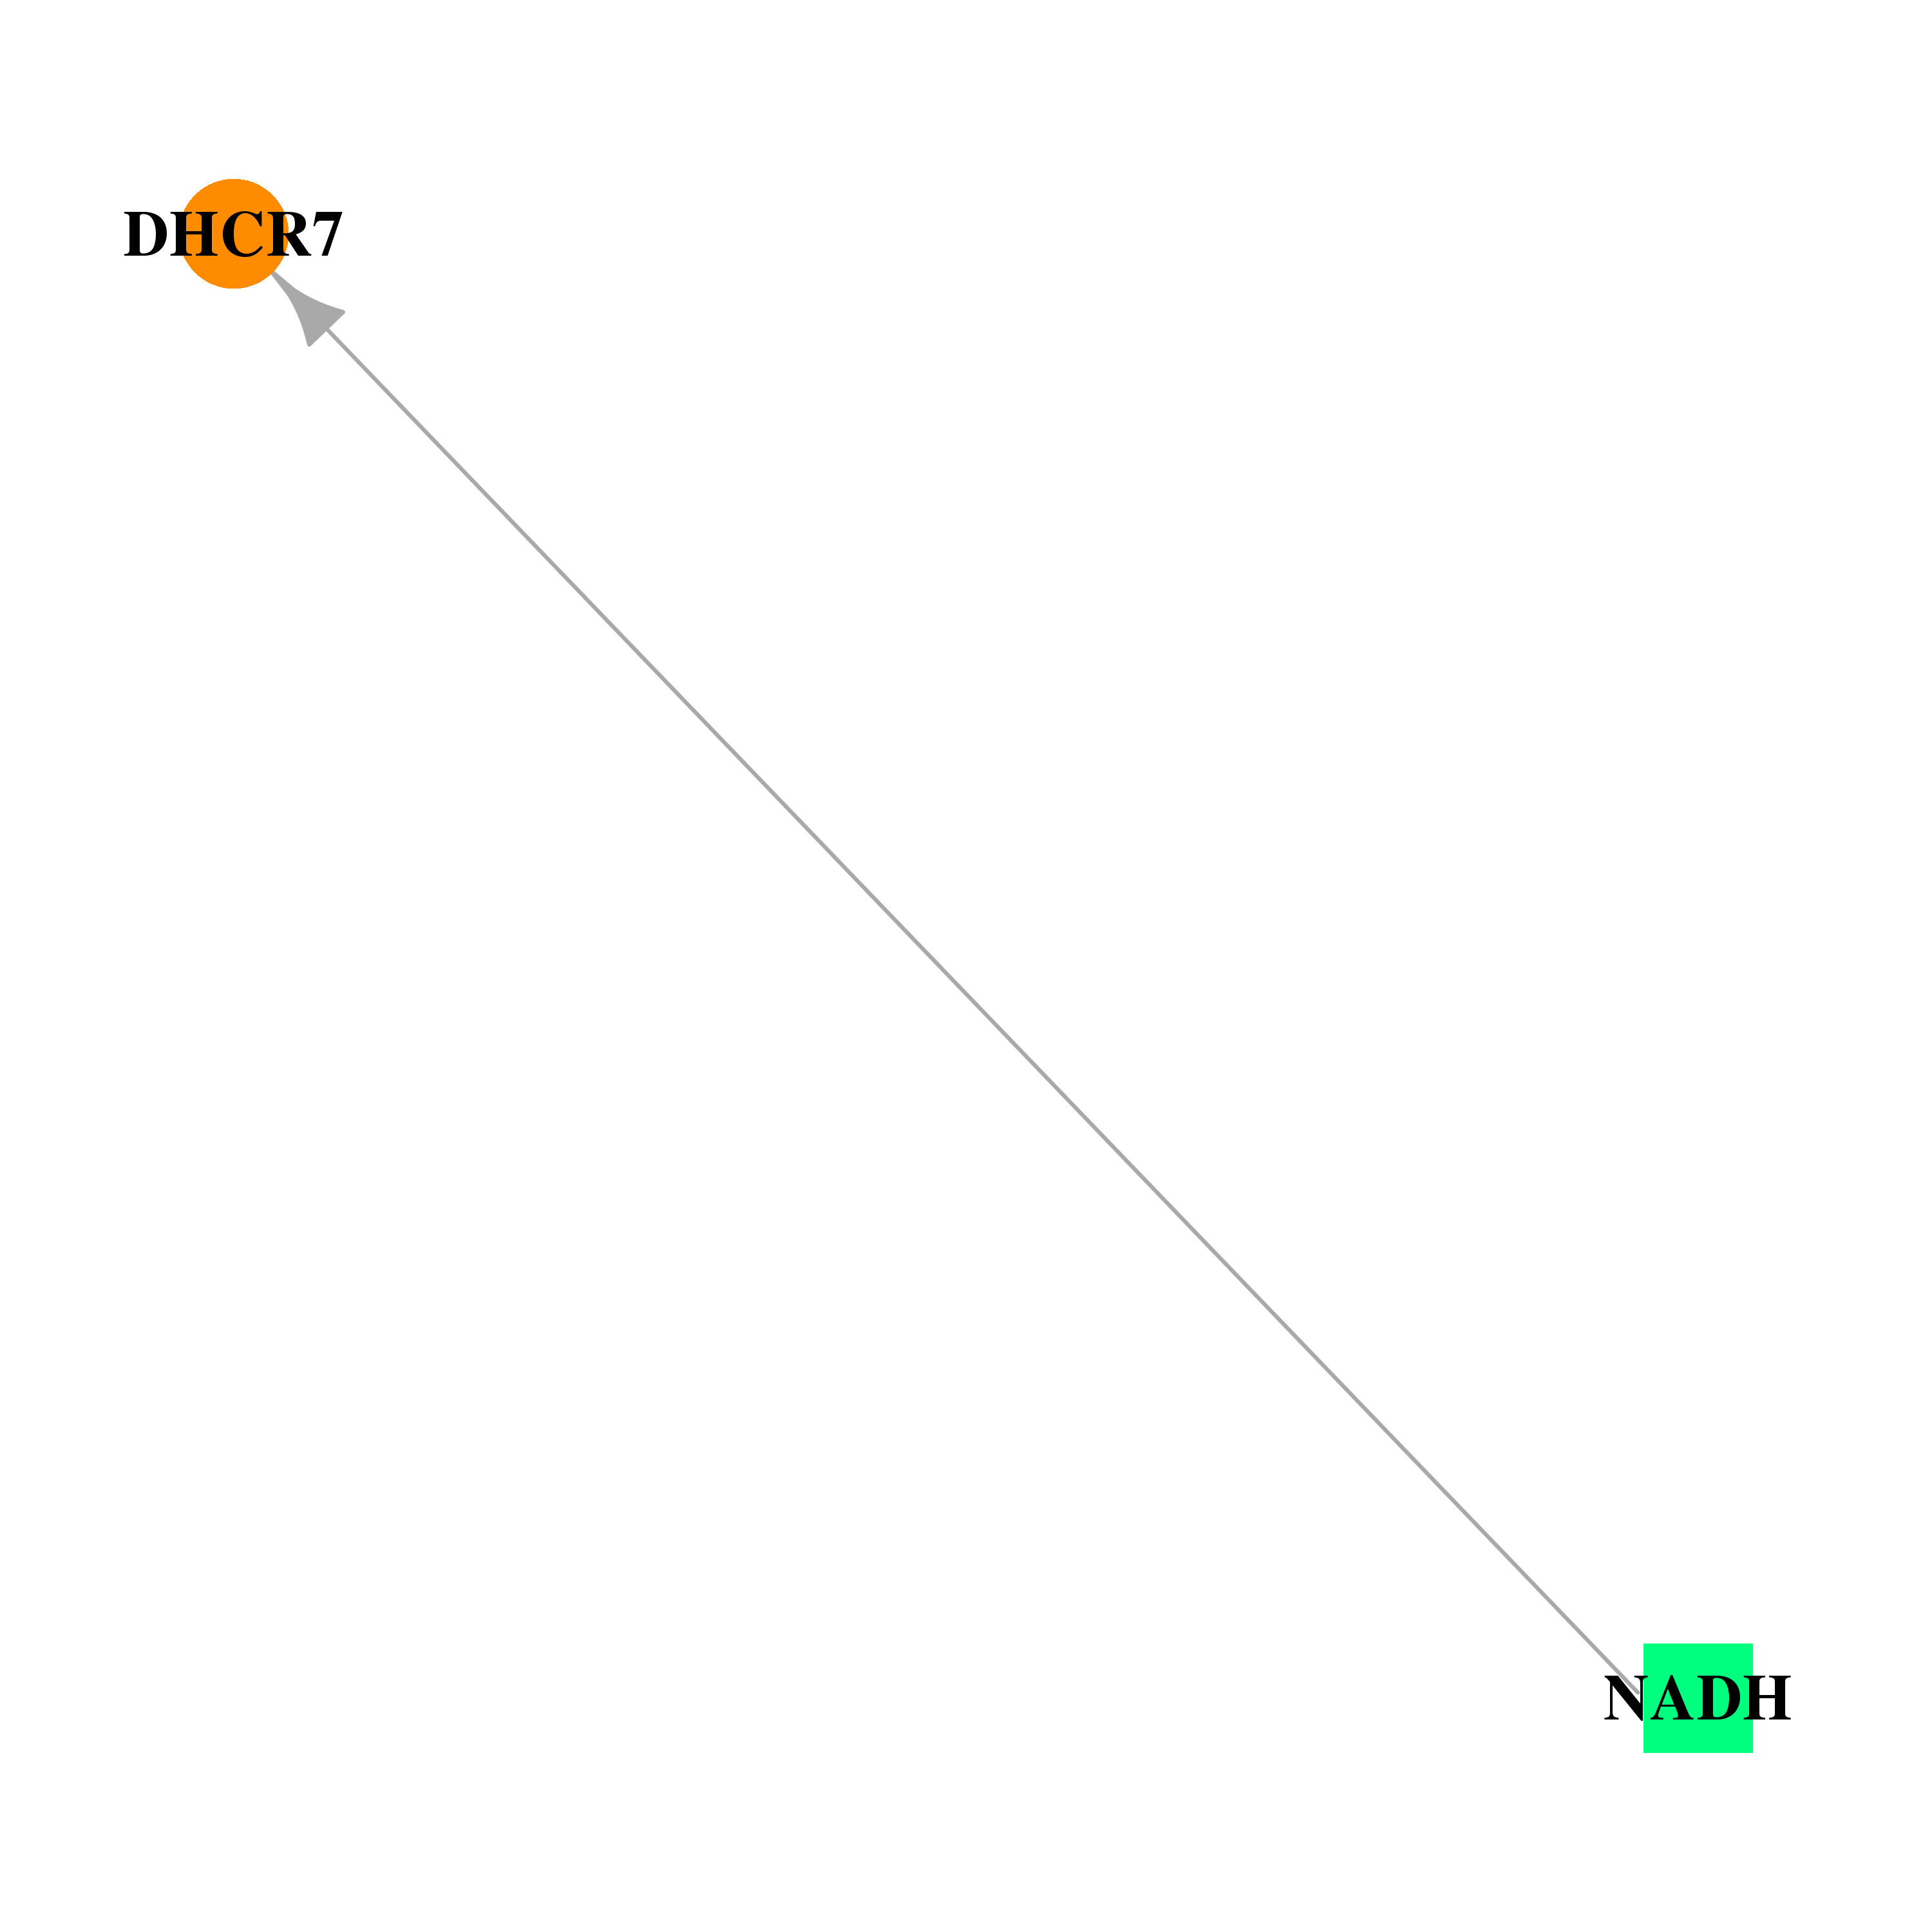 |
| * Drug Centered Interaction Network. |
| DrugBank ID | Target Name | Drug Groups | Generic Name | Drug Centered Network | Drug Structure |
| DB00157 | 7-dehydrocholesterol reductase | approved; nutraceutical | NADH |  |  |
| Top |
| Cross referenced IDs for DHCR7 |
| * We obtained these cross-references from Uniprot database. It covers 150 different DBs, 18 categories. http://www.uniprot.org/help/cross_references_section |
: Open all cross reference information
|
Copyright © 2016-Present - The Univsersity of Texas Health Science Center at Houston @ |