|
||||||||||||||||||||
| |
| Phenotypic Information (metabolism pathway, cancer, disease, phenome) |
| |
| |
| Gene-Gene Network Information: Co-Expression Network, Interacting Genes & KEGG |
| |
|


| Gene Summary for DHCR24 |
| Basic gene info. | Gene symbol | DHCR24 |
| Gene name | 24-dehydrocholesterol reductase | |
| Synonyms | DCE|Nbla03646|SELADIN1|seladin-1 | |
| Cytomap | UCSC genome browser: 1p32.3 | |
| Genomic location | chr1 :55315299-55352921 | |
| Type of gene | protein-coding | |
| RefGenes | NM_014762.3, | |
| Ensembl id | ENSG00000116133 | |
| Description | 3 beta-hydroxysterol delta 24-reductase3-beta-hydroxysterol delta-24-reductasedelta(24)-sterol reductasedesmosterol-to-cholesterol enzymediminuto/dwarf1 homologseladin 1selective AD indicator 1 | |
| Modification date | 20141207 | |
| dbXrefs | MIM : 606418 | |
| HGNC : HGNC | ||
| Ensembl : ENSG00000116133 | ||
| HPRD : 05916 | ||
| Vega : OTTHUMG00000009989 | ||
| Protein | UniProt: go to UniProt's Cross Reference DB Table | |
| Expression | CleanEX: HS_DHCR24 | |
| BioGPS: 1718 | ||
| Gene Expression Atlas: ENSG00000116133 | ||
| The Human Protein Atlas: ENSG00000116133 | ||
| Pathway | NCI Pathway Interaction Database: DHCR24 | |
| KEGG: DHCR24 | ||
| REACTOME: DHCR24 | ||
| ConsensusPathDB | ||
| Pathway Commons: DHCR24 | ||
| Metabolism | MetaCyc: DHCR24 | |
| HUMANCyc: DHCR24 | ||
| Regulation | Ensembl's Regulation: ENSG00000116133 | |
| miRBase: chr1 :55,315,299-55,352,921 | ||
| TargetScan: NM_014762 | ||
| cisRED: ENSG00000116133 | ||
| Context | iHOP: DHCR24 | |
| cancer metabolism search in PubMed: DHCR24 | ||
| UCL Cancer Institute: DHCR24 | ||
| Assigned class in ccmGDB | C | |
| Top |
| Phenotypic Information for DHCR24(metabolism pathway, cancer, disease, phenome) |
| Cancer | CGAP: DHCR24 |
| Familial Cancer Database: DHCR24 | |
| * This gene is included in those cancer gene databases. |
|
|
|
|
|
| . | ||||||||||||||
Oncogene 1 | Significant driver gene in | |||||||||||||||||||
| cf) number; DB name 1 Oncogene; http://nar.oxfordjournals.org/content/35/suppl_1/D721.long, 2 Tumor Suppressor gene; https://bioinfo.uth.edu/TSGene/, 3 Cancer Gene Census; http://www.nature.com/nrc/journal/v4/n3/abs/nrc1299.html, 4 CancerGenes; http://nar.oxfordjournals.org/content/35/suppl_1/D721.long, 5 Network of Cancer Gene; http://ncg.kcl.ac.uk/index.php, 1Therapeutic Vulnerabilities in Cancer; http://cbio.mskcc.org/cancergenomics/statius/ |
| REACTOME_METABOLISM_OF_LIPIDS_AND_LIPOPROTEINS | |
| OMIM | |
| Orphanet | |
| Disease | KEGG Disease: DHCR24 |
| MedGen: DHCR24 (Human Medical Genetics with Condition) | |
| ClinVar: DHCR24 | |
| Phenotype | MGI: DHCR24 (International Mouse Phenotyping Consortium) |
| PhenomicDB: DHCR24 | |
| Mutations for DHCR24 |
| * Under tables are showing count per each tissue to give us broad intuition about tissue specific mutation patterns.You can go to the detailed page for each mutation database's web site. |
| - Statistics for Tissue and Mutation type | Top |
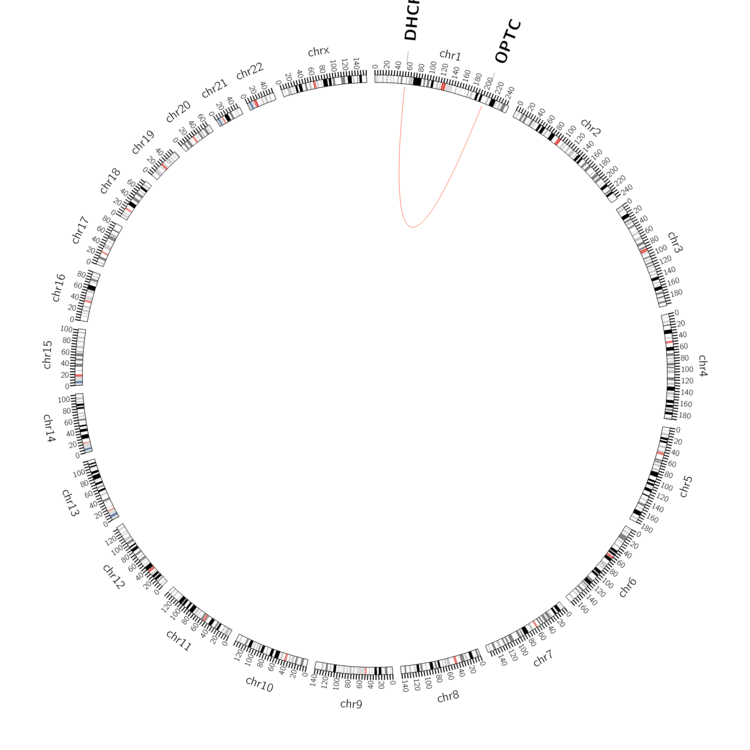 |
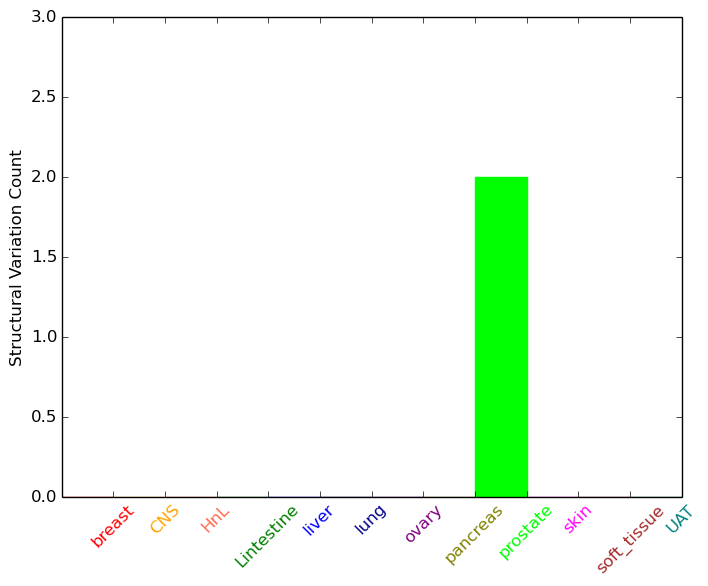
| - For Inter-chromosomal Variations |
| There's no inter-chromosomal structural variation. |
| - For Intra-chromosomal Variations |
| * Intra-chromosomal variantions includes 'intrachromosomal amplicon to amplicon', 'intrachromosomal amplicon to non-amplified dna', 'intrachromosomal deletion', 'intrachromosomal fold-back inversion', 'intrachromosomal inversion', 'intrachromosomal tandem duplication', 'Intrachromosomal unknown type', 'intrachromosomal with inverted orientation', 'intrachromosomal with non-inverted orientation'. |
 |
| Sample | Symbol_a | Chr_a | Start_a | End_a | Symbol_b | Chr_b | Start_b | End_b |
| prostate | DHCR24 | chr1 | 55331647 | 55331647 | OPTC | chr1 | 203467515 | 203467515 |
| cf) Tissue number; Tissue name (1;Breast, 2;Central_nervous_system, 3;Haematopoietic_and_lymphoid_tissue, 4;Large_intestine, 5;Liver, 6;Lung, 7;Ovary, 8;Pancreas, 9;Prostate, 10;Skin, 11;Soft_tissue, 12;Upper_aerodigestive_tract) |
| * From mRNA Sanger sequences, Chitars2.0 arranged chimeric transcripts. This table shows DHCR24 related fusion information. |
| ID | Head Gene | Tail Gene | Accession | Gene_a | qStart_a | qEnd_a | Chromosome_a | tStart_a | tEnd_a | Gene_a | qStart_a | qEnd_a | Chromosome_a | tStart_a | tEnd_a |
| BE828048 | CNPPD1 | 3 | 274 | 2 | 220036940 | 220037211 | DHCR24 | 265 | 380 | 1 | 55315314 | 55315429 | |
| DB244252 | GAS5 | 1 | 78 | 1 | 173833503 | 173833579 | DHCR24 | 74 | 560 | 1 | 55316353 | 55316839 | |
| DA340395 | LOC100507412 | 1 | 174 | ? | 115720 | 115893 | DHCR24 | 174 | 569 | 1 | 55349393 | 55352903 | |
| DA046822 | FAM105A | 1 | 188 | 5 | 14610382 | 14610569 | DHCR24 | 189 | 738 | 1 | 55317014 | 55317563 | |
| AA658920 | DHCR24 | 8 | 146 | 1 | 55316129 | 55316267 | DHCR24 | 144 | 527 | 1 | 55316263 | 55316646 | |
| AW997410 | DHCR24 | 1 | 135 | 1 | 55319150 | 55319284 | QSOX2 | 127 | 147 | 9 | 139118628 | 139118648 | |
| BF918420 | ZNF276 | 14 | 86 | 16 | 89806615 | 89806687 | DHCR24 | 82 | 394 | 1 | 55316392 | 55316704 | |
| AI207637 | DHCR24 | 1 | 533 | 1 | 55316503 | 55317035 | B4GALT5 | 518 | 631 | 20 | 48252183 | 48252296 | |
| AW997408 | DHCR24 | 5 | 126 | 1 | 55319162 | 55319284 | QSOX2 | 118 | 138 | 9 | 139118628 | 139118648 | |
| AI369276 | USP22 | 1 | 283 | 17 | 20903048 | 20903330 | DHCR24 | 279 | 375 | 1 | 55352289 | 55352385 | |
| Top |
| There's no copy number variation information in COSMIC data for this gene. |
| Top |
|
 |
| Top |
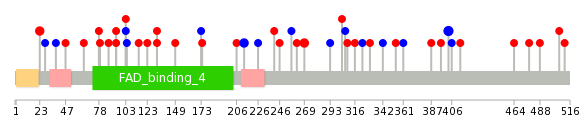
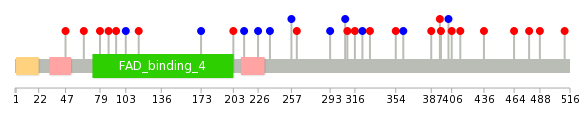
| Stat. for Non-Synonymous SNVs (# total SNVs=21) | (# total SNVs=12) |
 |  |
(# total SNVs=0) | (# total SNVs=0) |
| Top |
| * When you move the cursor on each content, you can see more deailed mutation information on the Tooltip. Those are primary_site,primary_histology,mutation(aa),pubmedID. |
| GRCh37 position | Mutation(aa) | Unique sampleID count |
| chr1:55319719-55319719 | p.N403N | 3 |
| chr1:55352725-55352725 | p.L23Q | 2 |
| chr1:55337260-55337260 | p.A213A | 2 |
| chr1:55337094-55337094 | p.G269R | 2 |
| chr1:55341714-55341714 | p.R132C | 2 |
| chr1:55337178-55337178 | p.R241C | 1 |
| chr1:55319114-55319114 | p.V464M | 1 |
| chr1:55349369-55349369 | p.R103R | 1 |
| chr1:55331027-55331027 | p.P323P | 1 |
| chr1:55352709-55352709 | p.I28I | 1 |
| Top |
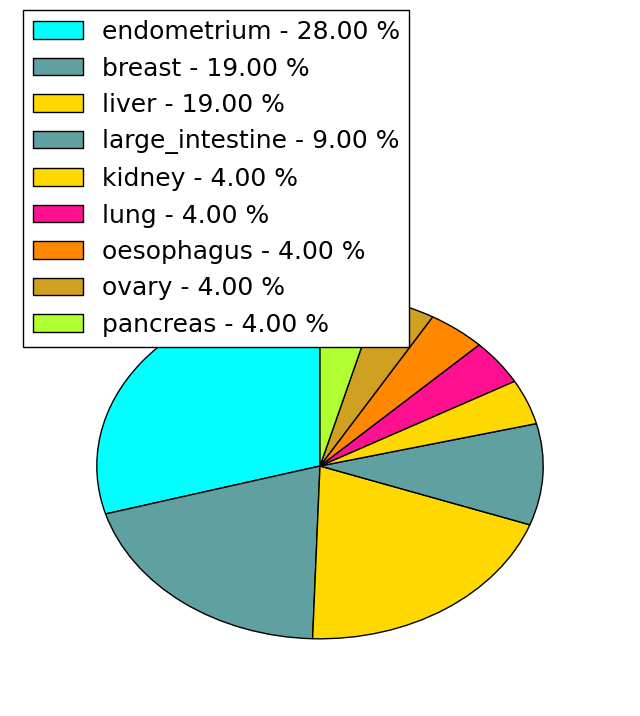
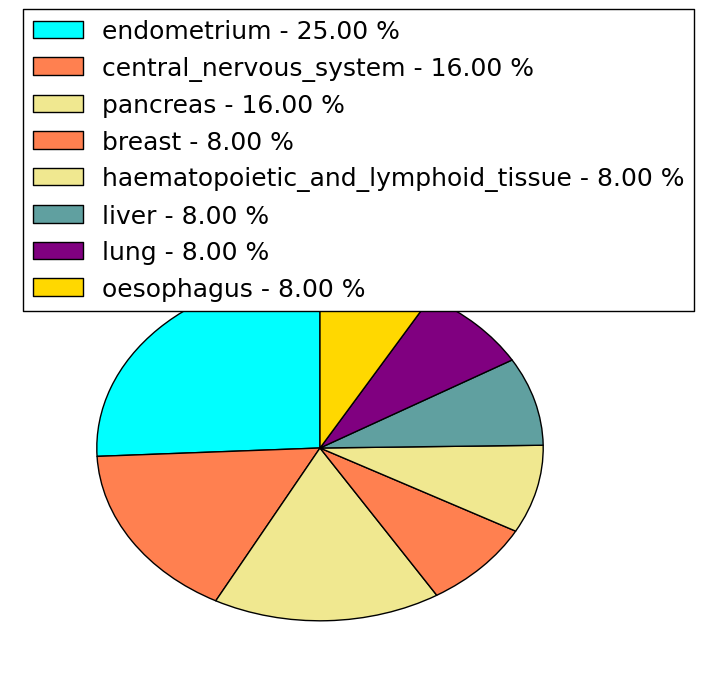
|
 |
| Point Mutation/ Tissue ID | 1 | 2 | 3 | 4 | 5 | 6 | 7 | 8 | 9 | 10 | 11 | 12 | 13 | 14 | 15 | 16 | 17 | 18 | 19 | 20 |
| # sample | 2 | 4 | 1 | 2 | 2 | 1 | 2 | 5 | 5 | |||||||||||
| # mutation | 3 | 4 | 1 | 2 | 2 | 1 | 2 | 5 | 8 | |||||||||||
| nonsynonymous SNV | 2 | 3 | 1 | 2 | 2 | 1 | 1 | 3 | 5 | |||||||||||
| synonymous SNV | 1 | 1 | 1 | 2 | 3 |
| cf) Tissue ID; Tissue type (1; BLCA[Bladder Urothelial Carcinoma], 2; BRCA[Breast invasive carcinoma], 3; CESC[Cervical squamous cell carcinoma and endocervical adenocarcinoma], 4; COAD[Colon adenocarcinoma], 5; GBM[Glioblastoma multiforme], 6; Glioma Low Grade, 7; HNSC[Head and Neck squamous cell carcinoma], 8; KICH[Kidney Chromophobe], 9; KIRC[Kidney renal clear cell carcinoma], 10; KIRP[Kidney renal papillary cell carcinoma], 11; LAML[Acute Myeloid Leukemia], 12; LUAD[Lung adenocarcinoma], 13; LUSC[Lung squamous cell carcinoma], 14; OV[Ovarian serous cystadenocarcinoma ], 15; PAAD[Pancreatic adenocarcinoma], 16; PRAD[Prostate adenocarcinoma], 17; SKCM[Skin Cutaneous Melanoma], 18:STAD[Stomach adenocarcinoma], 19:THCA[Thyroid carcinoma], 20:UCEC[Uterine Corpus Endometrial Carcinoma]) |
| Top |
| * We represented just top 10 SNVs. When you move the cursor on each content, you can see more deailed mutation information on the Tooltip. Those are primary_site, primary_histology, mutation(aa), pubmedID. |
| Genomic Position | Mutation(aa) | Unique sampleID count |
| chr1:55349335 | p.P64S | 1 |
| chr1:55319263 | p.R316Q | 1 |
| chr1:55331069 | p.D47N | 1 |
| chr1:55349369 | p.C511Y | 1 |
| chr1:55319710 | p.E309D | 1 |
| chr1:55331075 | p.S488F | 1 |
| chr1:55349398 | p.H307H | 1 |
| chr1:55319719 | p.R478Q | 1 |
| chr1:55331117 | p.L293L | 1 |
| chr1:55349418 | p.V464M | 1 |
| * Copy number data were extracted from TCGA using R package TCGA-Assembler. The URLs of all public data files on TCGA DCC data server were gathered on Jan-05-2015. Function ProcessCNAData in TCGA-Assembler package was used to obtain gene-level copy number value which is calculated as the average copy number of the genomic region of a gene. |
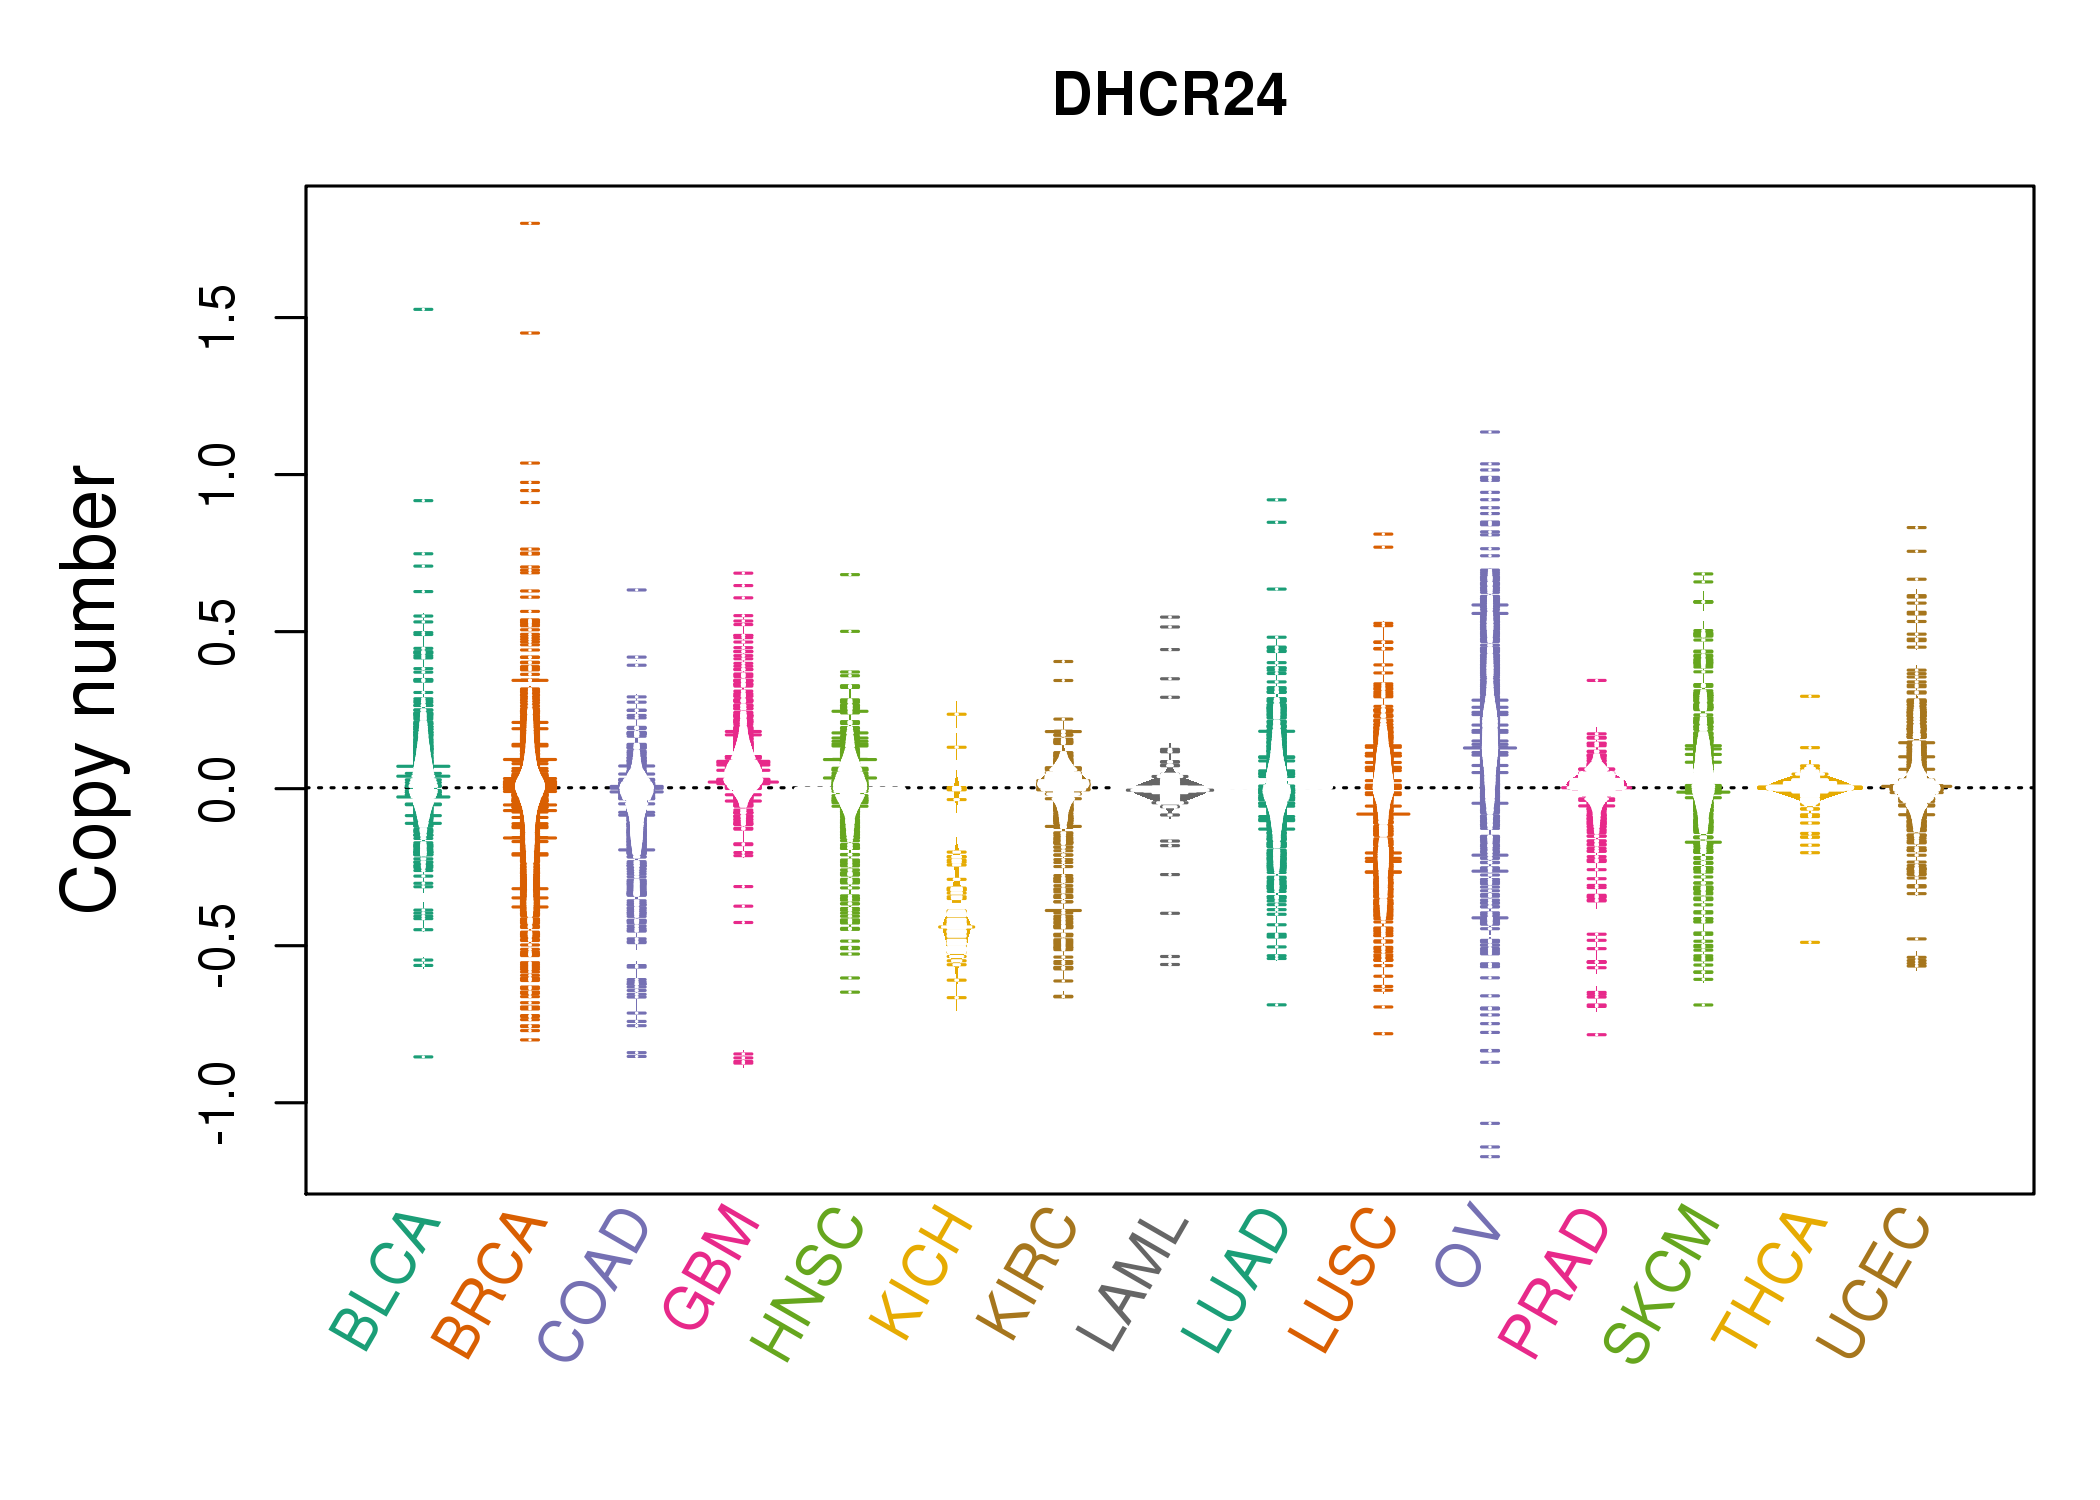 |
| cf) Tissue ID[Tissue type]: BLCA[Bladder Urothelial Carcinoma], BRCA[Breast invasive carcinoma], CESC[Cervical squamous cell carcinoma and endocervical adenocarcinoma], COAD[Colon adenocarcinoma], GBM[Glioblastoma multiforme], Glioma Low Grade, HNSC[Head and Neck squamous cell carcinoma], KICH[Kidney Chromophobe], KIRC[Kidney renal clear cell carcinoma], KIRP[Kidney renal papillary cell carcinoma], LAML[Acute Myeloid Leukemia], LUAD[Lung adenocarcinoma], LUSC[Lung squamous cell carcinoma], OV[Ovarian serous cystadenocarcinoma ], PAAD[Pancreatic adenocarcinoma], PRAD[Prostate adenocarcinoma], SKCM[Skin Cutaneous Melanoma], STAD[Stomach adenocarcinoma], THCA[Thyroid carcinoma], UCEC[Uterine Corpus Endometrial Carcinoma] |
| Top |
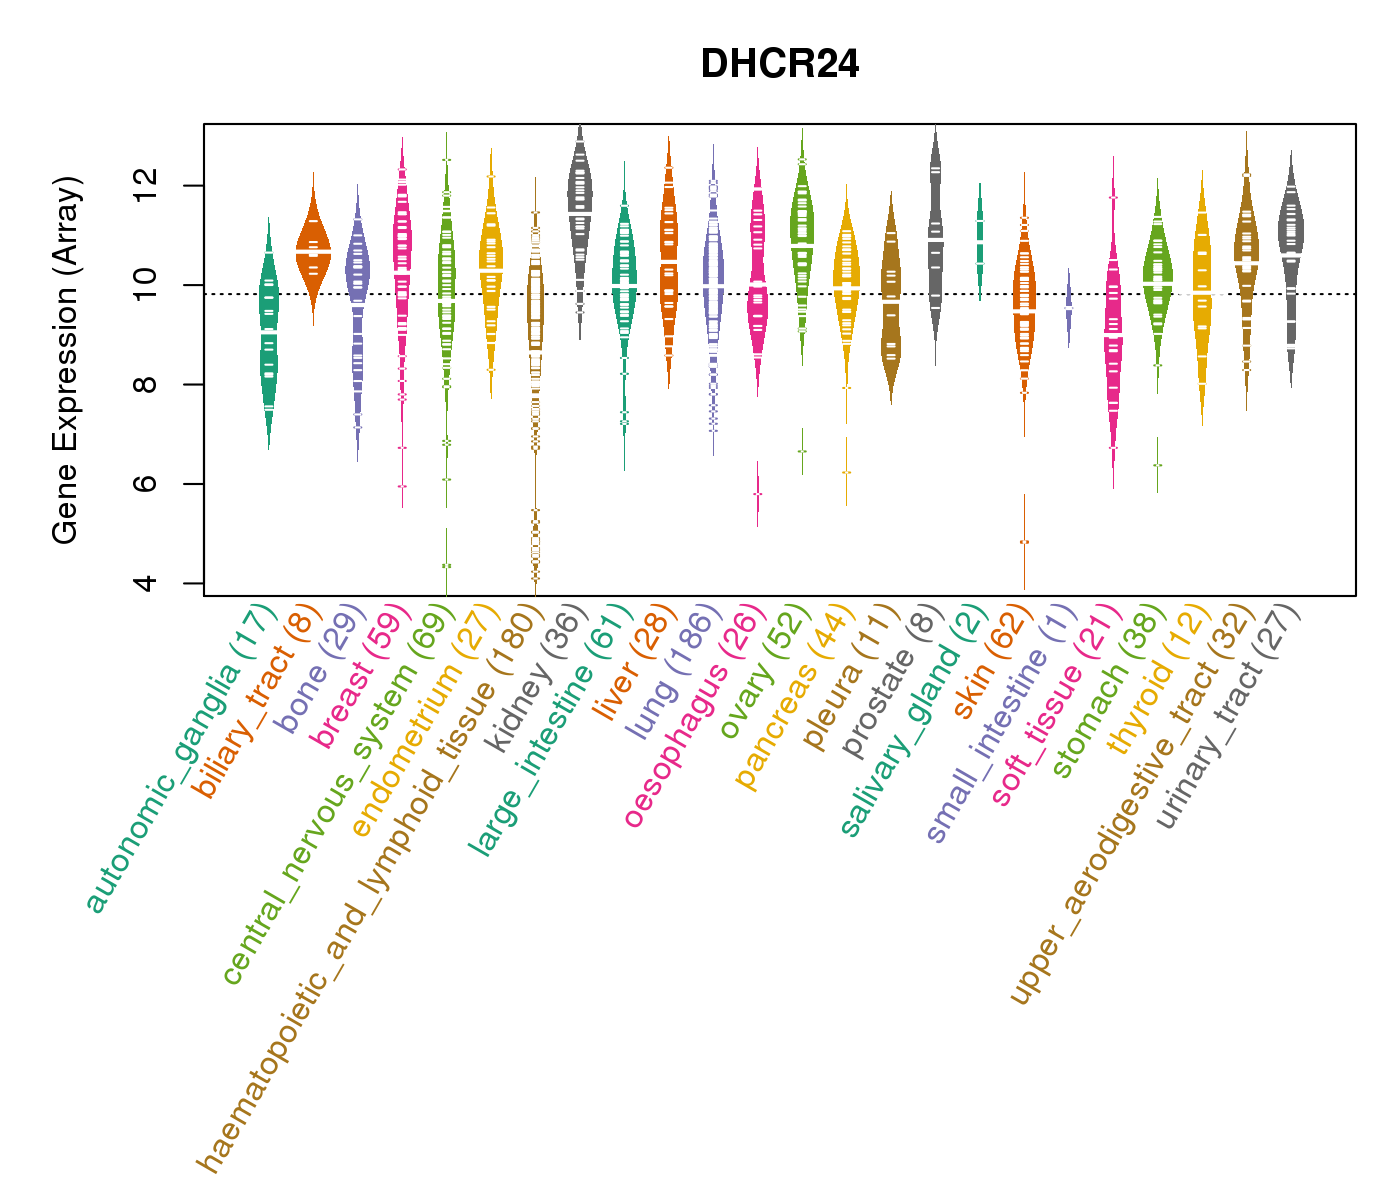
| Gene Expression for DHCR24 |
| * CCLE gene expression data were extracted from CCLE_Expression_Entrez_2012-10-18.res: Gene-centric RMA-normalized mRNA expression data. |
 |
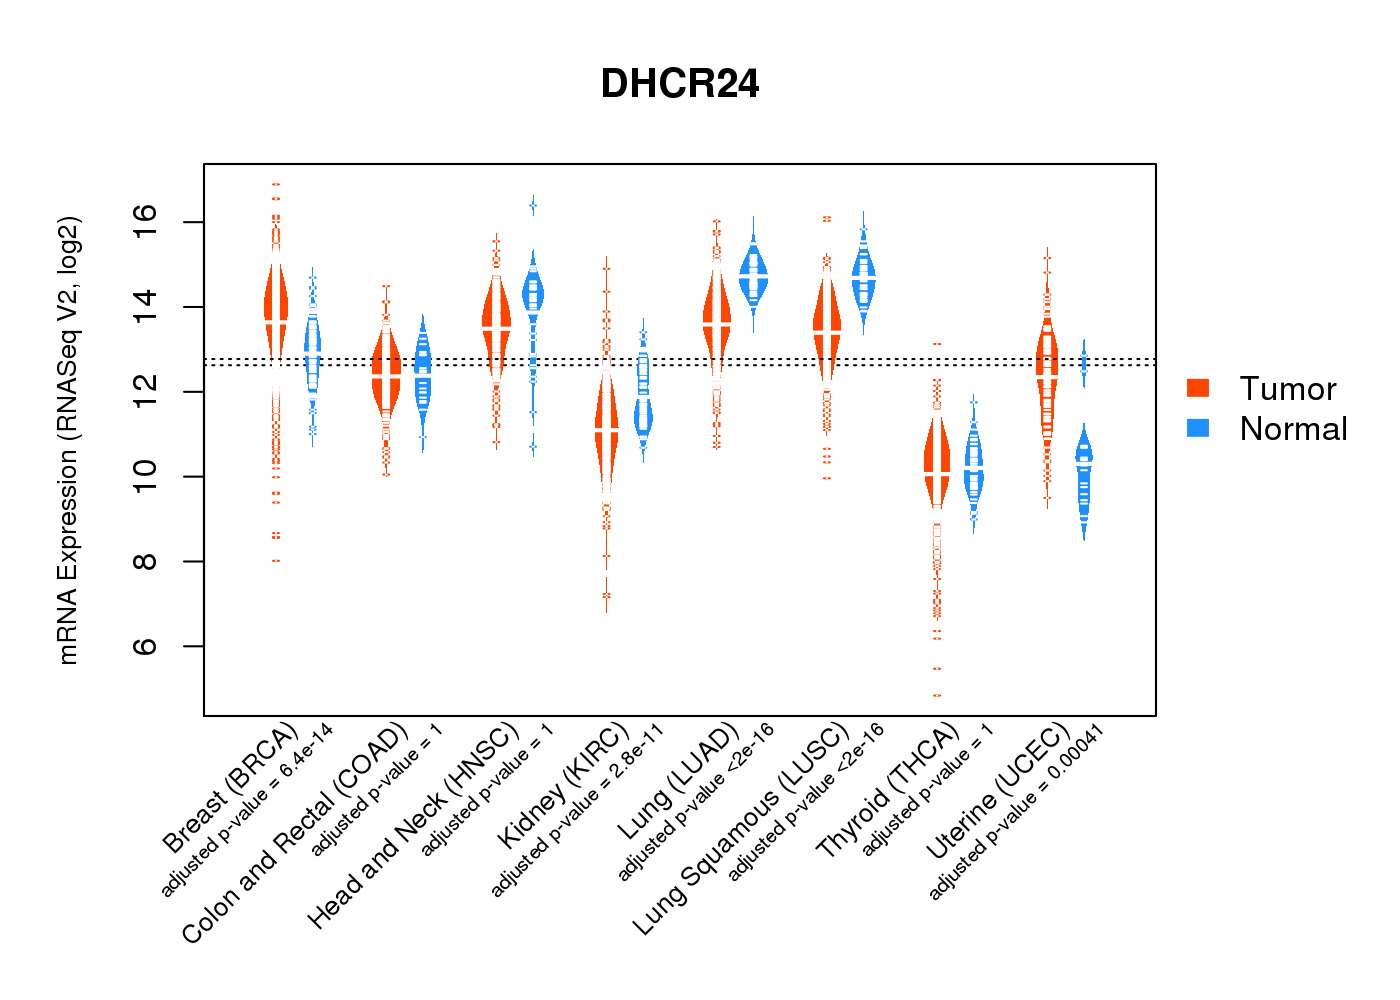
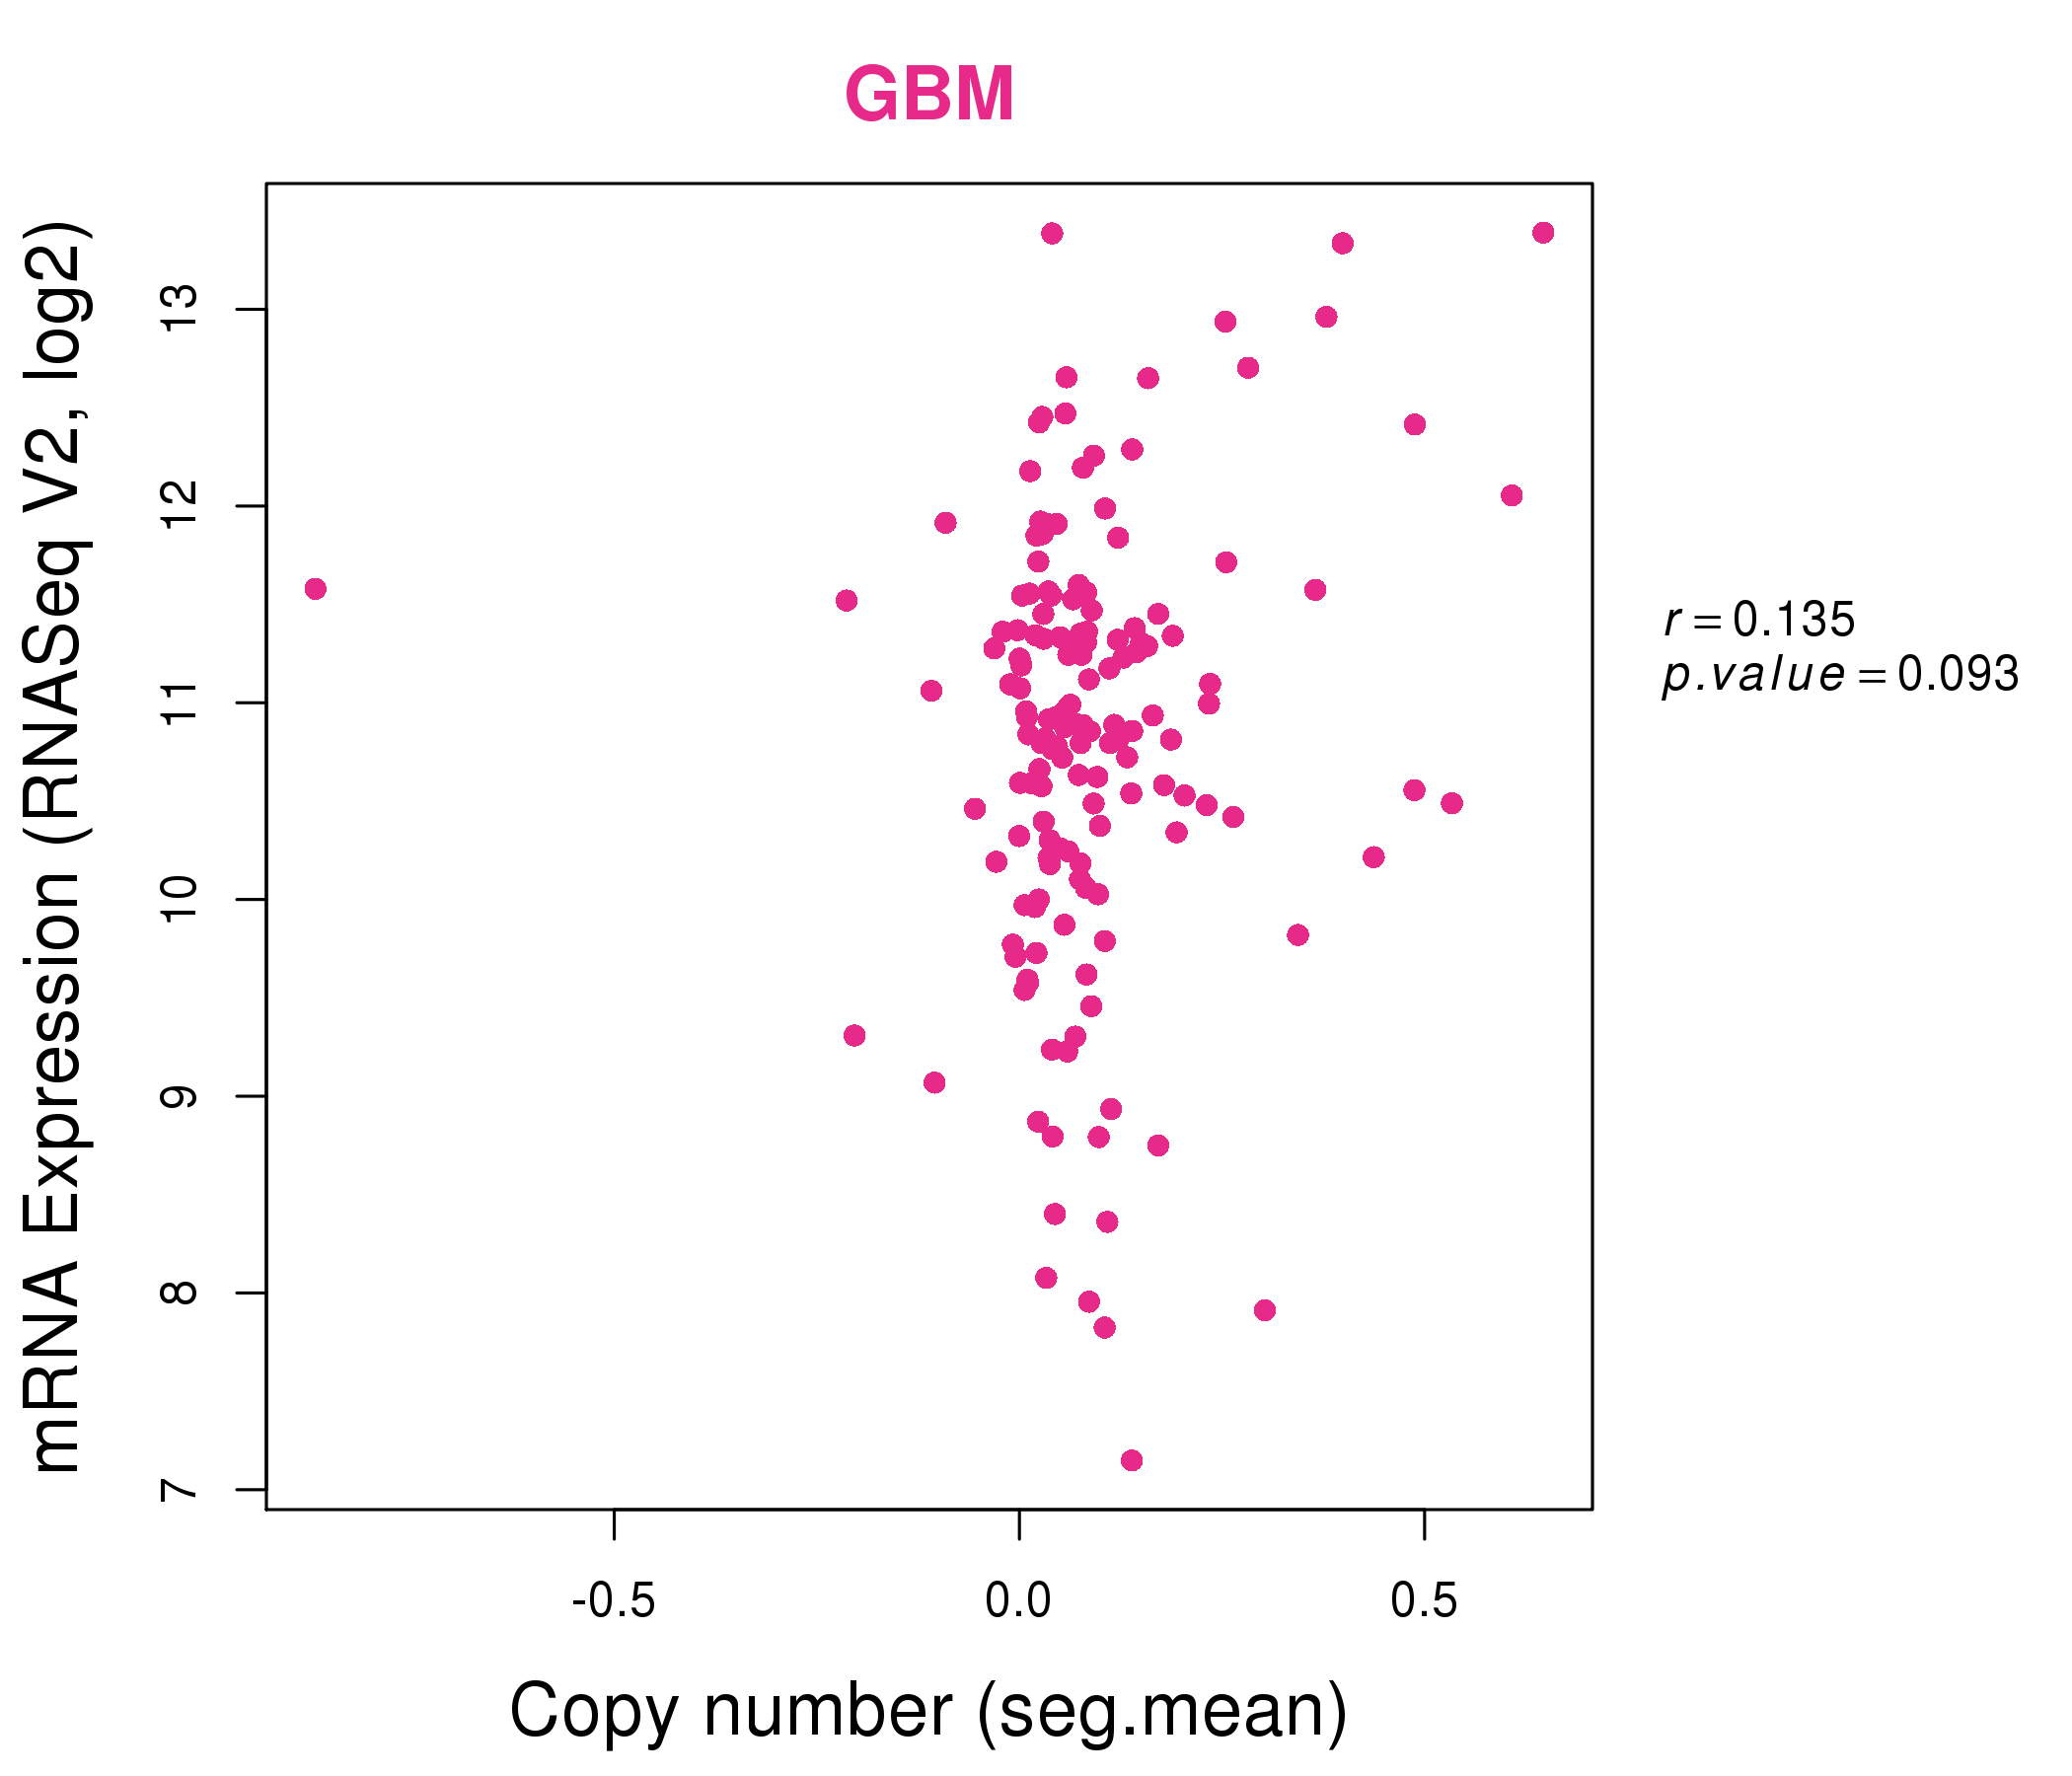
| * Normalized gene expression data of RNASeqV2 was extracted from TCGA using R package TCGA-Assembler. The URLs of all public data files on TCGA DCC data server were gathered at Jan-05-2015. Only eight cancer types have enough normal control samples for differential expression analysis. (t test, adjusted p<0.05 (using Benjamini-Hochberg FDR)) |
 |
| Top |
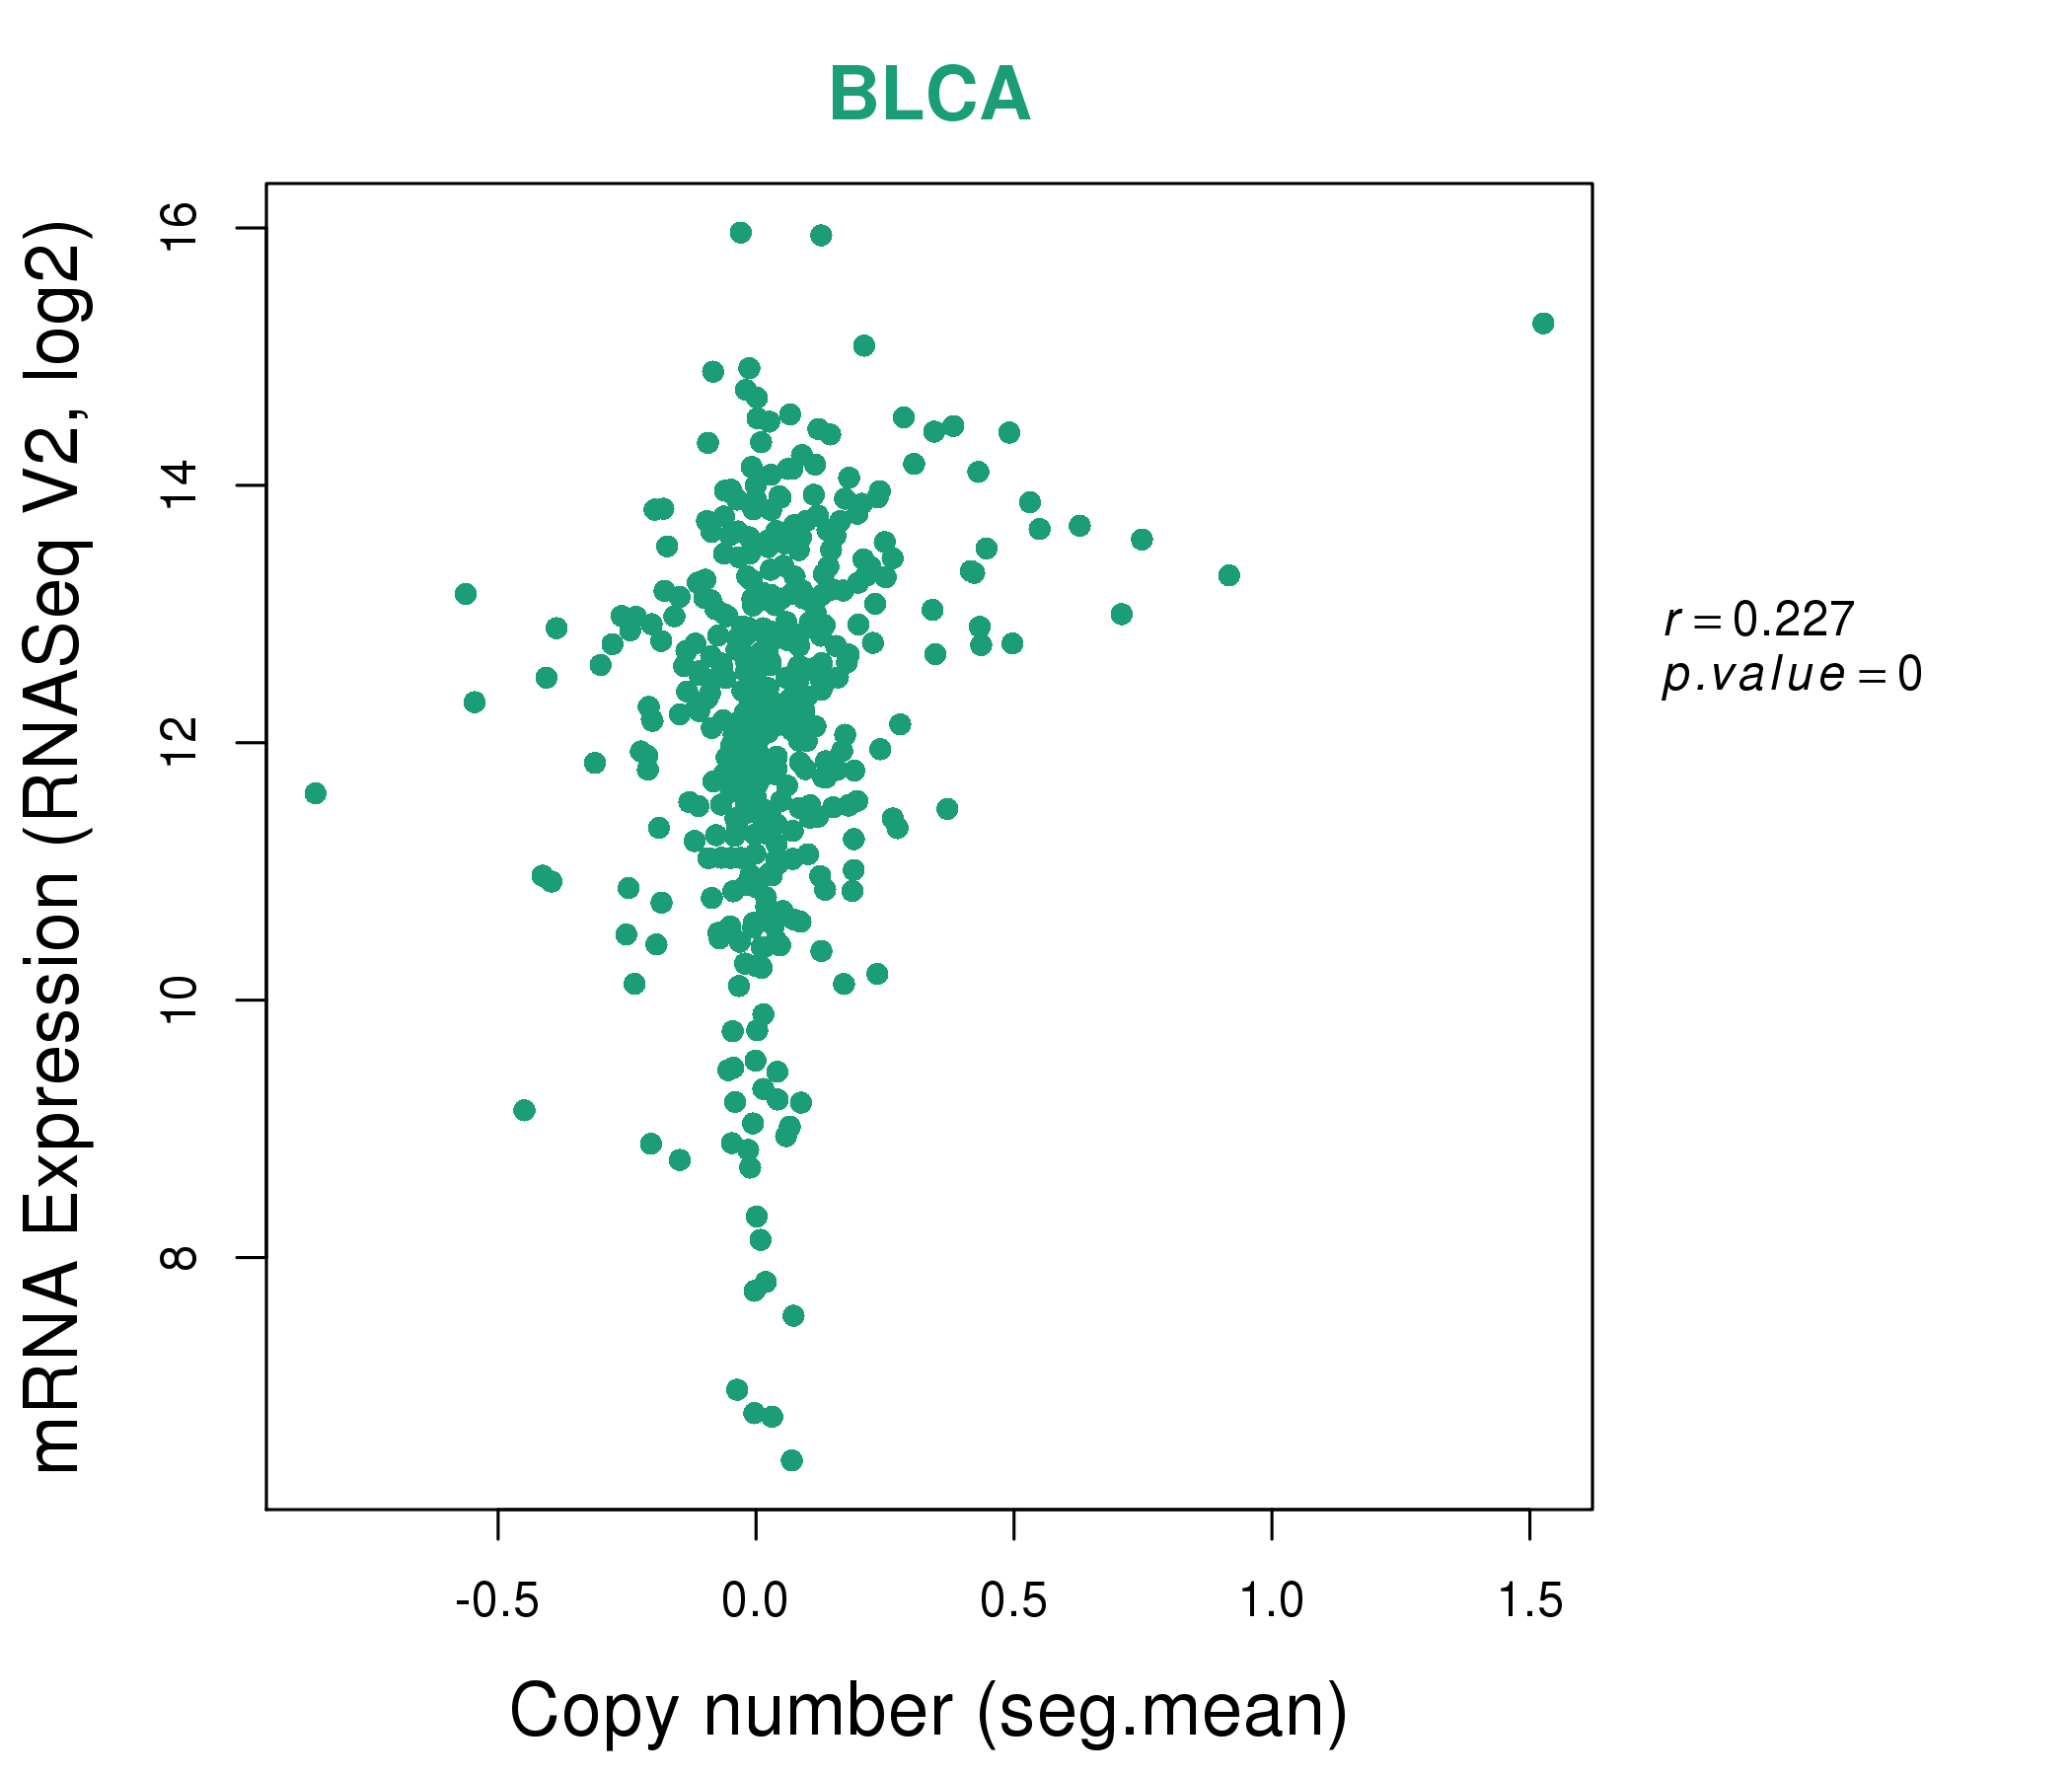
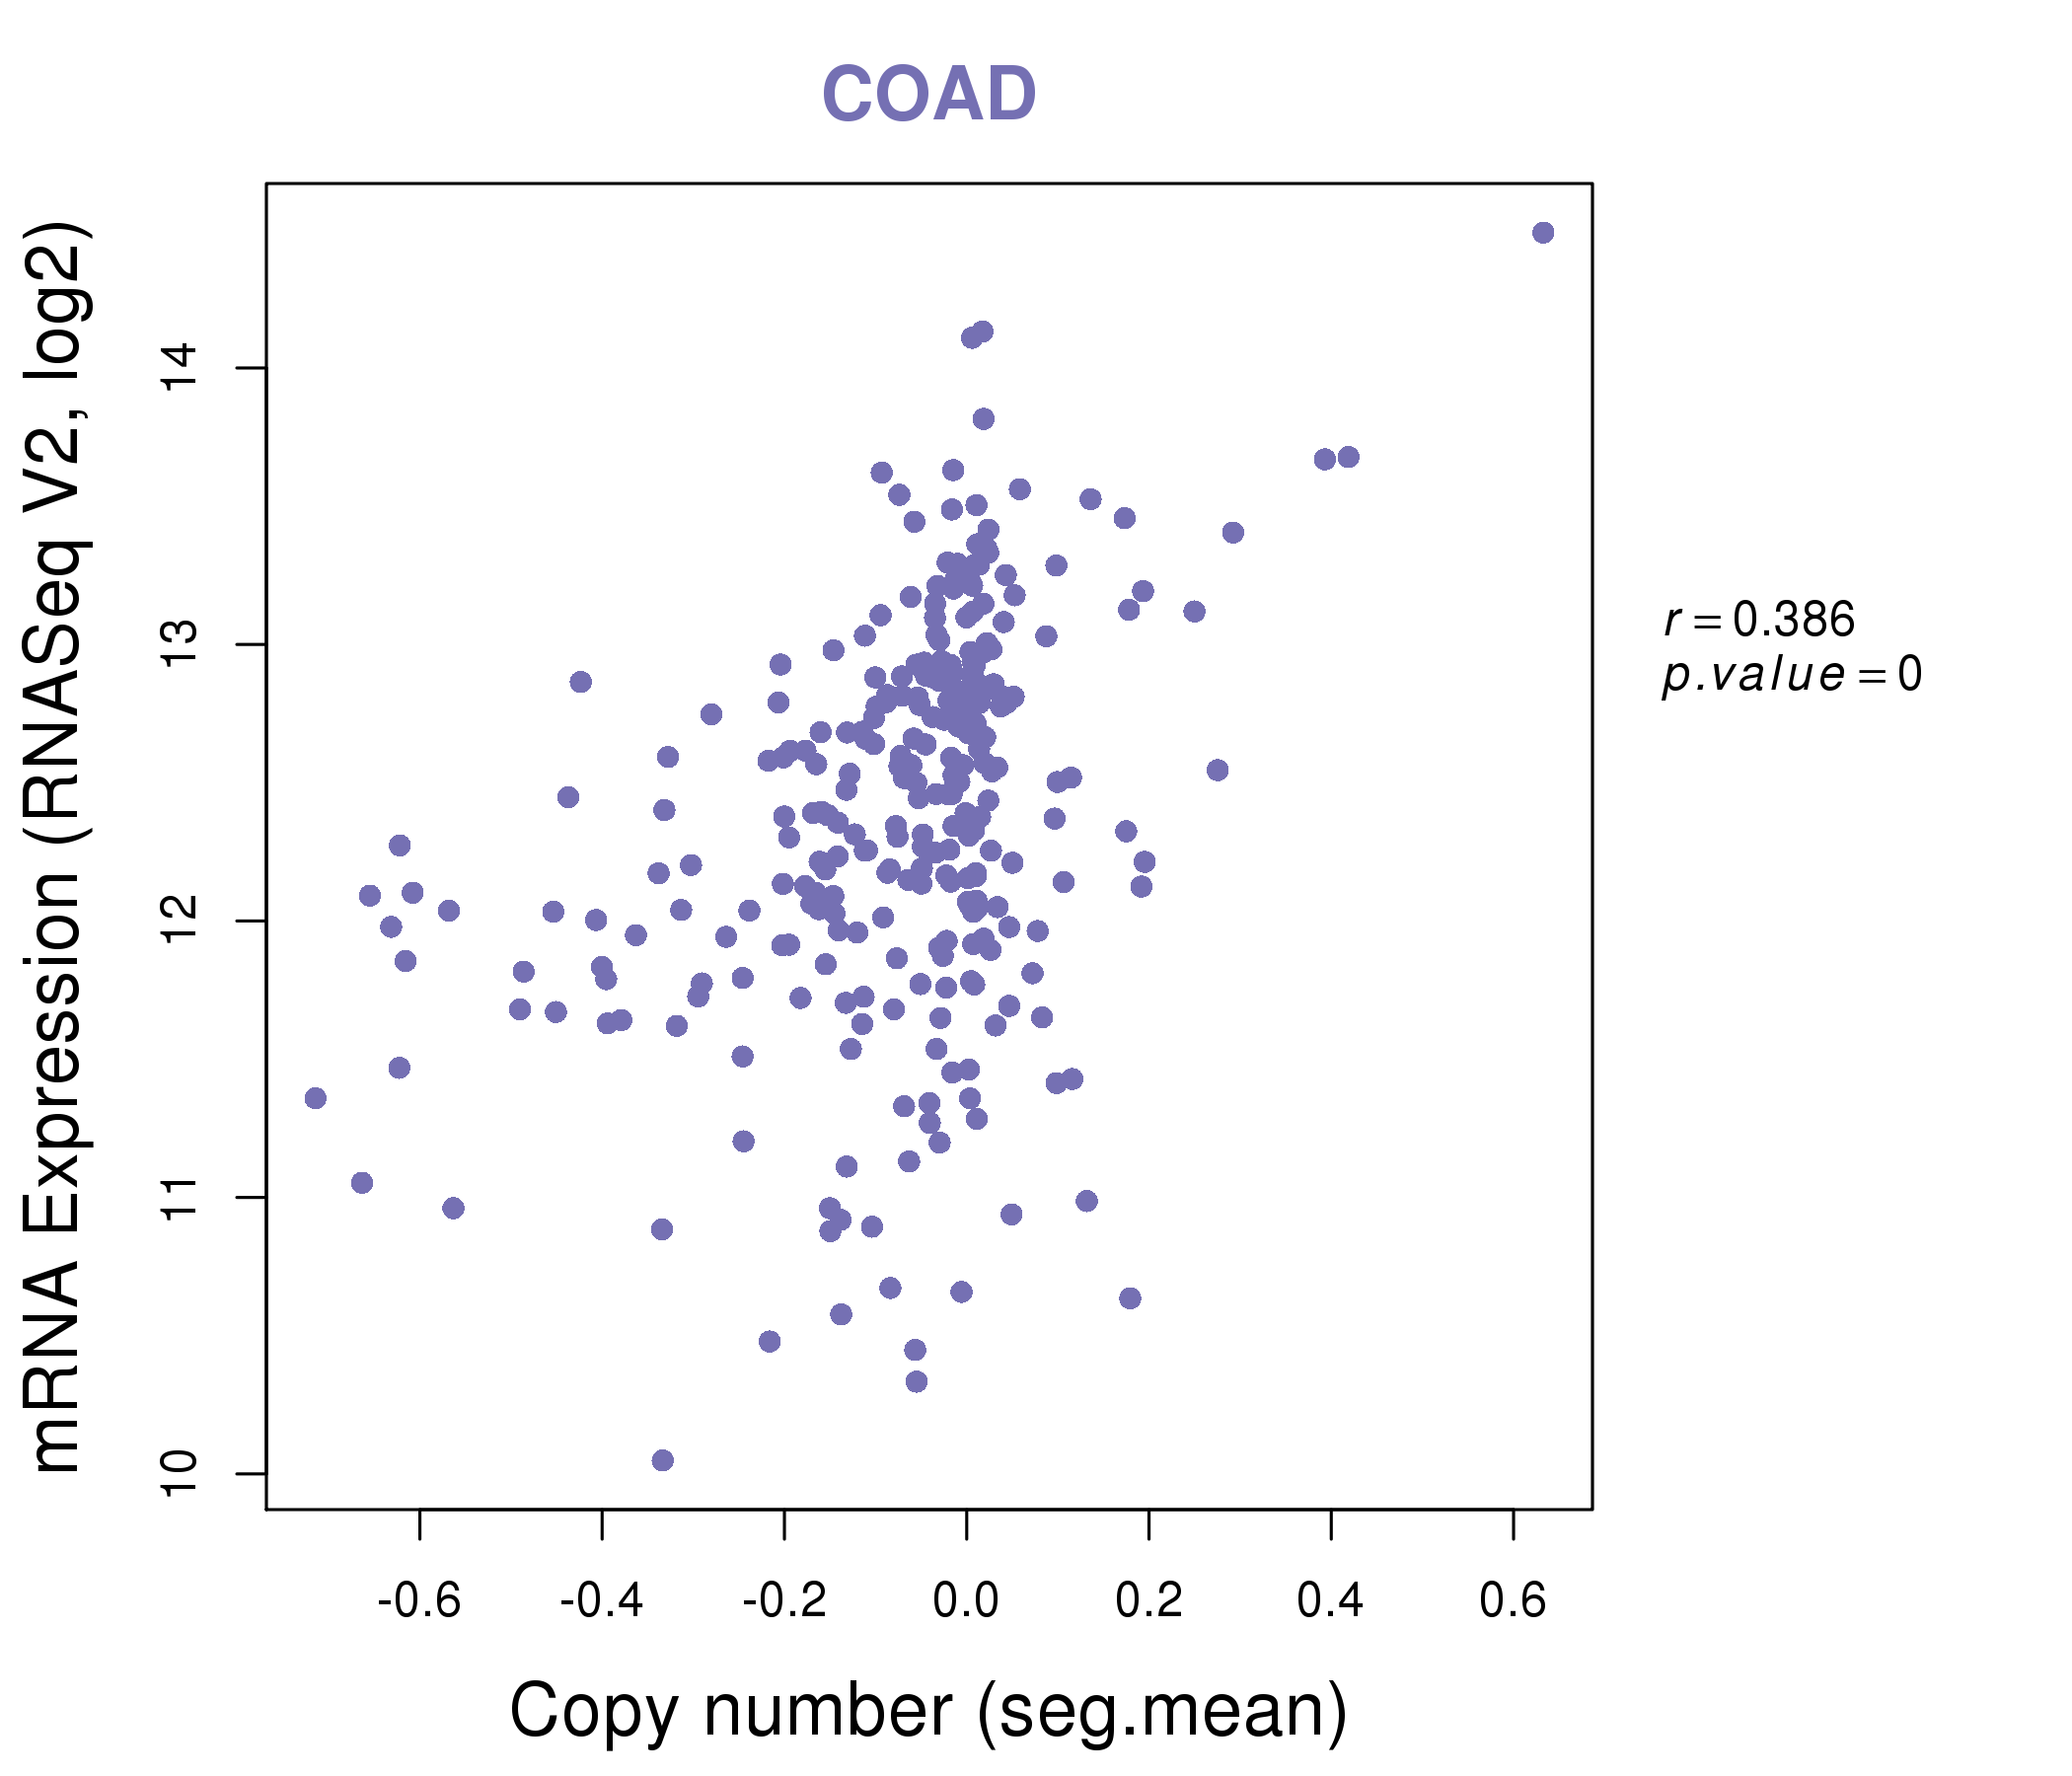
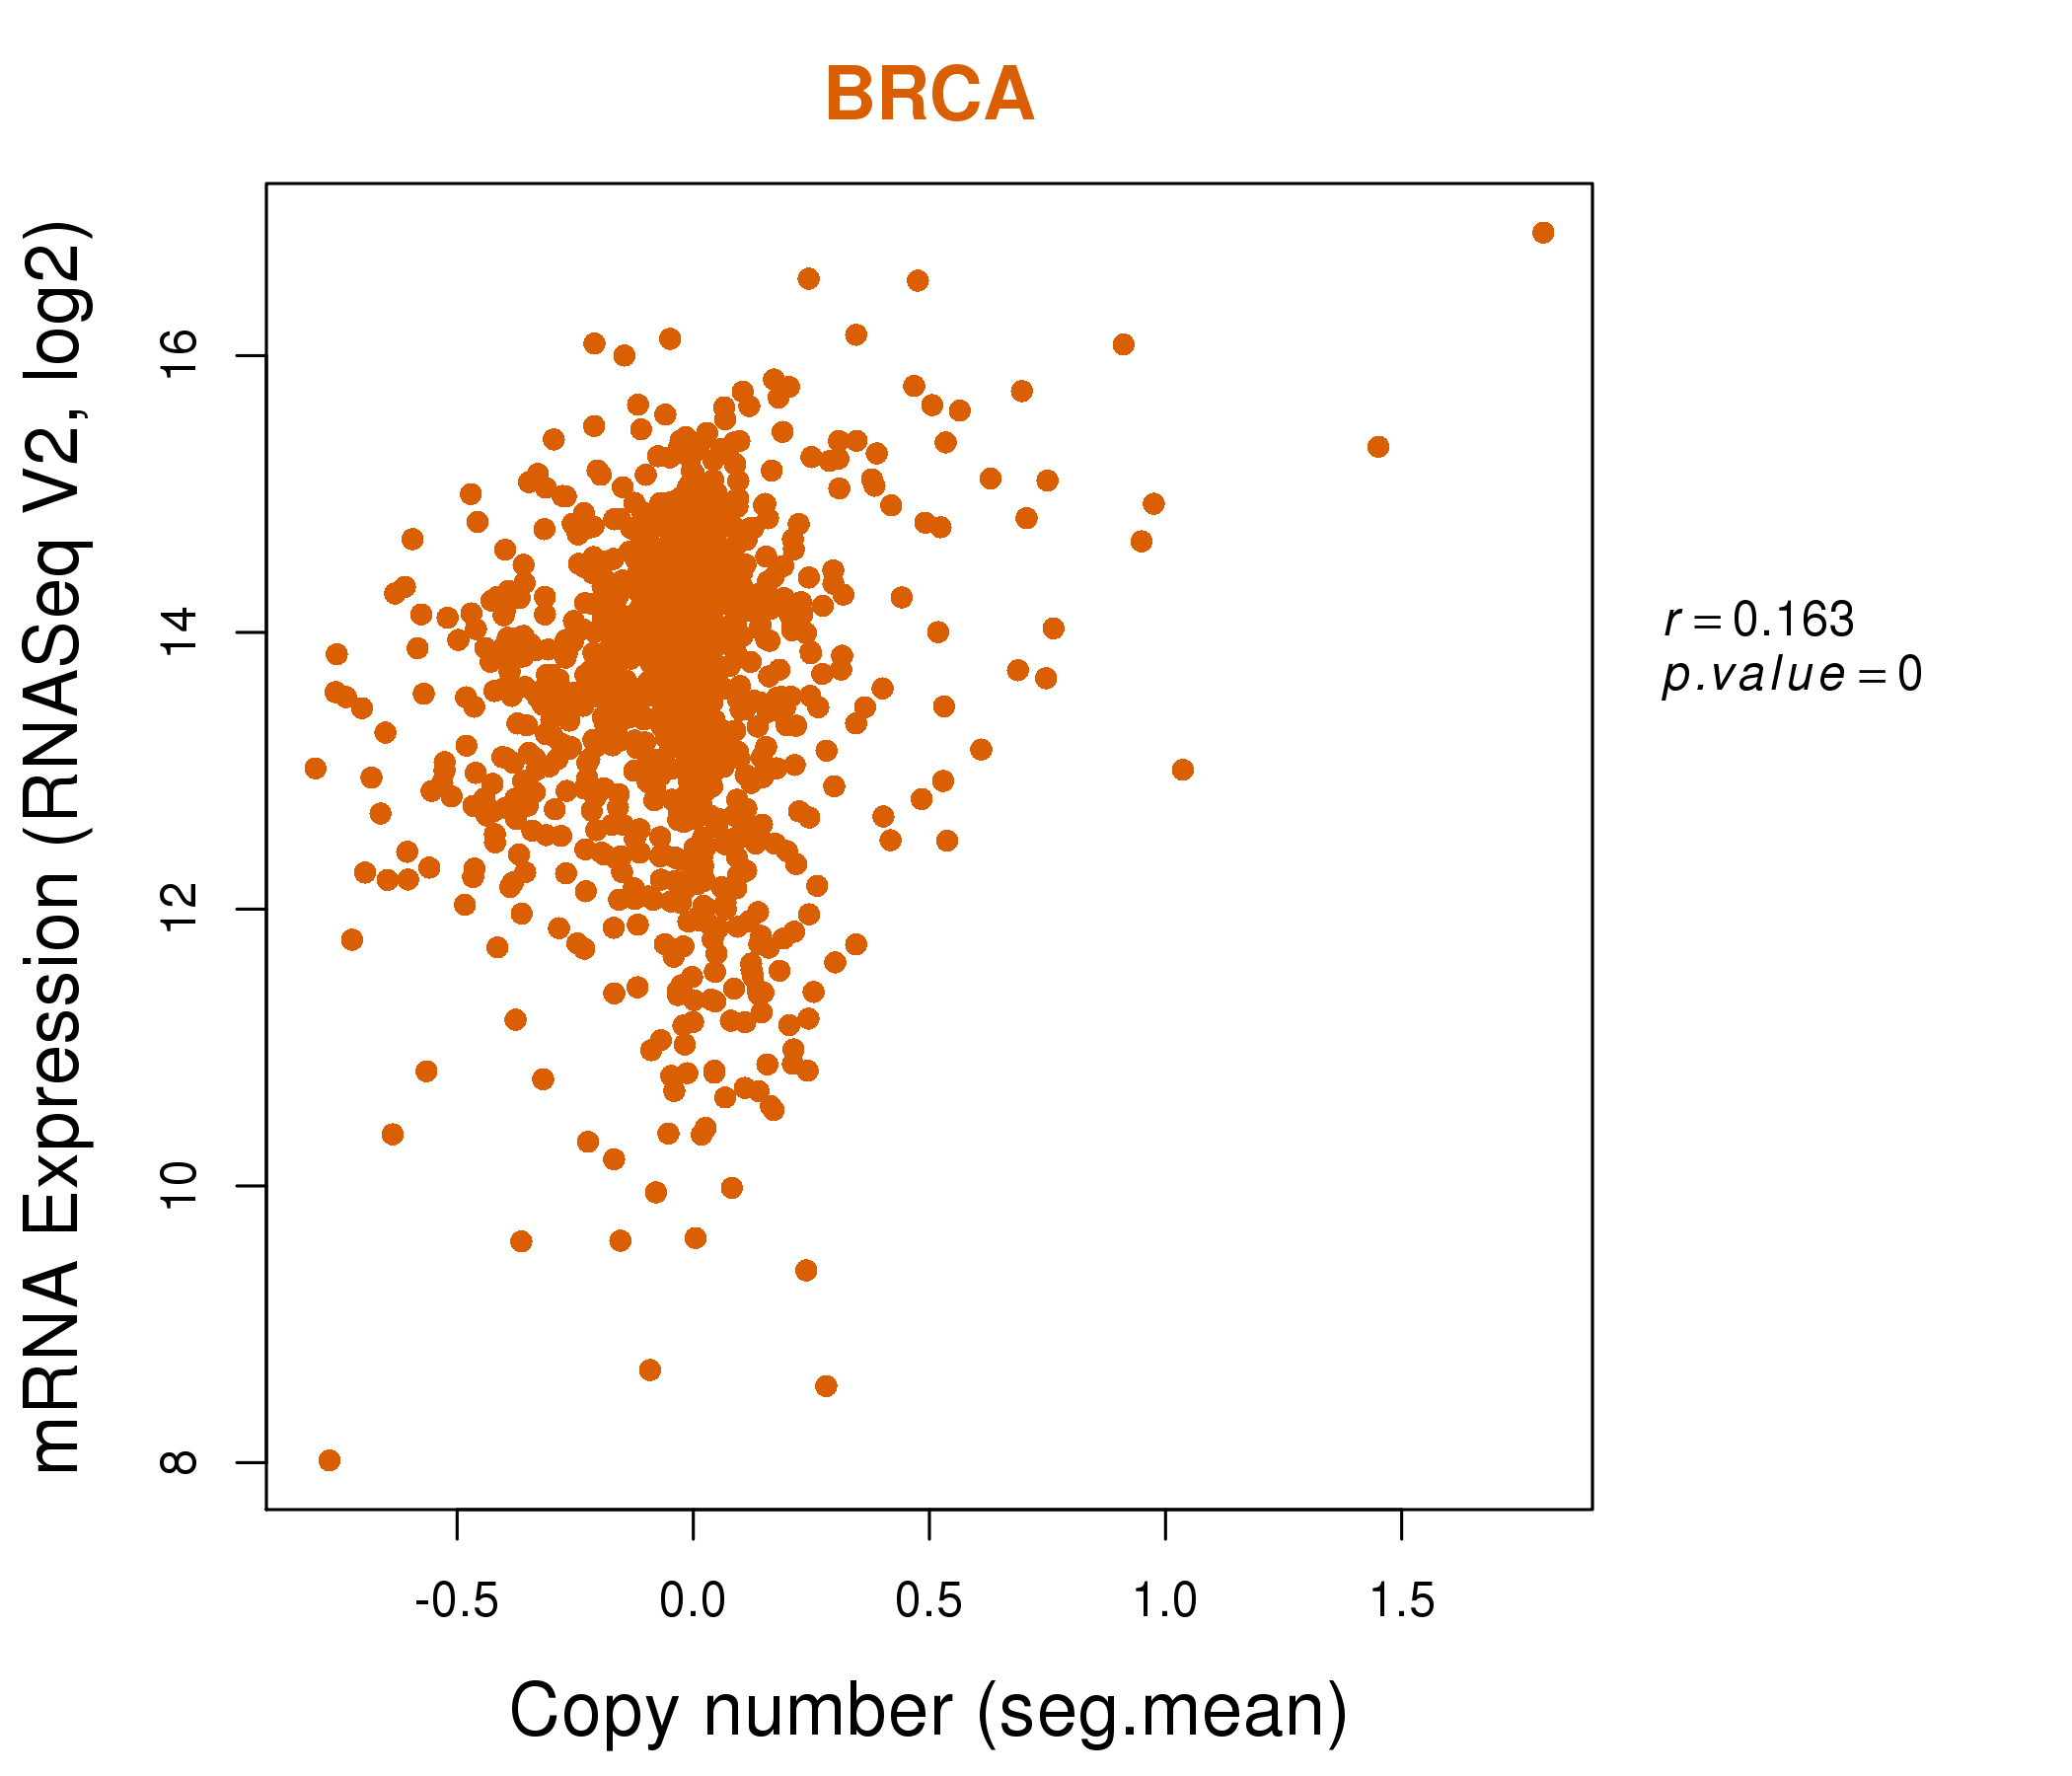
| * This plots show the correlation between CNV and gene expression. |
: Open all plots for all cancer types
 |
|
 |
|
| Top |
| Gene-Gene Network Information |
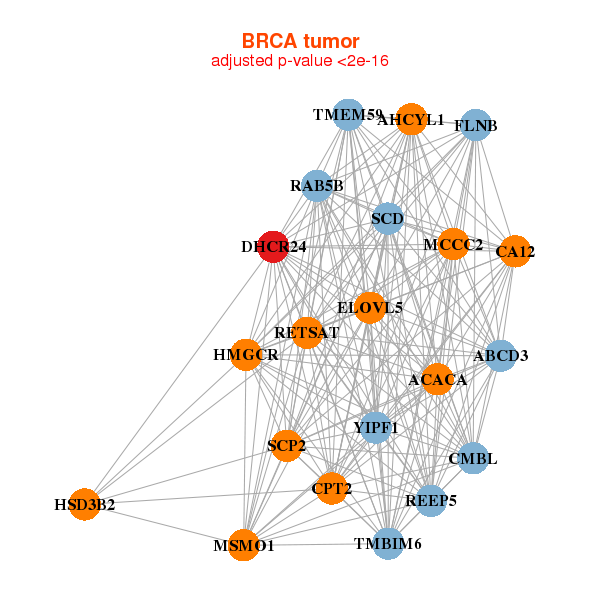
| * Co-Expression network figures were drawn using R package igraph. Only the top 20 genes with the highest correlations were shown. Red circle: input gene, orange circle: cell metabolism gene, sky circle: other gene |
: Open all plots for all cancer types
 |
|
| ABCD3,ACACA,AHCYL1,CA12,CMBL,CPT2,DHCR24, ELOVL5,FLNB,HMGCR,HSD3B2,MCCC2,RAB5B,REEP5, RETSAT,MSMO1,SCD,SCP2,TMBIM6,TMEM59,YIPF1 | ACPP,ALDH3B2,ATP2C2,CYP4Z2P,DHCR24,FAM174B,GPR39, HMGCS2,HRASLS2,CERS4,LPCAT3,MOGAT2,PON3,PTPLAD1, PXMP4,REEP6,SLC38A1,SLC7A8,SULT2B1,TMEM45B,TMEM63C |
 |
|
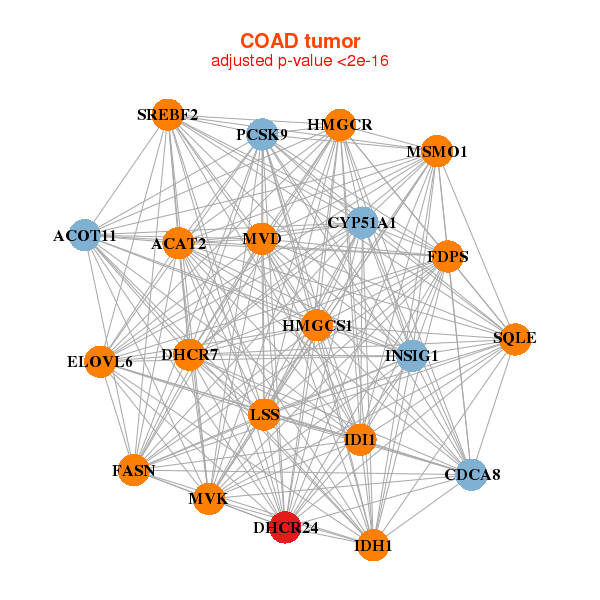
| ACAT2,ACOT11,CDCA8,CYP51A1,DHCR24,DHCR7,ELOVL6, FASN,FDPS,HMGCR,HMGCS1,IDH1,IDI1,INSIG1, LSS,MVD,MVK,PCSK9,MSMO1,SQLE,SREBF2 | ACTR2,APAF1,ARF3,ATP10B,CDCP1,CEACAM1,CEACAM5, CLIC5,CTNNA1,CTNND1,CTTNBP2NL,DHCR24,FDFT1,GPD2, HMGCR,KDM1B,LOC284441,RAB19,SLC44A4,SLCO2A1,USP38 |

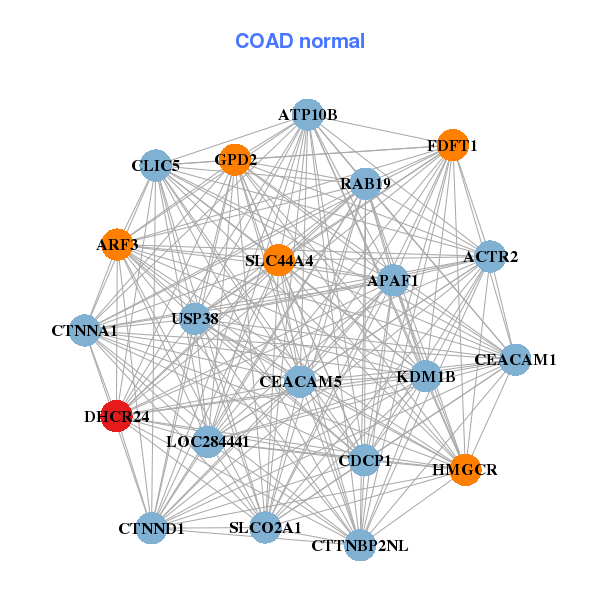
| * Co-Expression network figures were drawn using R package igraph. Only the top 20 genes with the highest correlations were shown. Red circle: input gene, orange circle: cell metabolism gene, sky circle: other gene |
: Open all plots for all cancer types
| Top |
: Open all interacting genes' information including KEGG pathway for all interacting genes from DAVID
| Top |
| Pharmacological Information for DHCR24 |
| There's no related Drug. |
| Top |
| Cross referenced IDs for DHCR24 |
| * We obtained these cross-references from Uniprot database. It covers 150 different DBs, 18 categories. http://www.uniprot.org/help/cross_references_section |
: Open all cross reference information
|
Copyright © 2016-Present - The Univsersity of Texas Health Science Center at Houston @ |