|
||||||||||||||||||||
| |
| Phenotypic Information (metabolism pathway, cancer, disease, phenome) |
| |
| |
| Gene-Gene Network Information: Co-Expression Network, Interacting Genes & KEGG |
| |
|


| Gene Summary for DHPS |
| Basic gene info. | Gene symbol | DHPS |
| Gene name | deoxyhypusine synthase | |
| Synonyms | DHS|DS|MIG13 | |
| Cytomap | UCSC genome browser: 19p13.2 | |
| Genomic location | chr19 :12786530-12792025 | |
| Type of gene | protein-coding | |
| RefGenes | NM_001206974.1, NM_001930.3,NM_013406.2,NR_038192.1,NM_013407.1, | |
| Ensembl id | ENSG00000095059 | |
| Description | migration-inducing gene 13 | |
| Modification date | 20141207 | |
| dbXrefs | MIM : 600944 | |
| HGNC : HGNC | ||
| Ensembl : ENSG00000095059 | ||
| HPRD : 02969 | ||
| Vega : OTTHUMG00000182618 | ||
| Protein | UniProt: go to UniProt's Cross Reference DB Table | |
| Expression | CleanEX: HS_DHPS | |
| BioGPS: 1725 | ||
| Gene Expression Atlas: ENSG00000095059 | ||
| The Human Protein Atlas: ENSG00000095059 | ||
| Pathway | NCI Pathway Interaction Database: DHPS | |
| KEGG: DHPS | ||
| REACTOME: DHPS | ||
| ConsensusPathDB | ||
| Pathway Commons: DHPS | ||
| Metabolism | MetaCyc: DHPS | |
| HUMANCyc: DHPS | ||
| Regulation | Ensembl's Regulation: ENSG00000095059 | |
| miRBase: chr19 :12,786,530-12,792,025 | ||
| TargetScan: NM_001206974 | ||
| cisRED: ENSG00000095059 | ||
| Context | iHOP: DHPS | |
| cancer metabolism search in PubMed: DHPS | ||
| UCL Cancer Institute: DHPS | ||
| Assigned class in ccmGDB | C | |
| Top |
| Phenotypic Information for DHPS(metabolism pathway, cancer, disease, phenome) |
| Cancer | CGAP: DHPS |
| Familial Cancer Database: DHPS | |
| * This gene is included in those cancer gene databases. |
|
|
|
|
|
| . | ||||||||||||||
Oncogene 1 | Significant driver gene in | |||||||||||||||||||
| cf) number; DB name 1 Oncogene; http://nar.oxfordjournals.org/content/35/suppl_1/D721.long, 2 Tumor Suppressor gene; https://bioinfo.uth.edu/TSGene/, 3 Cancer Gene Census; http://www.nature.com/nrc/journal/v4/n3/abs/nrc1299.html, 4 CancerGenes; http://nar.oxfordjournals.org/content/35/suppl_1/D721.long, 5 Network of Cancer Gene; http://ncg.kcl.ac.uk/index.php, 1Therapeutic Vulnerabilities in Cancer; http://cbio.mskcc.org/cancergenomics/statius/ |
| REACTOME_METABOLISM_OF_PROTEINS | |
| OMIM | |
| Orphanet | |
| Disease | KEGG Disease: DHPS |
| MedGen: DHPS (Human Medical Genetics with Condition) | |
| ClinVar: DHPS | |
| Phenotype | MGI: DHPS (International Mouse Phenotyping Consortium) |
| PhenomicDB: DHPS | |
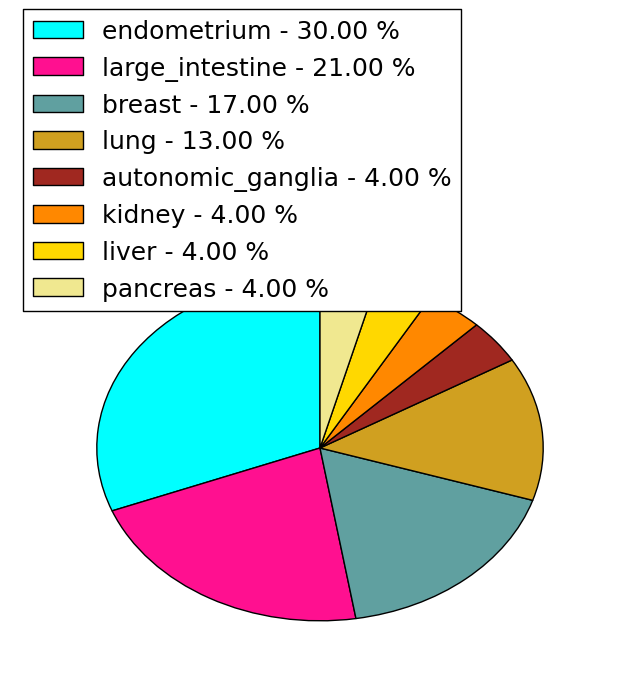
| Mutations for DHPS |
| * Under tables are showing count per each tissue to give us broad intuition about tissue specific mutation patterns.You can go to the detailed page for each mutation database's web site. |
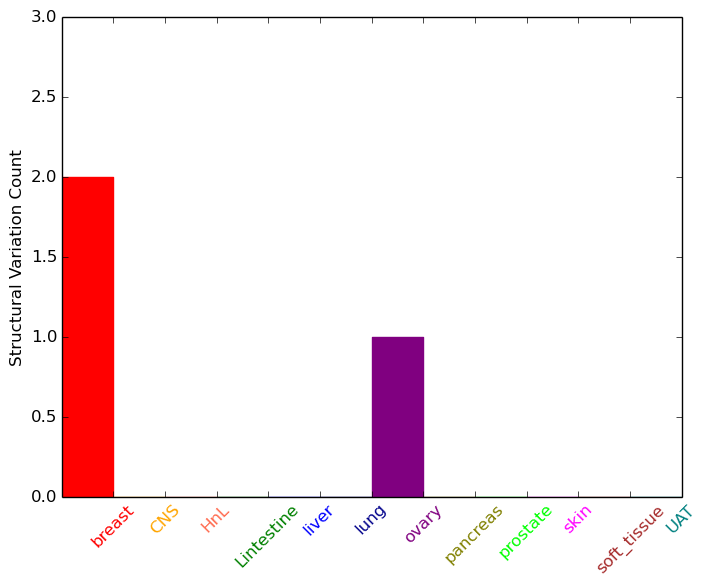
| - Statistics for Tissue and Mutation type | Top |
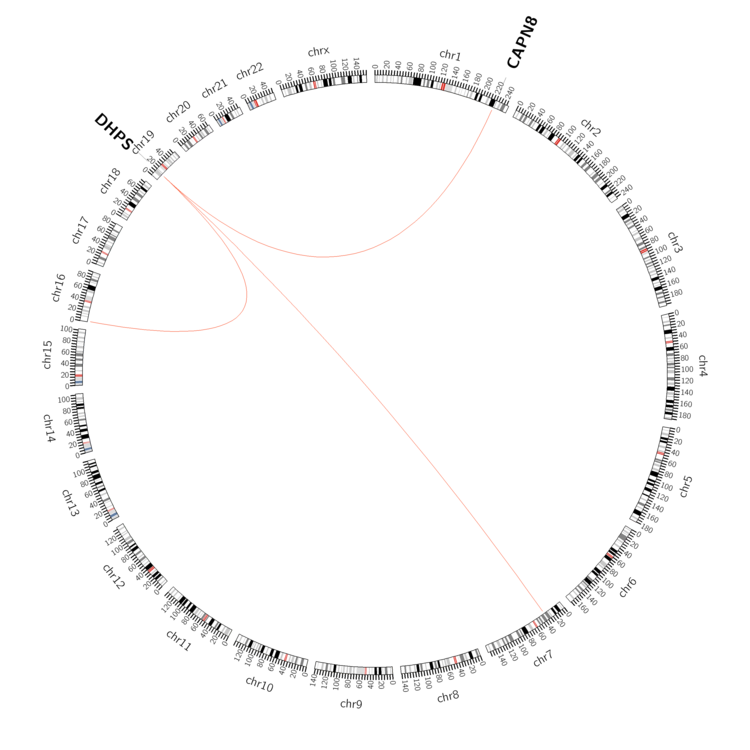 |
| - For Inter-chromosomal Variations |
| * Inter-chromosomal variantions includes 'interchromosomal amplicon to amplicon', 'interchromosomal amplicon to non-amplified dna', 'interchromosomal insertion', 'Interchromosomal unknown type'. |
 |
| - For Intra-chromosomal Variations |
| There's no intra-chromosomal structural variation. |
| Sample | Symbol_a | Chr_a | Start_a | End_a | Symbol_b | Chr_b | Start_b | End_b |
| cf) Tissue number; Tissue name (1;Breast, 2;Central_nervous_system, 3;Haematopoietic_and_lymphoid_tissue, 4;Large_intestine, 5;Liver, 6;Lung, 7;Ovary, 8;Pancreas, 9;Prostate, 10;Skin, 11;Soft_tissue, 12;Upper_aerodigestive_tract) |
| * From mRNA Sanger sequences, Chitars2.0 arranged chimeric transcripts. This table shows DHPS related fusion information. |
| ID | Head Gene | Tail Gene | Accession | Gene_a | qStart_a | qEnd_a | Chromosome_a | tStart_a | tEnd_a | Gene_a | qStart_a | qEnd_a | Chromosome_a | tStart_a | tEnd_a |
| CV364179 | DHPS | 1 | 357 | 19 | 12790436 | 12791114 | DHPS | 351 | 456 | 19 | 12792579 | 12792684 | |
| BQ436553 | WDR83 | 1 | 231 | 19 | 12786543 | 12786856 | DHPS | 228 | 350 | 19 | 12790971 | 12791093 | |
| Top |
| There's no copy number variation information in COSMIC data for this gene. |
| Top |
|
 |
| Top |
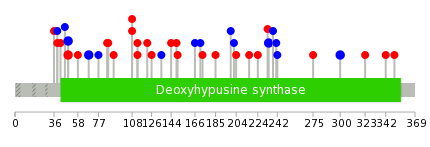
| Stat. for Non-Synonymous SNVs (# total SNVs=23) | (# total SNVs=14) |
 |  |
(# total SNVs=0) | (# total SNVs=0) |
| Top |
| * When you move the cursor on each content, you can see more deailed mutation information on the Tooltip. Those are primary_site,primary_histology,mutation(aa),pubmedID. |
| GRCh37 position | Mutation(aa) | Unique sampleID count |
| chr19:12792434-12792434 | p.F49F | 4 |
| chr19:12792377-12792377 | p.A68A | 2 |
| chr19:12786945-12786945 | p.A300A | 2 |
| chr19:12788187-12788187 | p.P234P | 2 |
| chr19:12790661-12790661 | p.E150K | 2 |
| chr19:12790301-12790301 | p.N216K | 1 |
| chr19:12790704-12790704 | p.V135V | 1 |
| chr19:12786878-12786878 | p.E323K | 1 |
| chr19:12790338-12790338 | p.S204Y | 1 |
| chr19:12790732-12790732 | p.D126G | 1 |
| Top |
|
 |
| Point Mutation/ Tissue ID | 1 | 2 | 3 | 4 | 5 | 6 | 7 | 8 | 9 | 10 | 11 | 12 | 13 | 14 | 15 | 16 | 17 | 18 | 19 | 20 |
| # sample | 1 | 3 | 6 | 4 | 3 | 4 | 6 | |||||||||||||
| # mutation | 1 | 3 | 5 | 4 | 3 | 4 | 8 | |||||||||||||
| nonsynonymous SNV | 1 | 2 | 2 | 2 | 1 | 2 | 7 | |||||||||||||
| synonymous SNV | 1 | 3 | 2 | 2 | 2 | 1 |
| cf) Tissue ID; Tissue type (1; BLCA[Bladder Urothelial Carcinoma], 2; BRCA[Breast invasive carcinoma], 3; CESC[Cervical squamous cell carcinoma and endocervical adenocarcinoma], 4; COAD[Colon adenocarcinoma], 5; GBM[Glioblastoma multiforme], 6; Glioma Low Grade, 7; HNSC[Head and Neck squamous cell carcinoma], 8; KICH[Kidney Chromophobe], 9; KIRC[Kidney renal clear cell carcinoma], 10; KIRP[Kidney renal papillary cell carcinoma], 11; LAML[Acute Myeloid Leukemia], 12; LUAD[Lung adenocarcinoma], 13; LUSC[Lung squamous cell carcinoma], 14; OV[Ovarian serous cystadenocarcinoma ], 15; PAAD[Pancreatic adenocarcinoma], 16; PRAD[Prostate adenocarcinoma], 17; SKCM[Skin Cutaneous Melanoma], 18:STAD[Stomach adenocarcinoma], 19:THCA[Thyroid carcinoma], 20:UCEC[Uterine Corpus Endometrial Carcinoma]) |
| Top |
| * We represented just top 10 SNVs. When you move the cursor on each content, you can see more deailed mutation information on the Tooltip. Those are primary_site, primary_histology, mutation(aa), pubmedID. |
| Genomic Position | Mutation(aa) | Unique sampleID count |
| chr19:12790515 | p.V129V,DHPS | 2 |
| chr19:12790530 | p.A258A,DHPS | 1 |
| chr19:12792434 | p.I66M,DHPS | 1 |
| chr19:12786945 | p.C233Y,DHPS | 1 |
| chr19:12790661 | p.R49H,DHPS | 1 |
| chr19:12792443 | p.G200G,DHPS | 1 |
| chr19:12787986 | p.D44N,DHPS | 1 |
| chr19:12790732 | p.L199L,DHPS | 1 |
| chr19:12792464 | p.L35L,DHPS | 1 |
| chr19:12788163 | p.D196D,DHPS | 1 |
| * Copy number data were extracted from TCGA using R package TCGA-Assembler. The URLs of all public data files on TCGA DCC data server were gathered on Jan-05-2015. Function ProcessCNAData in TCGA-Assembler package was used to obtain gene-level copy number value which is calculated as the average copy number of the genomic region of a gene. |
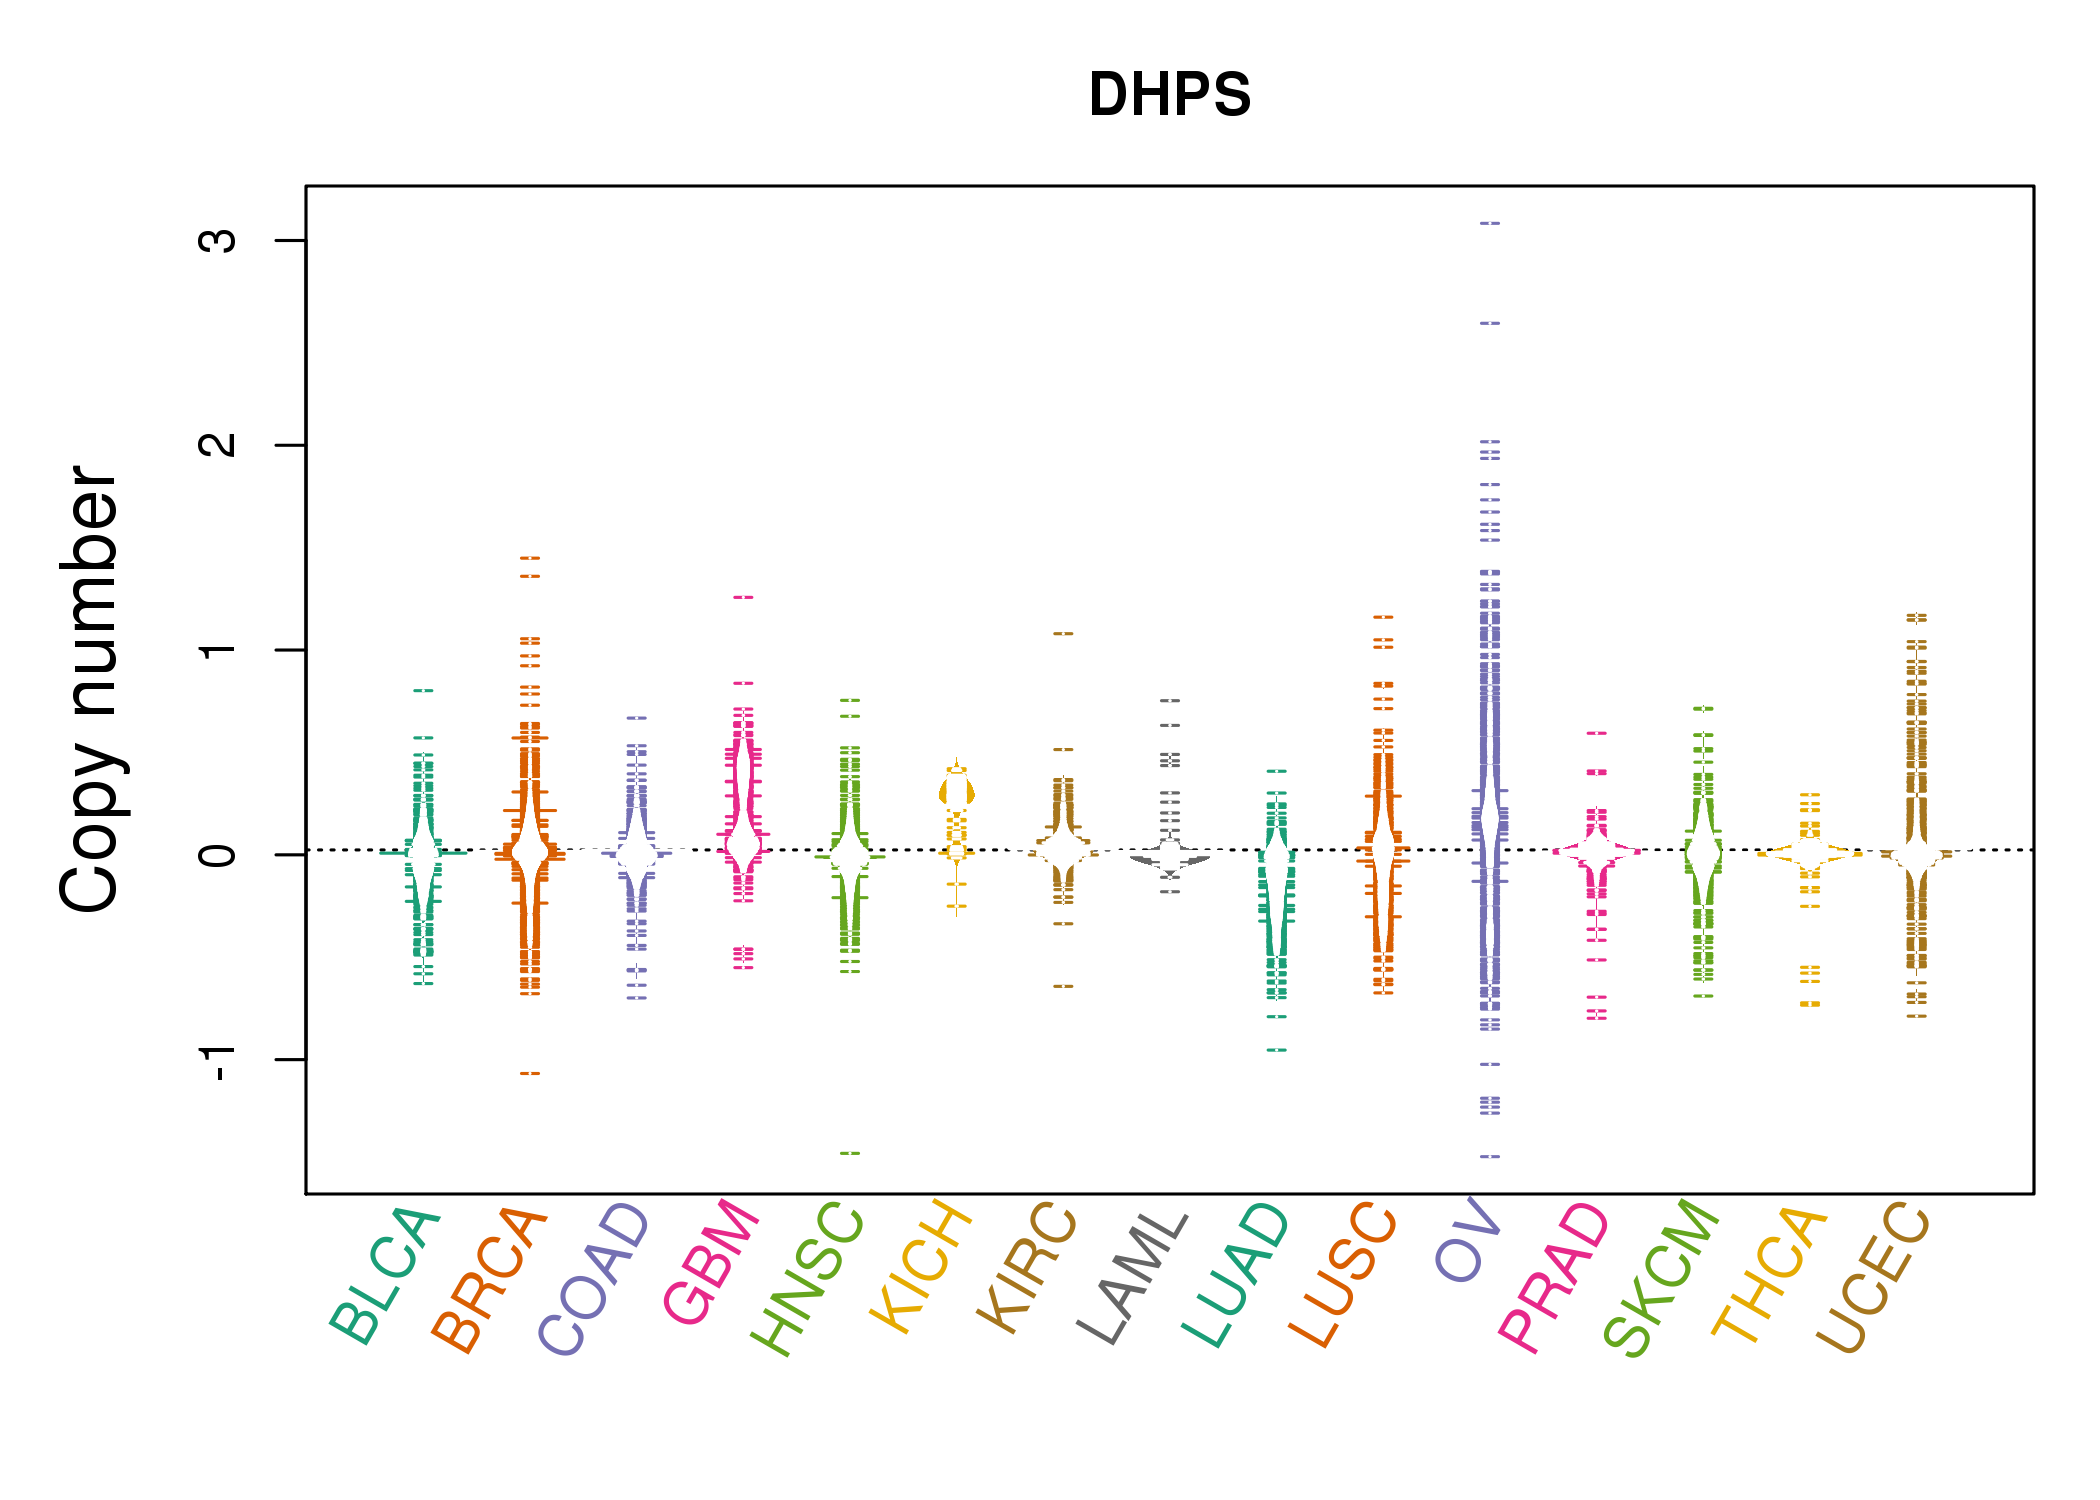 |
| cf) Tissue ID[Tissue type]: BLCA[Bladder Urothelial Carcinoma], BRCA[Breast invasive carcinoma], CESC[Cervical squamous cell carcinoma and endocervical adenocarcinoma], COAD[Colon adenocarcinoma], GBM[Glioblastoma multiforme], Glioma Low Grade, HNSC[Head and Neck squamous cell carcinoma], KICH[Kidney Chromophobe], KIRC[Kidney renal clear cell carcinoma], KIRP[Kidney renal papillary cell carcinoma], LAML[Acute Myeloid Leukemia], LUAD[Lung adenocarcinoma], LUSC[Lung squamous cell carcinoma], OV[Ovarian serous cystadenocarcinoma ], PAAD[Pancreatic adenocarcinoma], PRAD[Prostate adenocarcinoma], SKCM[Skin Cutaneous Melanoma], STAD[Stomach adenocarcinoma], THCA[Thyroid carcinoma], UCEC[Uterine Corpus Endometrial Carcinoma] |
| Top |
| Gene Expression for DHPS |
| * CCLE gene expression data were extracted from CCLE_Expression_Entrez_2012-10-18.res: Gene-centric RMA-normalized mRNA expression data. |
 |
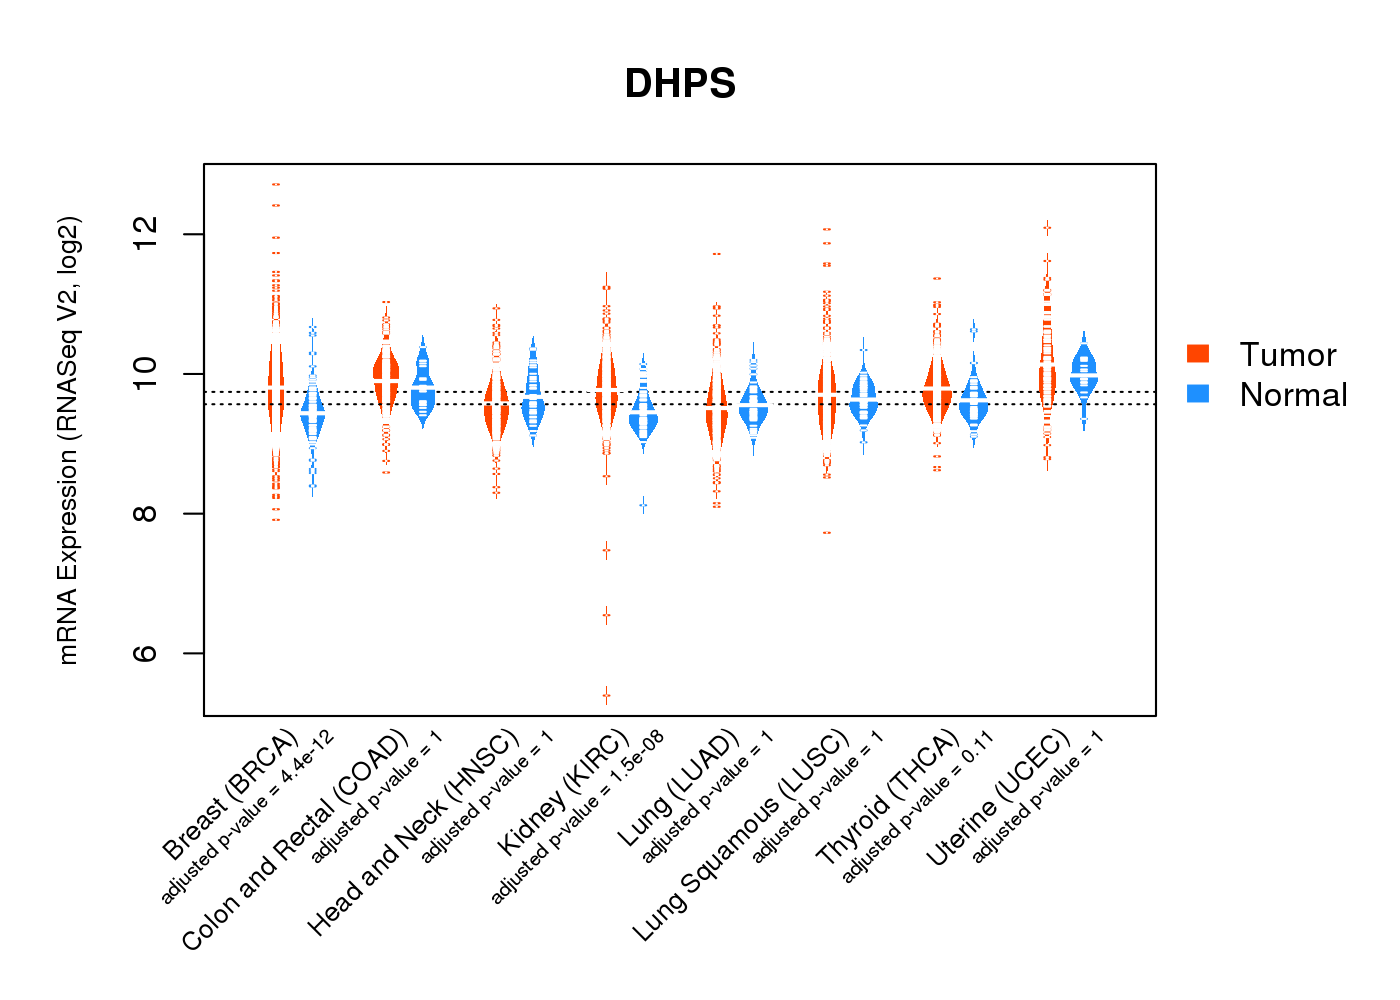
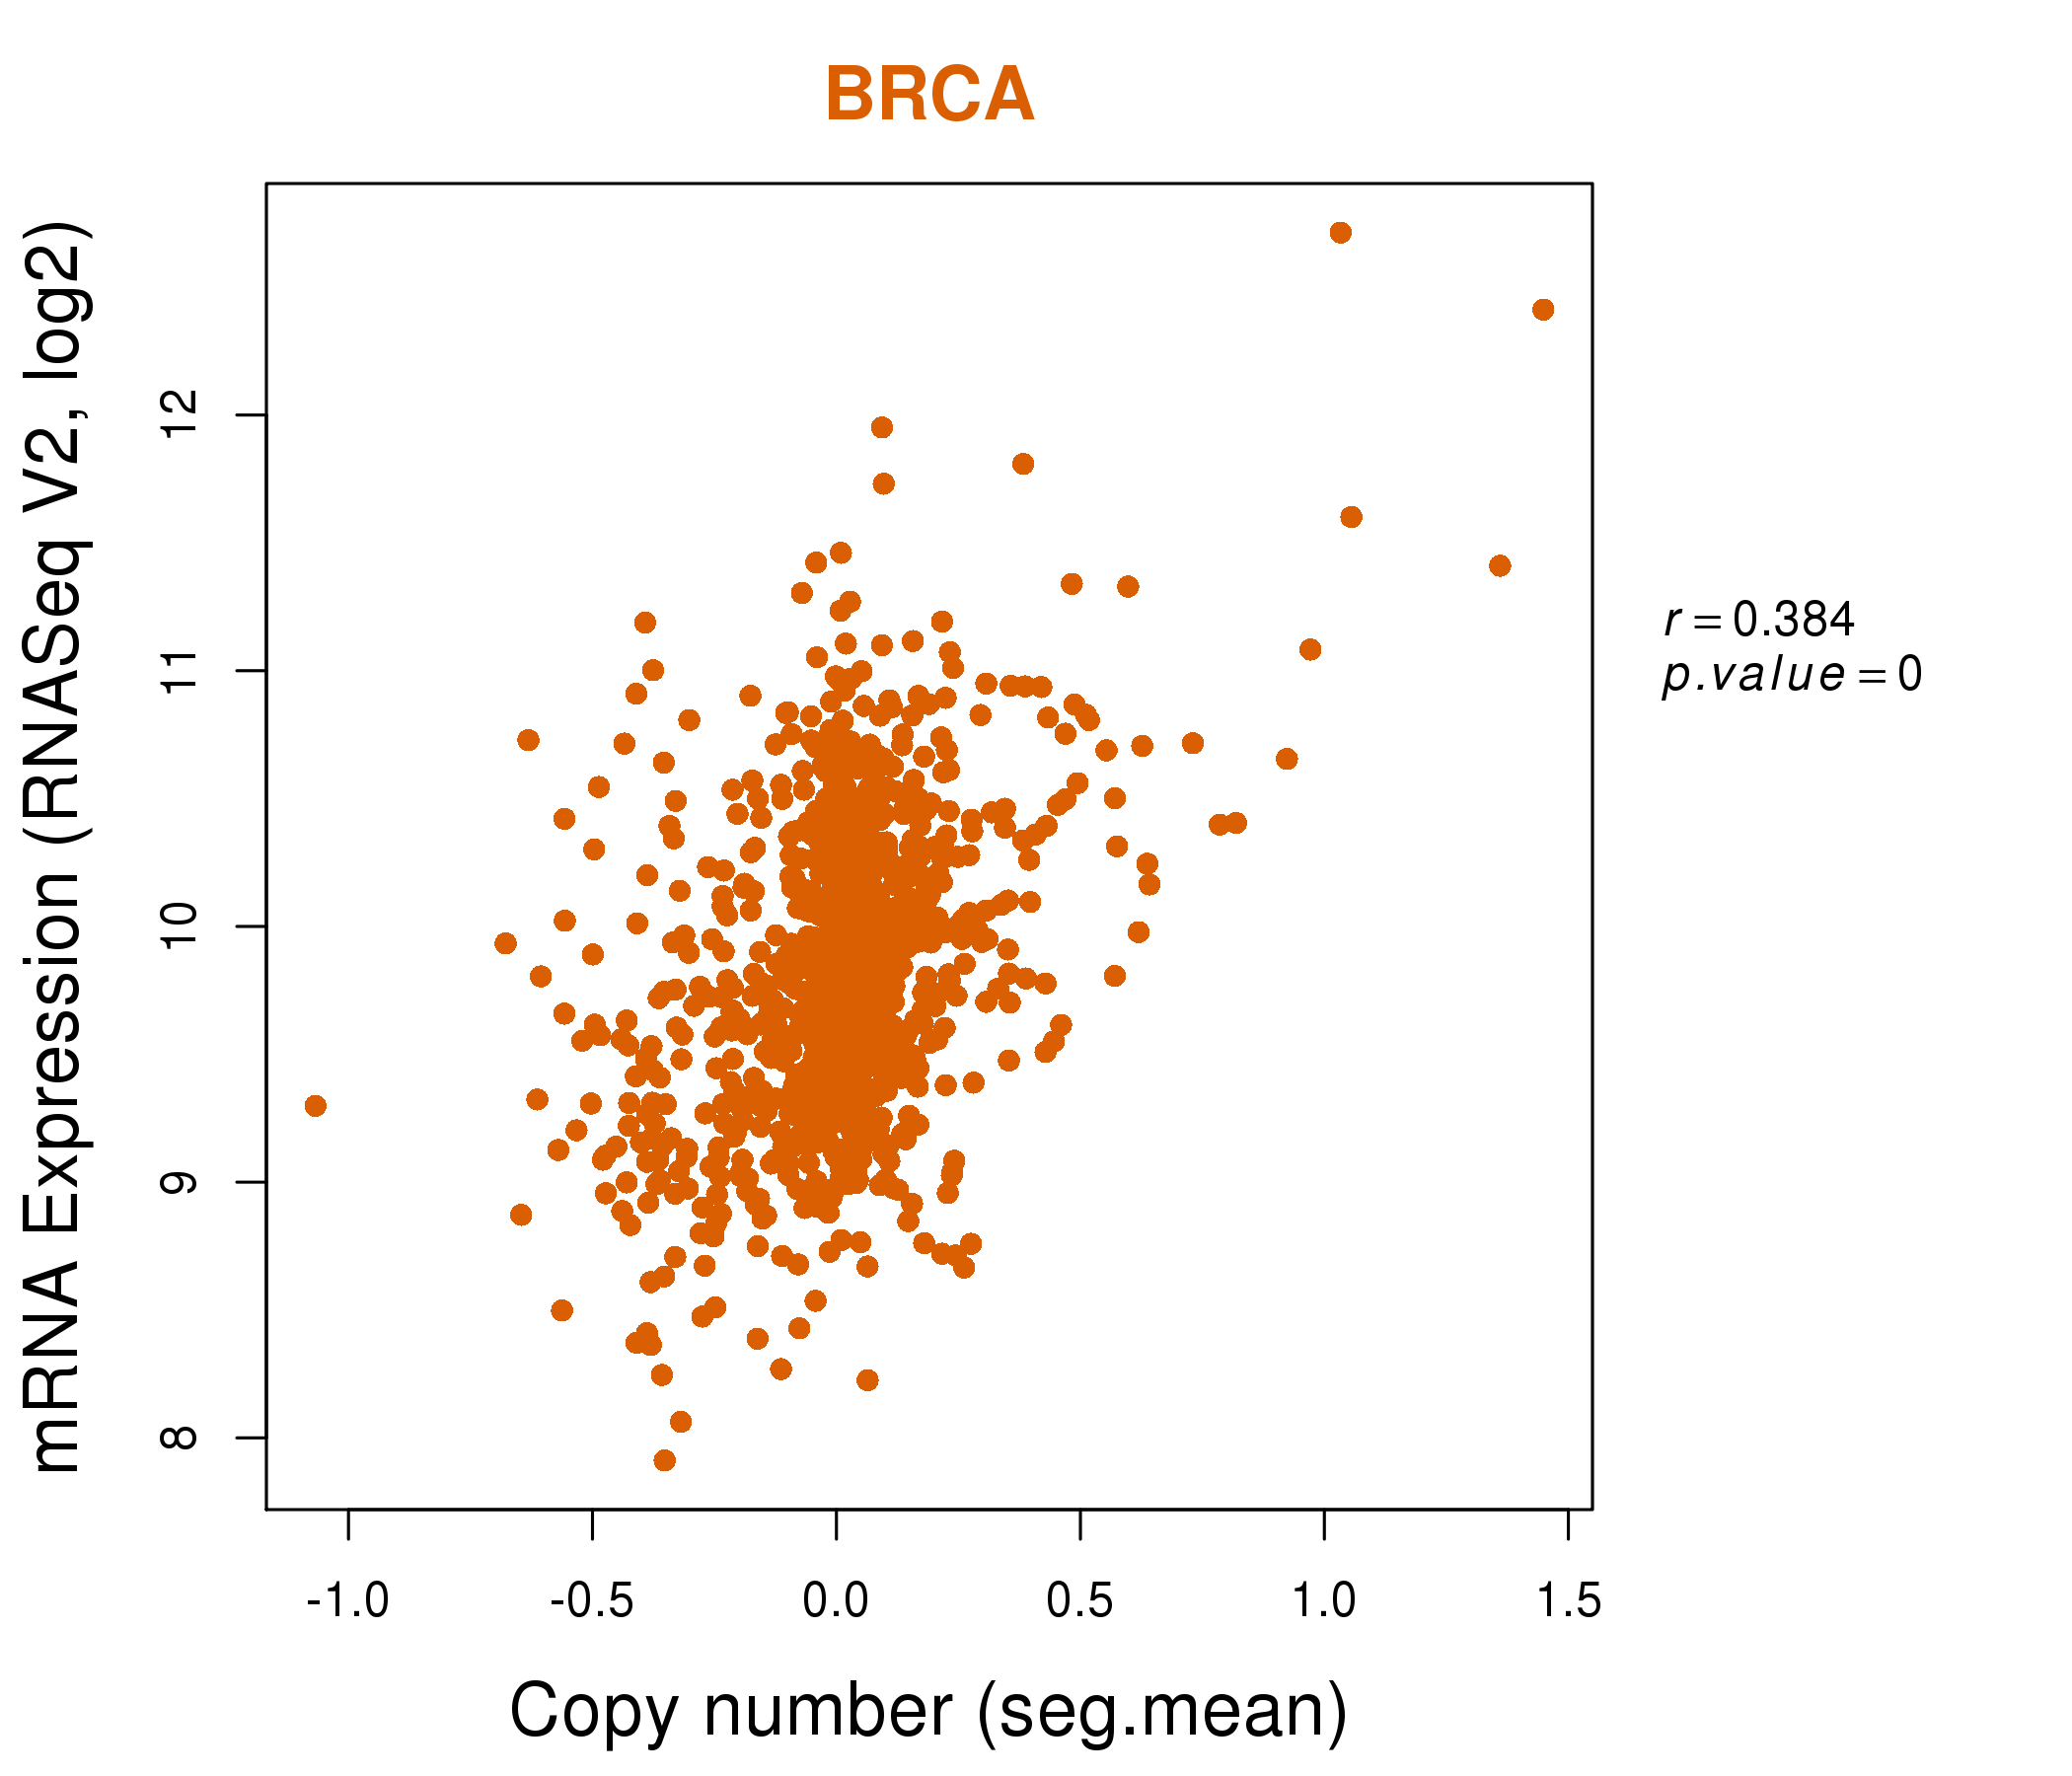
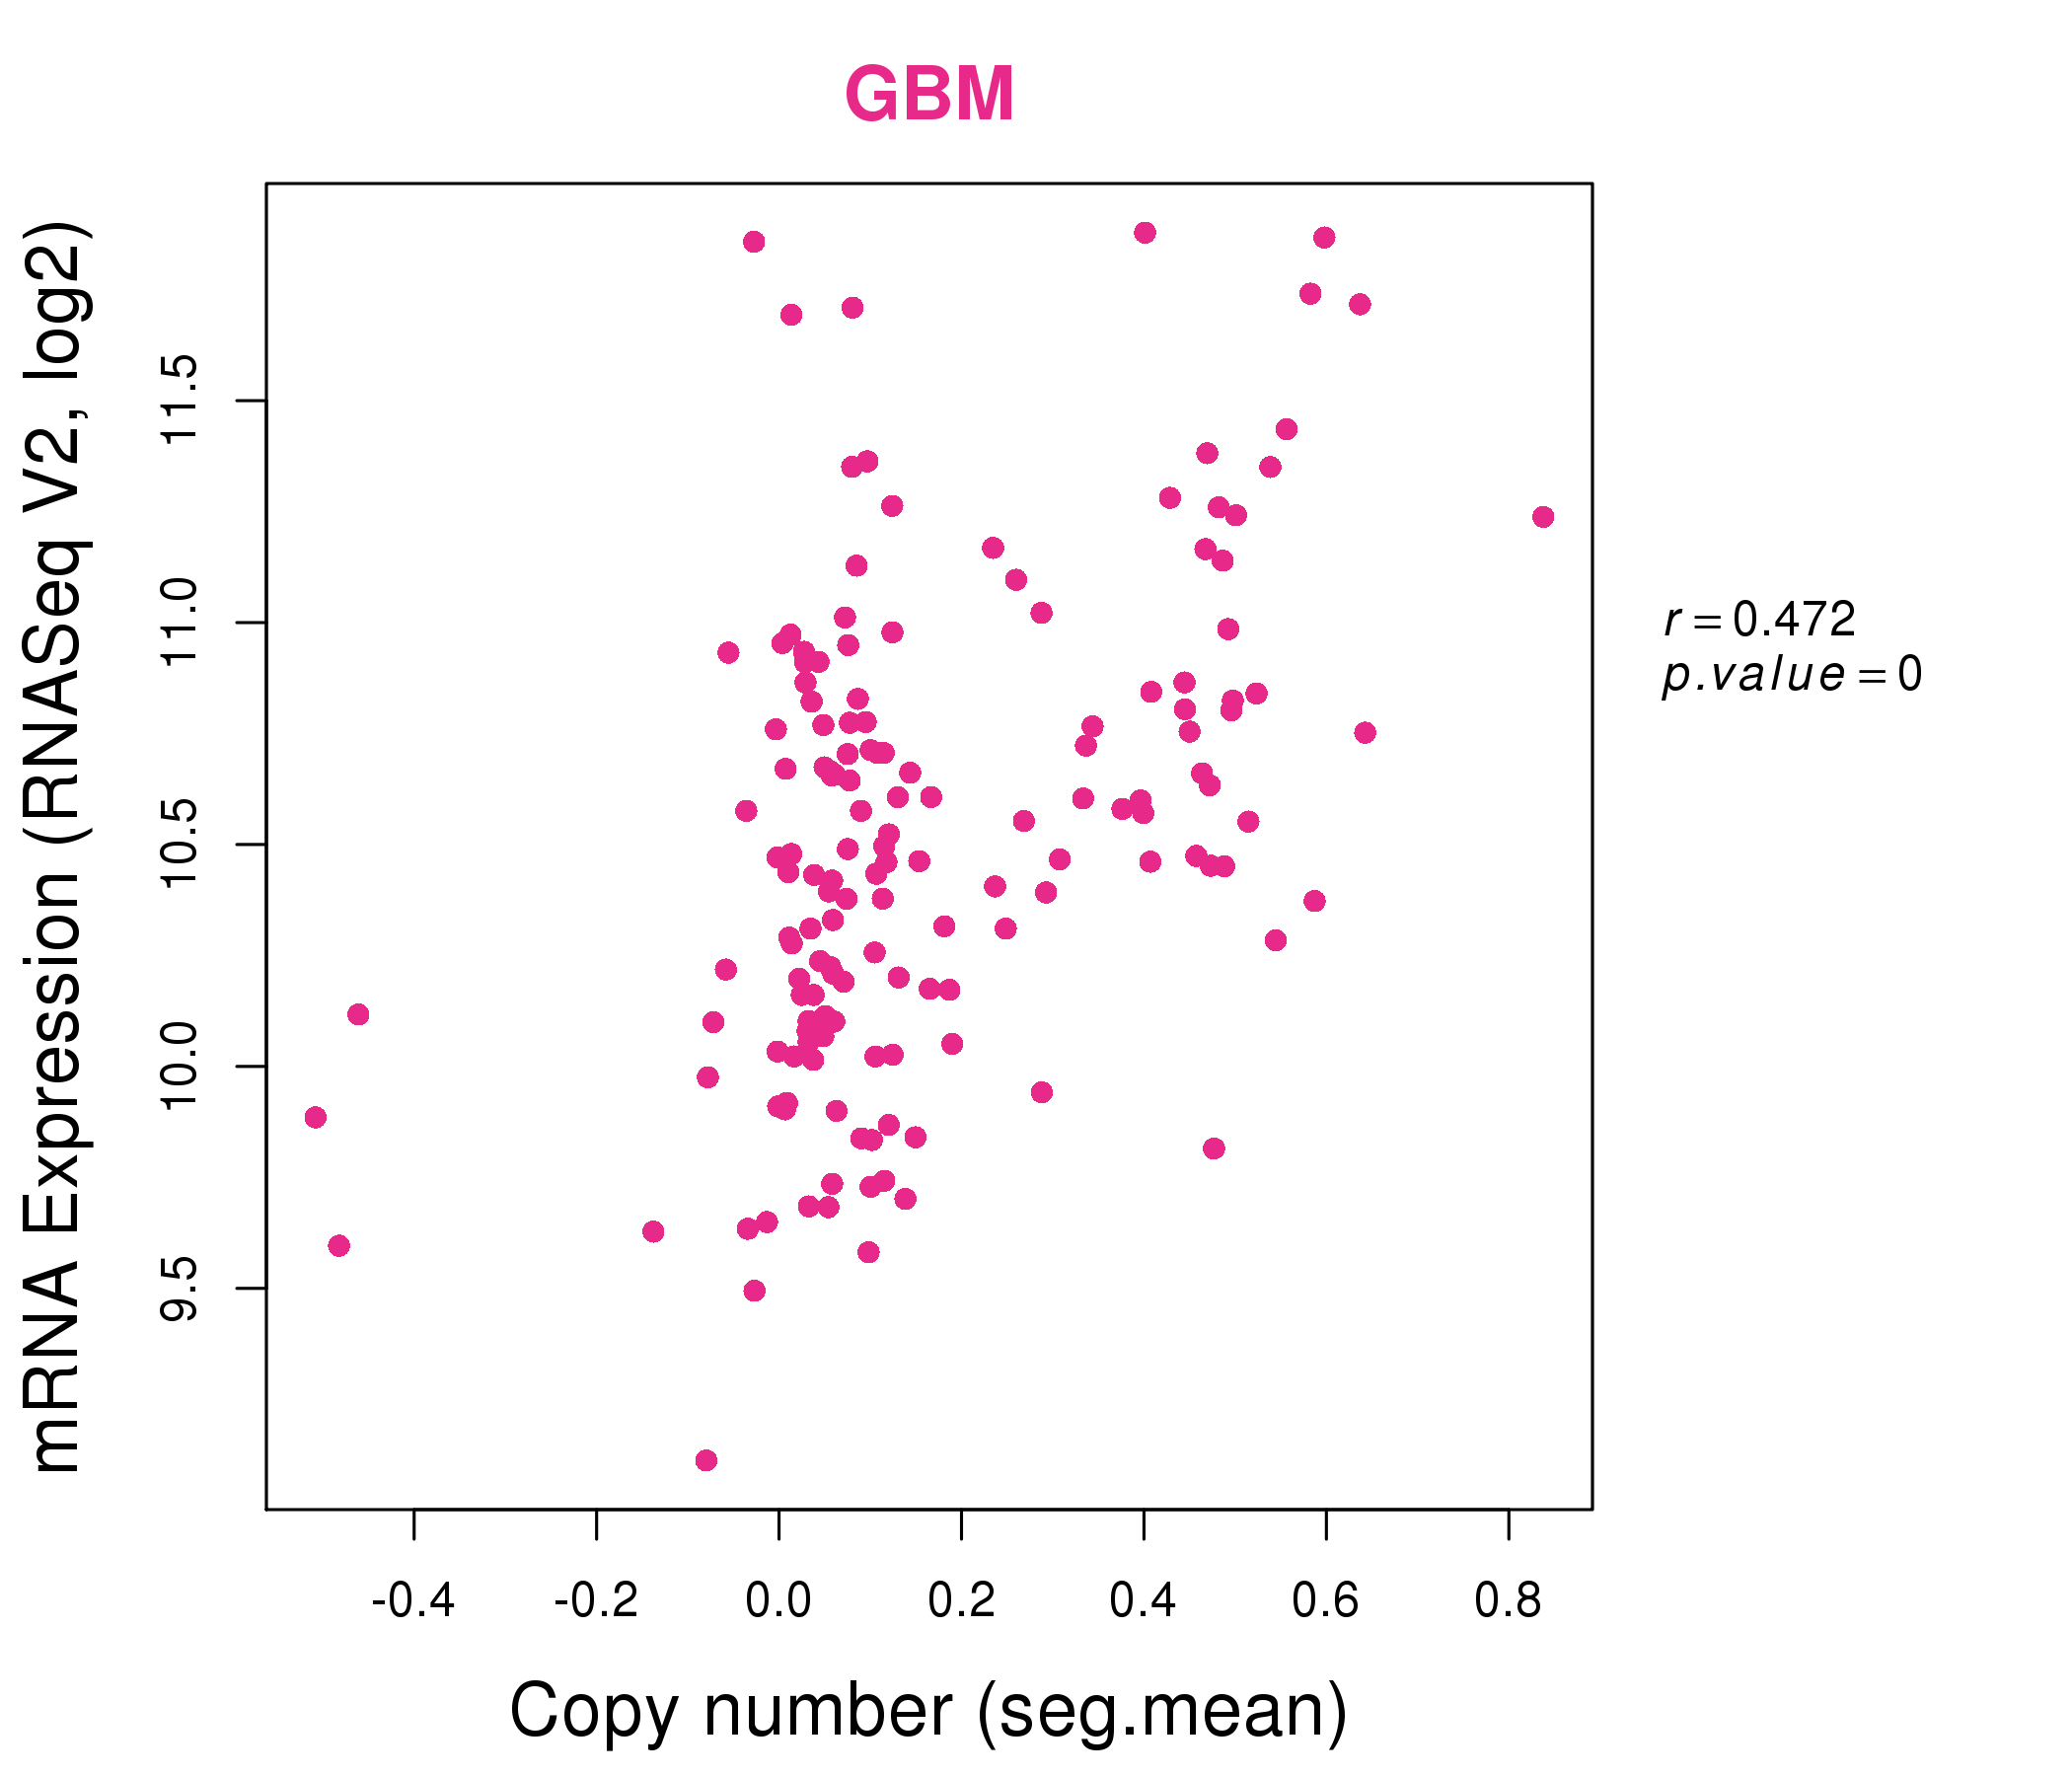
| * Normalized gene expression data of RNASeqV2 was extracted from TCGA using R package TCGA-Assembler. The URLs of all public data files on TCGA DCC data server were gathered at Jan-05-2015. Only eight cancer types have enough normal control samples for differential expression analysis. (t test, adjusted p<0.05 (using Benjamini-Hochberg FDR)) |
 |
| Top |
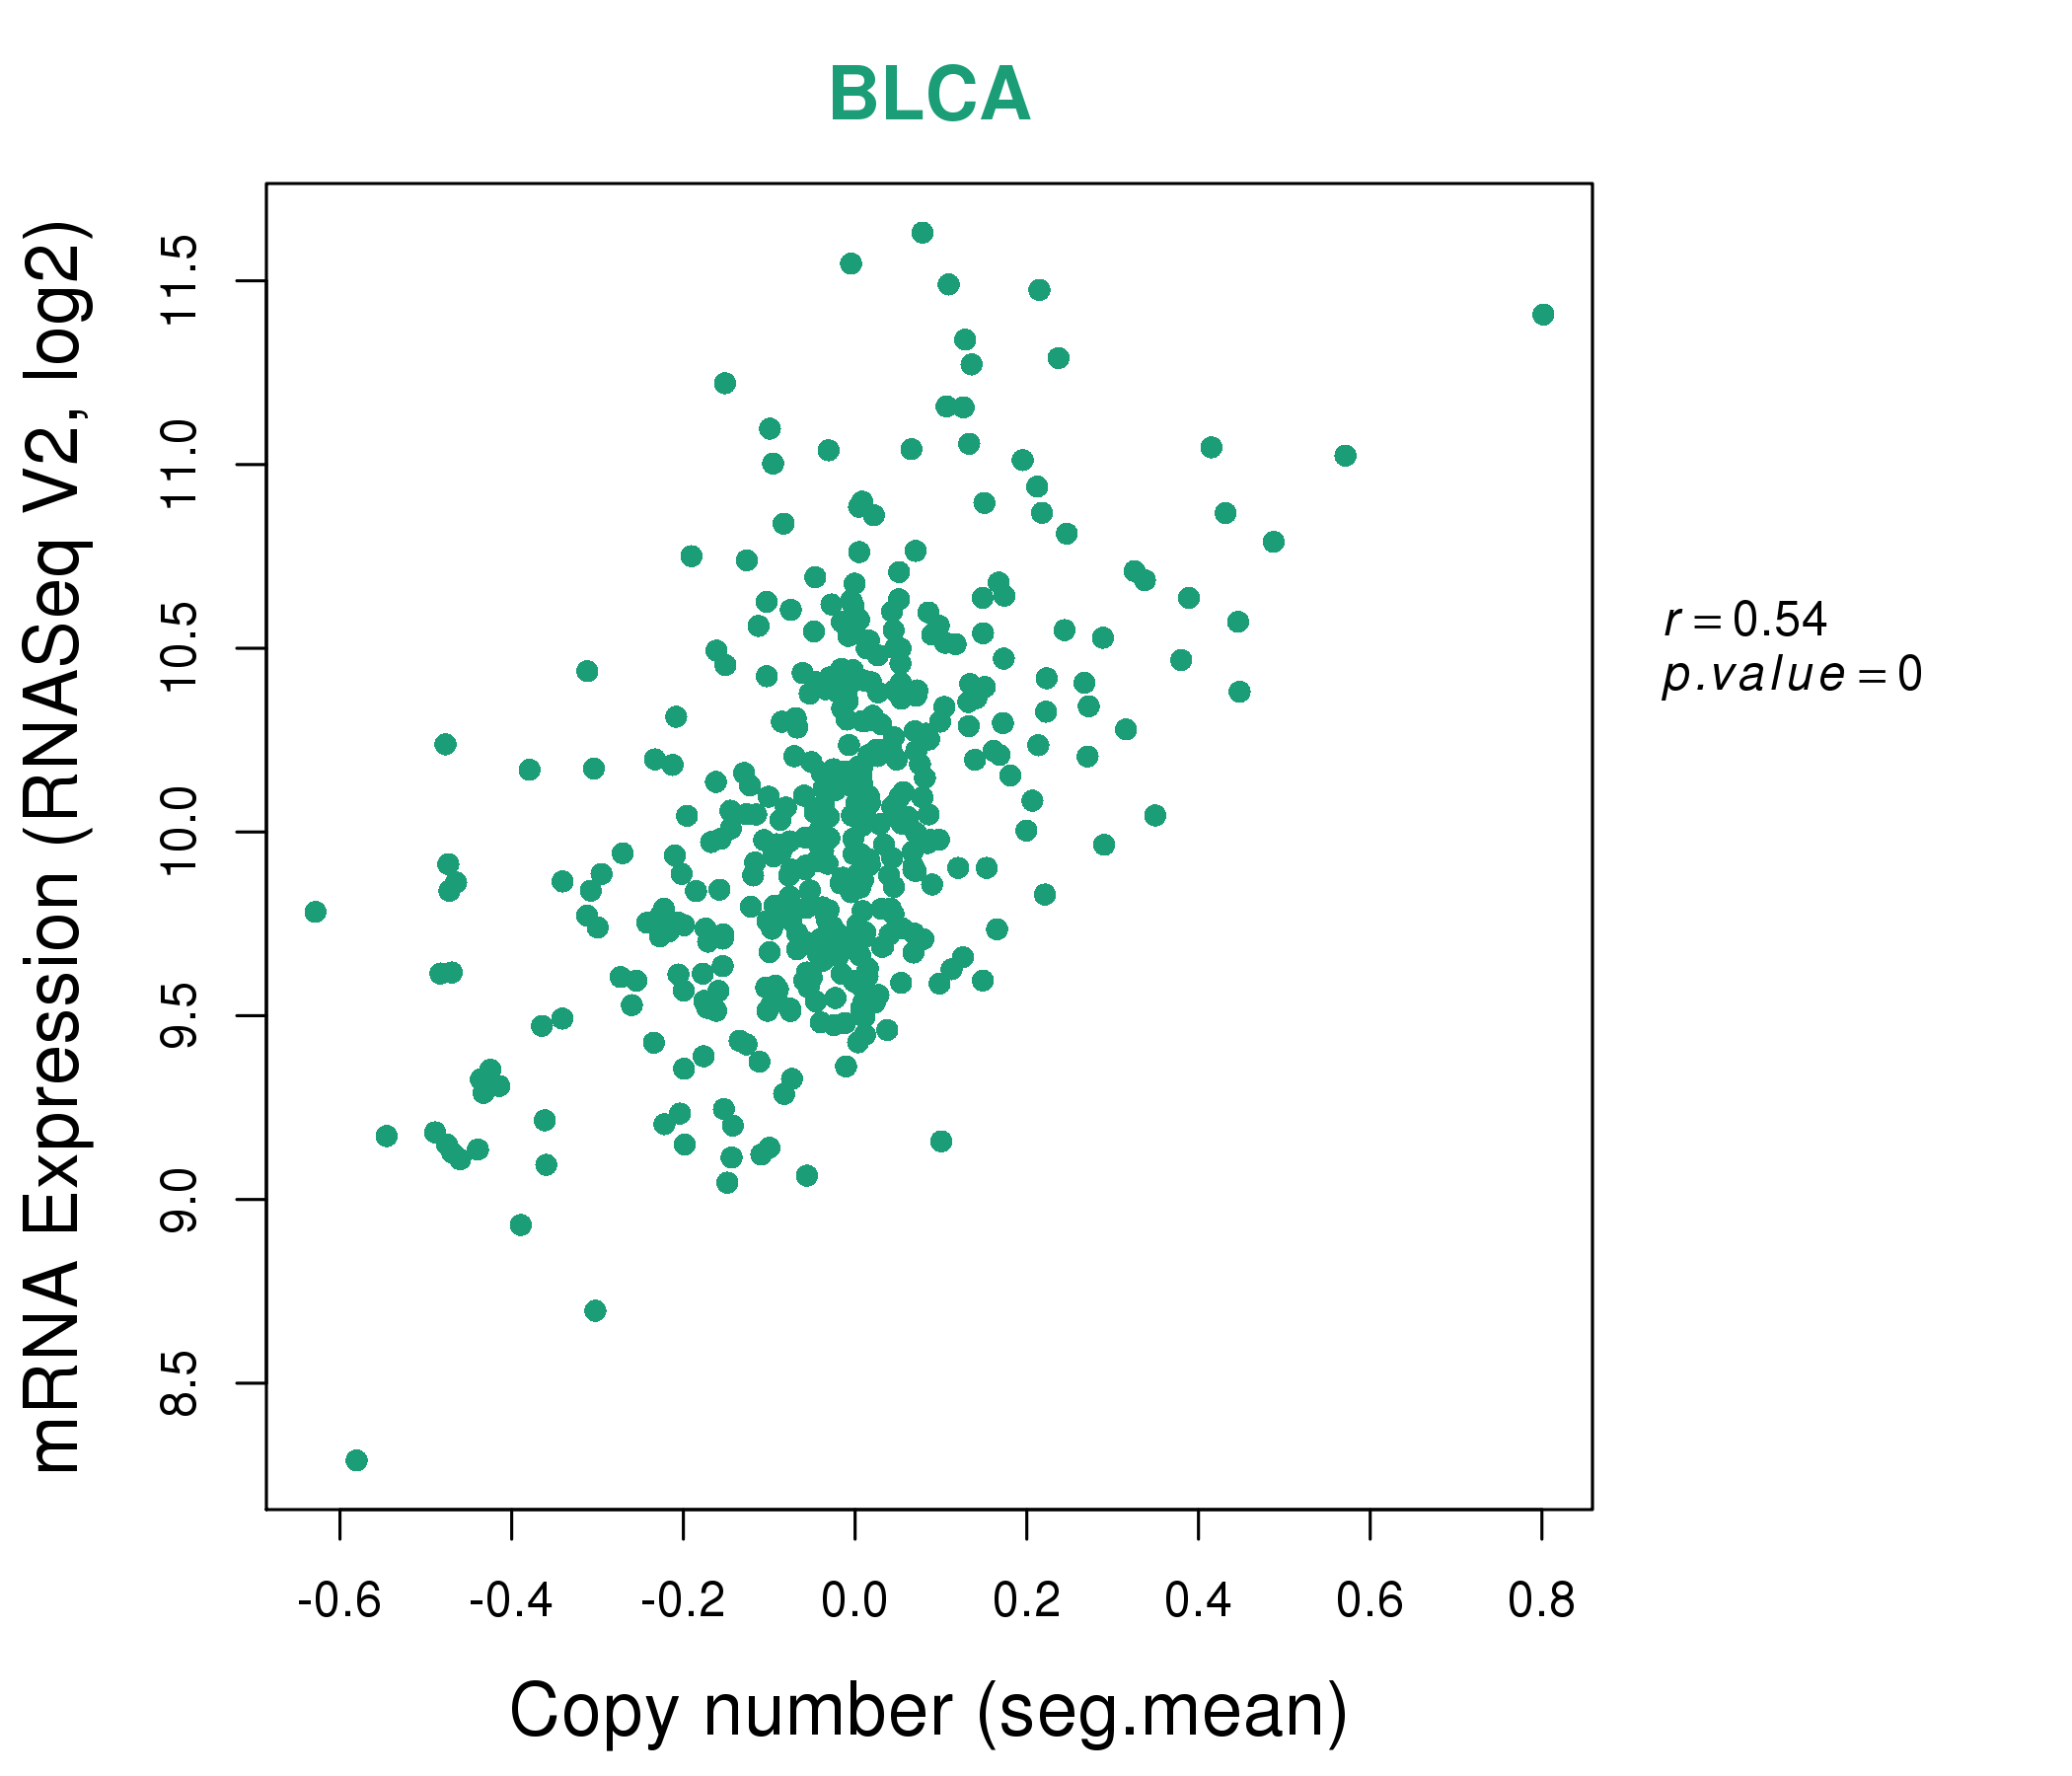
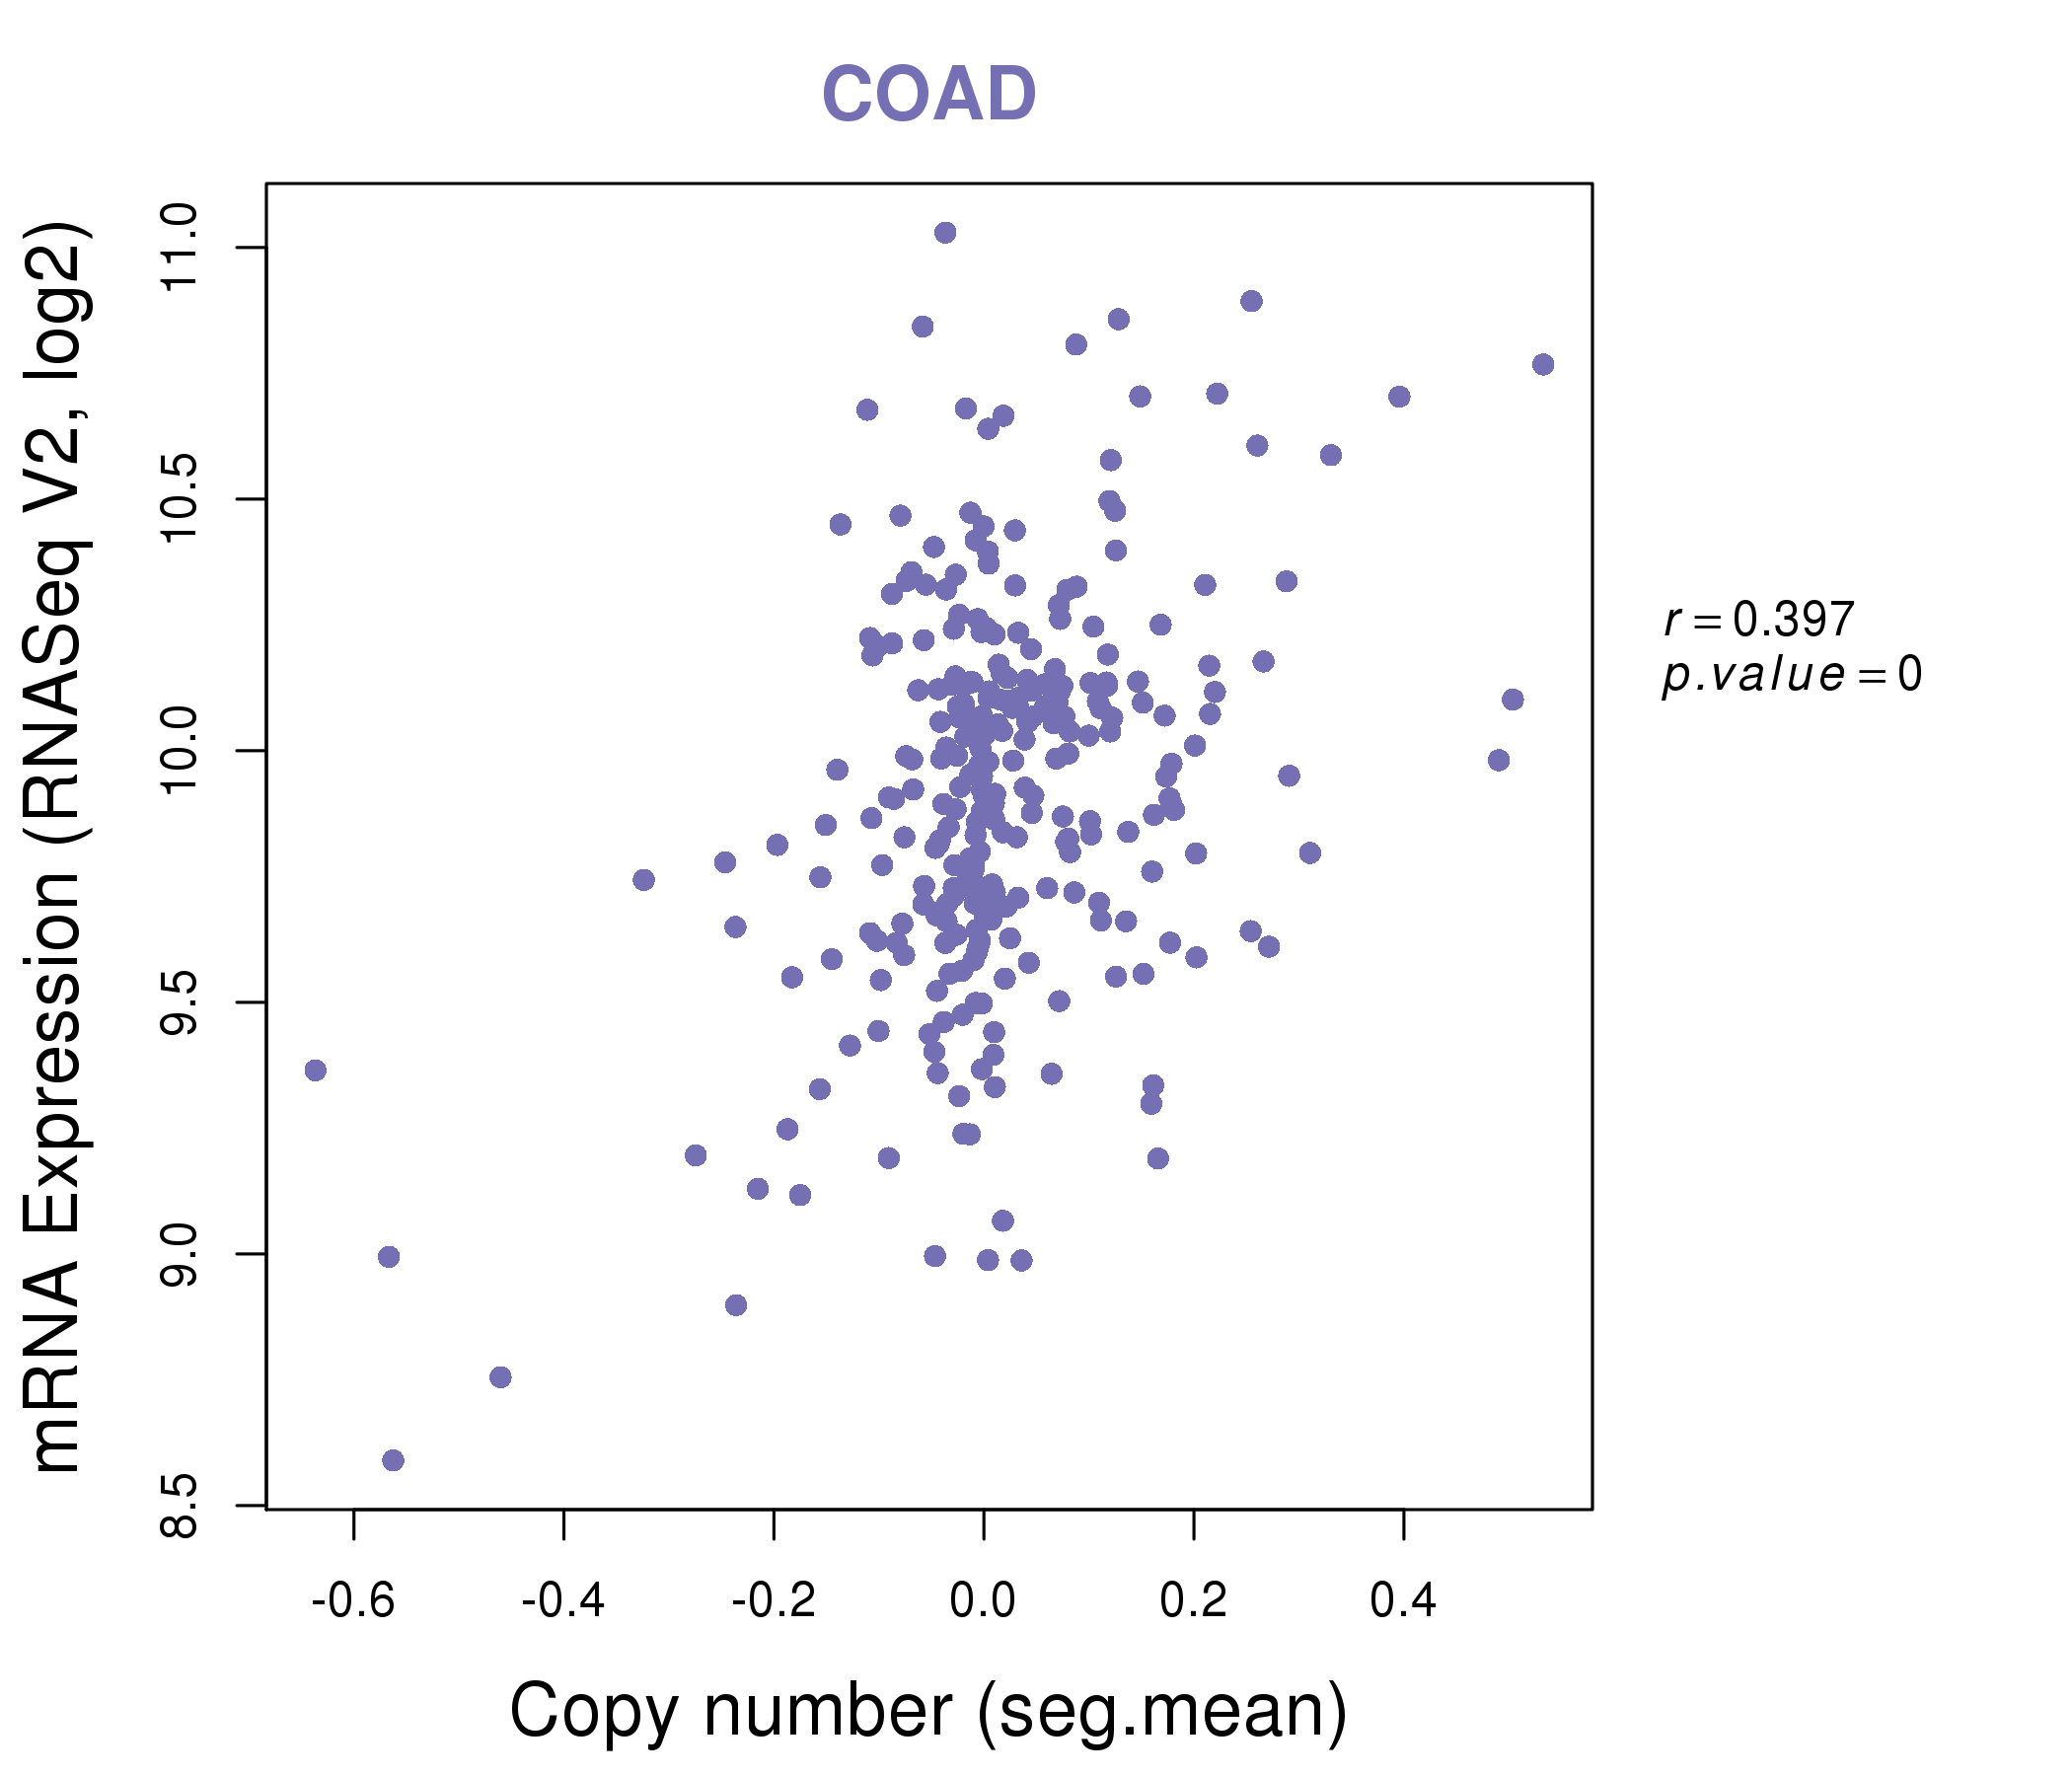
| * This plots show the correlation between CNV and gene expression. |
: Open all plots for all cancer types
 |
|
 |
|
| Top |
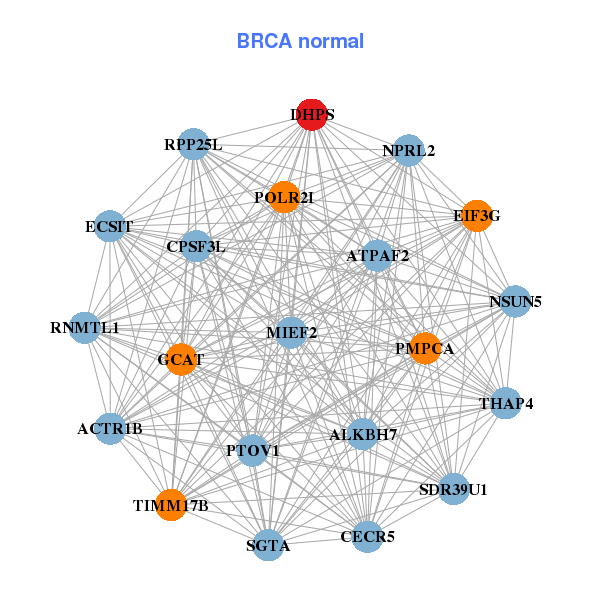
| Gene-Gene Network Information |
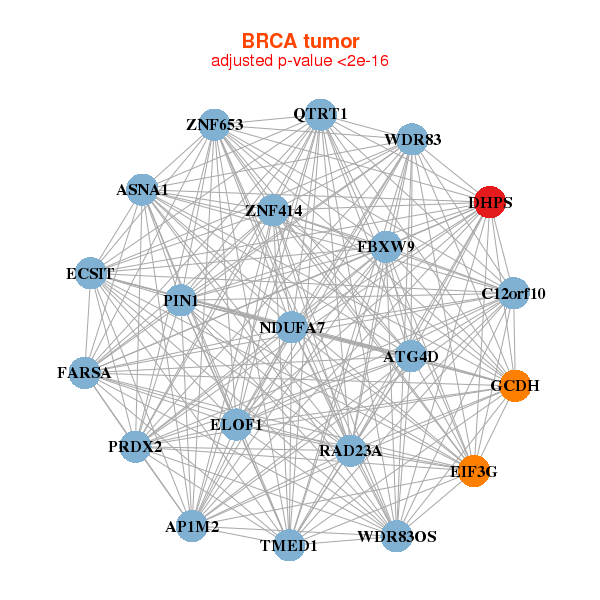
| * Co-Expression network figures were drawn using R package igraph. Only the top 20 genes with the highest correlations were shown. Red circle: input gene, orange circle: cell metabolism gene, sky circle: other gene |
: Open all plots for all cancer types
 |
| ||||
| AP1M2,ASNA1,ATG4D,C12orf10,WDR83OS,DHPS,ECSIT, EIF3G,ELOF1,FARSA,FBXW9,GCDH,NDUFA7,PIN1, PRDX2,QTRT1,RAD23A,TMED1,WDR83,ZNF414,ZNF653 | ACTR1B,ALKBH7,ATPAF2,RPP25L,CECR5,CPSF3L,DHPS, ECSIT,EIF3G,GCAT,NPRL2,NSUN5,PMPCA,POLR2I, PTOV1,RNMTL1,SDR39U1,SGTA,MIEF2,THAP4,TIMM17B | ||||
 |
| ||||
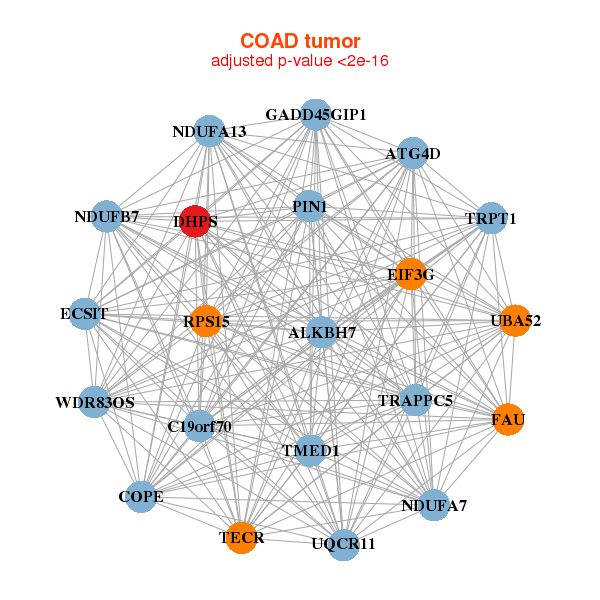
| ALKBH7,ATG4D,WDR83OS,C19orf70,COPE,DHPS,ECSIT, EIF3G,FAU,GADD45GIP1,NDUFA13,NDUFA7,NDUFB7,PIN1, RPS15,TECR,TMED1,TRAPPC5,TRPT1,UBA52,UQCR11 | ATP5G2,BTF3,C12orf10,C12orf57,C15orf61,WDR83OS,DGCR6L, DHPS,DRG2,ERCC1,ING4,KLHDC3,MPG,MRPL43, RPL18,RPL29,RPL8,SDHAF1,SUMF2,TMEM42,WBP1 |
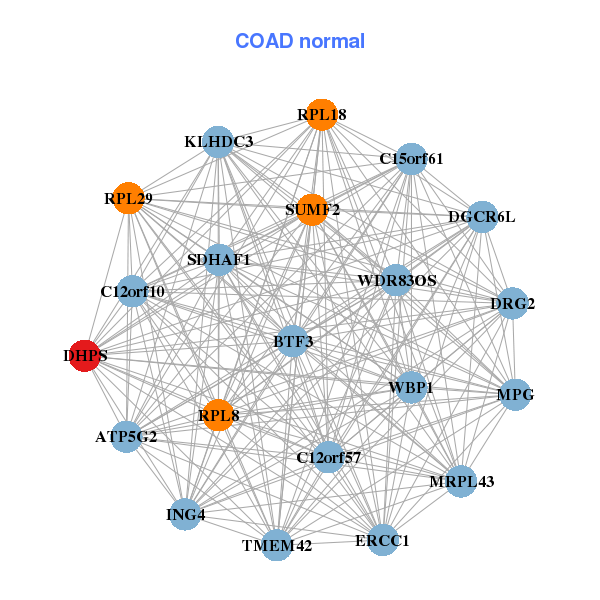
| * Co-Expression network figures were drawn using R package igraph. Only the top 20 genes with the highest correlations were shown. Red circle: input gene, orange circle: cell metabolism gene, sky circle: other gene |
: Open all plots for all cancer types
| Top |
: Open all interacting genes' information including KEGG pathway for all interacting genes from DAVID
| Top |
| Pharmacological Information for DHPS |
| DB Category | DB Name | DB's ID and Url link |
| * Gene Centered Interaction Network. |
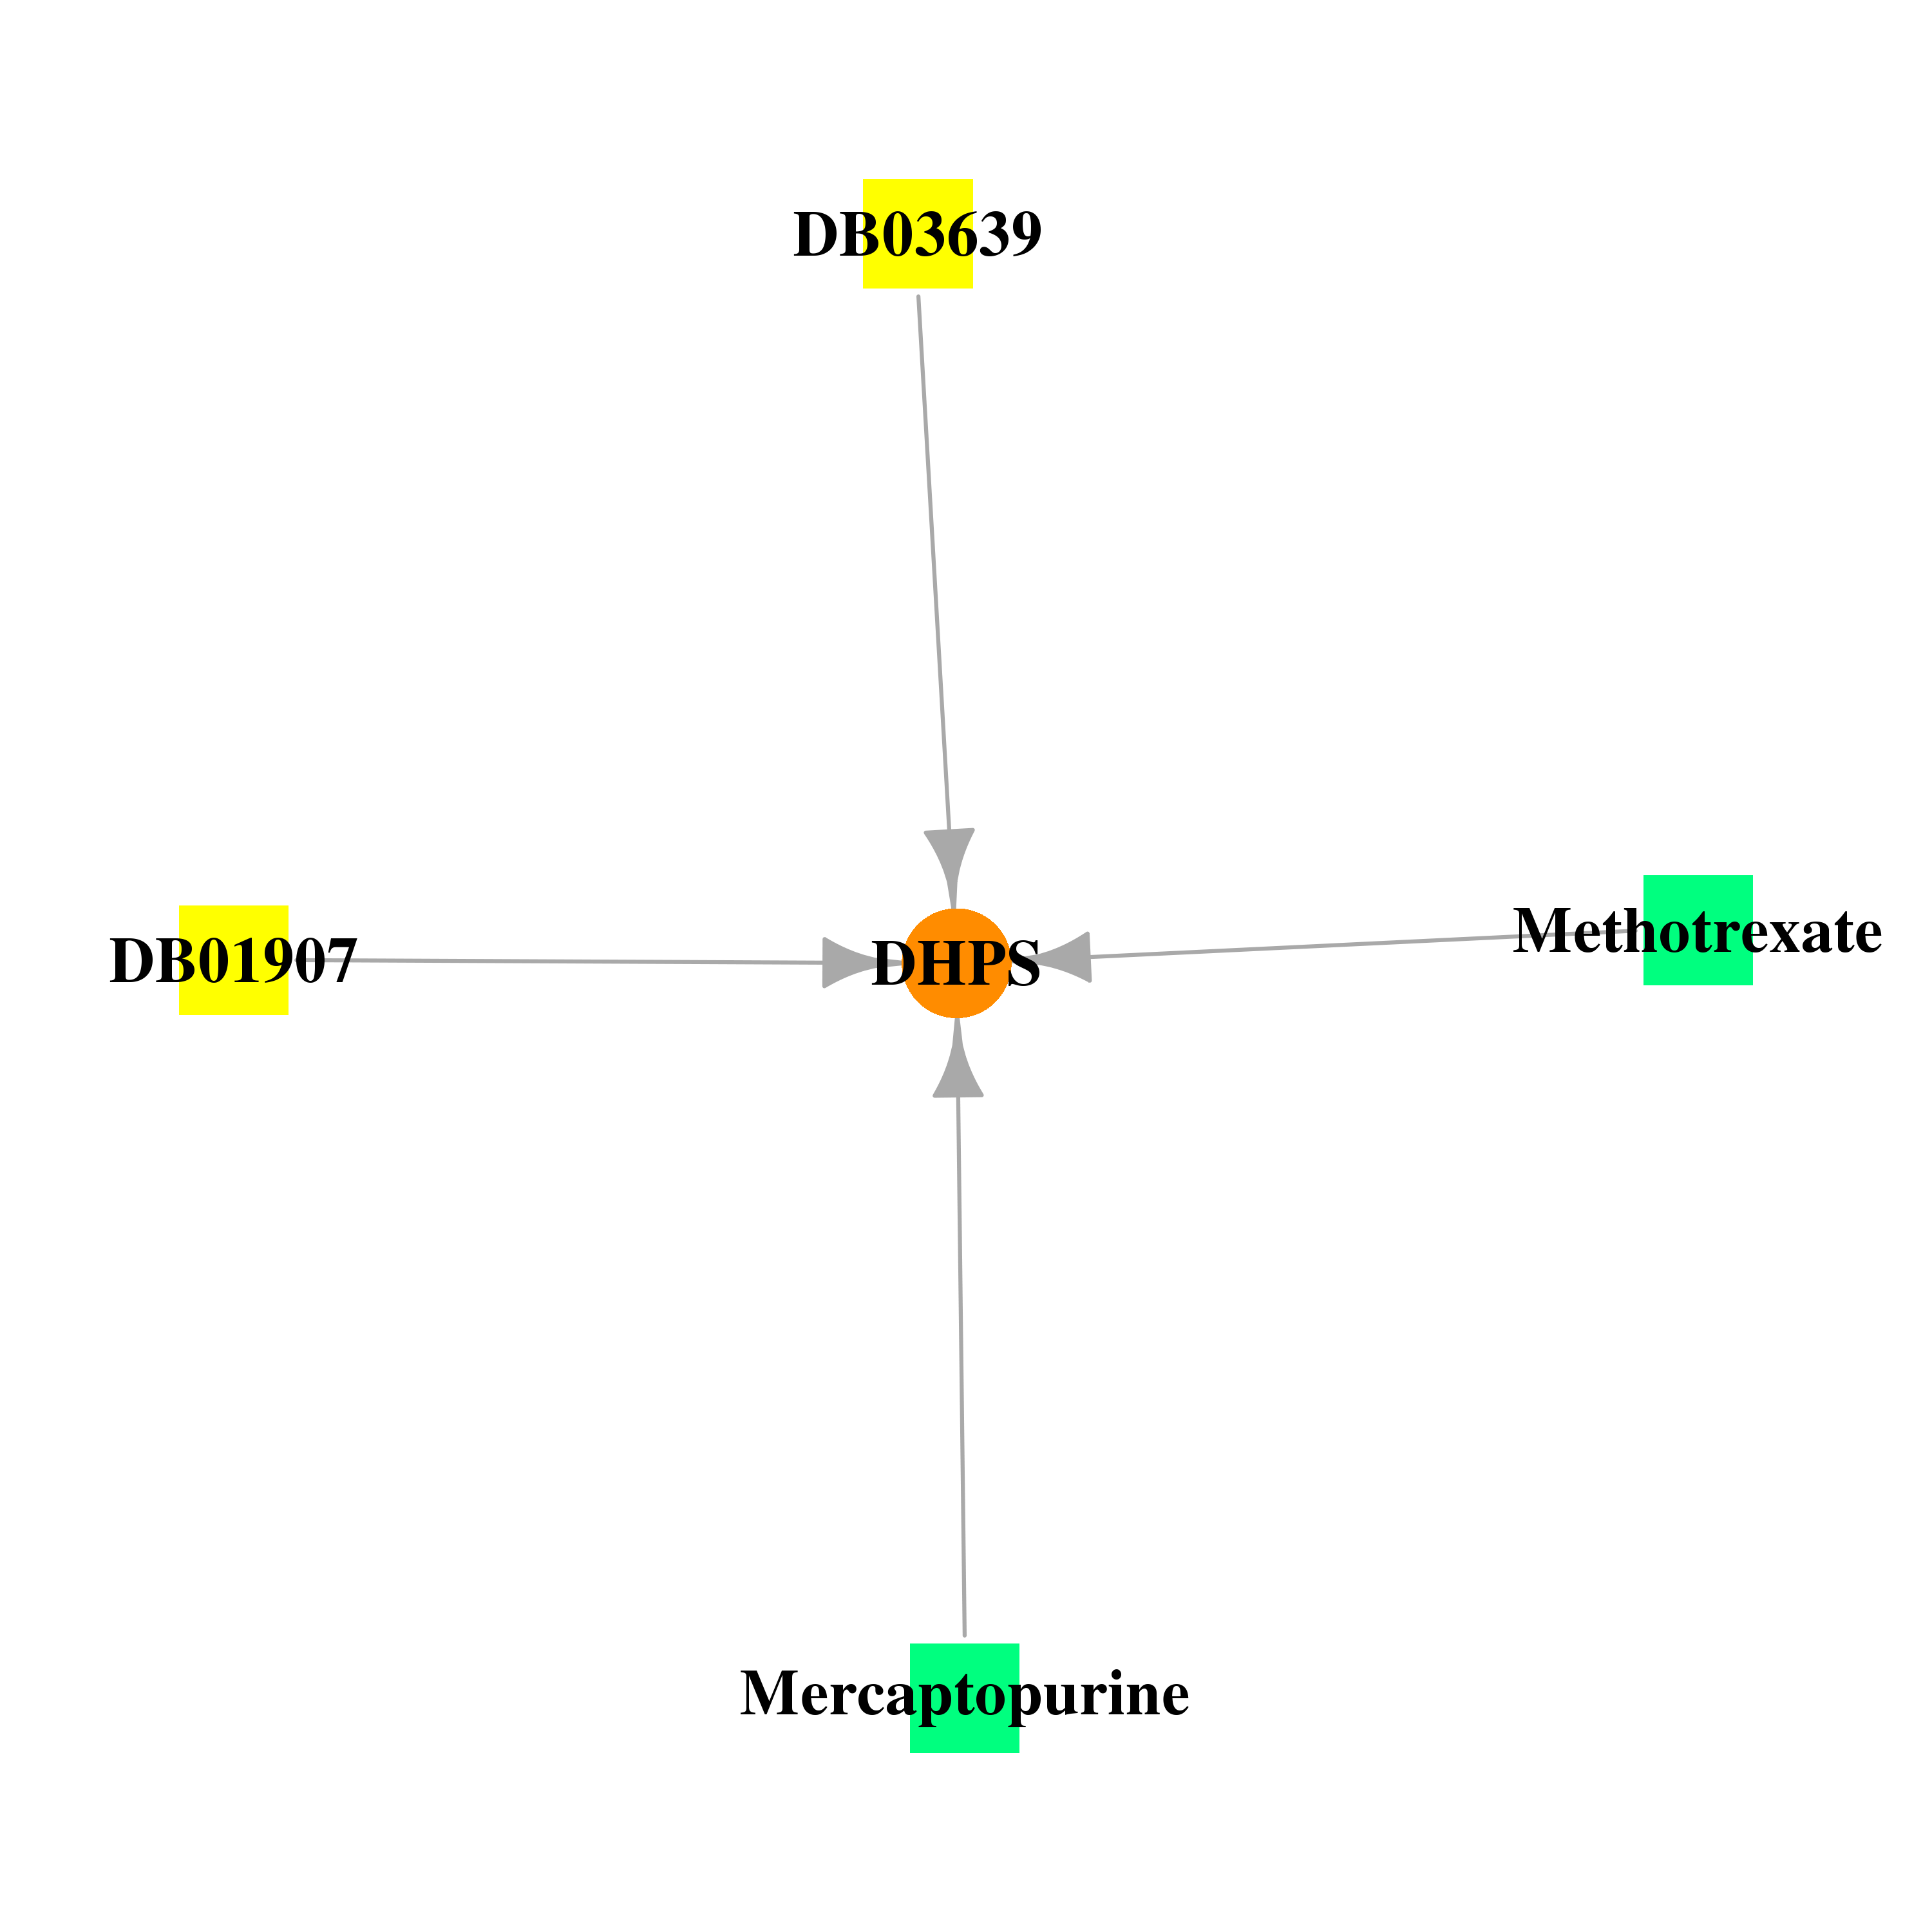 |
| * Drug Centered Interaction Network. |
| DrugBank ID | Target Name | Drug Groups | Generic Name | Drug Centered Network | Drug Structure |
| DB01907 | deoxyhypusine synthase | experimental | Nicotinamide-Adenine-Dinucleotide | 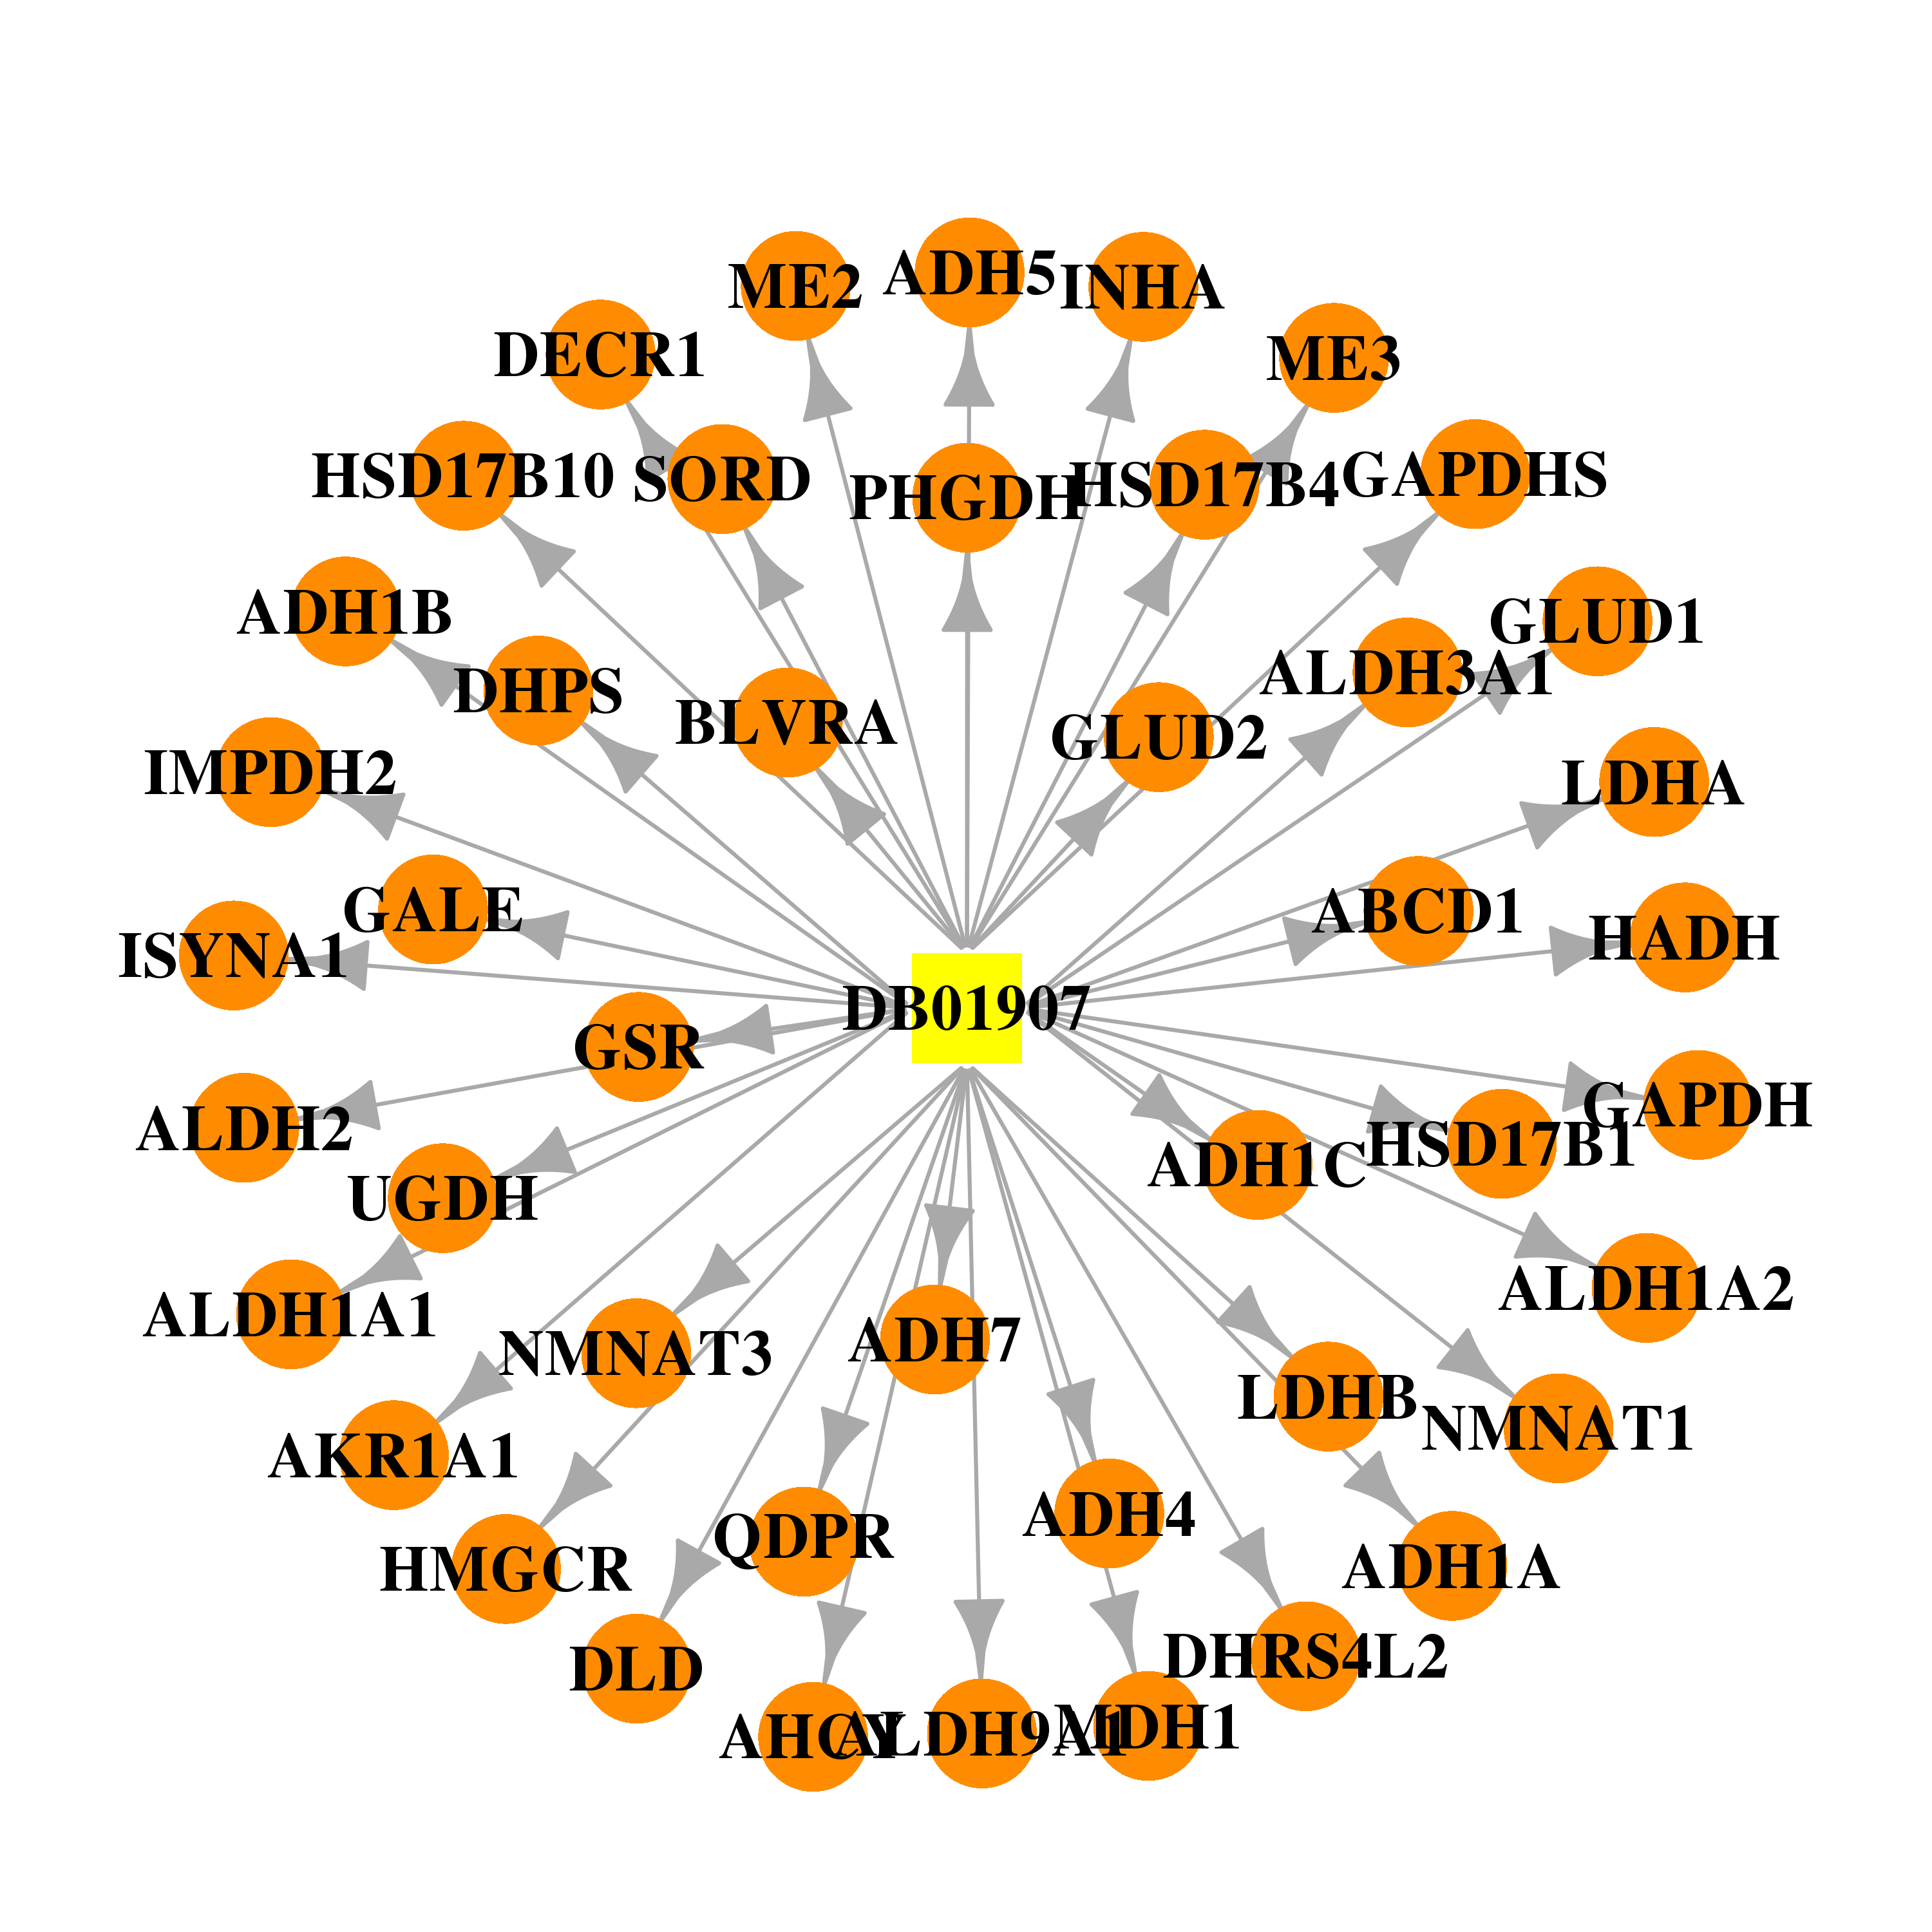 |  |
| DB03639 | deoxyhypusine synthase | experimental | 1-Guanidinium-7-Aminoheptane |  |  |
| DB01033 | deoxyhypusine synthase | approved | Mercaptopurine | 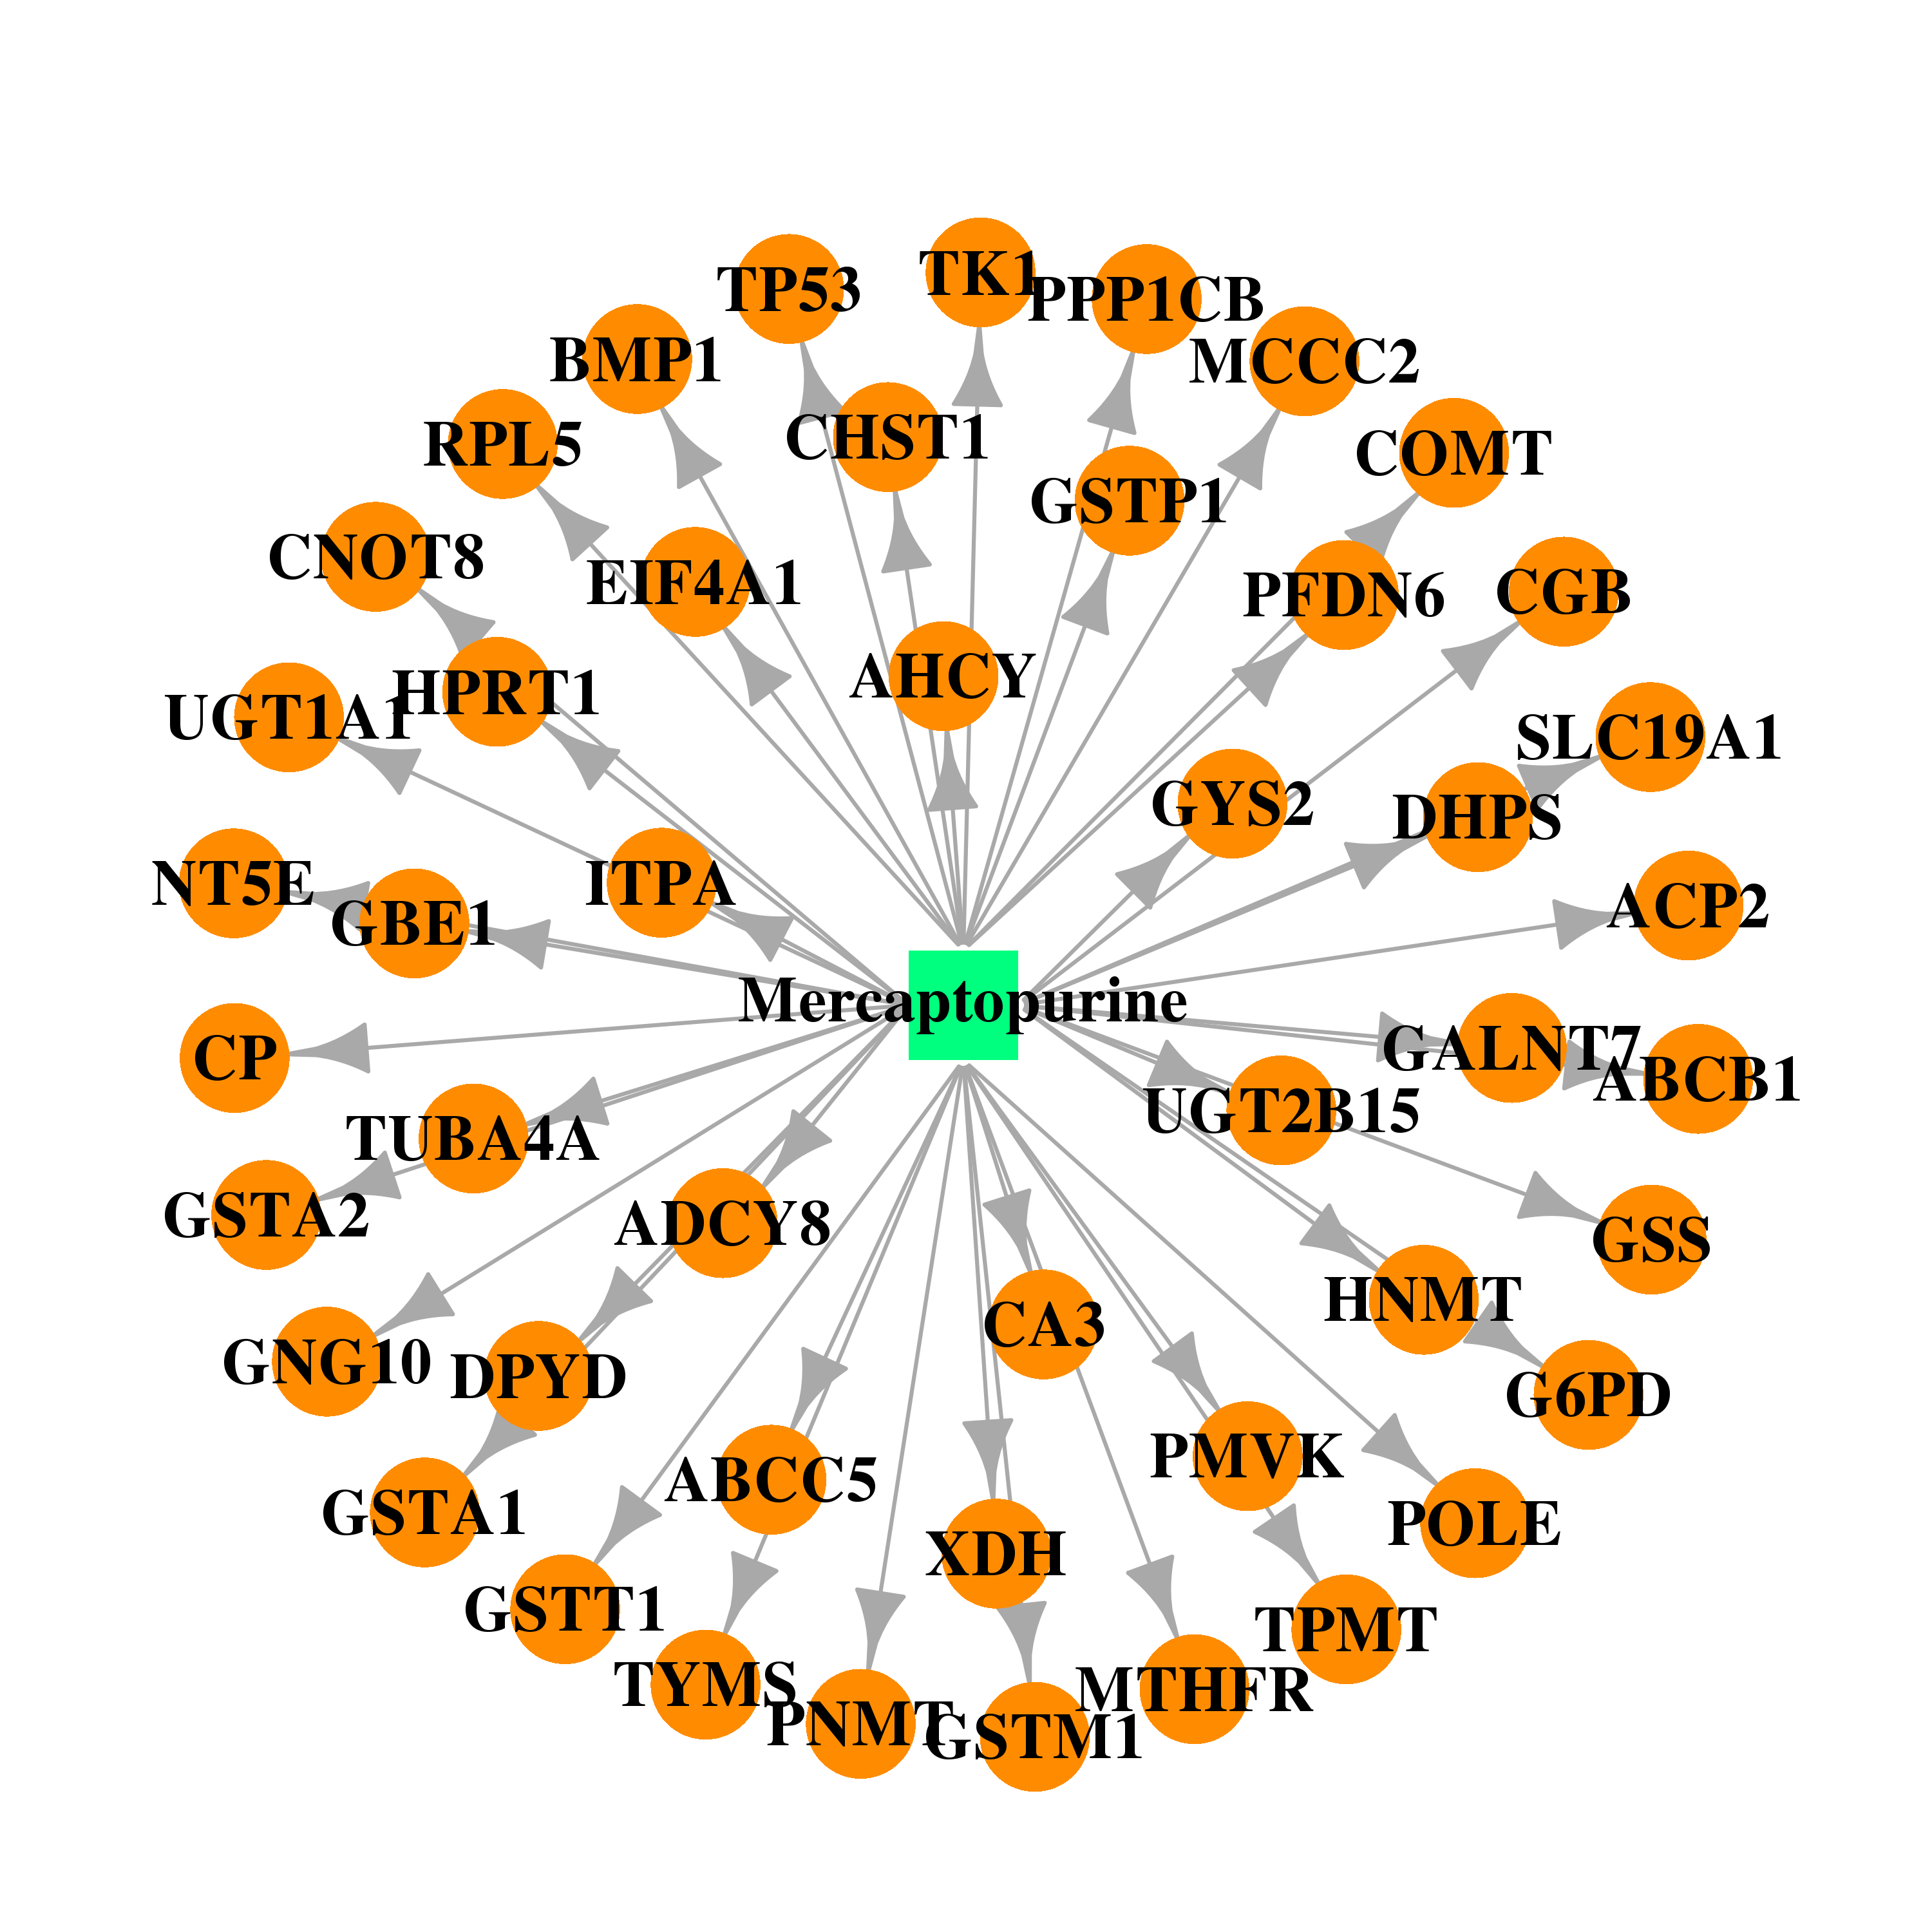 |  |
| DB00563 | deoxyhypusine synthase | approved | Methotrexate |  |  |
| Top |
| Cross referenced IDs for DHPS |
| * We obtained these cross-references from Uniprot database. It covers 150 different DBs, 18 categories. http://www.uniprot.org/help/cross_references_section |
: Open all cross reference information
|
Copyright © 2016-Present - The Univsersity of Texas Health Science Center at Houston @ |