|
||||||||||||||||||||
| |
| Phenotypic Information (metabolism pathway, cancer, disease, phenome) |
| |
| |
| Gene-Gene Network Information: Co-Expression Network, Interacting Genes & KEGG |
| |
|


| Gene Summary for NQO1 |
| Basic gene info. | Gene symbol | NQO1 |
| Gene name | NAD(P)H dehydrogenase, quinone 1 | |
| Synonyms | DHQU|DIA4|DTD|NMOR1|NMORI|QR1 | |
| Cytomap | UCSC genome browser: 16q22.1 | |
| Genomic location | chr16 :69743303-69760533 | |
| Type of gene | protein-coding | |
| RefGenes | NM_000903.2, NM_001025433.1,NM_001025434.1,NM_001286137.1, | |
| Ensembl id | ENSG00000181019 | |
| Description | DT-diaphoraseNAD(P)H dehydrogenase [quinone] 1NAD(P)H:Quinone acceptor oxidoreductase type 1NAD(P)H:menadione oxidoreductase 1NAD(P)H:quinone oxidoreductase 1NAD(P)H:quinone oxireductaseazoreductasediaphorase (NADH/NADPH) (cytochrome b-5 reductase) | |
| Modification date | 20141222 | |
| dbXrefs | MIM : 125860 | |
| HGNC : HGNC | ||
| Ensembl : ENSG00000181019 | ||
| HPRD : 00518 | ||
| Vega : OTTHUMG00000137575 | ||
| Protein | UniProt: P15559 go to UniProt's Cross Reference DB Table | |
| Expression | CleanEX: HS_NQO1 | |
| BioGPS: 1728 | ||
| Gene Expression Atlas: ENSG00000181019 | ||
| The Human Protein Atlas: ENSG00000181019 | ||
| Pathway | NCI Pathway Interaction Database: NQO1 | |
| KEGG: NQO1 | ||
| REACTOME: NQO1 | ||
| ConsensusPathDB | ||
| Pathway Commons: NQO1 | ||
| Metabolism | MetaCyc: NQO1 | |
| HUMANCyc: NQO1 | ||
| Regulation | Ensembl's Regulation: ENSG00000181019 | |
| miRBase: chr16 :69,743,303-69,760,533 | ||
| TargetScan: NM_000903 | ||
| cisRED: ENSG00000181019 | ||
| Context | iHOP: NQO1 | |
| cancer metabolism search in PubMed: NQO1 | ||
| UCL Cancer Institute: NQO1 | ||
| Assigned class in ccmGDB | B - This gene belongs to cancer gene. | |
| Top |
| Phenotypic Information for NQO1(metabolism pathway, cancer, disease, phenome) |
| Cancer | CGAP: NQO1 |
| Familial Cancer Database: NQO1 | |
| * This gene is included in those cancer gene databases. |
|
|
|
|
|
| . | ||||||||||||||
Oncogene 1 | Significant driver gene in | |||||||||||||||||||
| cf) number; DB name 1 Oncogene; http://nar.oxfordjournals.org/content/35/suppl_1/D721.long, 2 Tumor Suppressor gene; https://bioinfo.uth.edu/TSGene/, 3 Cancer Gene Census; http://www.nature.com/nrc/journal/v4/n3/abs/nrc1299.html, 4 CancerGenes; http://nar.oxfordjournals.org/content/35/suppl_1/D721.long, 5 Network of Cancer Gene; http://ncg.kcl.ac.uk/index.php, 1Therapeutic Vulnerabilities in Cancer; http://cbio.mskcc.org/cancergenomics/statius/ |
| REACTOME_METABOLISM_OF_AMINO_ACIDS_AND_DERIVATIVES | |
| OMIM | 125860; gene. |
| Orphanet | |
| Disease | KEGG Disease: NQO1 |
| MedGen: NQO1 (Human Medical Genetics with Condition) | |
| ClinVar: NQO1 | |
| Phenotype | MGI: NQO1 (International Mouse Phenotyping Consortium) |
| PhenomicDB: NQO1 | |
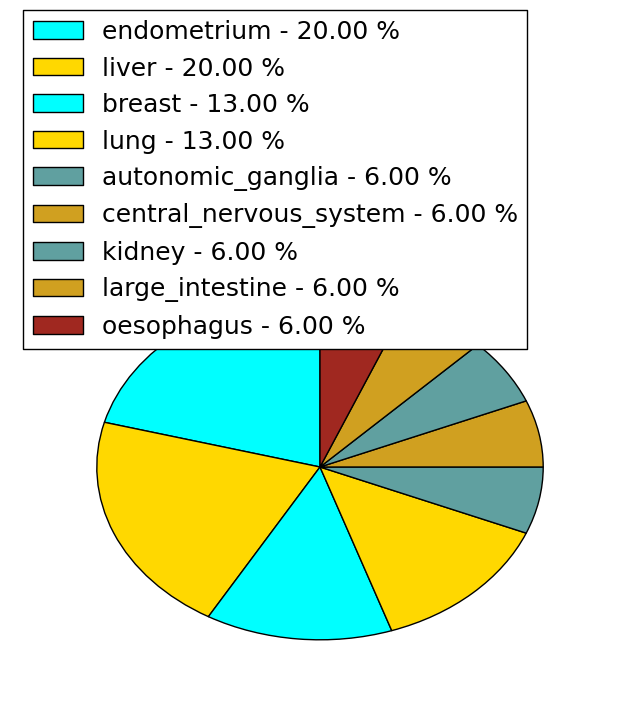
| Mutations for NQO1 |
| * Under tables are showing count per each tissue to give us broad intuition about tissue specific mutation patterns.You can go to the detailed page for each mutation database's web site. |
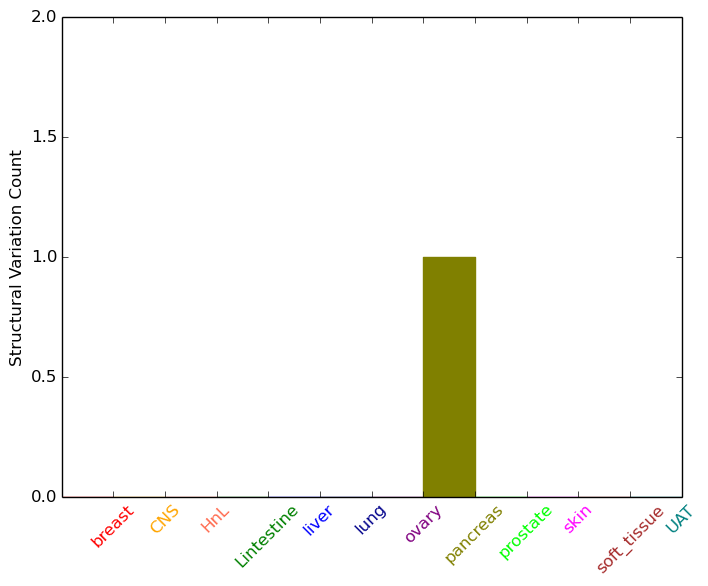
| - Statistics for Tissue and Mutation type | Top |
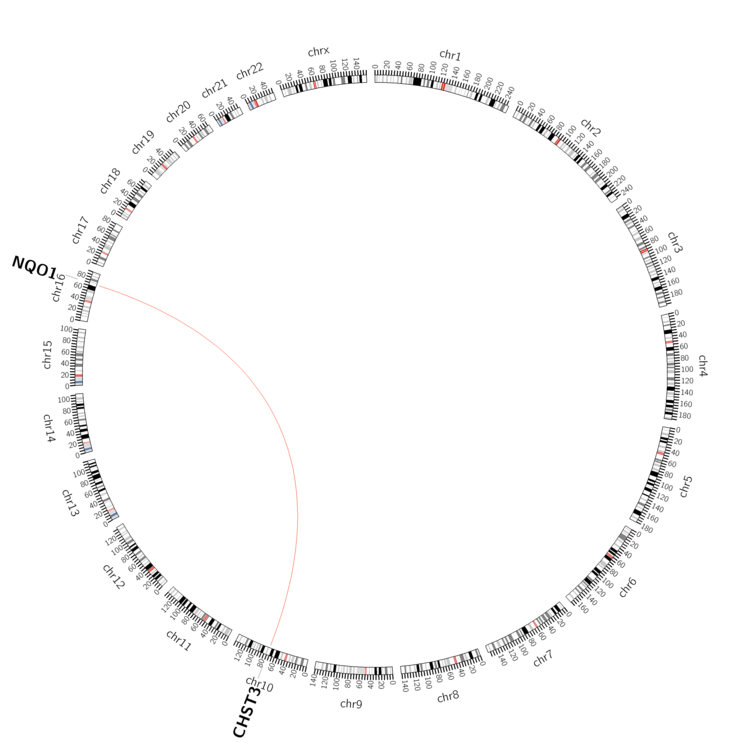 |
| - For Inter-chromosomal Variations |
| * Inter-chromosomal variantions includes 'interchromosomal amplicon to amplicon', 'interchromosomal amplicon to non-amplified dna', 'interchromosomal insertion', 'Interchromosomal unknown type'. |
 |
| - For Intra-chromosomal Variations |
| There's no intra-chromosomal structural variation. |
| Sample | Symbol_a | Chr_a | Start_a | End_a | Symbol_b | Chr_b | Start_b | End_b |
| pancreas | NQO1 | chr16 | 69744974 | 69744994 | CHST3 | chr10 | 73755735 | 73755755 |
| cf) Tissue number; Tissue name (1;Breast, 2;Central_nervous_system, 3;Haematopoietic_and_lymphoid_tissue, 4;Large_intestine, 5;Liver, 6;Lung, 7;Ovary, 8;Pancreas, 9;Prostate, 10;Skin, 11;Soft_tissue, 12;Upper_aerodigestive_tract) |
| * From mRNA Sanger sequences, Chitars2.0 arranged chimeric transcripts. This table shows NQO1 related fusion information. |
| ID | Head Gene | Tail Gene | Accession | Gene_a | qStart_a | qEnd_a | Chromosome_a | tStart_a | tEnd_a | Gene_a | qStart_a | qEnd_a | Chromosome_a | tStart_a | tEnd_a |
| DA648735 | SNHG6 | 1 | 75 | 8 | 67834709 | 67834783 | NQO1 | 76 | 546 | 16 | 69748934 | 69760463 | |
| BM755010 | NQO1 | 17 | 136 | 16 | 69760336 | 69760461 | TTC37 | 136 | 482 | 5 | 94814082 | 94820550 | |
| CB159668 | NQO1 | 1 | 121 | 16 | 69747001 | 69748955 | NQO1 | 116 | 565 | 16 | 69744805 | 69747000 | |
| BQ220009 | FAM155A | 85 | 136 | 13 | 108363673 | 108363730 | NQO1 | 131 | 866 | 16 | 69743316 | 69744046 | |
| BM983726 | NQO1 | 18 | 191 | 16 | 69744749 | 69744922 | DYRK1A | 184 | 279 | 21 | 38887379 | 38887473 | |
| DB537013 | NQO1 | 1 | 297 | 16 | 69744221 | 69744518 | XRN1 | 297 | 331 | 3 | 142053702 | 142053736 | |
| BU189113 | NQO1 | 14 | 93 | 16 | 69744299 | 69744378 | NQO1 | 90 | 859 | 16 | 69743558 | 69744323 | |
| Top |
| There's no copy number variation information in COSMIC data for this gene. |
| Top |
|
 |
| Top |
| Stat. for Non-Synonymous SNVs (# total SNVs=15) | (# total SNVs=8) |
 |  |
(# total SNVs=1) | (# total SNVs=0) |
 |
| Top |
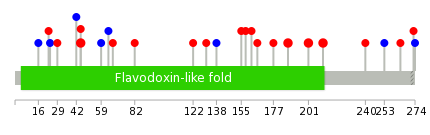
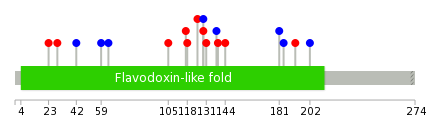
| * When you move the cursor on each content, you can see more deailed mutation information on the Tooltip. Those are primary_site,primary_histology,mutation(aa),pubmedID. |
| GRCh37 position | Mutation(aa) | Unique sampleID count |
| chr16:69745102-69745102 | p.R201Q | 2 |
| chr16:69745145-69745145 | p.P187S | 2 |
| chr16:69752312-69752312 | p.M45L | 2 |
| chr16:69745073-69745073 | p.R211C | 2 |
| chr16:69748919-69748919 | p.I122K | 1 |
| chr16:69752376-69752376 | p.K23N | 1 |
| chr16:69752084-69752084 | p.S82I | 1 |
| chr16:69752397-69752397 | p.T16T | 1 |
| chr16:69752129-69752129 | p.Q67P | 1 |
| chr16:69760326-69760329 | p.? | 1 |
| Top |
|
 |
| Point Mutation/ Tissue ID | 1 | 2 | 3 | 4 | 5 | 6 | 7 | 8 | 9 | 10 | 11 | 12 | 13 | 14 | 15 | 16 | 17 | 18 | 19 | 20 |
| # sample | 1 | 2 | 3 | 1 | 1 | 3 | 4 | |||||||||||||
| # mutation | 1 | 2 | 5 | 1 | 1 | 3 | 6 | |||||||||||||
| nonsynonymous SNV | 1 | 1 | 2 | 1 | 3 | 3 | ||||||||||||||
| synonymous SNV | 1 | 3 | 1 | 3 |
| cf) Tissue ID; Tissue type (1; BLCA[Bladder Urothelial Carcinoma], 2; BRCA[Breast invasive carcinoma], 3; CESC[Cervical squamous cell carcinoma and endocervical adenocarcinoma], 4; COAD[Colon adenocarcinoma], 5; GBM[Glioblastoma multiforme], 6; Glioma Low Grade, 7; HNSC[Head and Neck squamous cell carcinoma], 8; KICH[Kidney Chromophobe], 9; KIRC[Kidney renal clear cell carcinoma], 10; KIRP[Kidney renal papillary cell carcinoma], 11; LAML[Acute Myeloid Leukemia], 12; LUAD[Lung adenocarcinoma], 13; LUSC[Lung squamous cell carcinoma], 14; OV[Ovarian serous cystadenocarcinoma ], 15; PAAD[Pancreatic adenocarcinoma], 16; PRAD[Prostate adenocarcinoma], 17; SKCM[Skin Cutaneous Melanoma], 18:STAD[Stomach adenocarcinoma], 19:THCA[Thyroid carcinoma], 20:UCEC[Uterine Corpus Endometrial Carcinoma]) |
| Top |
| * We represented just top 10 SNVs. When you move the cursor on each content, you can see more deailed mutation information on the Tooltip. Those are primary_site, primary_histology, mutation(aa), pubmedID. |
| Genomic Position | Mutation(aa) | Unique sampleID count |
| chr16:69752319 | p.G125W,NQO1 | 1 |
| chr16:69745102 | p.Y118H,NQO1 | 1 |
| chr16:69752360 | p.M117I,NQO1 | 1 |
| chr16:69745103 | p.F138F,NQO1 | 1 |
| chr16:69752376 | p.A131V,NQO1 | 1 |
| chr16:69745175 | p.A64A,NQO1 | 1 |
| chr16:69746963 | p.K59K,NQO1 | 1 |
| chr16:69746984 | p.K202K,NQO1 | 1 |
| chr16:69744882 | p.L42L,NQO1 | 1 |
| chr16:69746985 | p.I192M,NQO1 | 1 |
| * Copy number data were extracted from TCGA using R package TCGA-Assembler. The URLs of all public data files on TCGA DCC data server were gathered on Jan-05-2015. Function ProcessCNAData in TCGA-Assembler package was used to obtain gene-level copy number value which is calculated as the average copy number of the genomic region of a gene. |
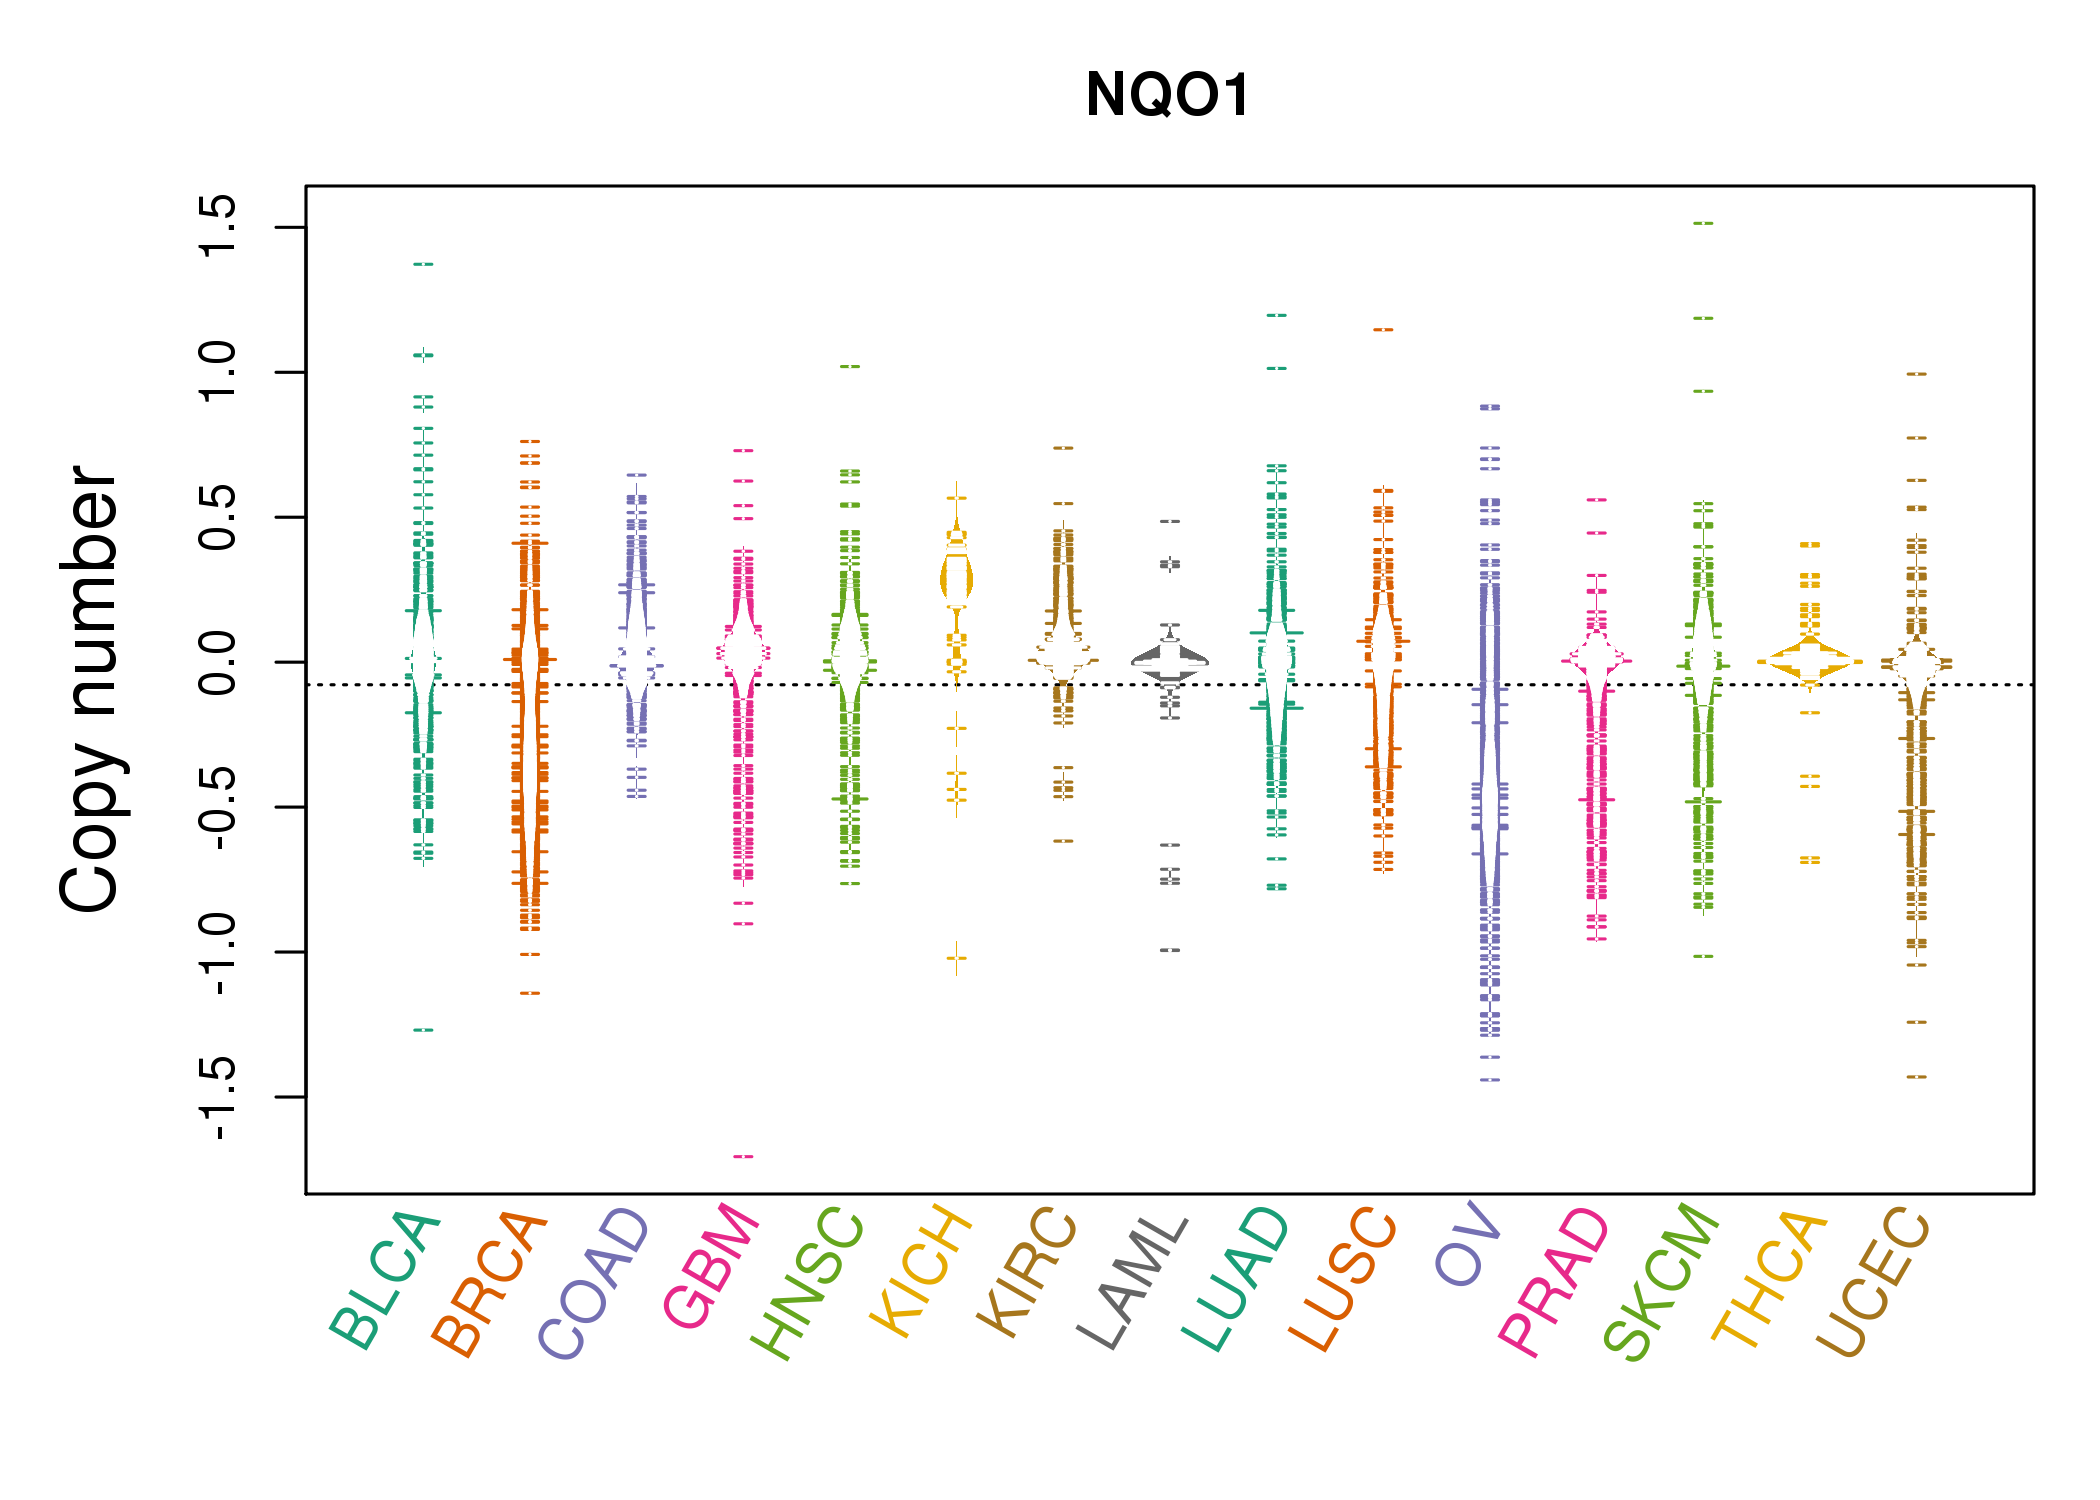 |
| cf) Tissue ID[Tissue type]: BLCA[Bladder Urothelial Carcinoma], BRCA[Breast invasive carcinoma], CESC[Cervical squamous cell carcinoma and endocervical adenocarcinoma], COAD[Colon adenocarcinoma], GBM[Glioblastoma multiforme], Glioma Low Grade, HNSC[Head and Neck squamous cell carcinoma], KICH[Kidney Chromophobe], KIRC[Kidney renal clear cell carcinoma], KIRP[Kidney renal papillary cell carcinoma], LAML[Acute Myeloid Leukemia], LUAD[Lung adenocarcinoma], LUSC[Lung squamous cell carcinoma], OV[Ovarian serous cystadenocarcinoma ], PAAD[Pancreatic adenocarcinoma], PRAD[Prostate adenocarcinoma], SKCM[Skin Cutaneous Melanoma], STAD[Stomach adenocarcinoma], THCA[Thyroid carcinoma], UCEC[Uterine Corpus Endometrial Carcinoma] |
| Top |
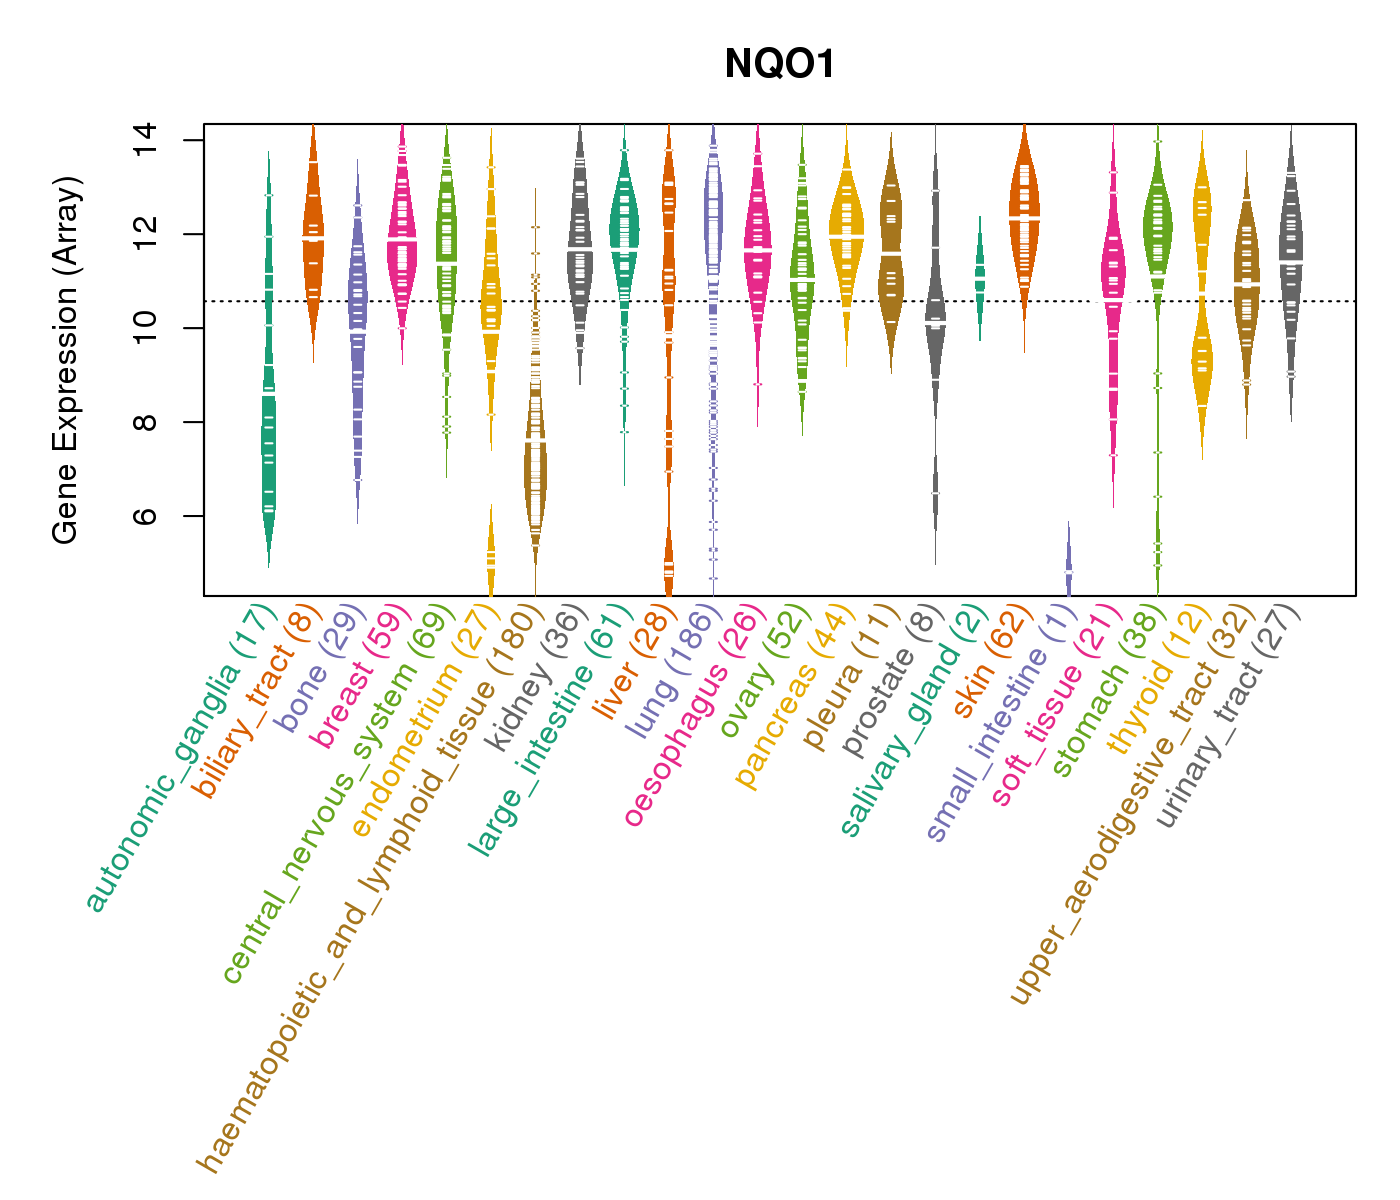
| Gene Expression for NQO1 |
| * CCLE gene expression data were extracted from CCLE_Expression_Entrez_2012-10-18.res: Gene-centric RMA-normalized mRNA expression data. |
 |
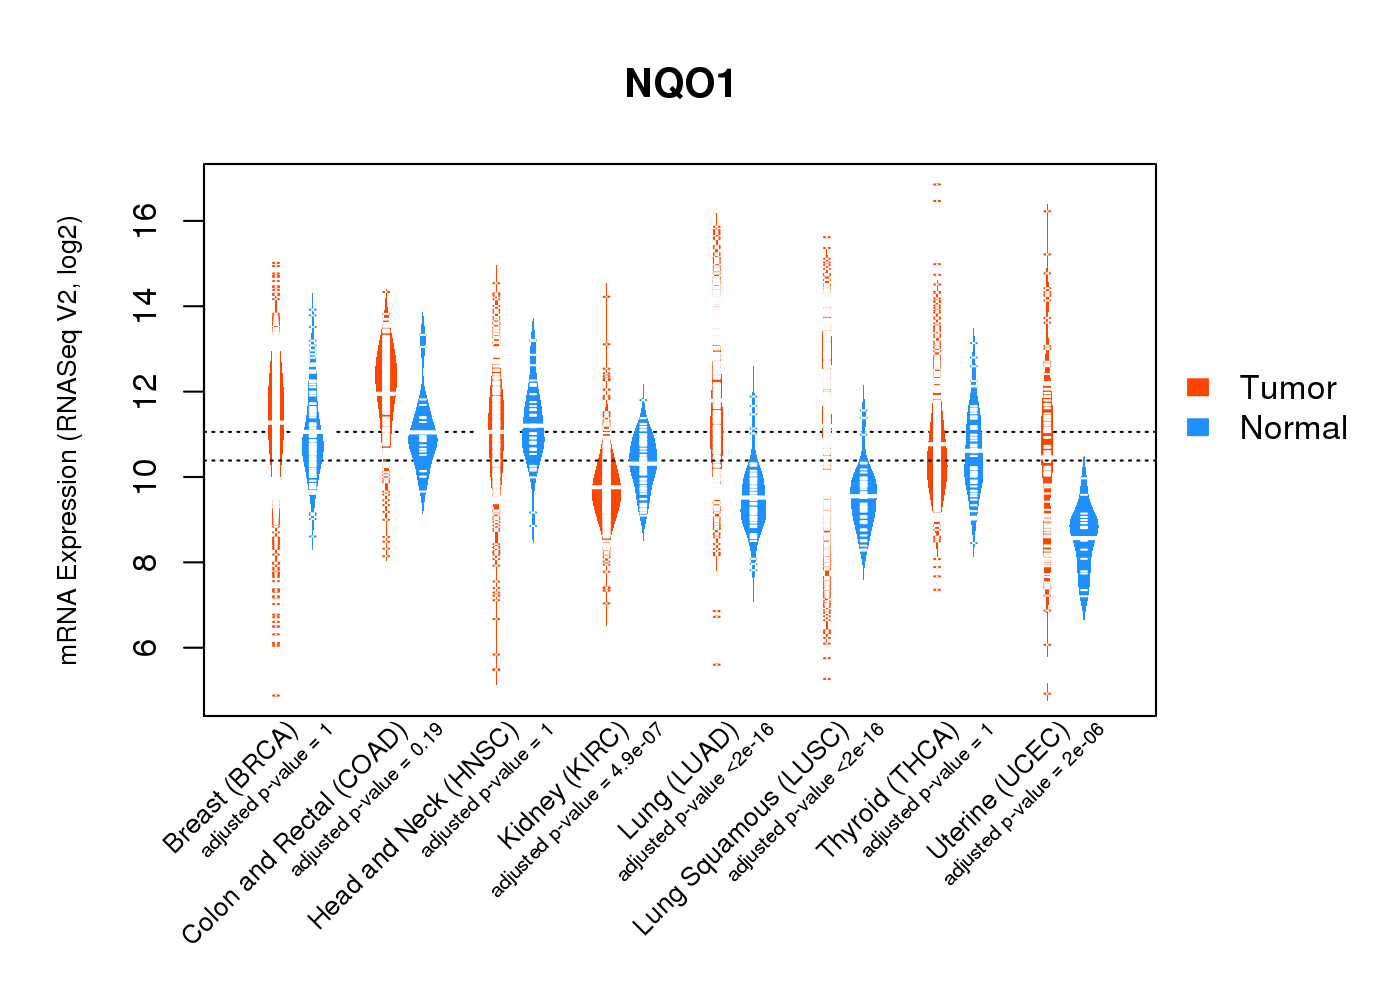
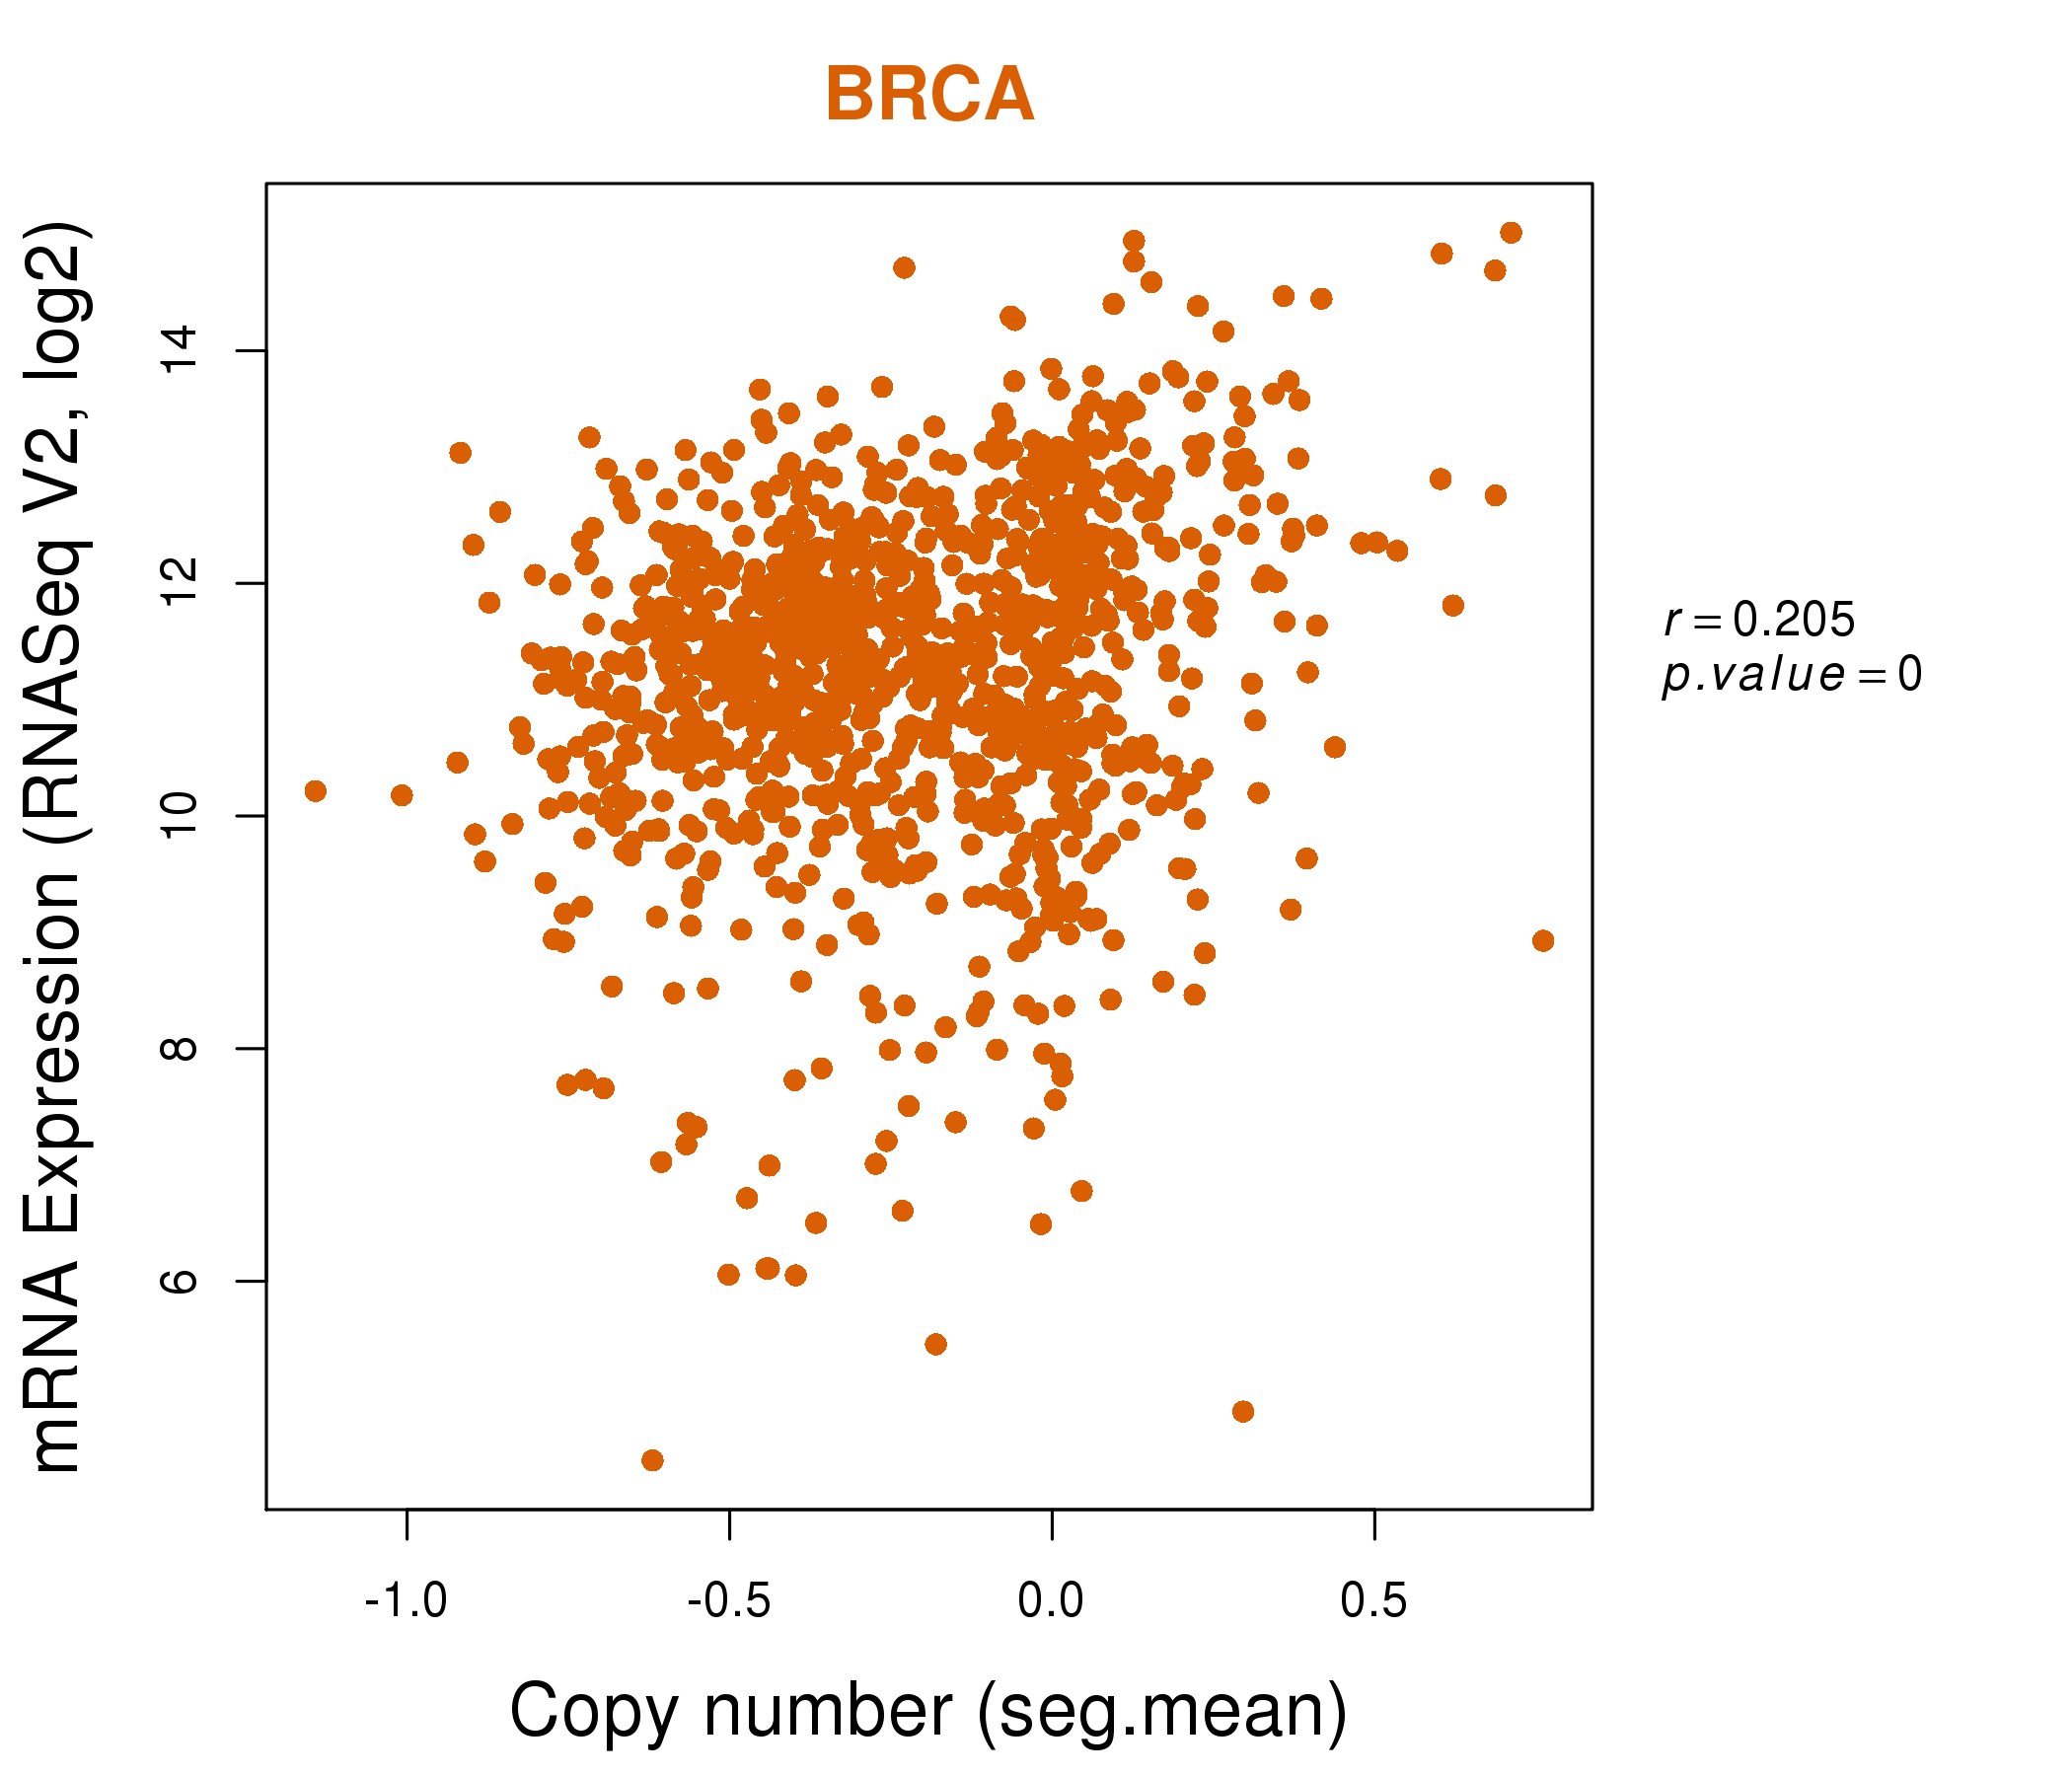
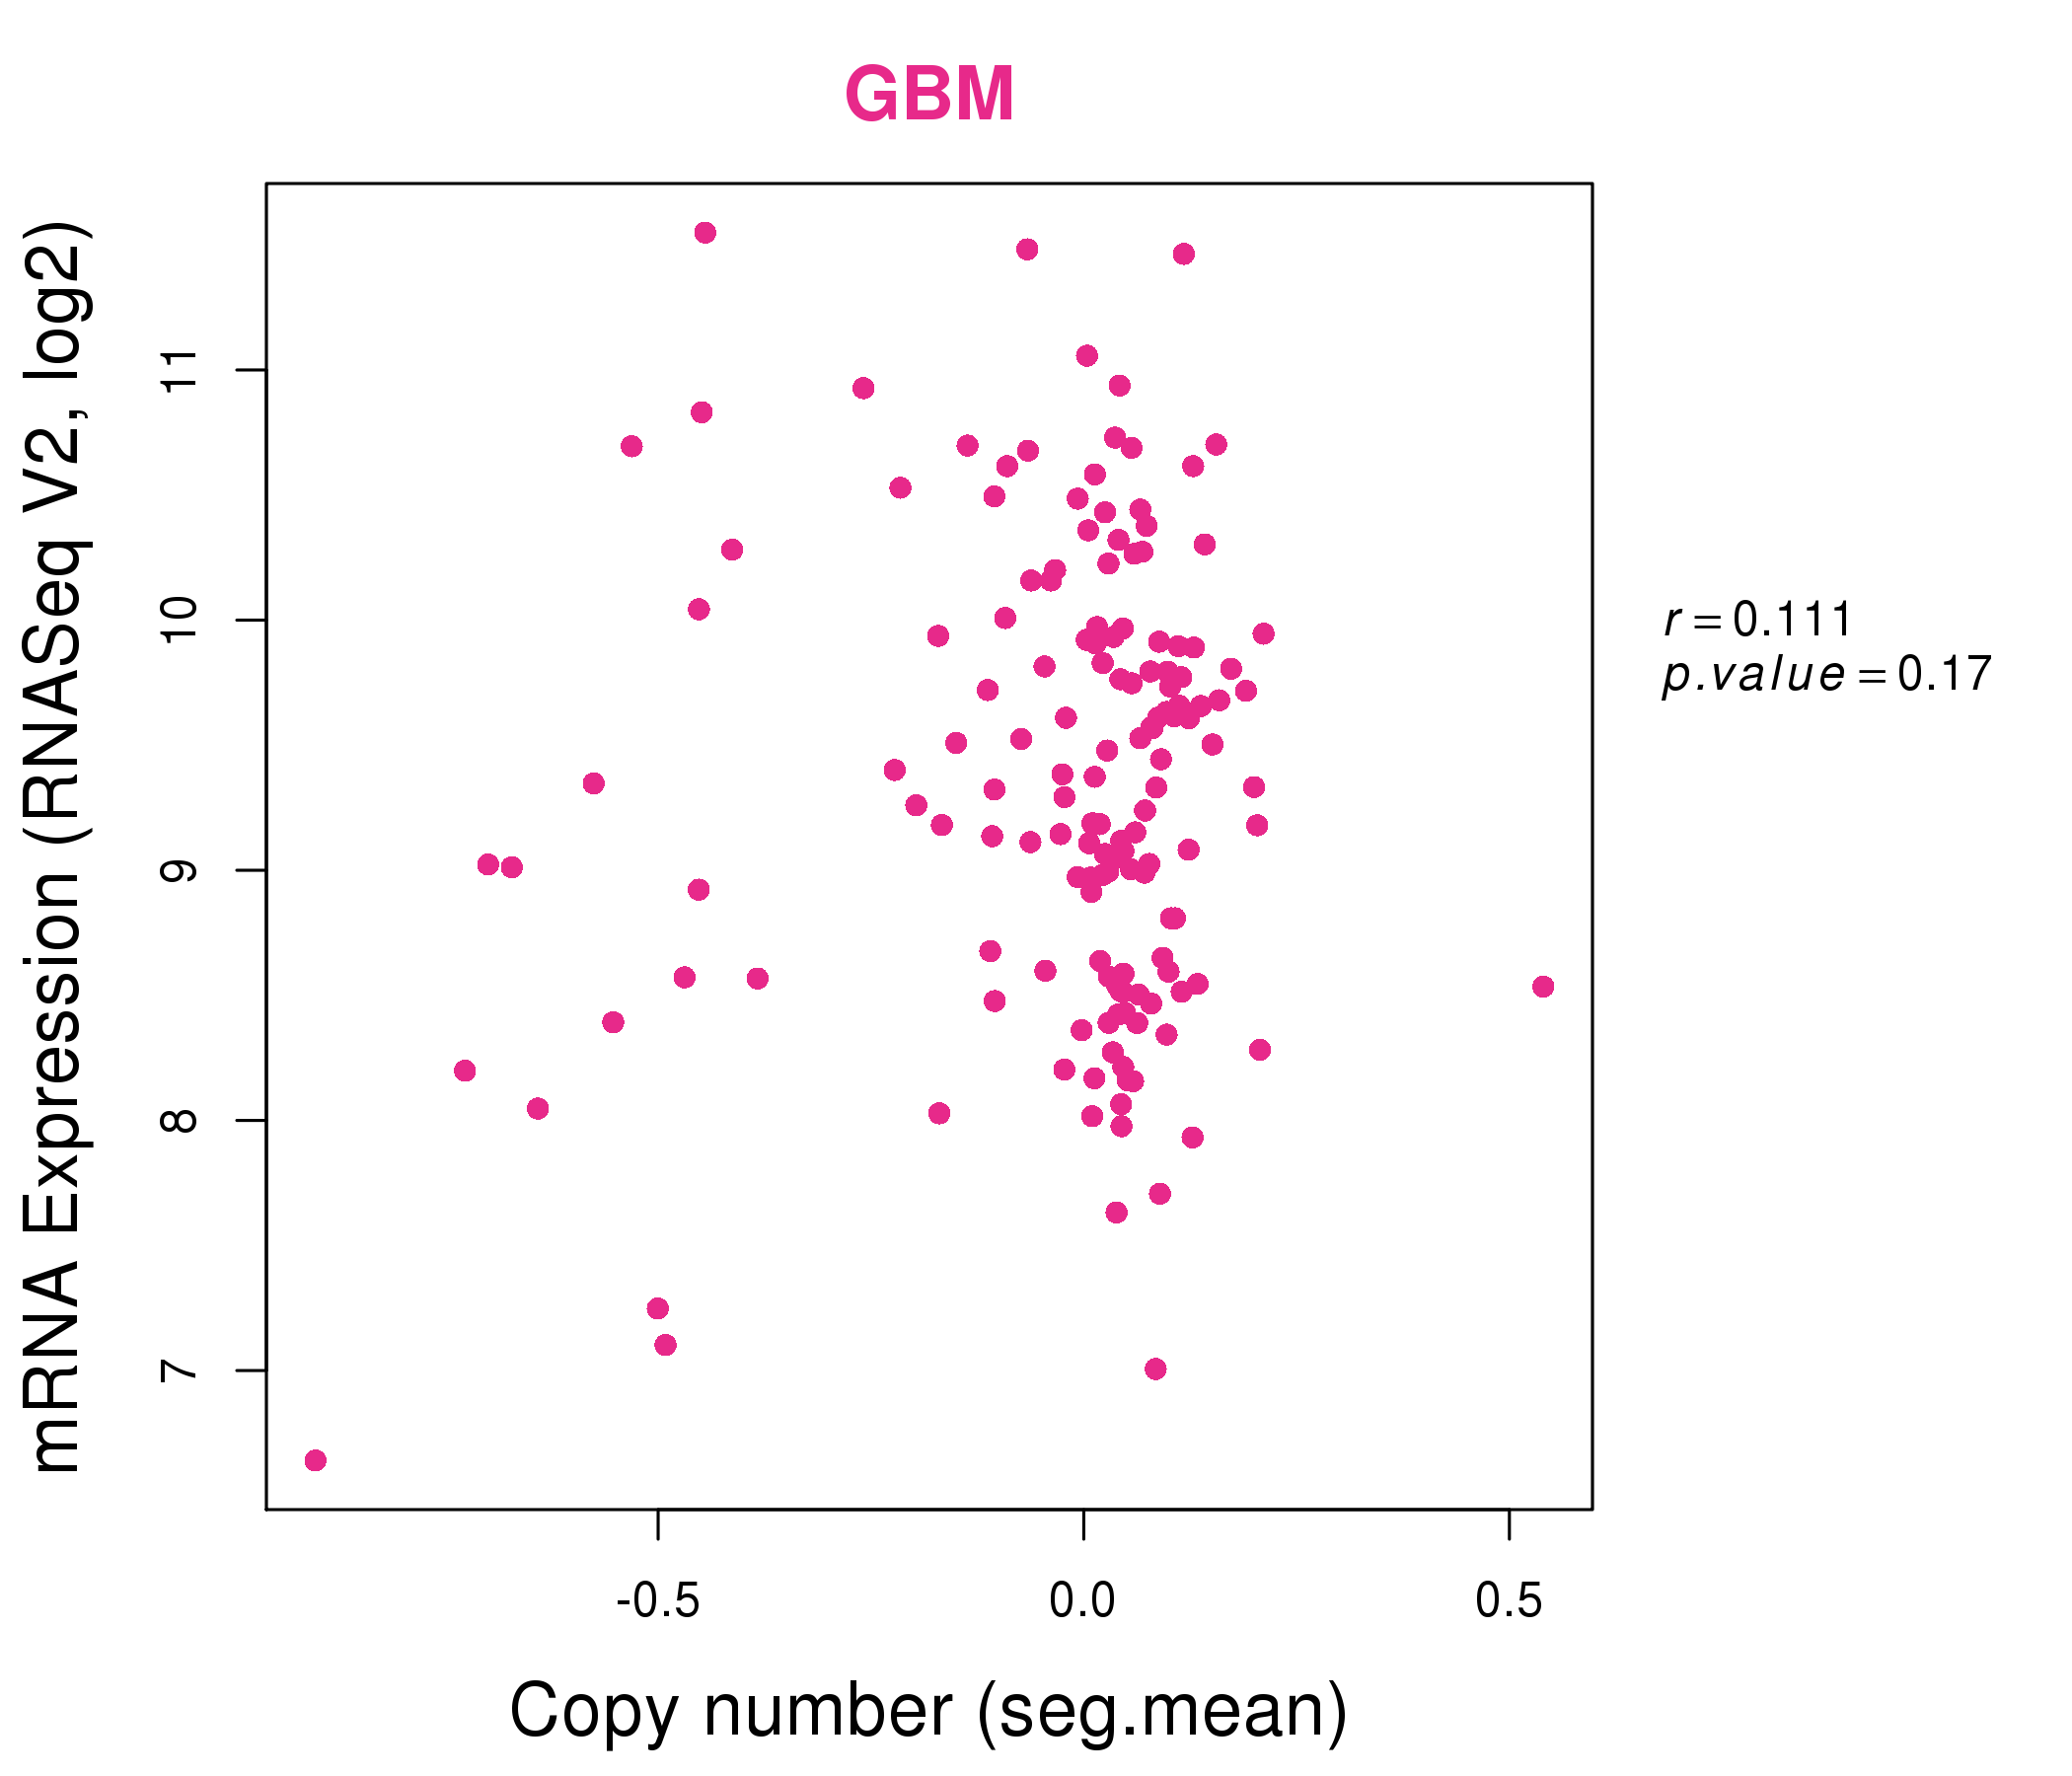
| * Normalized gene expression data of RNASeqV2 was extracted from TCGA using R package TCGA-Assembler. The URLs of all public data files on TCGA DCC data server were gathered at Jan-05-2015. Only eight cancer types have enough normal control samples for differential expression analysis. (t test, adjusted p<0.05 (using Benjamini-Hochberg FDR)) |
 |
| Top |
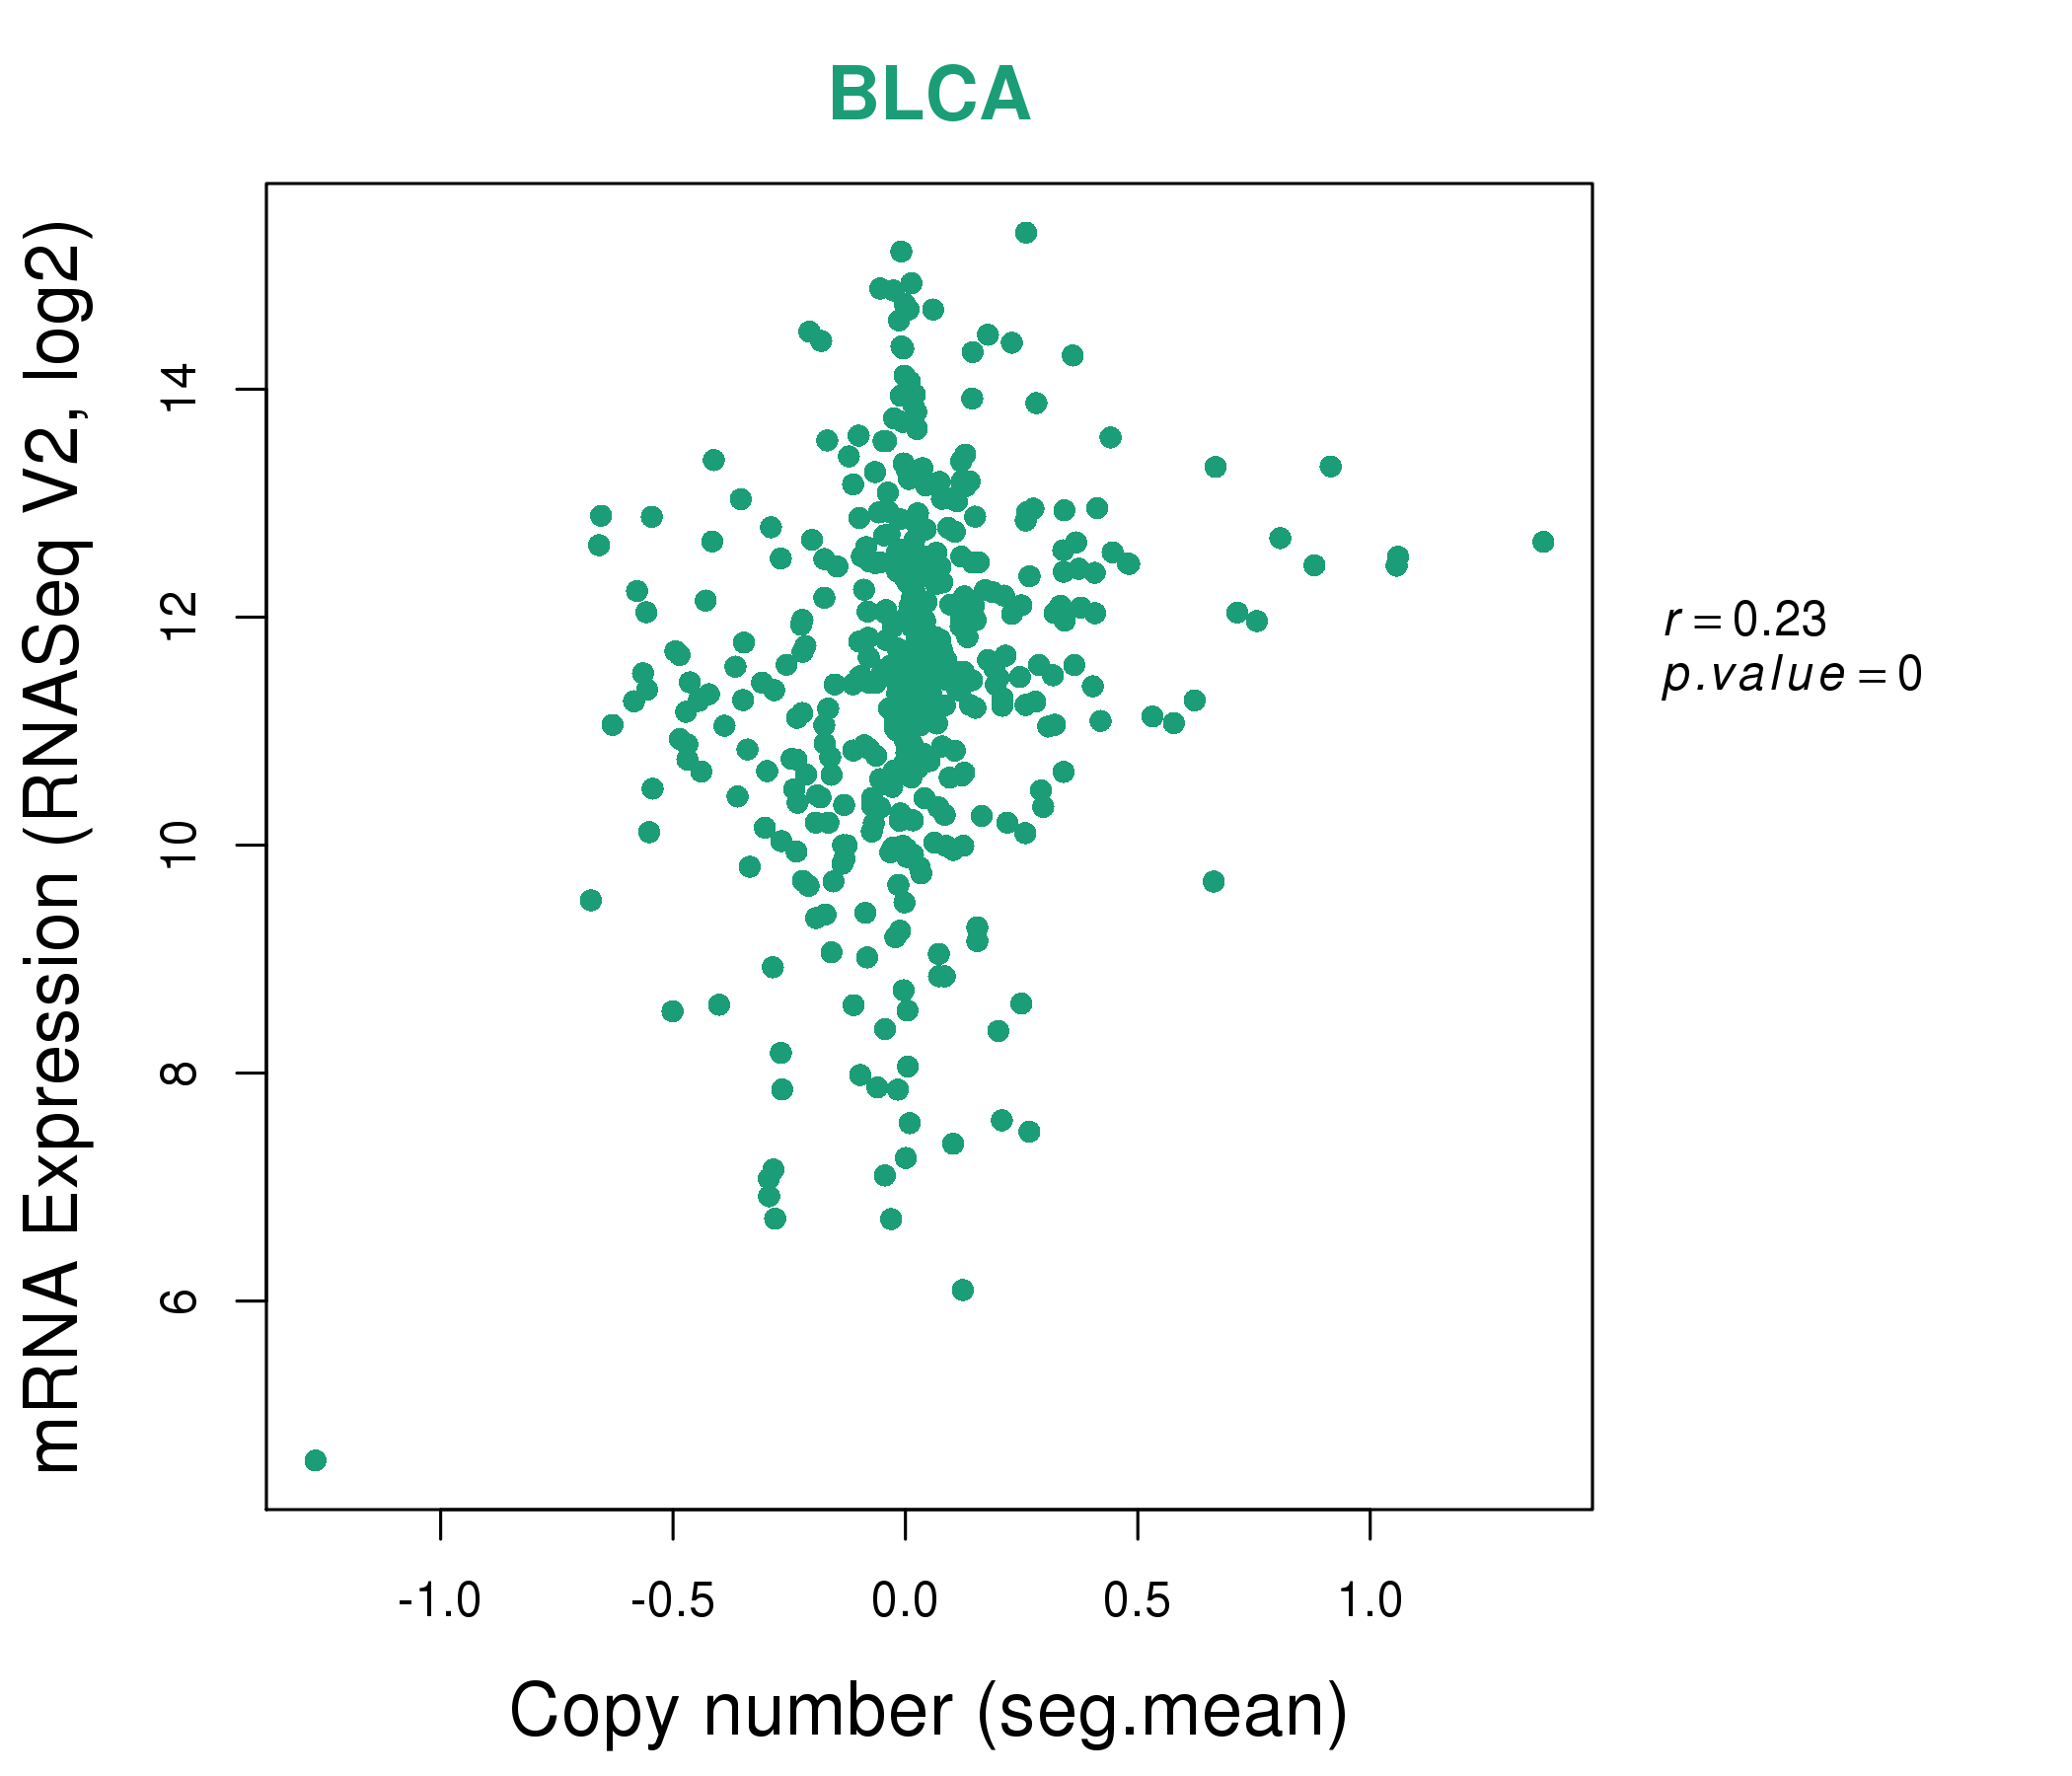
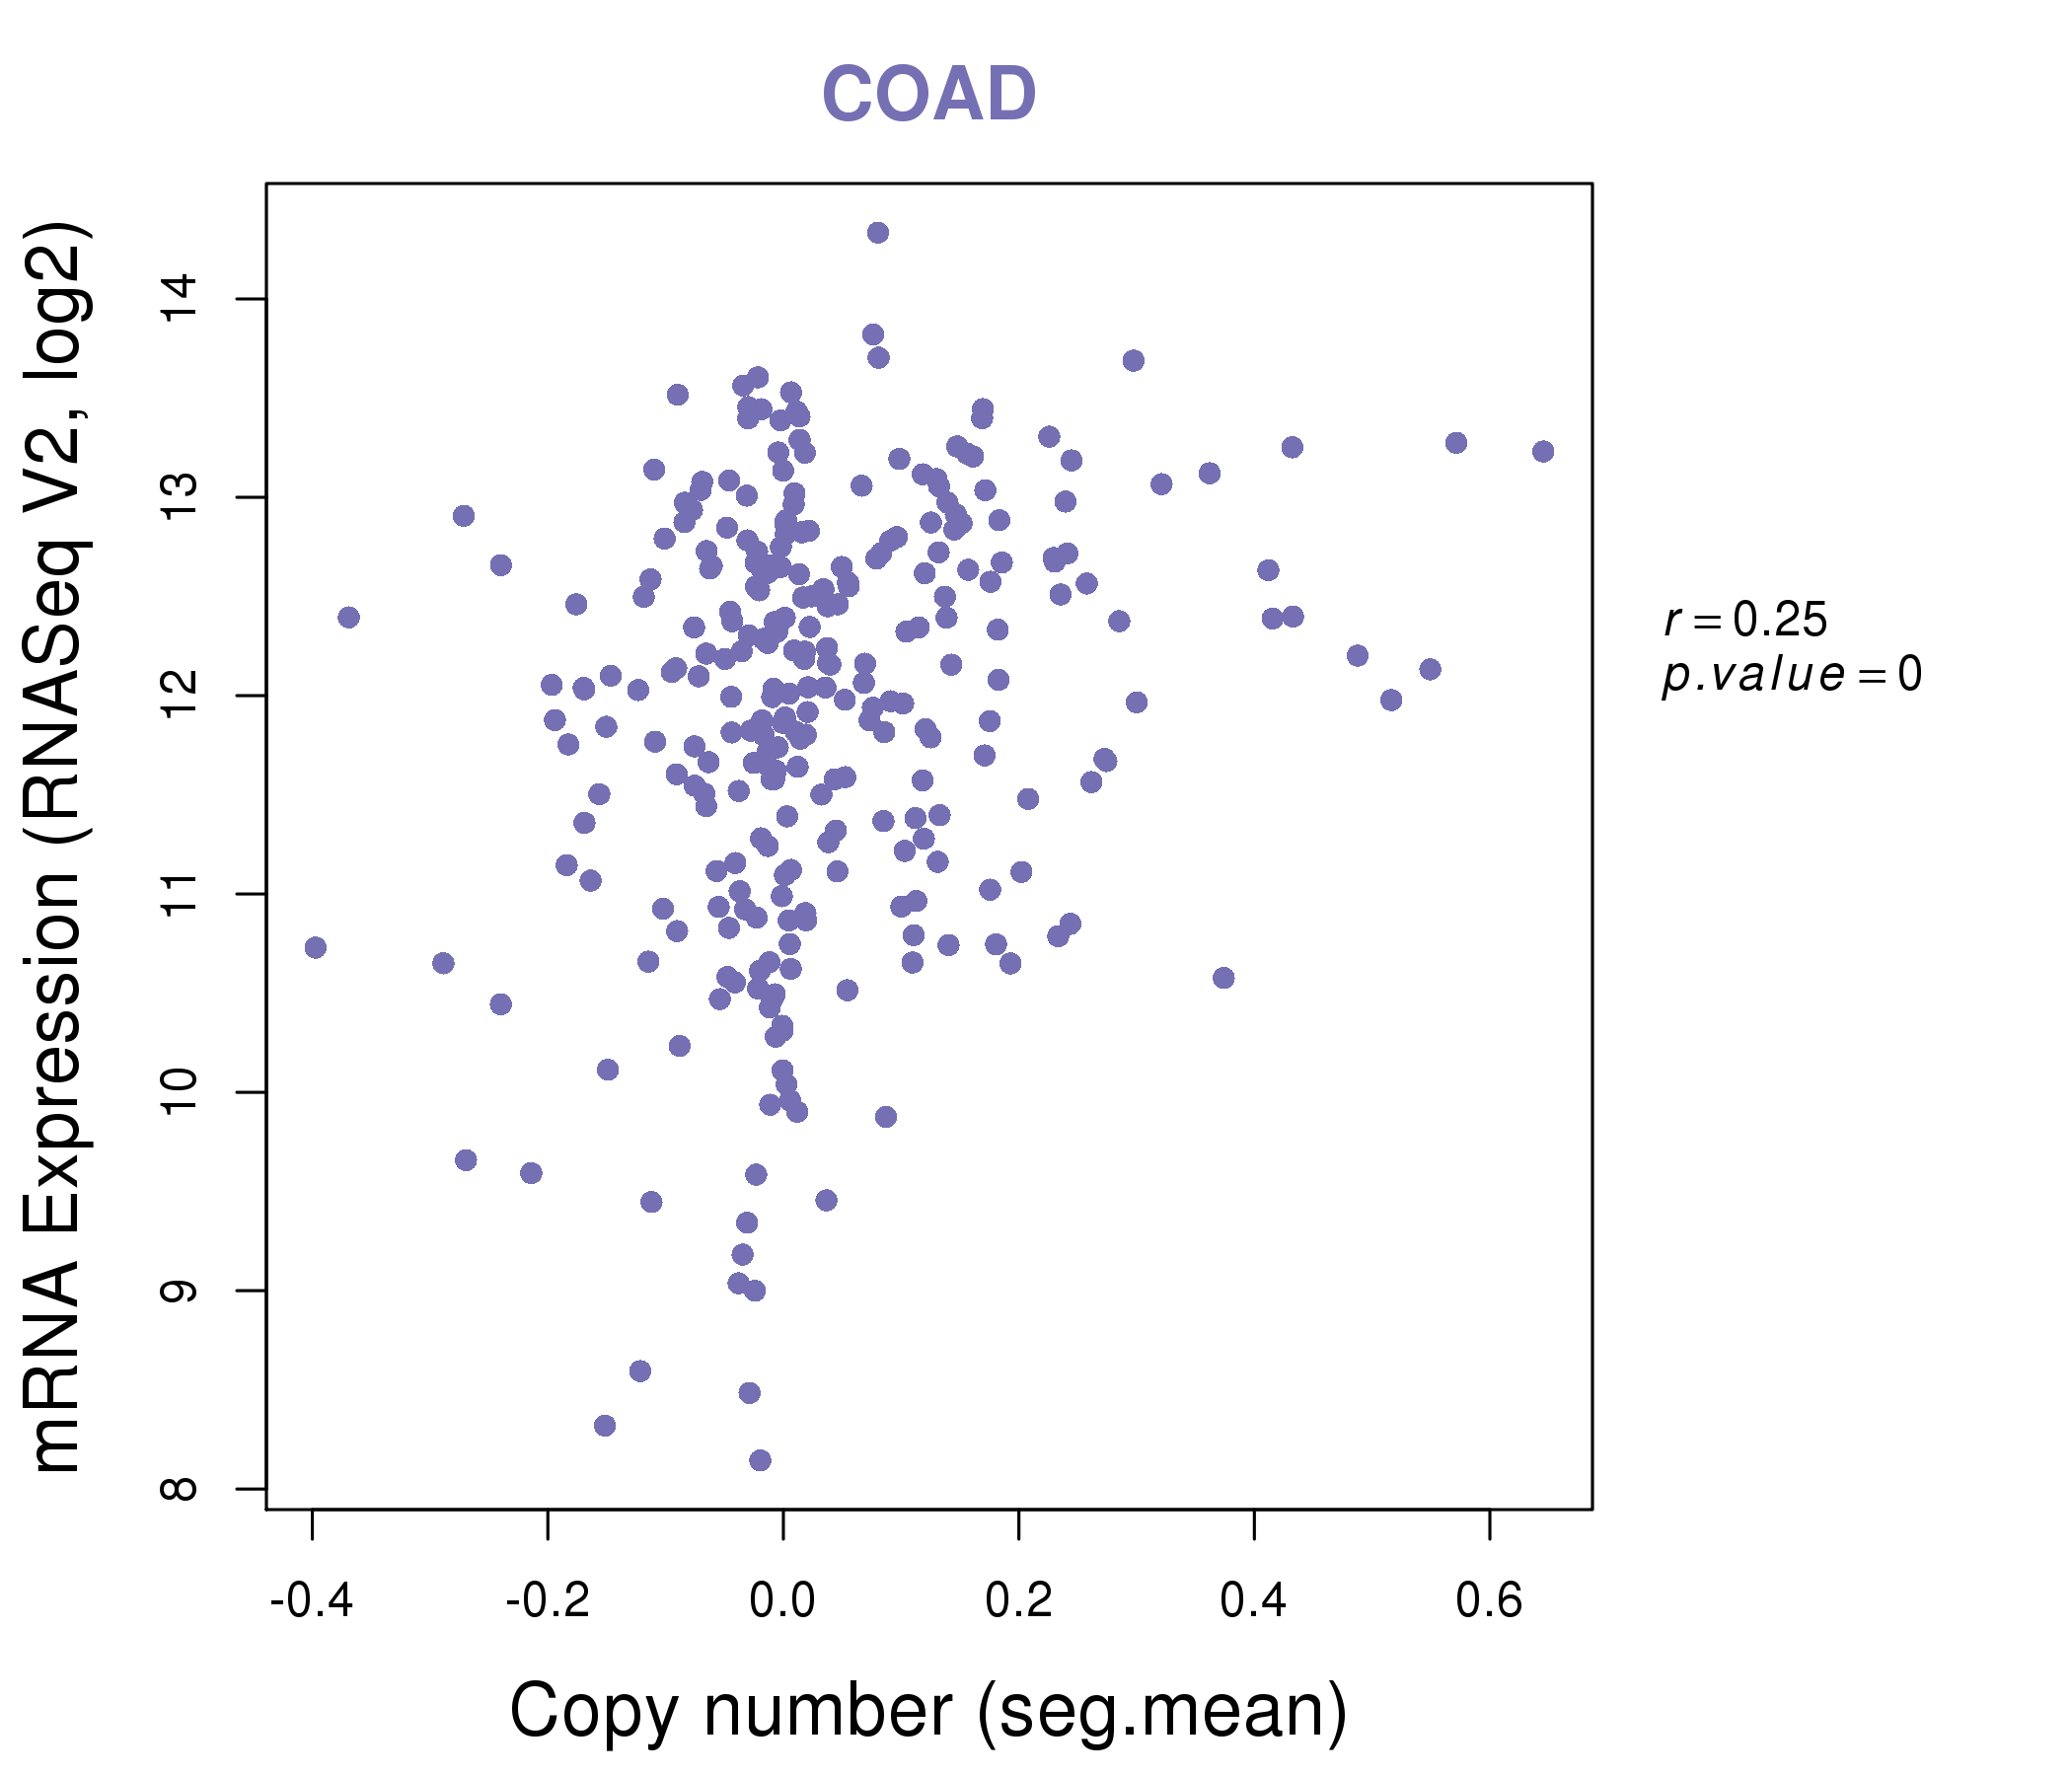
| * This plots show the correlation between CNV and gene expression. |
: Open all plots for all cancer types
 |
|
 |
|
| Top |
| Gene-Gene Network Information |
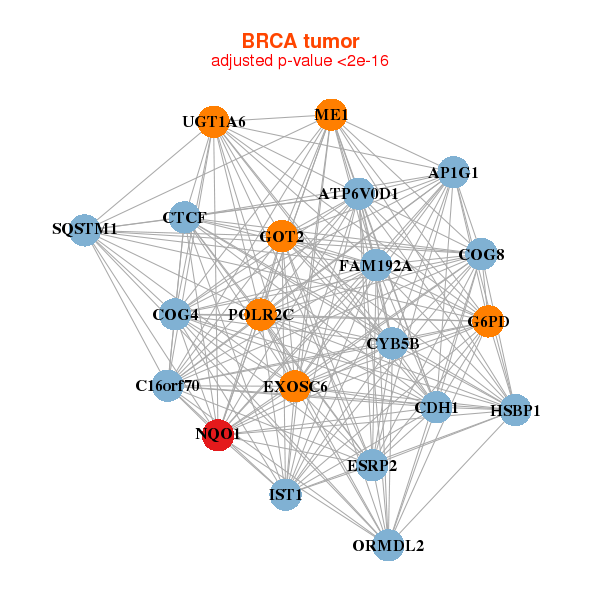
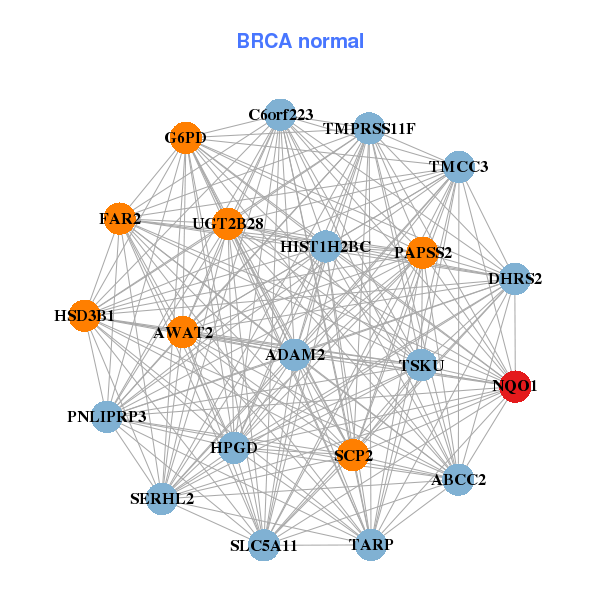
| * Co-Expression network figures were drawn using R package igraph. Only the top 20 genes with the highest correlations were shown. Red circle: input gene, orange circle: cell metabolism gene, sky circle: other gene |
: Open all plots for all cancer types
 |
| ||||
| AP1G1,ATP6V0D1,C16orf70,CDH1,COG4,COG8,CTCF, CYB5B,ESRP2,EXOSC6,FAM192A,G6PD,GOT2,HSBP1, IST1,ME1,NQO1,ORMDL2,POLR2C,SQSTM1,UGT1A6 | ABCC2,ADAM2,AWAT2,C6orf223,DHRS2,FAR2,G6PD, HIST1H2BC,HPGD,HSD3B1,NQO1,PAPSS2,PNLIPRP3,SCP2, SERHL2,SLC5A11,TARP,TMCC3,TMPRSS11F,TSKU,UGT2B28 | ||||
 |
| ||||
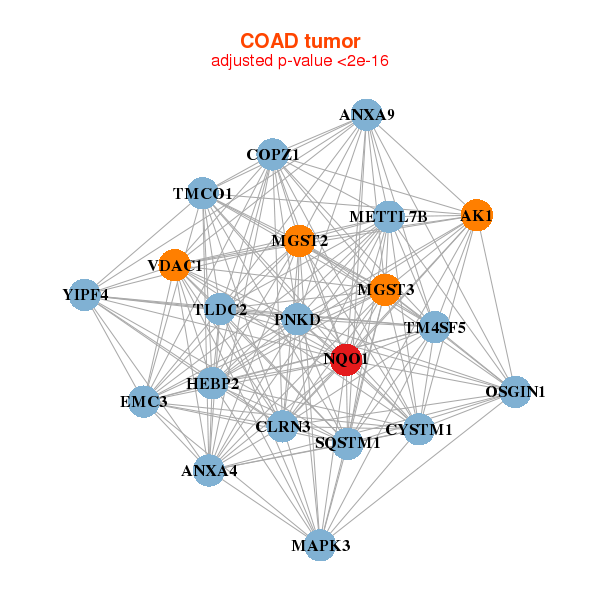
| AK1,ANXA4,ANXA9,TLDC2,CYSTM1,CLRN3,COPZ1, HEBP2,MAPK3,METTL7B,MGST2,MGST3,NQO1,OSGIN1, PNKD,SQSTM1,TM4SF5,TMCO1,EMC3,VDAC1,YIPF4 | ABHD5,ASB11,CA2,CSN1S1,CSTB,CYP2B7P,MICU2, ETNK1,GDPD3,IQCD,NQO1,OASL,SLC25A24,SLC25A33, SLC4A9,SRI,TAT,TMEM56,TPMT,UBE2A,UGDH |
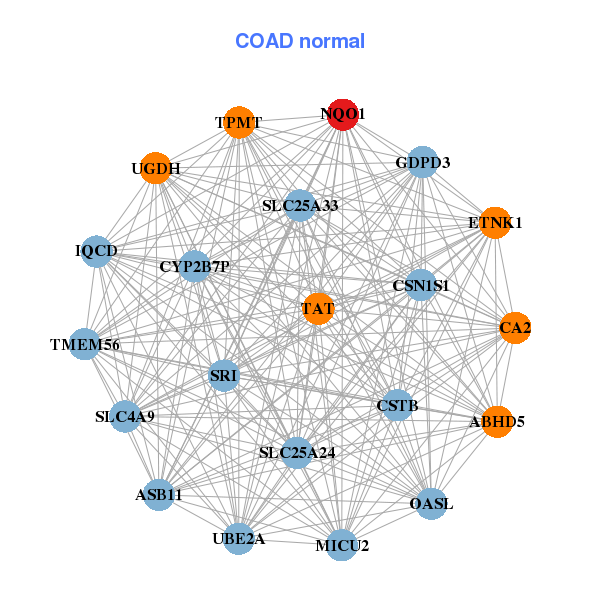
| * Co-Expression network figures were drawn using R package igraph. Only the top 20 genes with the highest correlations were shown. Red circle: input gene, orange circle: cell metabolism gene, sky circle: other gene |
: Open all plots for all cancer types
| Top |
: Open all interacting genes' information including KEGG pathway for all interacting genes from DAVID
| Top |
| Pharmacological Information for NQO1 |
| DB Category | DB Name | DB's ID and Url link |
| Chemistry | BindingDB | P15559; -. |
| Chemistry | ChEMBL | CHEMBL3623; -. |
| Organism-specific databases | PharmGKB | PA31744; -. |
| Organism-specific databases | CTD | 1728; -. |
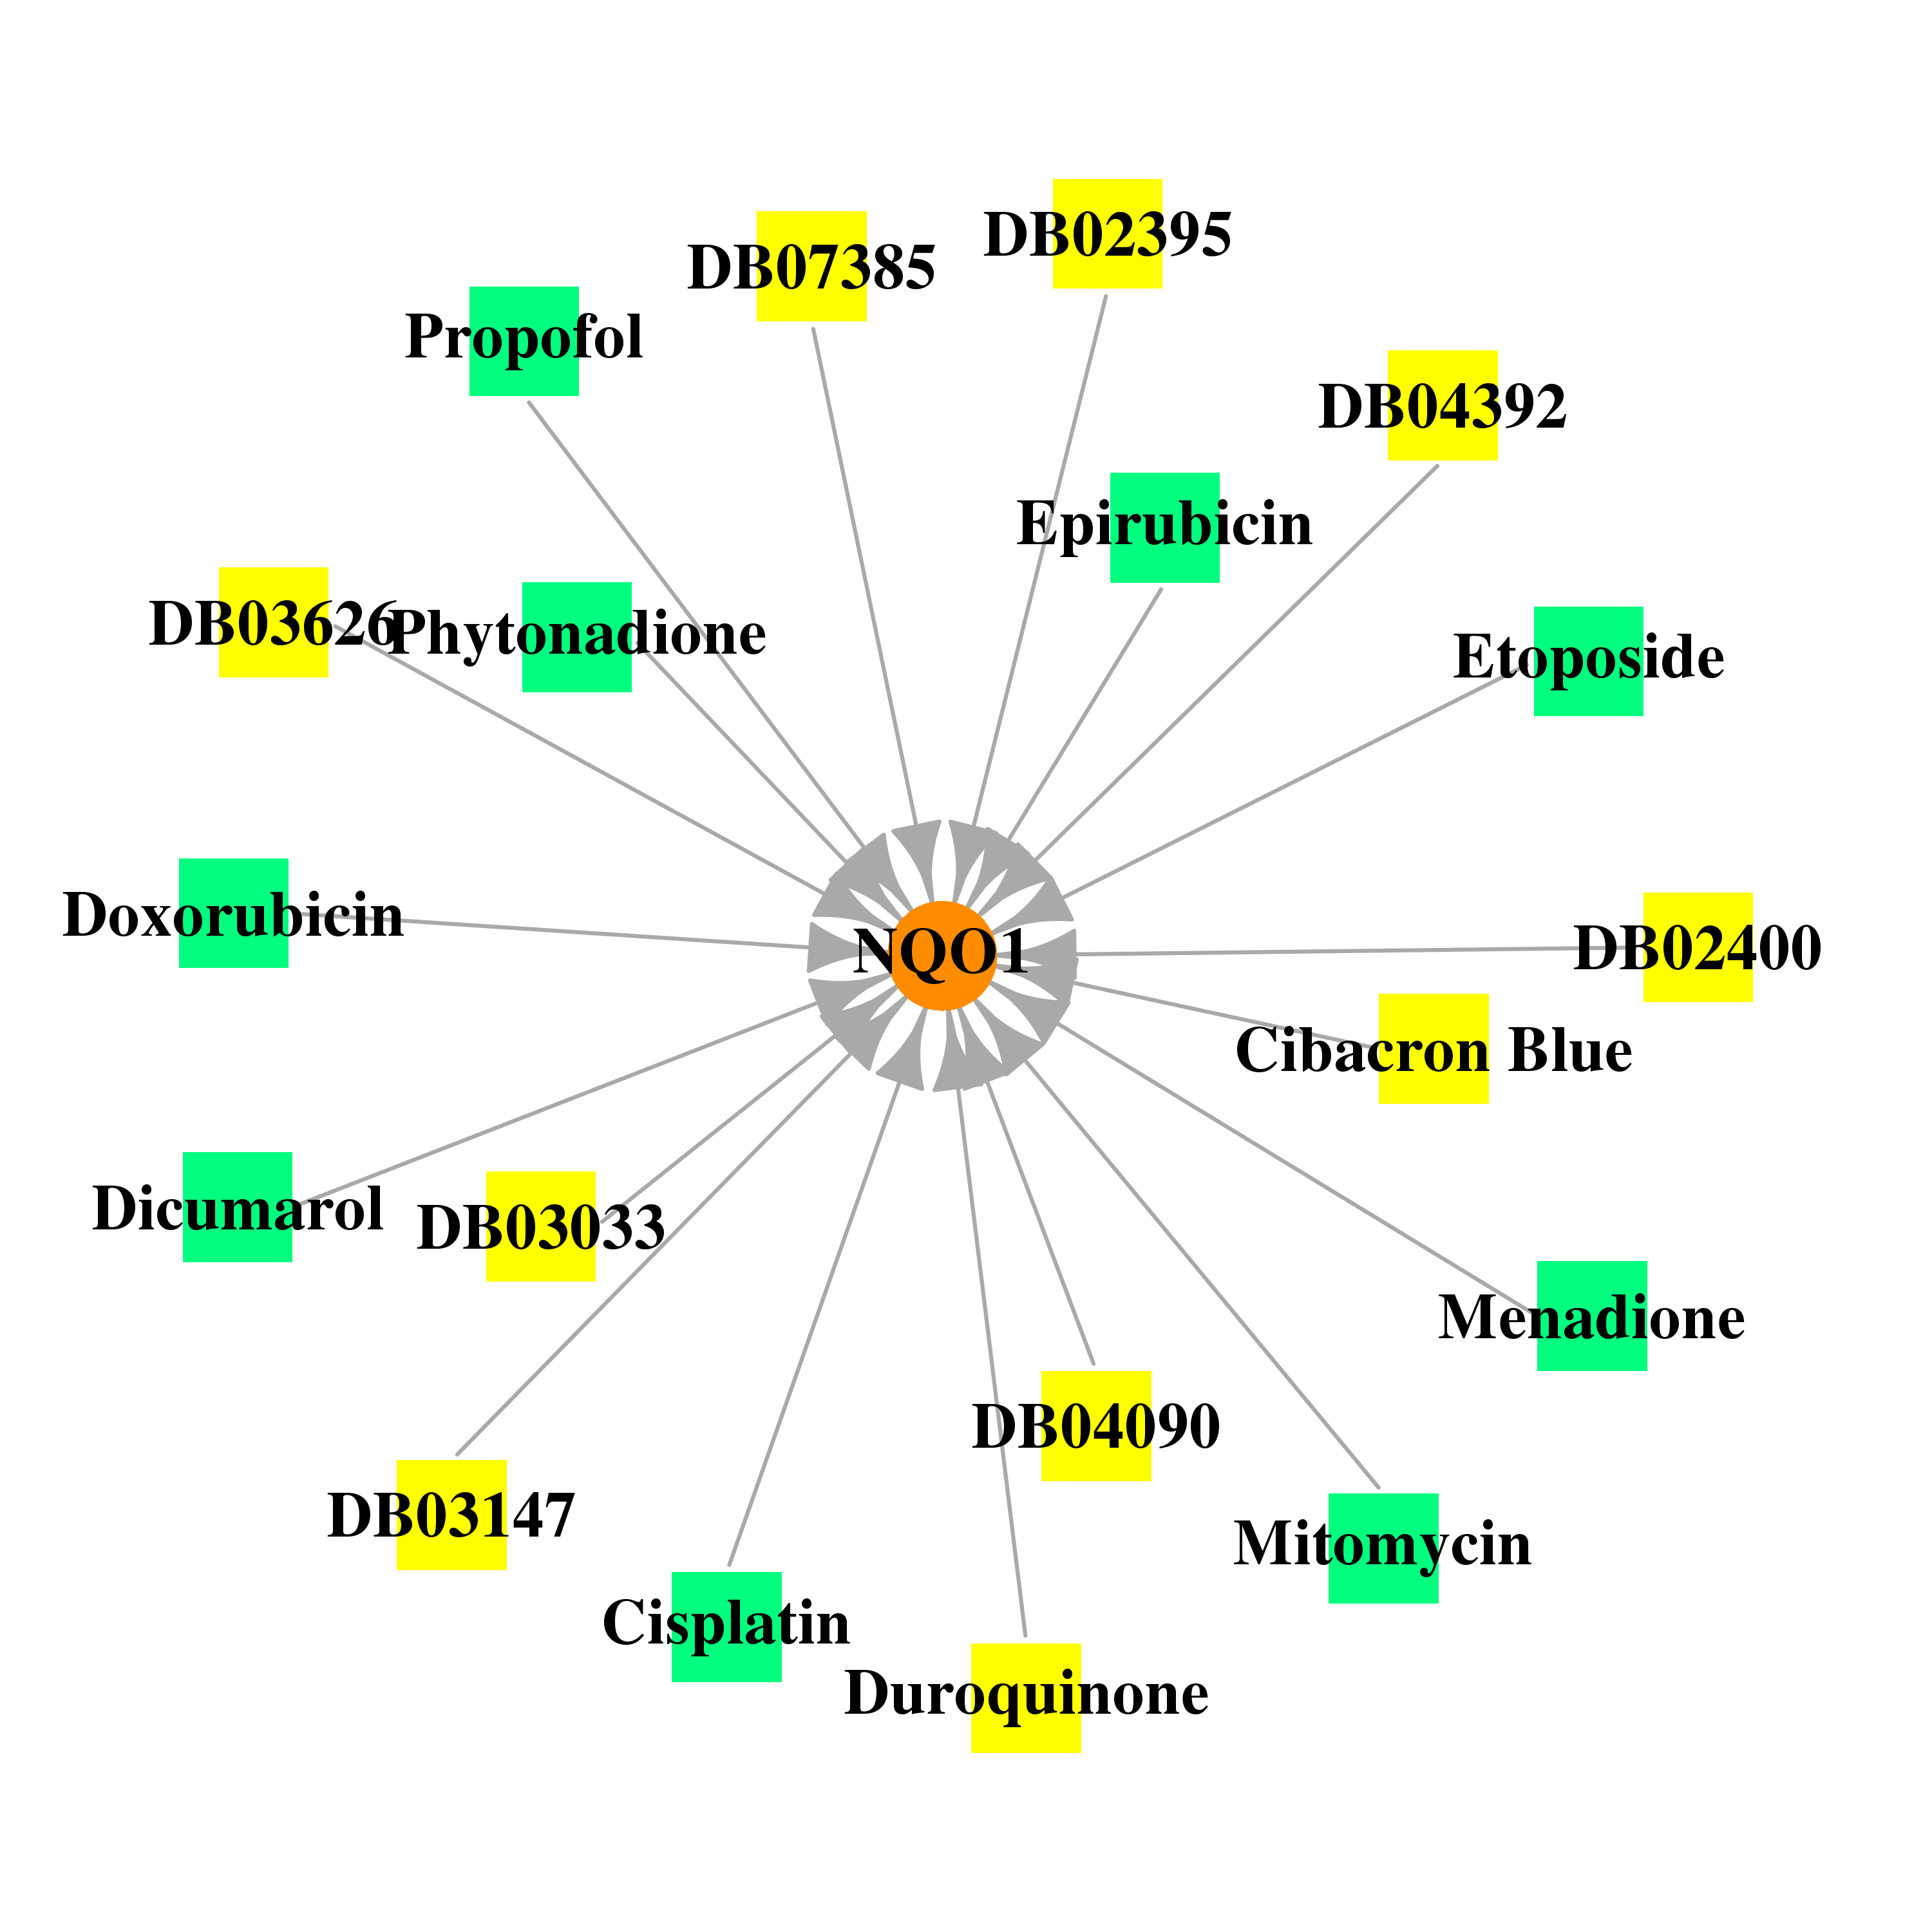
| * Gene Centered Interaction Network. |
 |
| * Drug Centered Interaction Network. |
| DrugBank ID | Target Name | Drug Groups | Generic Name | Drug Centered Network | Drug Structure |
| DB00170 | NAD(P)H dehydrogenase, quinone 1 | approved; nutraceutical | Menadione |  |  |
| DB00266 | NAD(P)H dehydrogenase, quinone 1 | approved | Dicumarol | 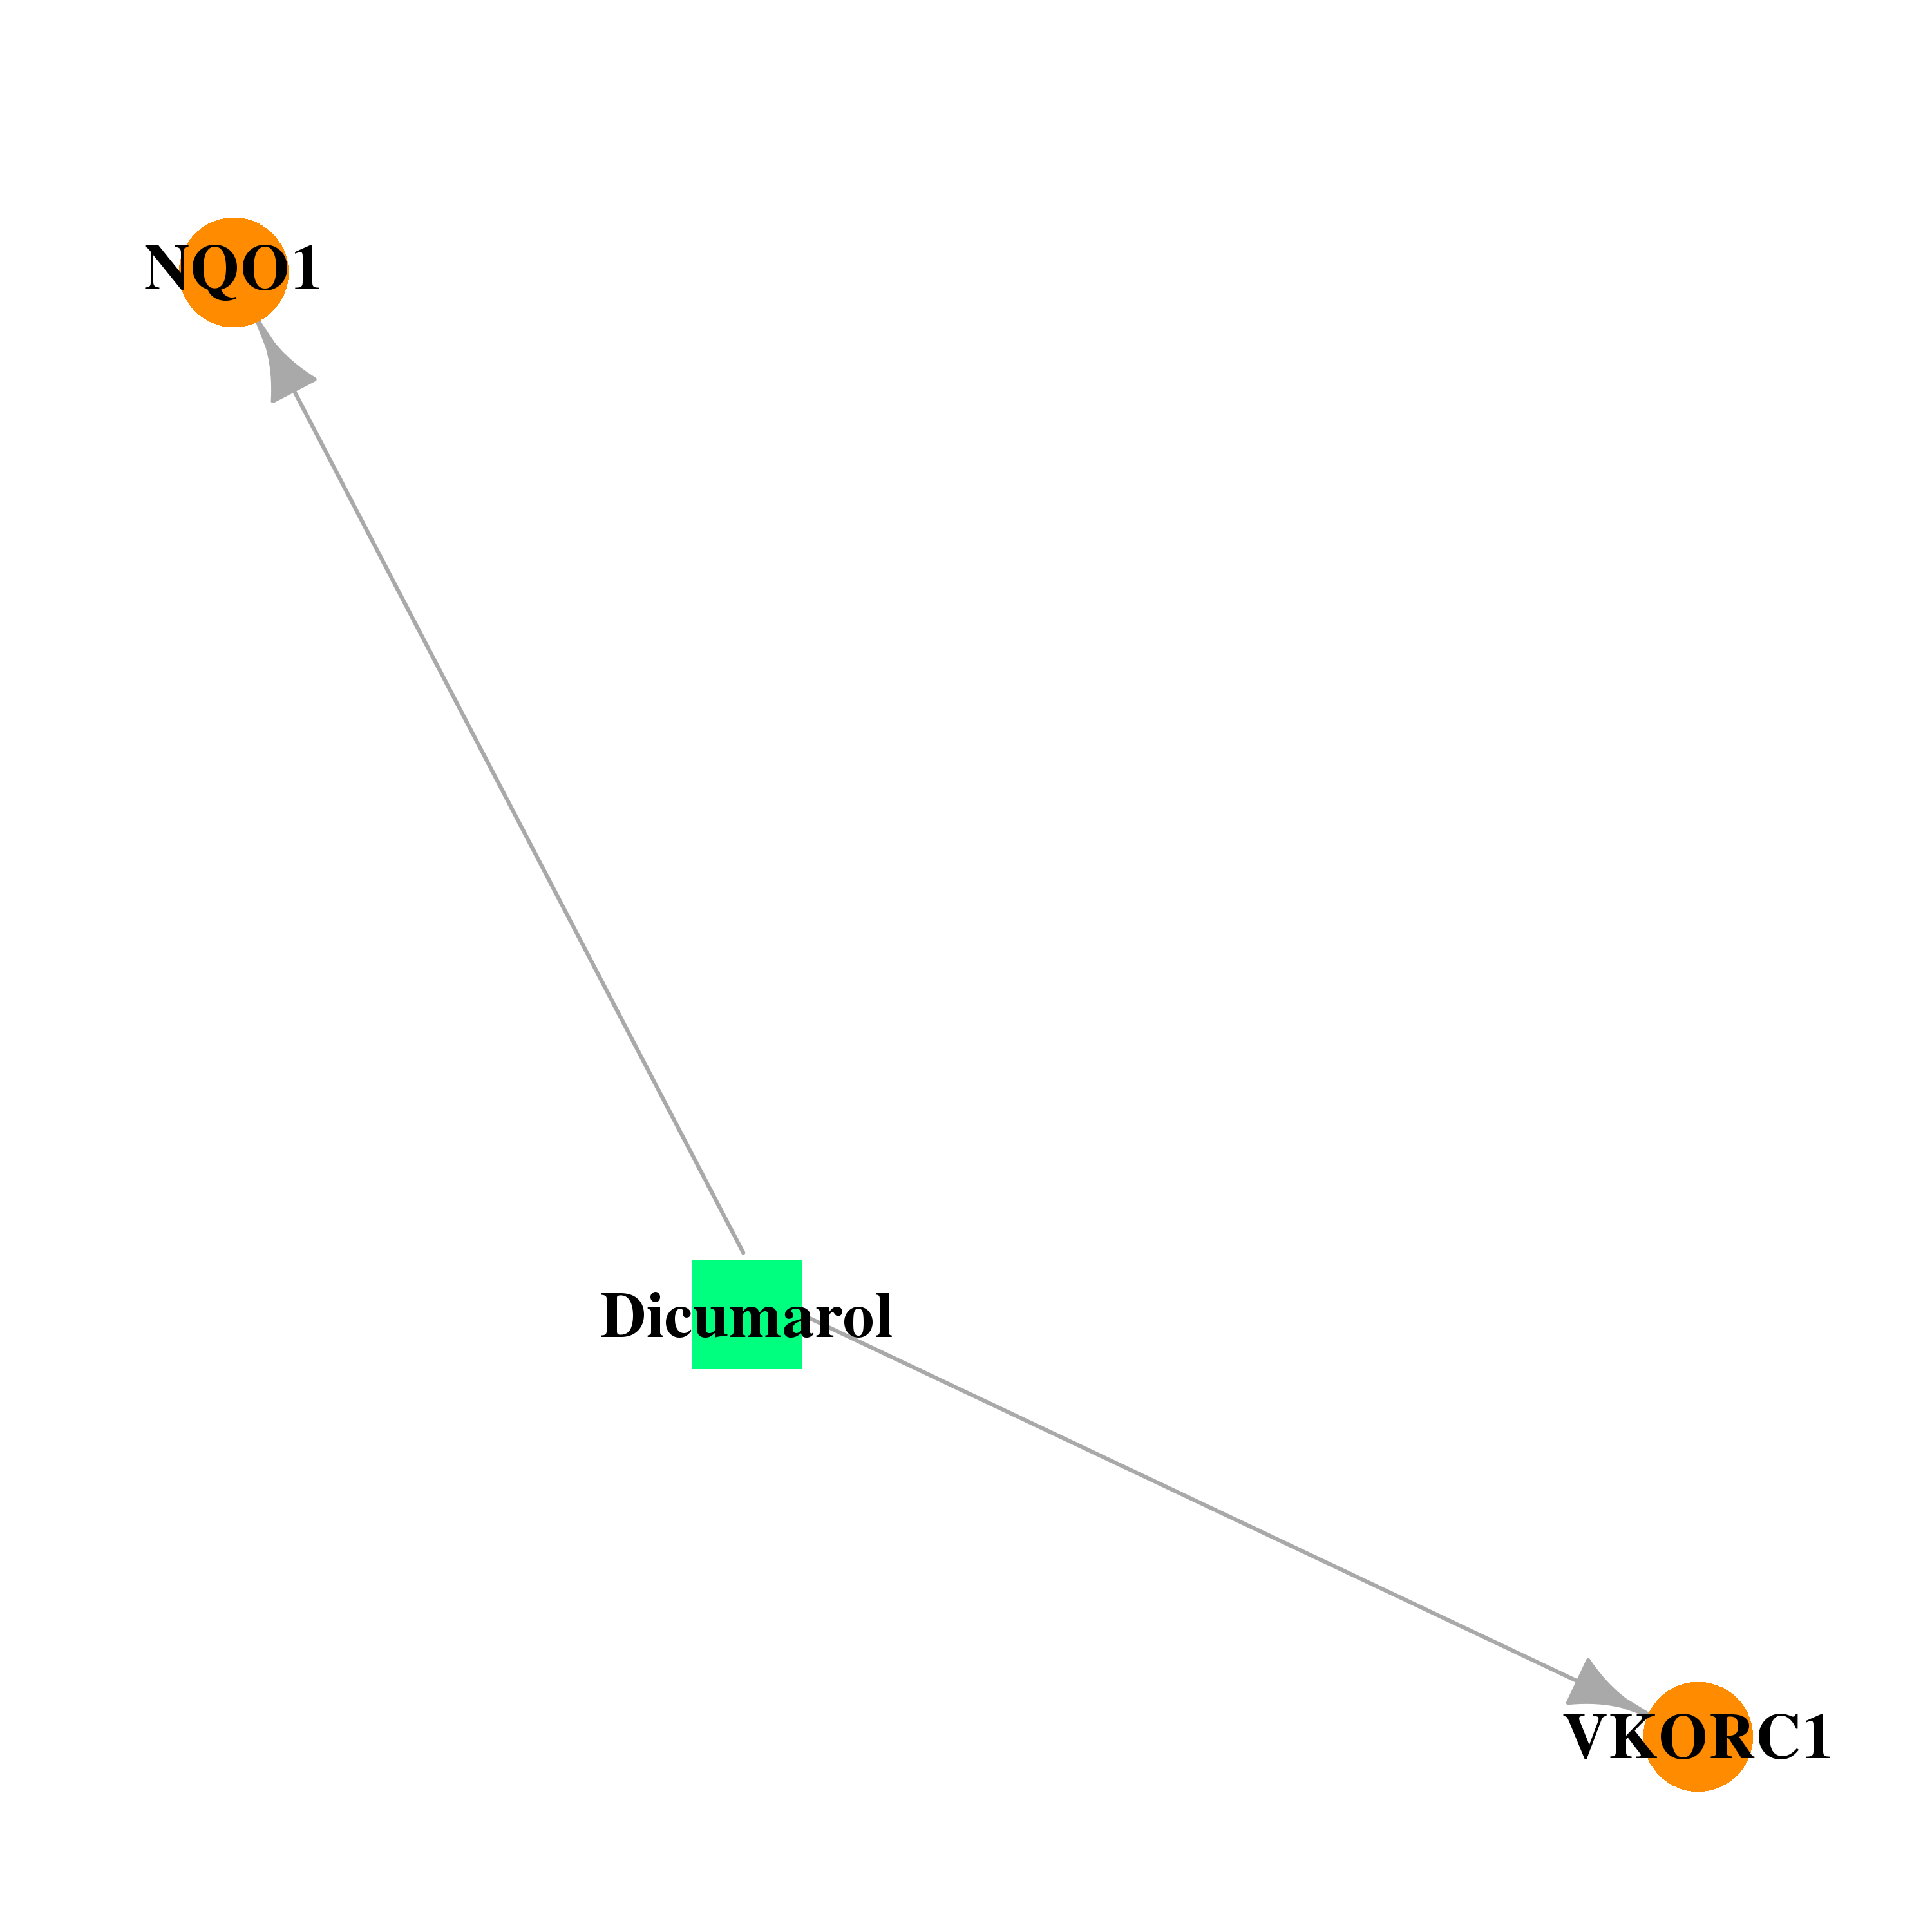 |  |
| DB01927 | NAD(P)H dehydrogenase, quinone 1 | experimental | Duroquinone | 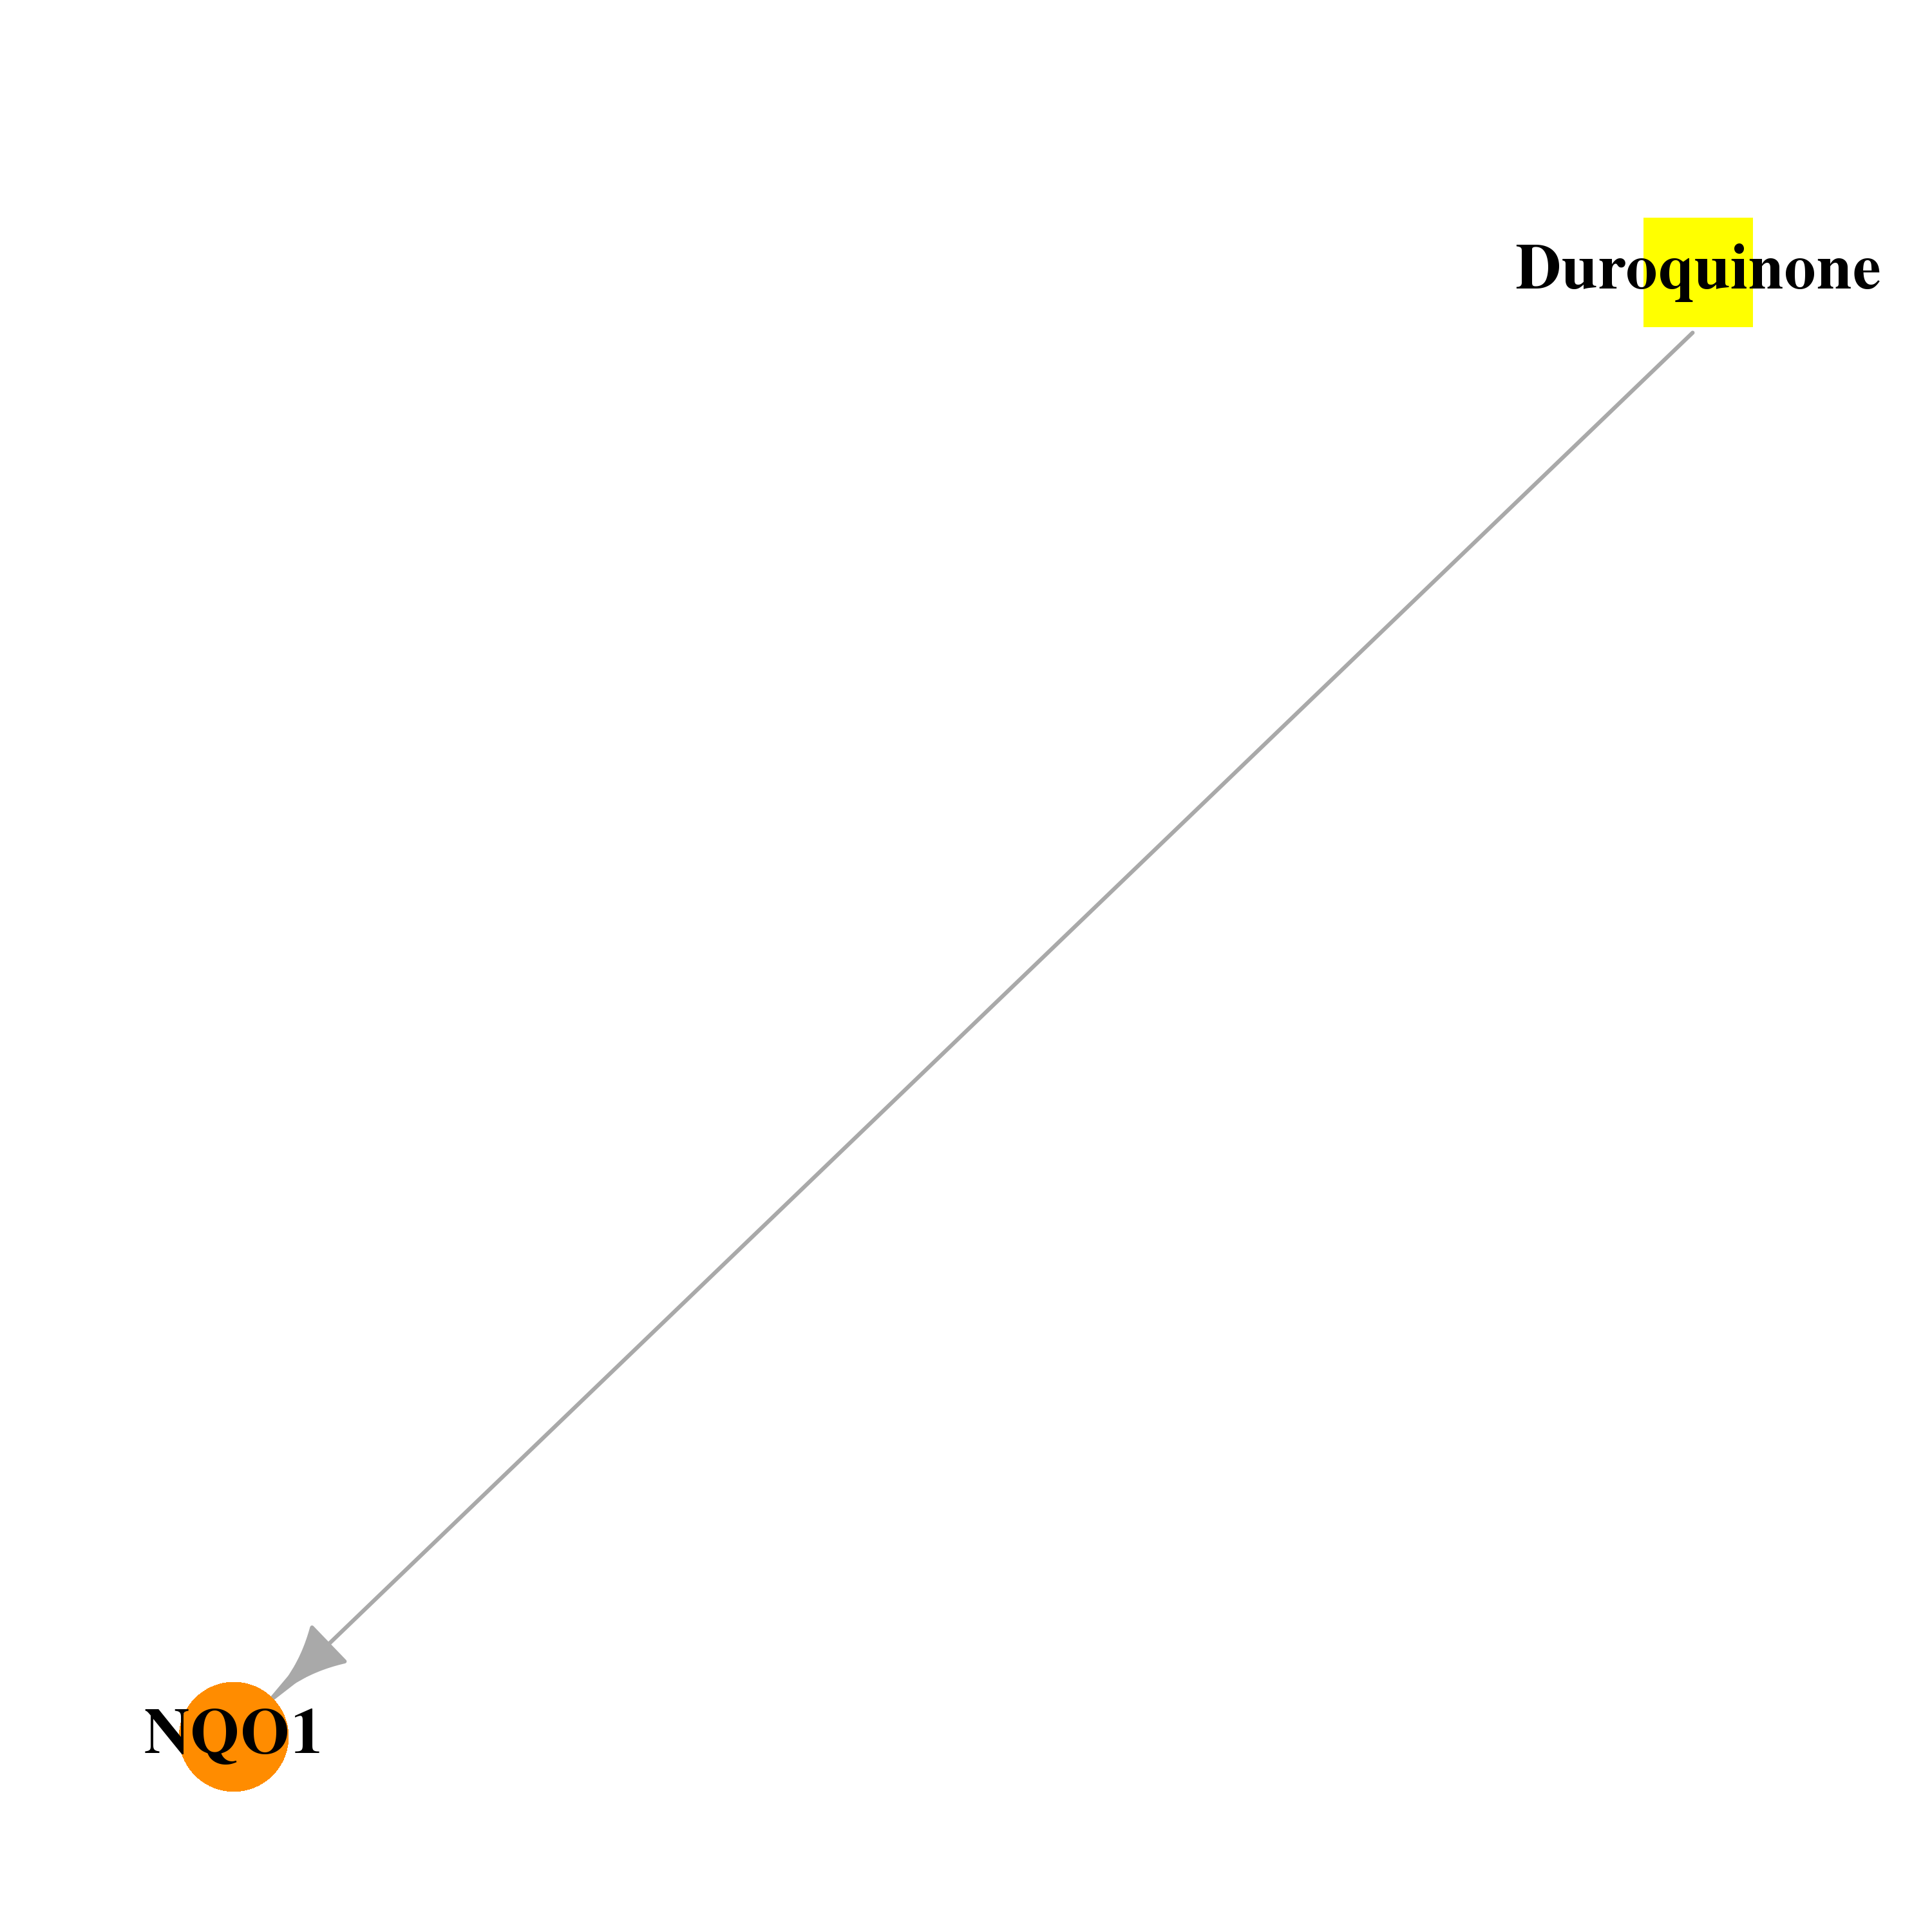 |  |
| DB02395 | NAD(P)H dehydrogenase, quinone 1 | experimental | 3-Hydroxymethyl-5-Aziridinyl-1methyl-2-[1h-Indole-4,7-Dione]-Propanol | 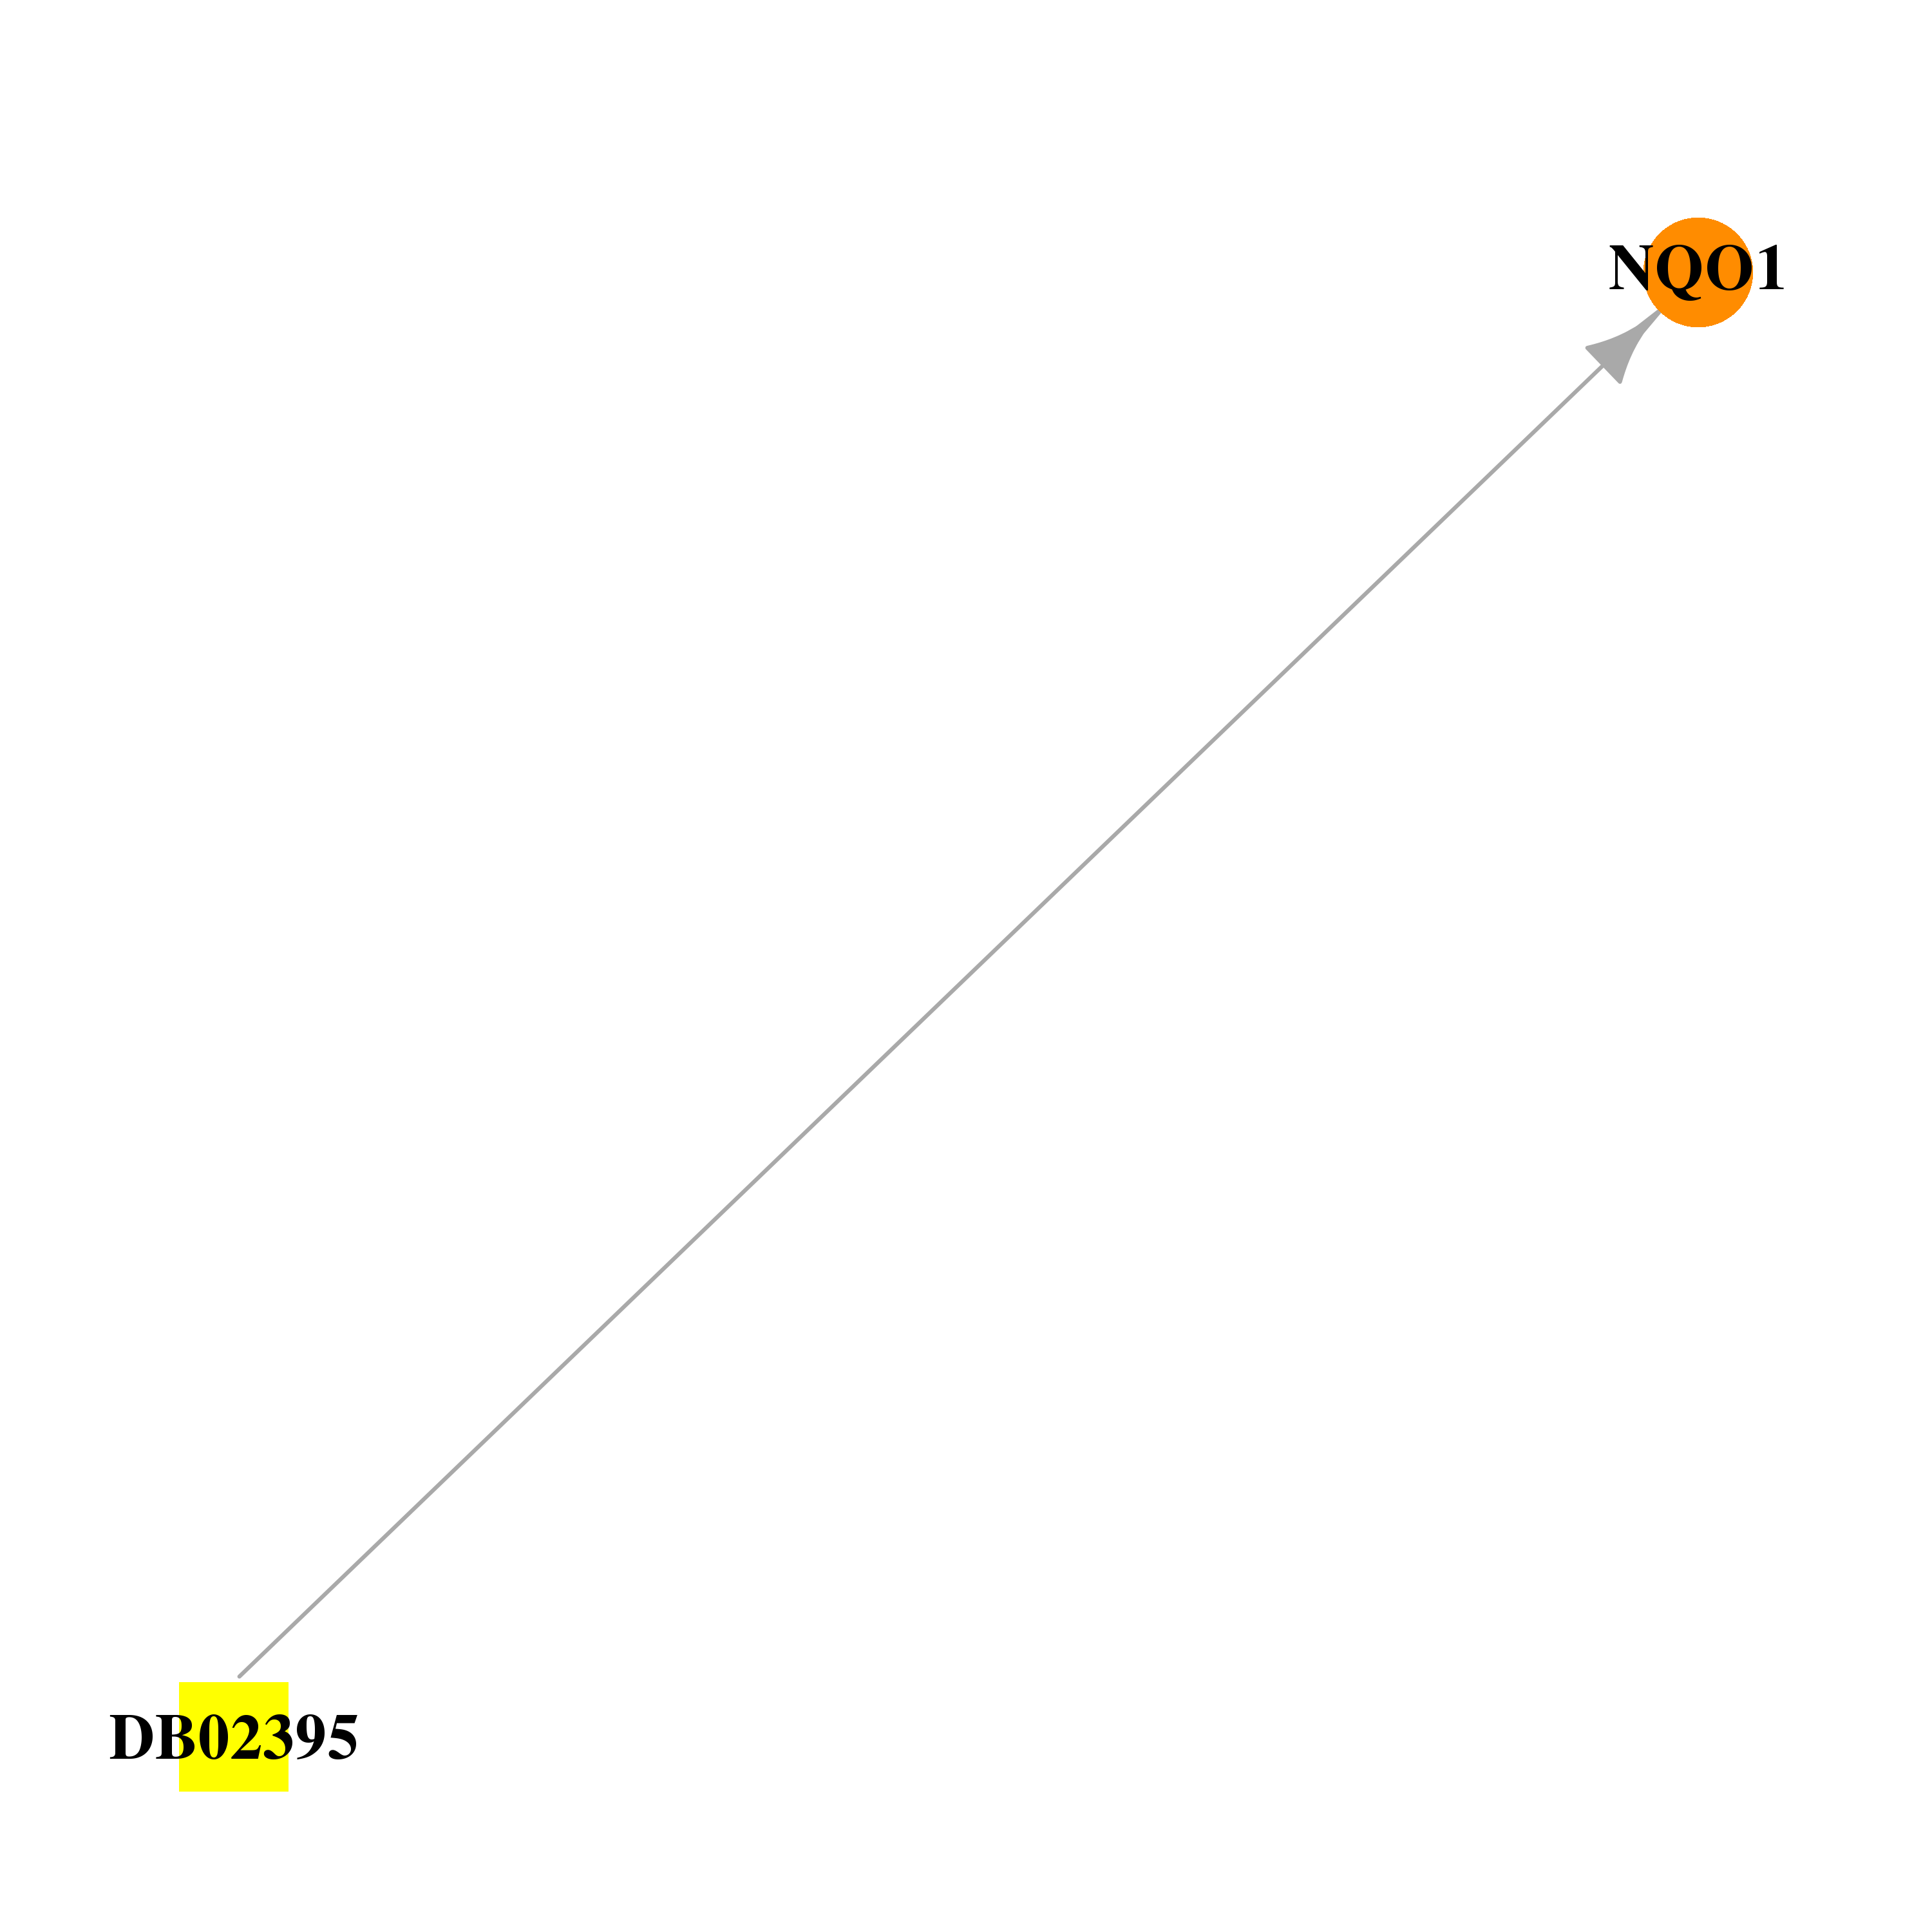 |  |
| DB02400 | NAD(P)H dehydrogenase, quinone 1 | experimental | 5-Methoxy-1,2-Dimethyl-3-(4-Nitrophenoxymethyl)Indole-4,7-Dione | 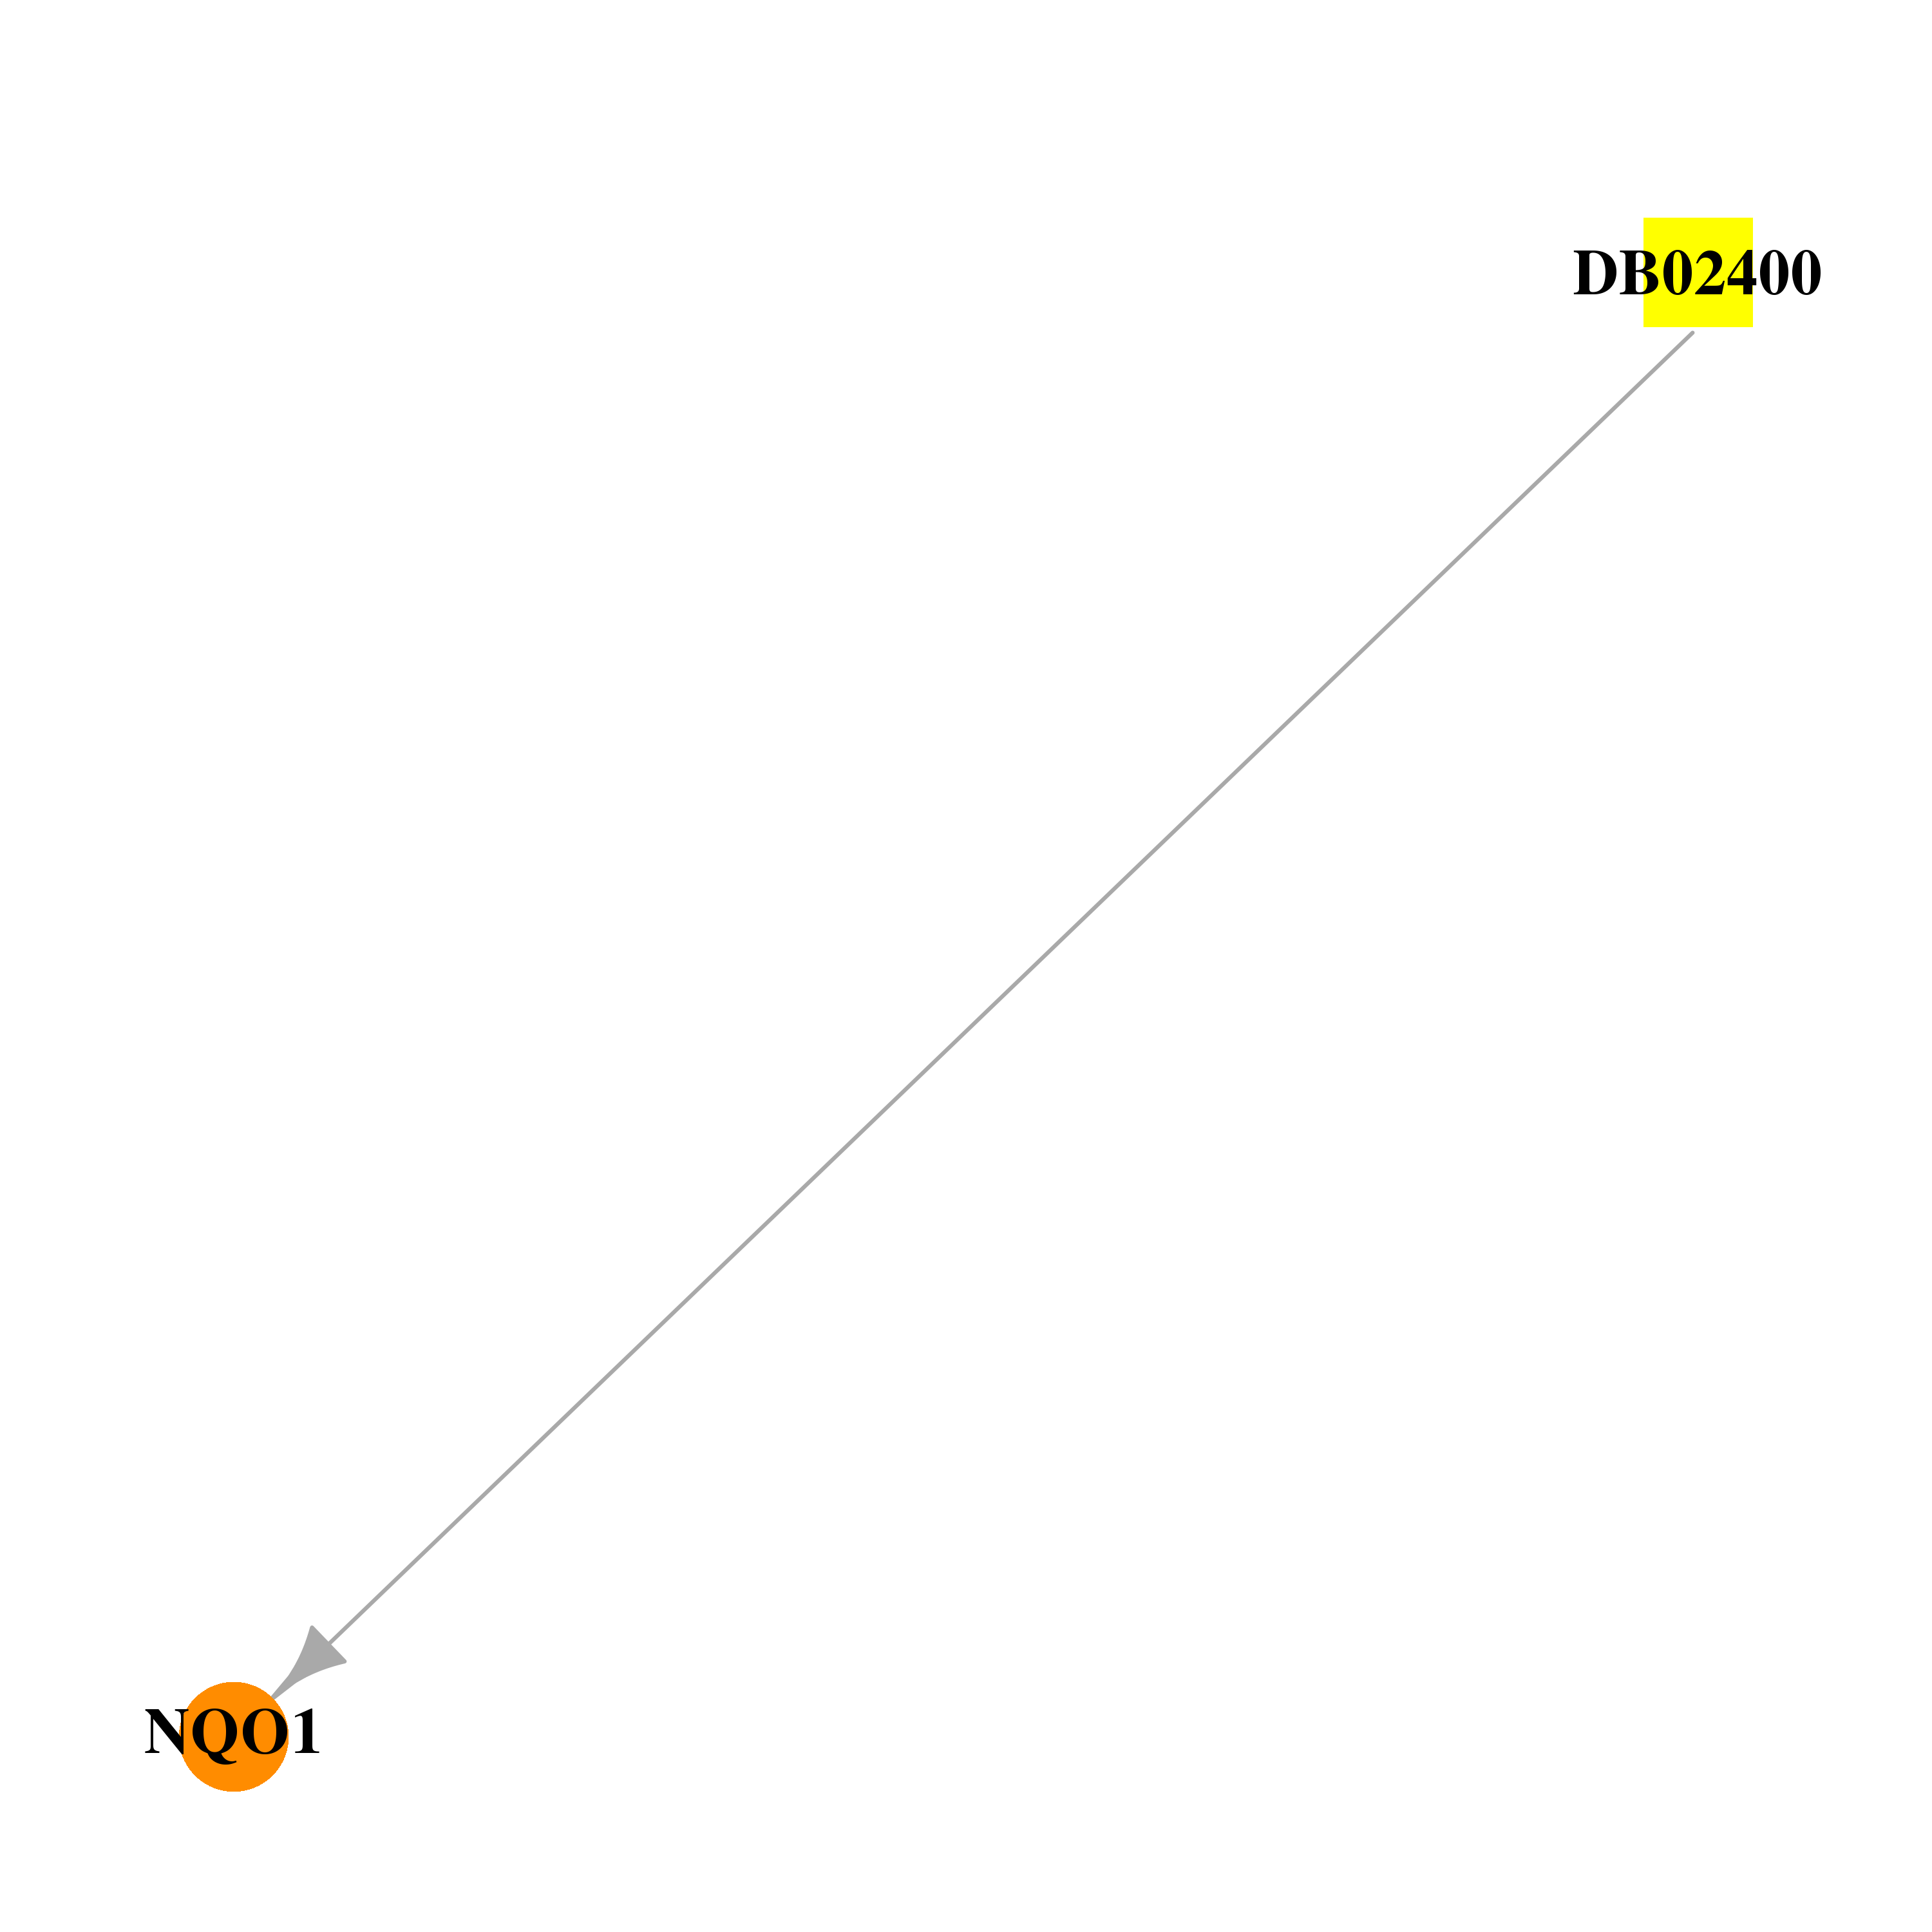 |  |
| DB02633 | NAD(P)H dehydrogenase, quinone 1 | experimental | Cibacron Blue | 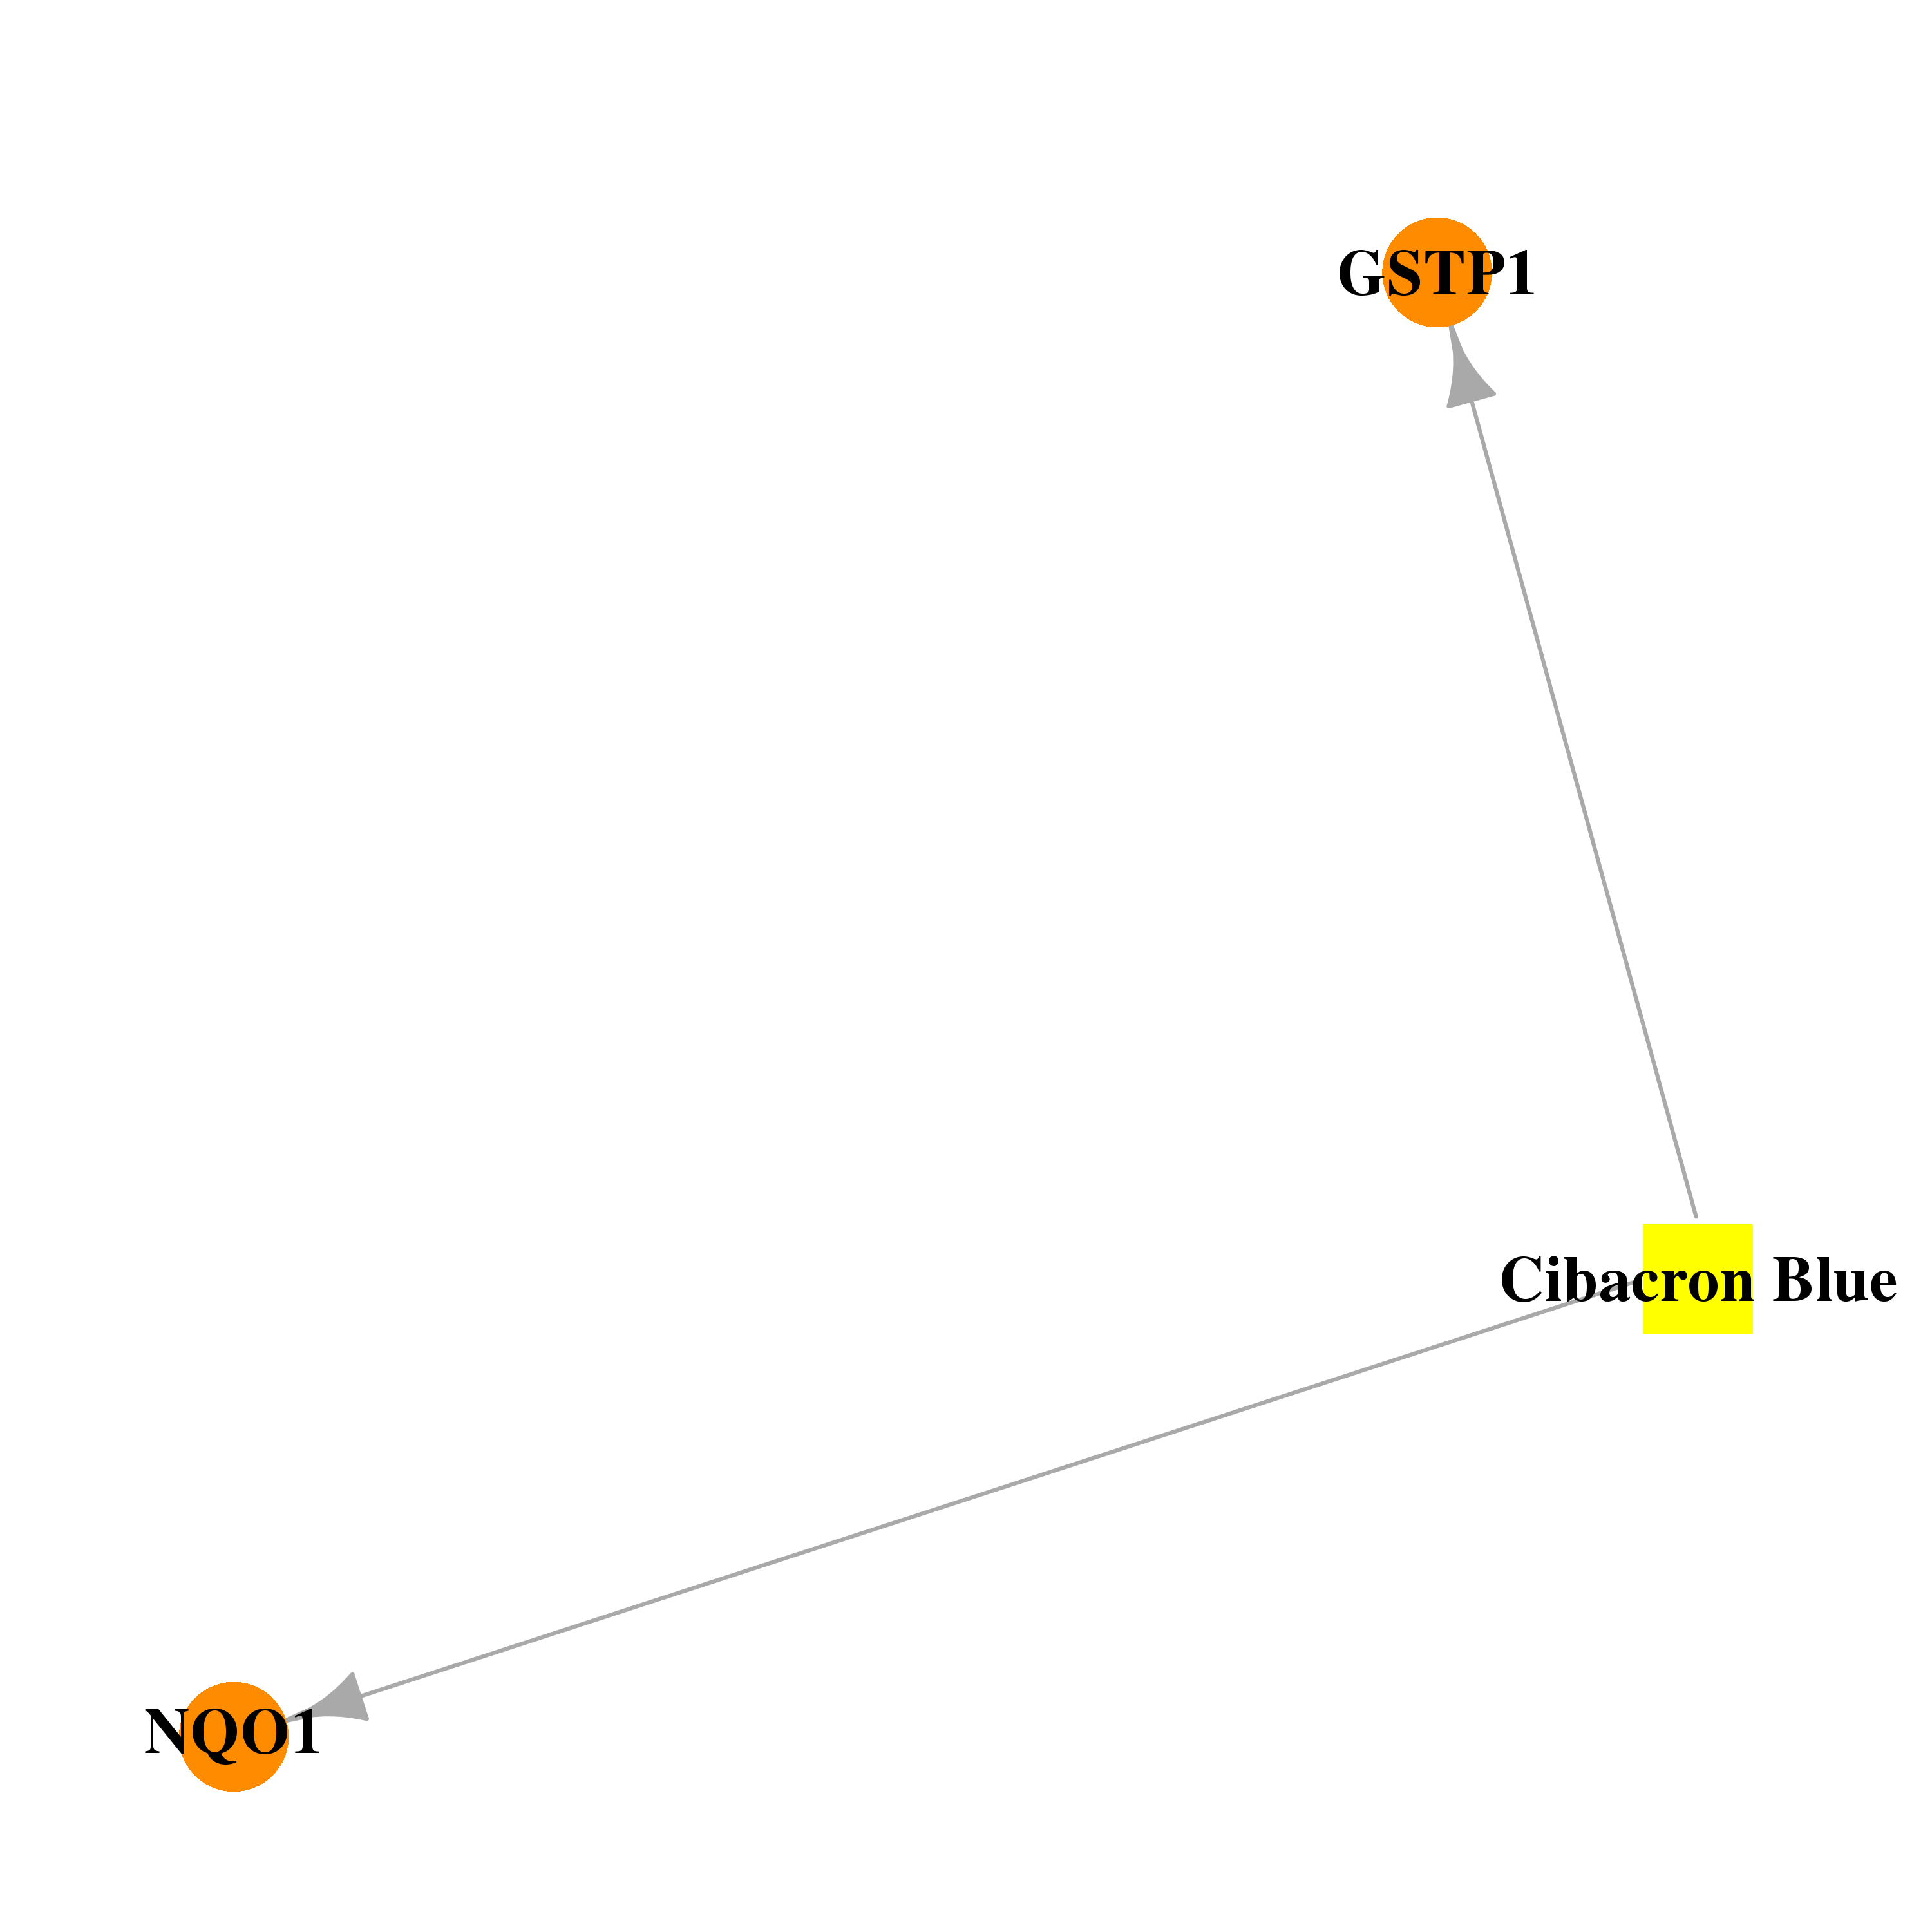 |  |
| DB03147 | NAD(P)H dehydrogenase, quinone 1 | experimental | Flavin-Adenine Dinucleotide | 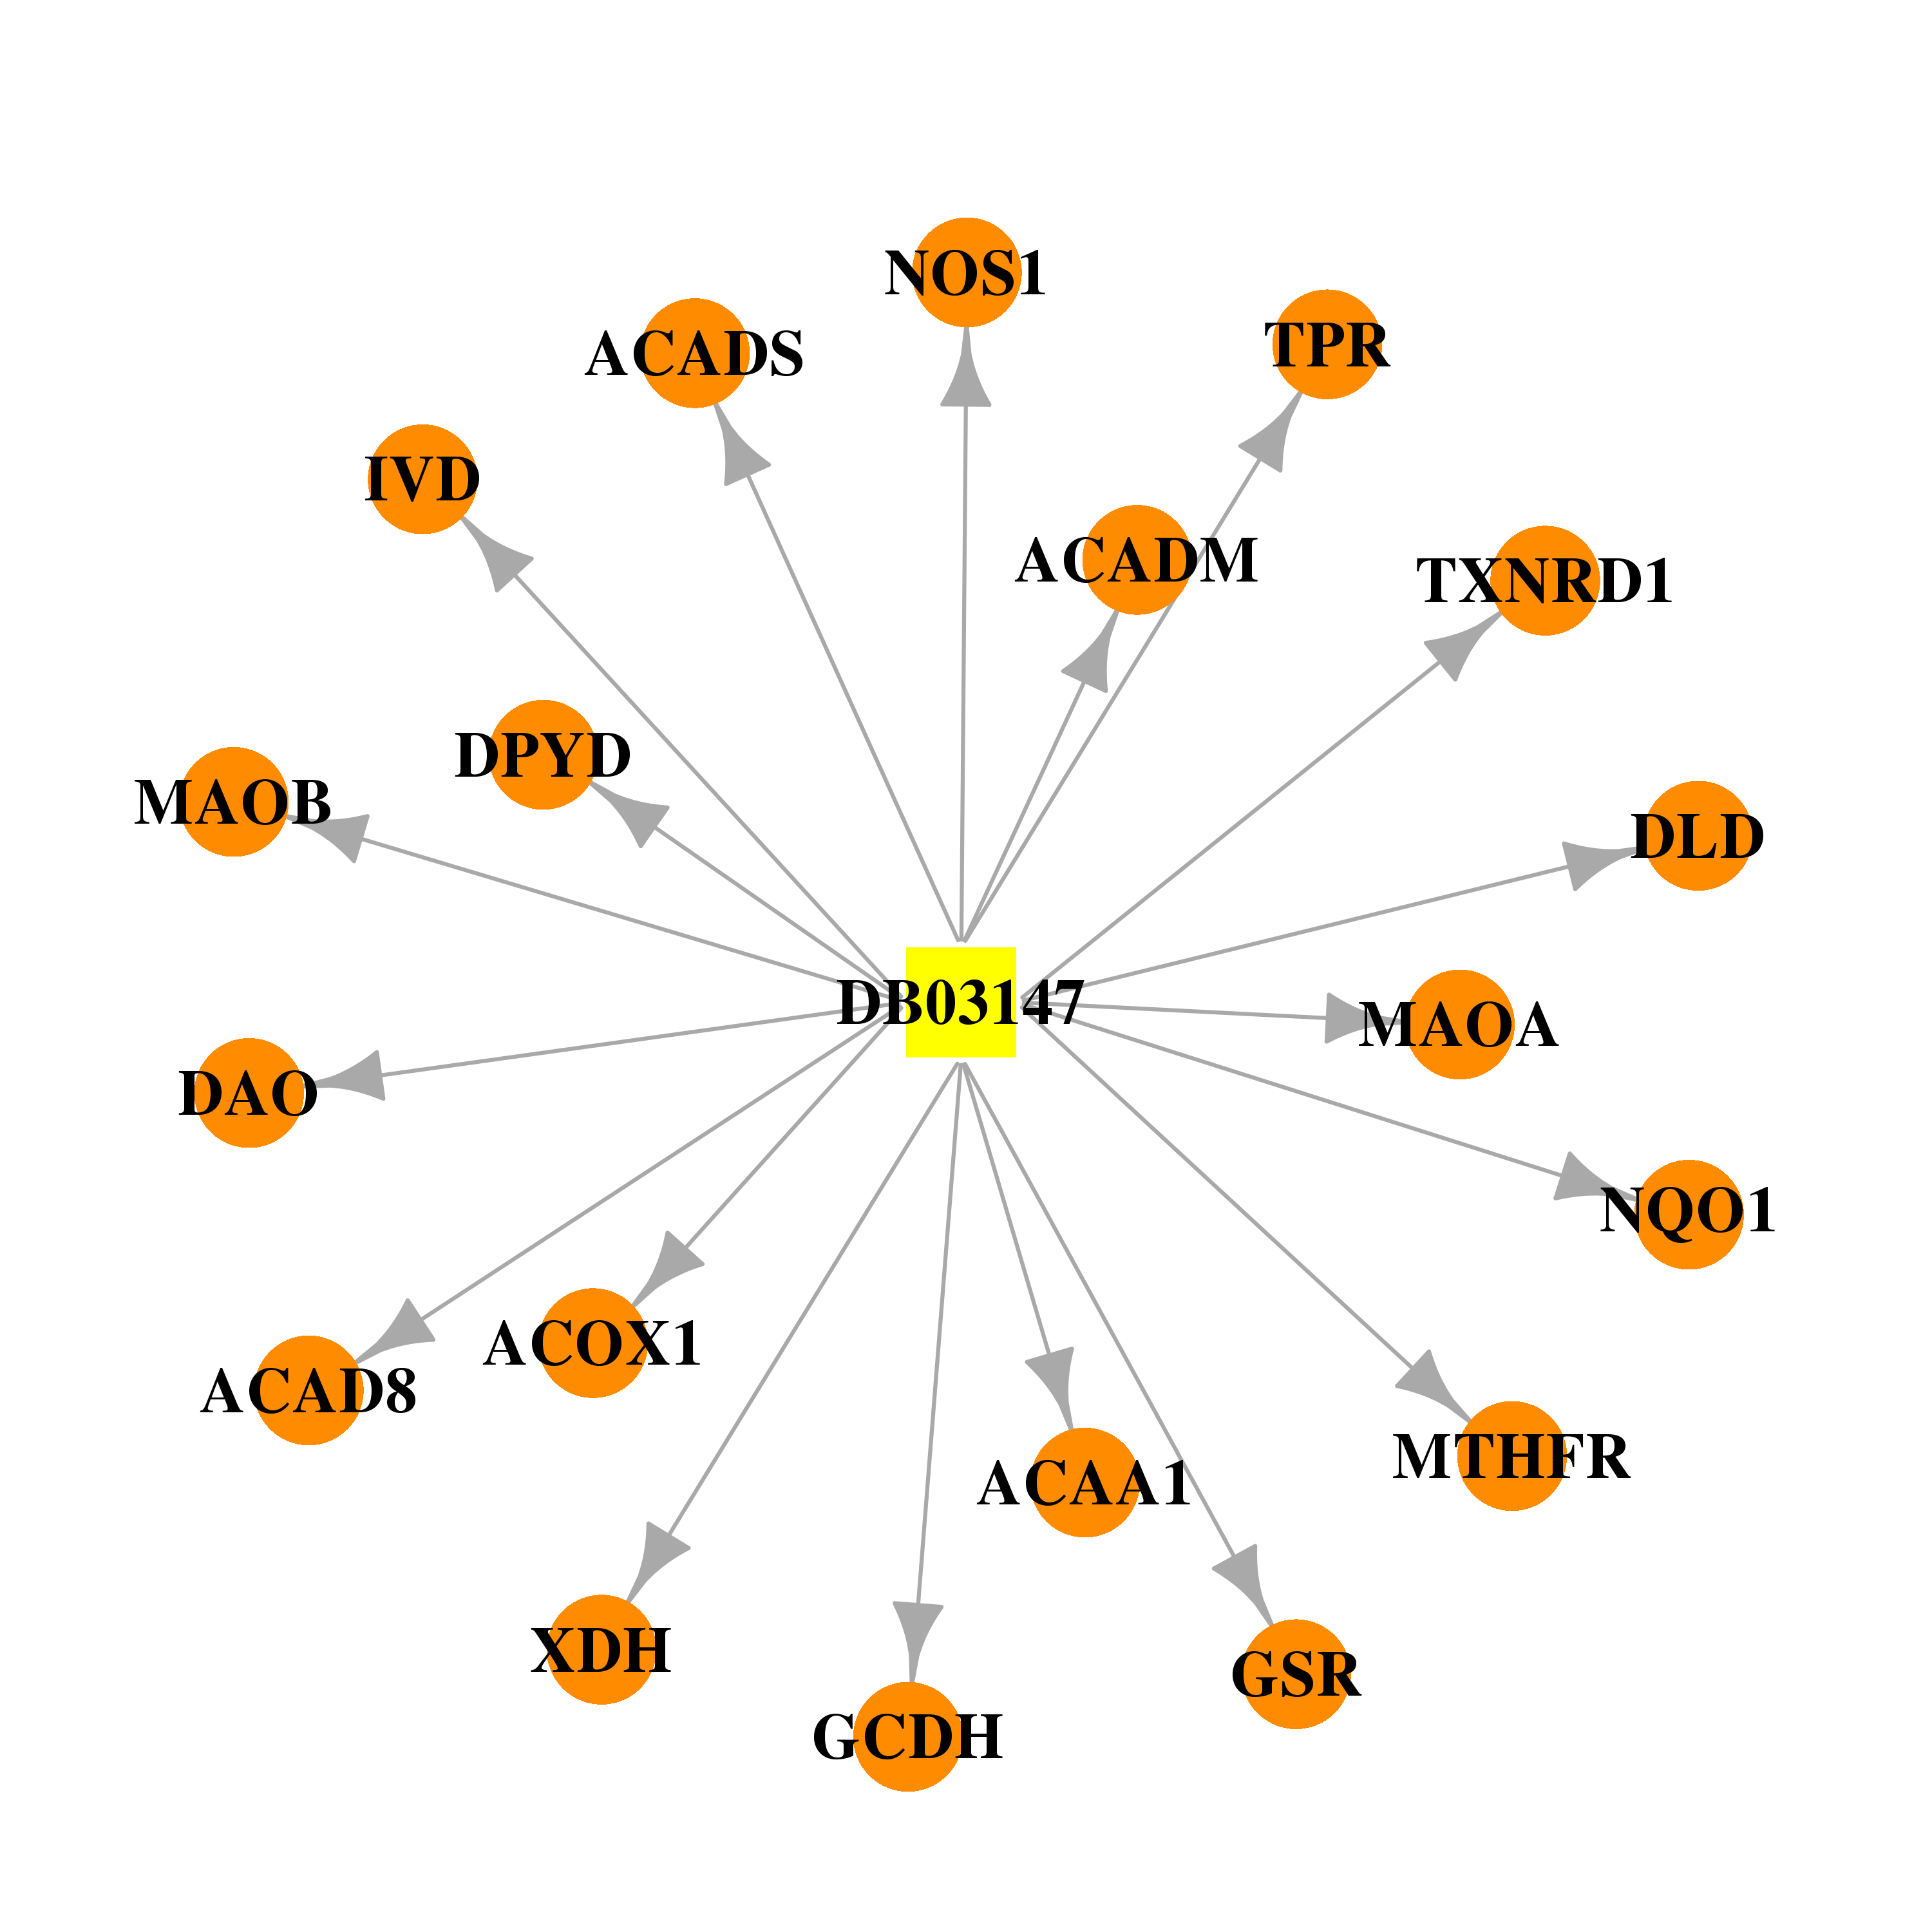 |  |
| DB03626 | NAD(P)H dehydrogenase, quinone 1 | experimental | 5-Methoxy-1,2-Dimethyl-3-(Phenoxymethyl)Indole-4,7-Dione |  | 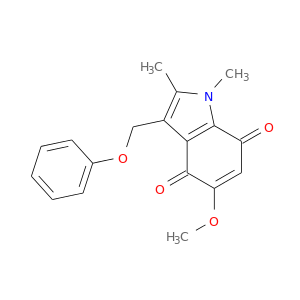 |
| DB04090 | NAD(P)H dehydrogenase, quinone 1 | experimental | 2,5-Diaziridin-1-Yl-3-(Hydroxymethyl)-6-Methylcyclohexa-2,5-Diene-1,4-Dione | 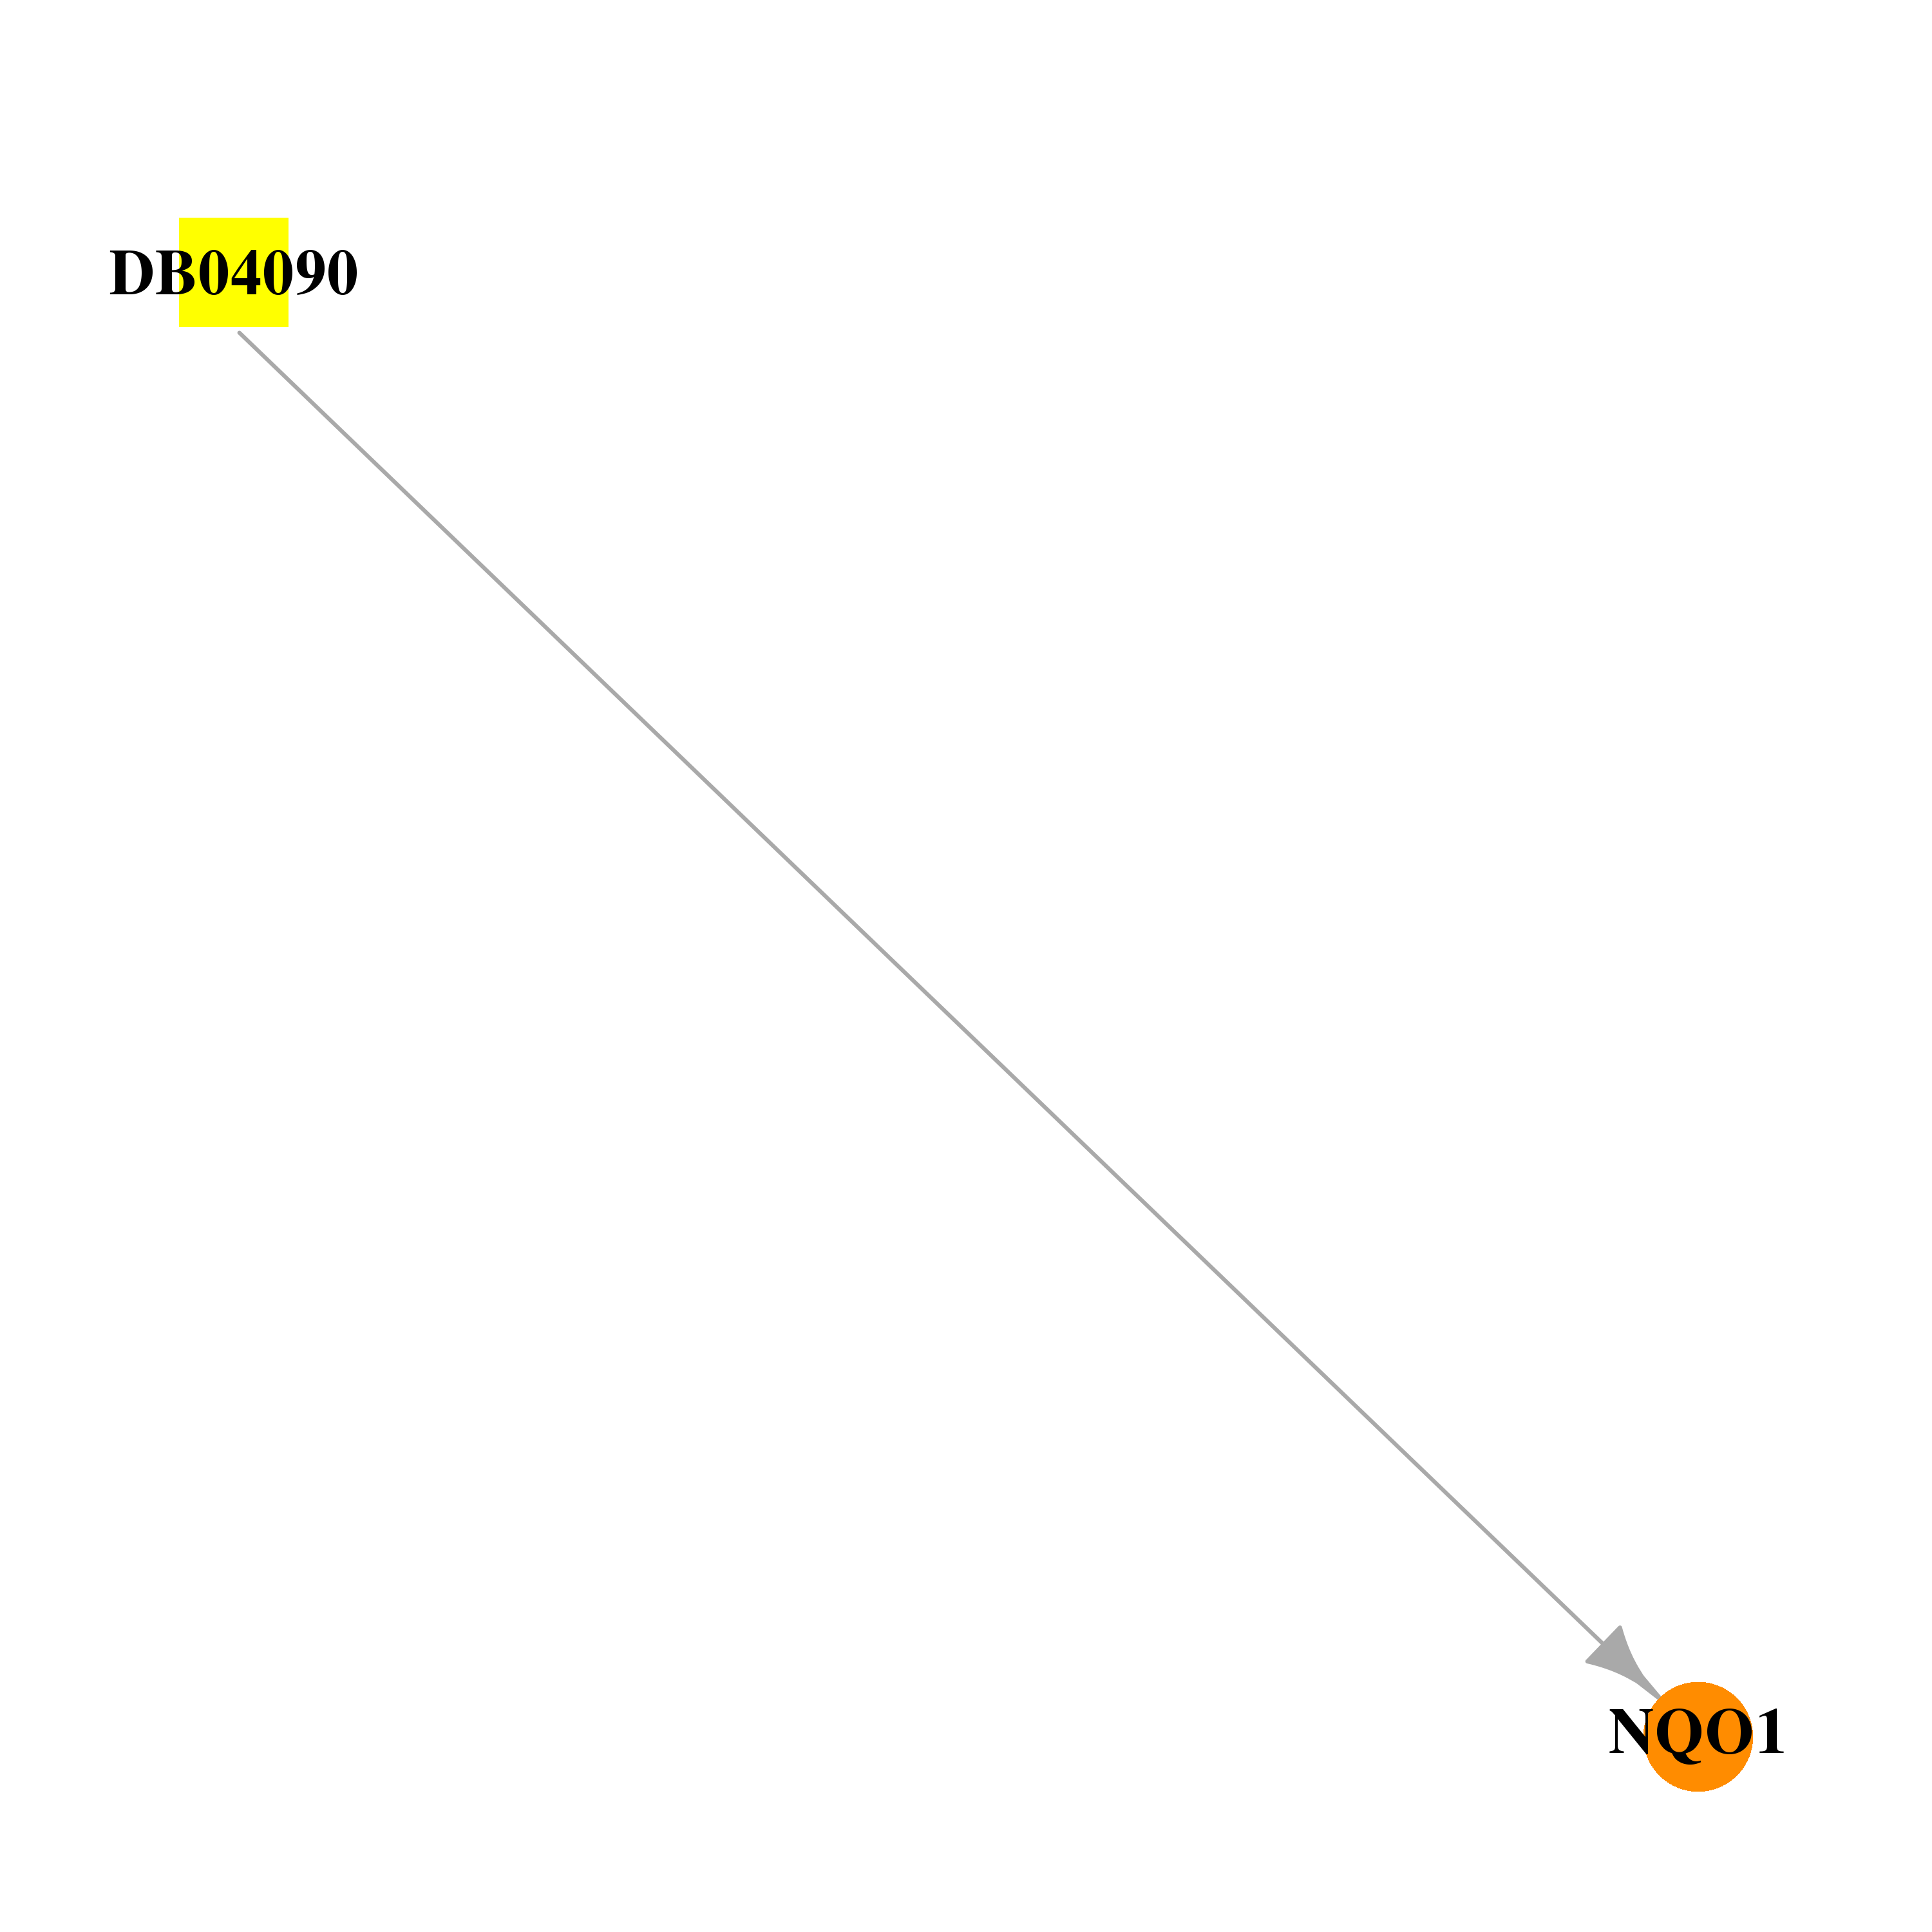 | 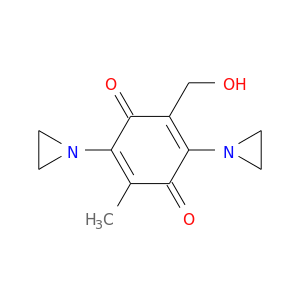 |
| DB04392 | NAD(P)H dehydrogenase, quinone 1 | experimental | Bishydroxy[2h-1-Benzopyran-2-One,1,2-Benzopyrone] |  |  |
| DB07385 | NAD(P)H dehydrogenase, quinone 1 | experimental | 3-(HYDROXYMETHYL)-1-METHYL-5-(2-METHYLAZIRIDIN-1-YL)-2-PHENYL-1H-INDOLE-4,7-DIONE | 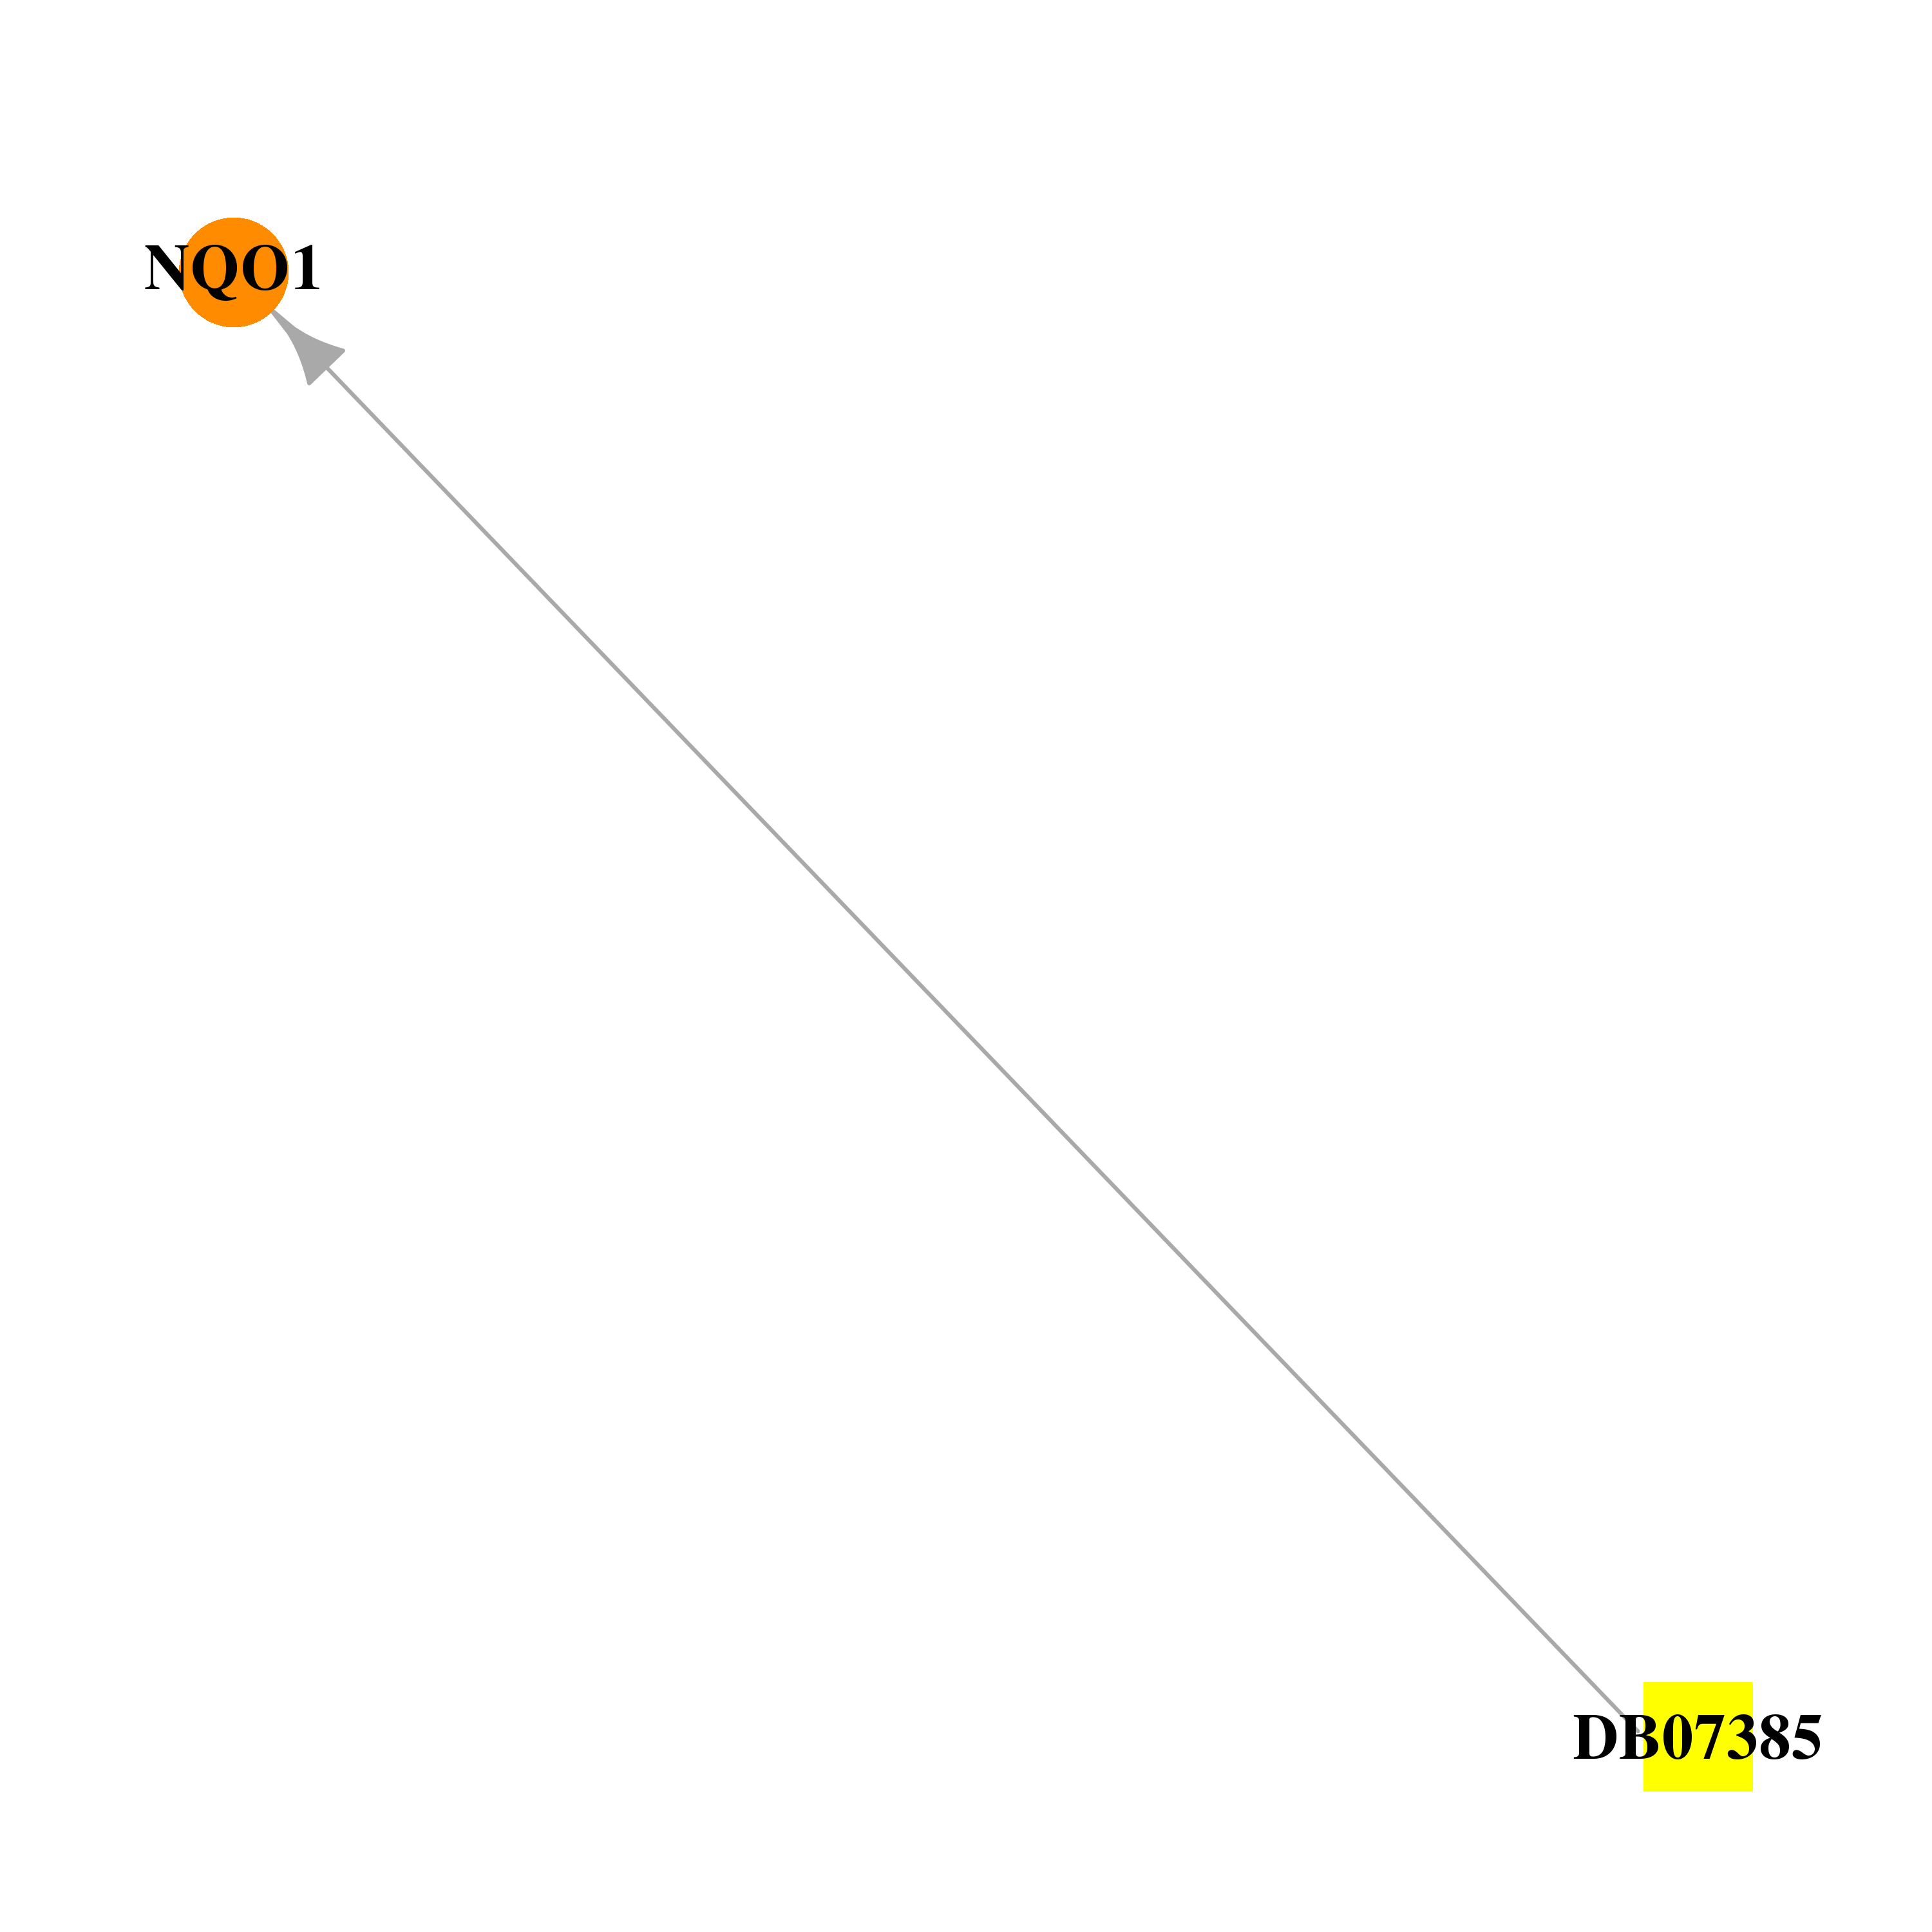 |  |
| DB00818 | NAD(P)H dehydrogenase, quinone 1 | approved; investigational | Propofol | 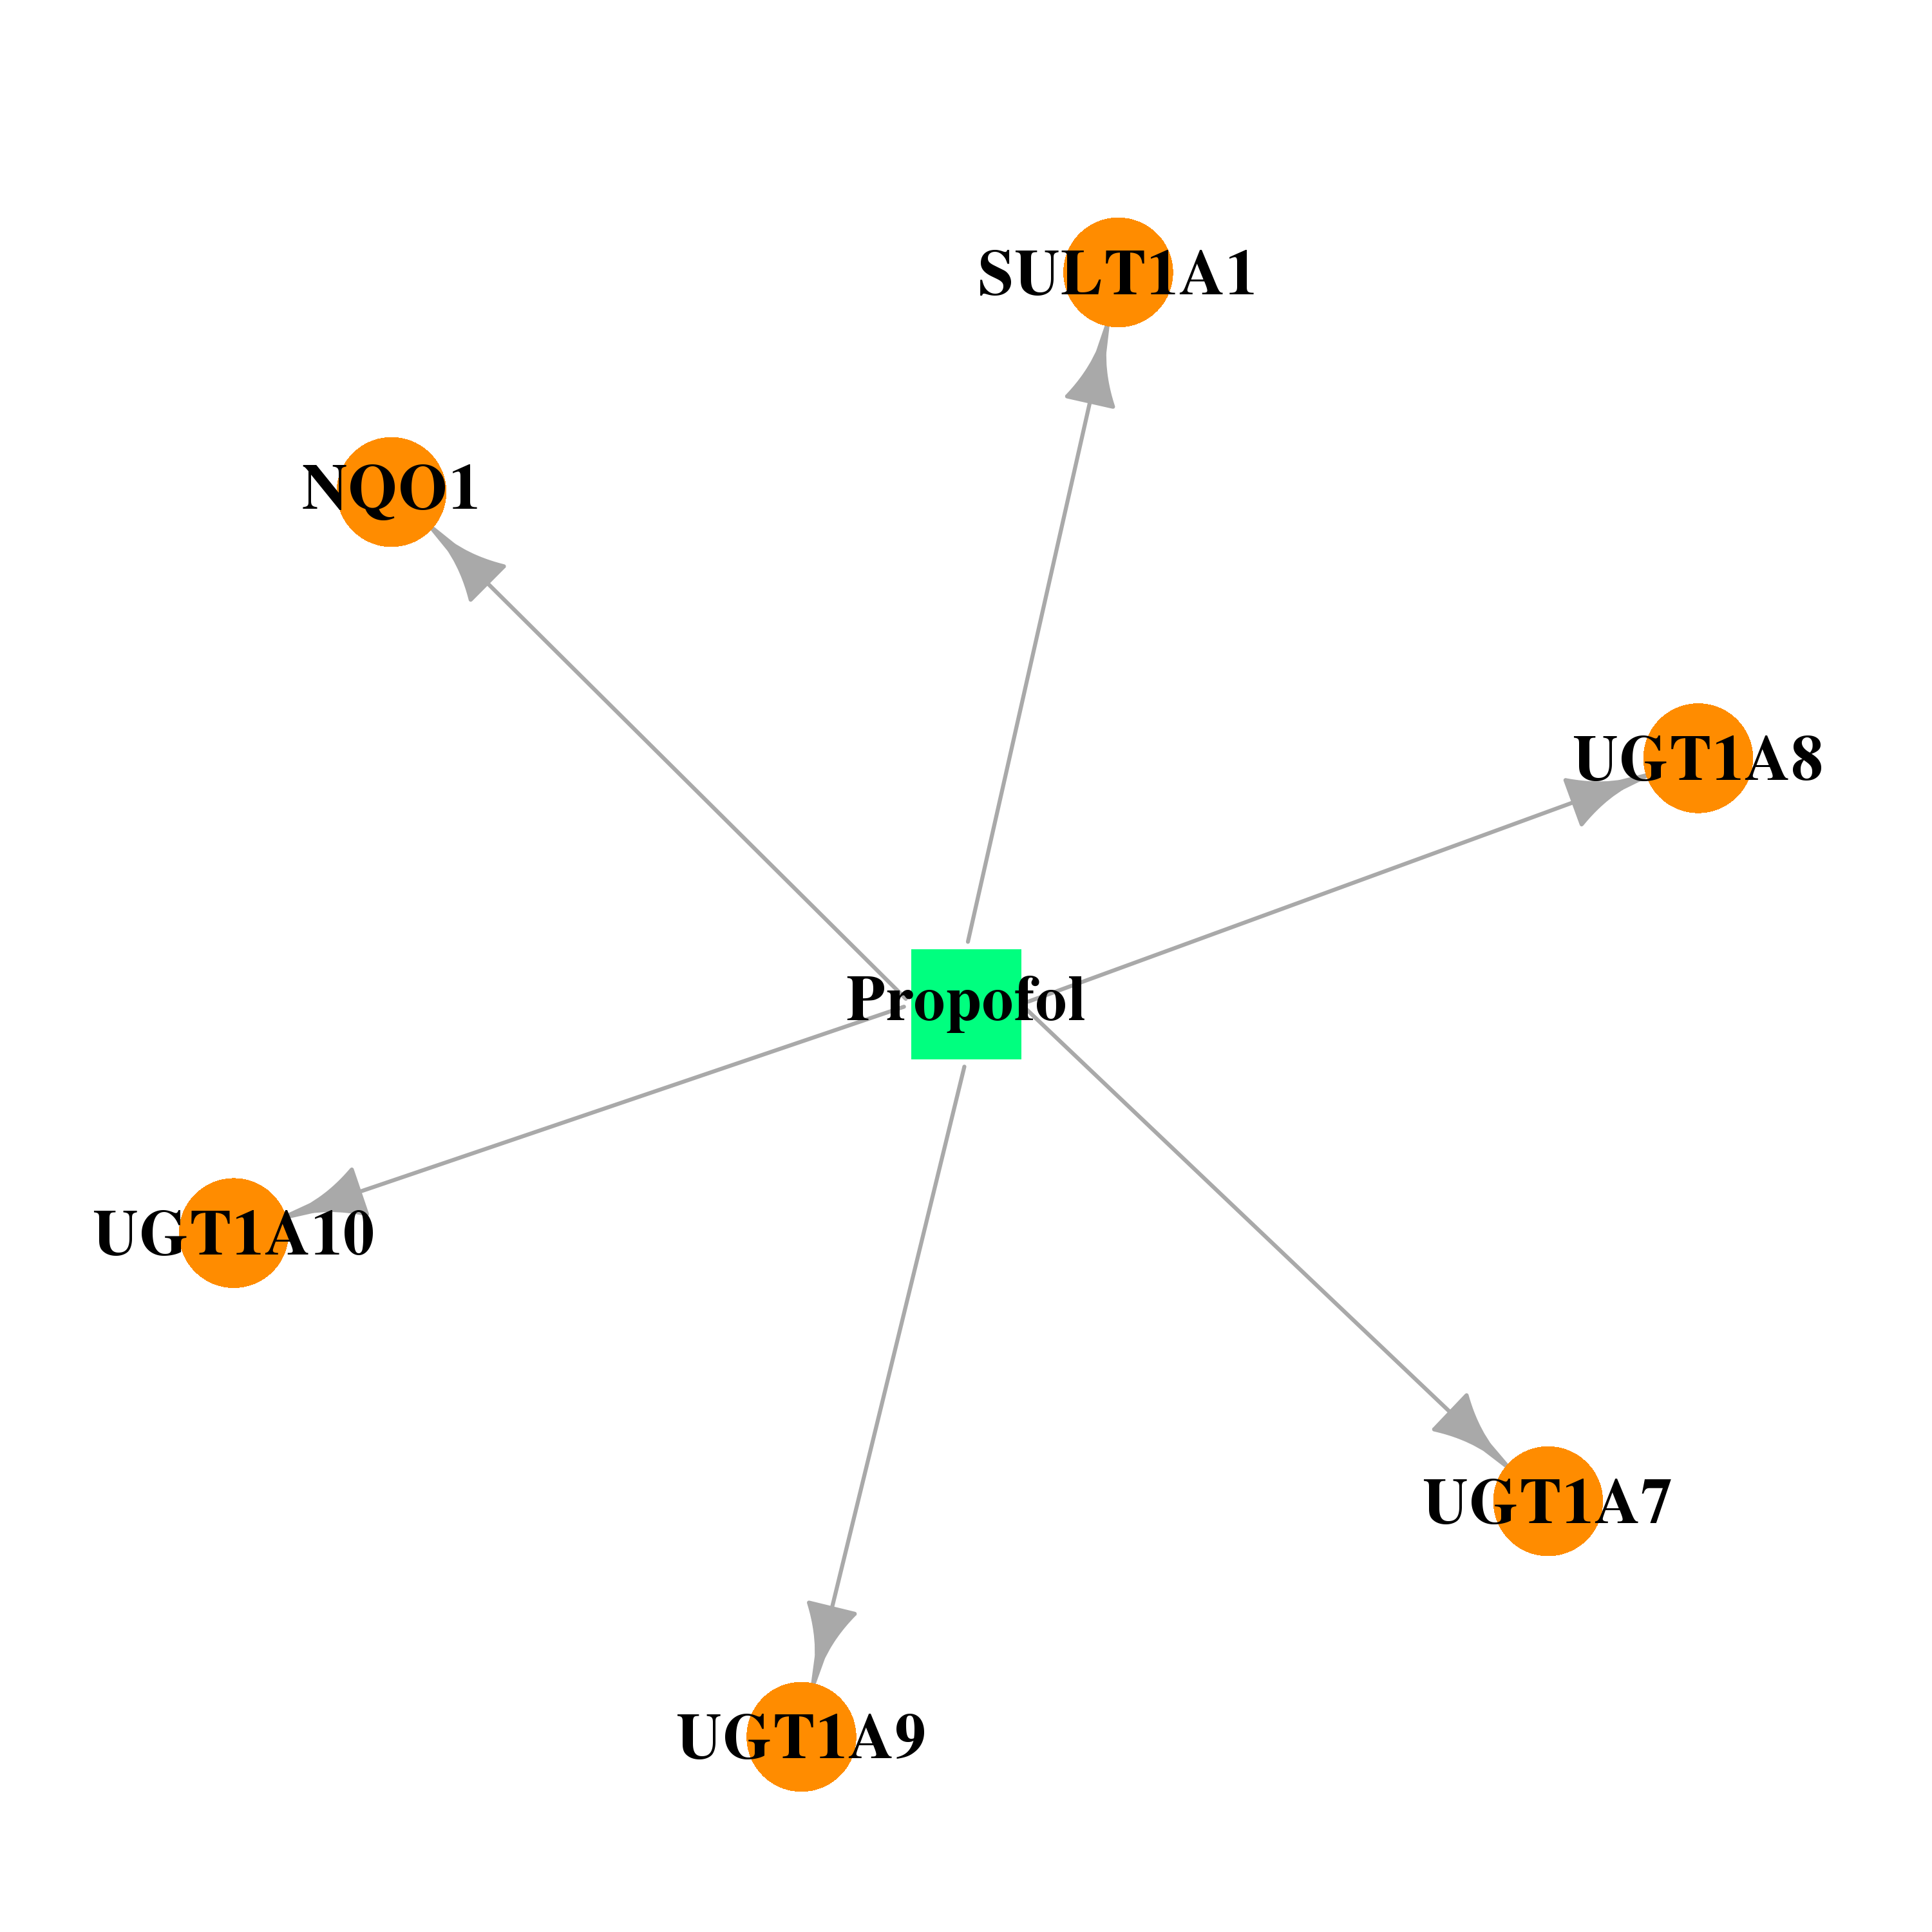 |  |
| DB00997 | NAD(P)H dehydrogenase, quinone 1 | approved; investigational | Doxorubicin | 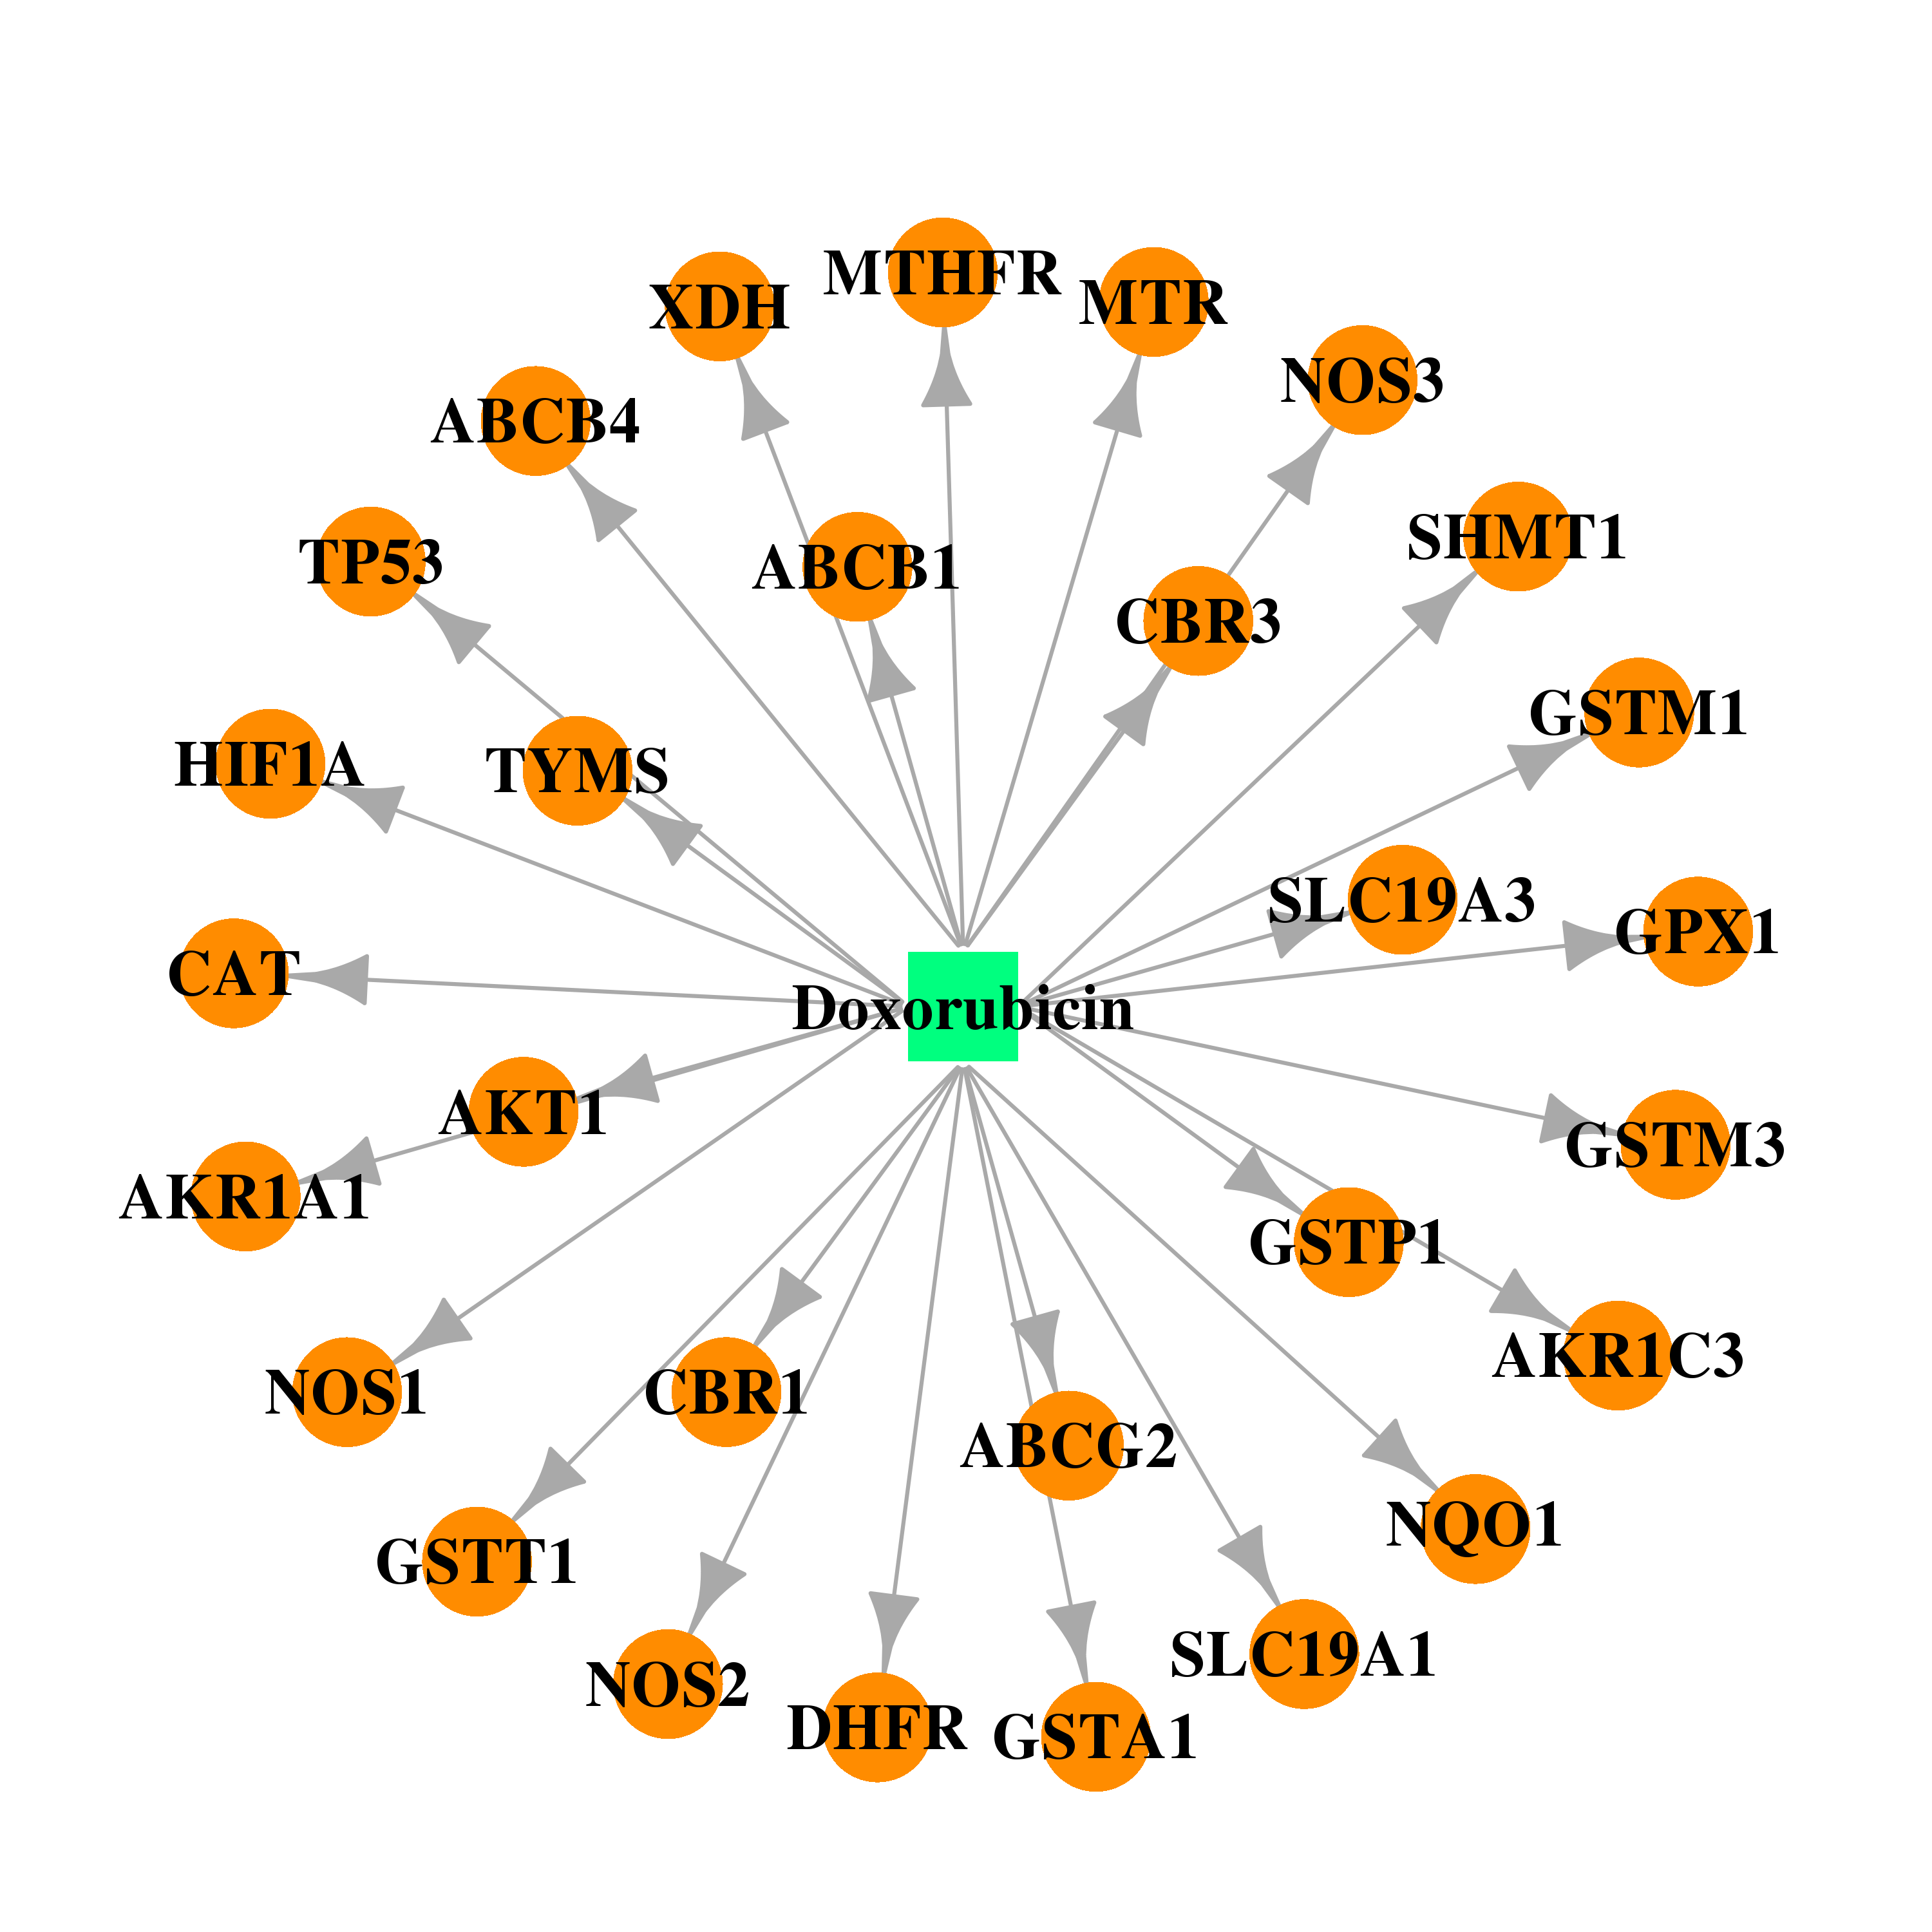 |  |
| DB00515 | NAD(P)H dehydrogenase, quinone 1 | approved | Cisplatin |  |  |
| DB00305 | NAD(P)H dehydrogenase, quinone 1 | approved | Mitomycin |  |  |
| DB00773 | NAD(P)H dehydrogenase, quinone 1 | approved | Etoposide |  |  |
| DB00445 | NAD(P)H dehydrogenase, quinone 1 | approved | Epirubicin | 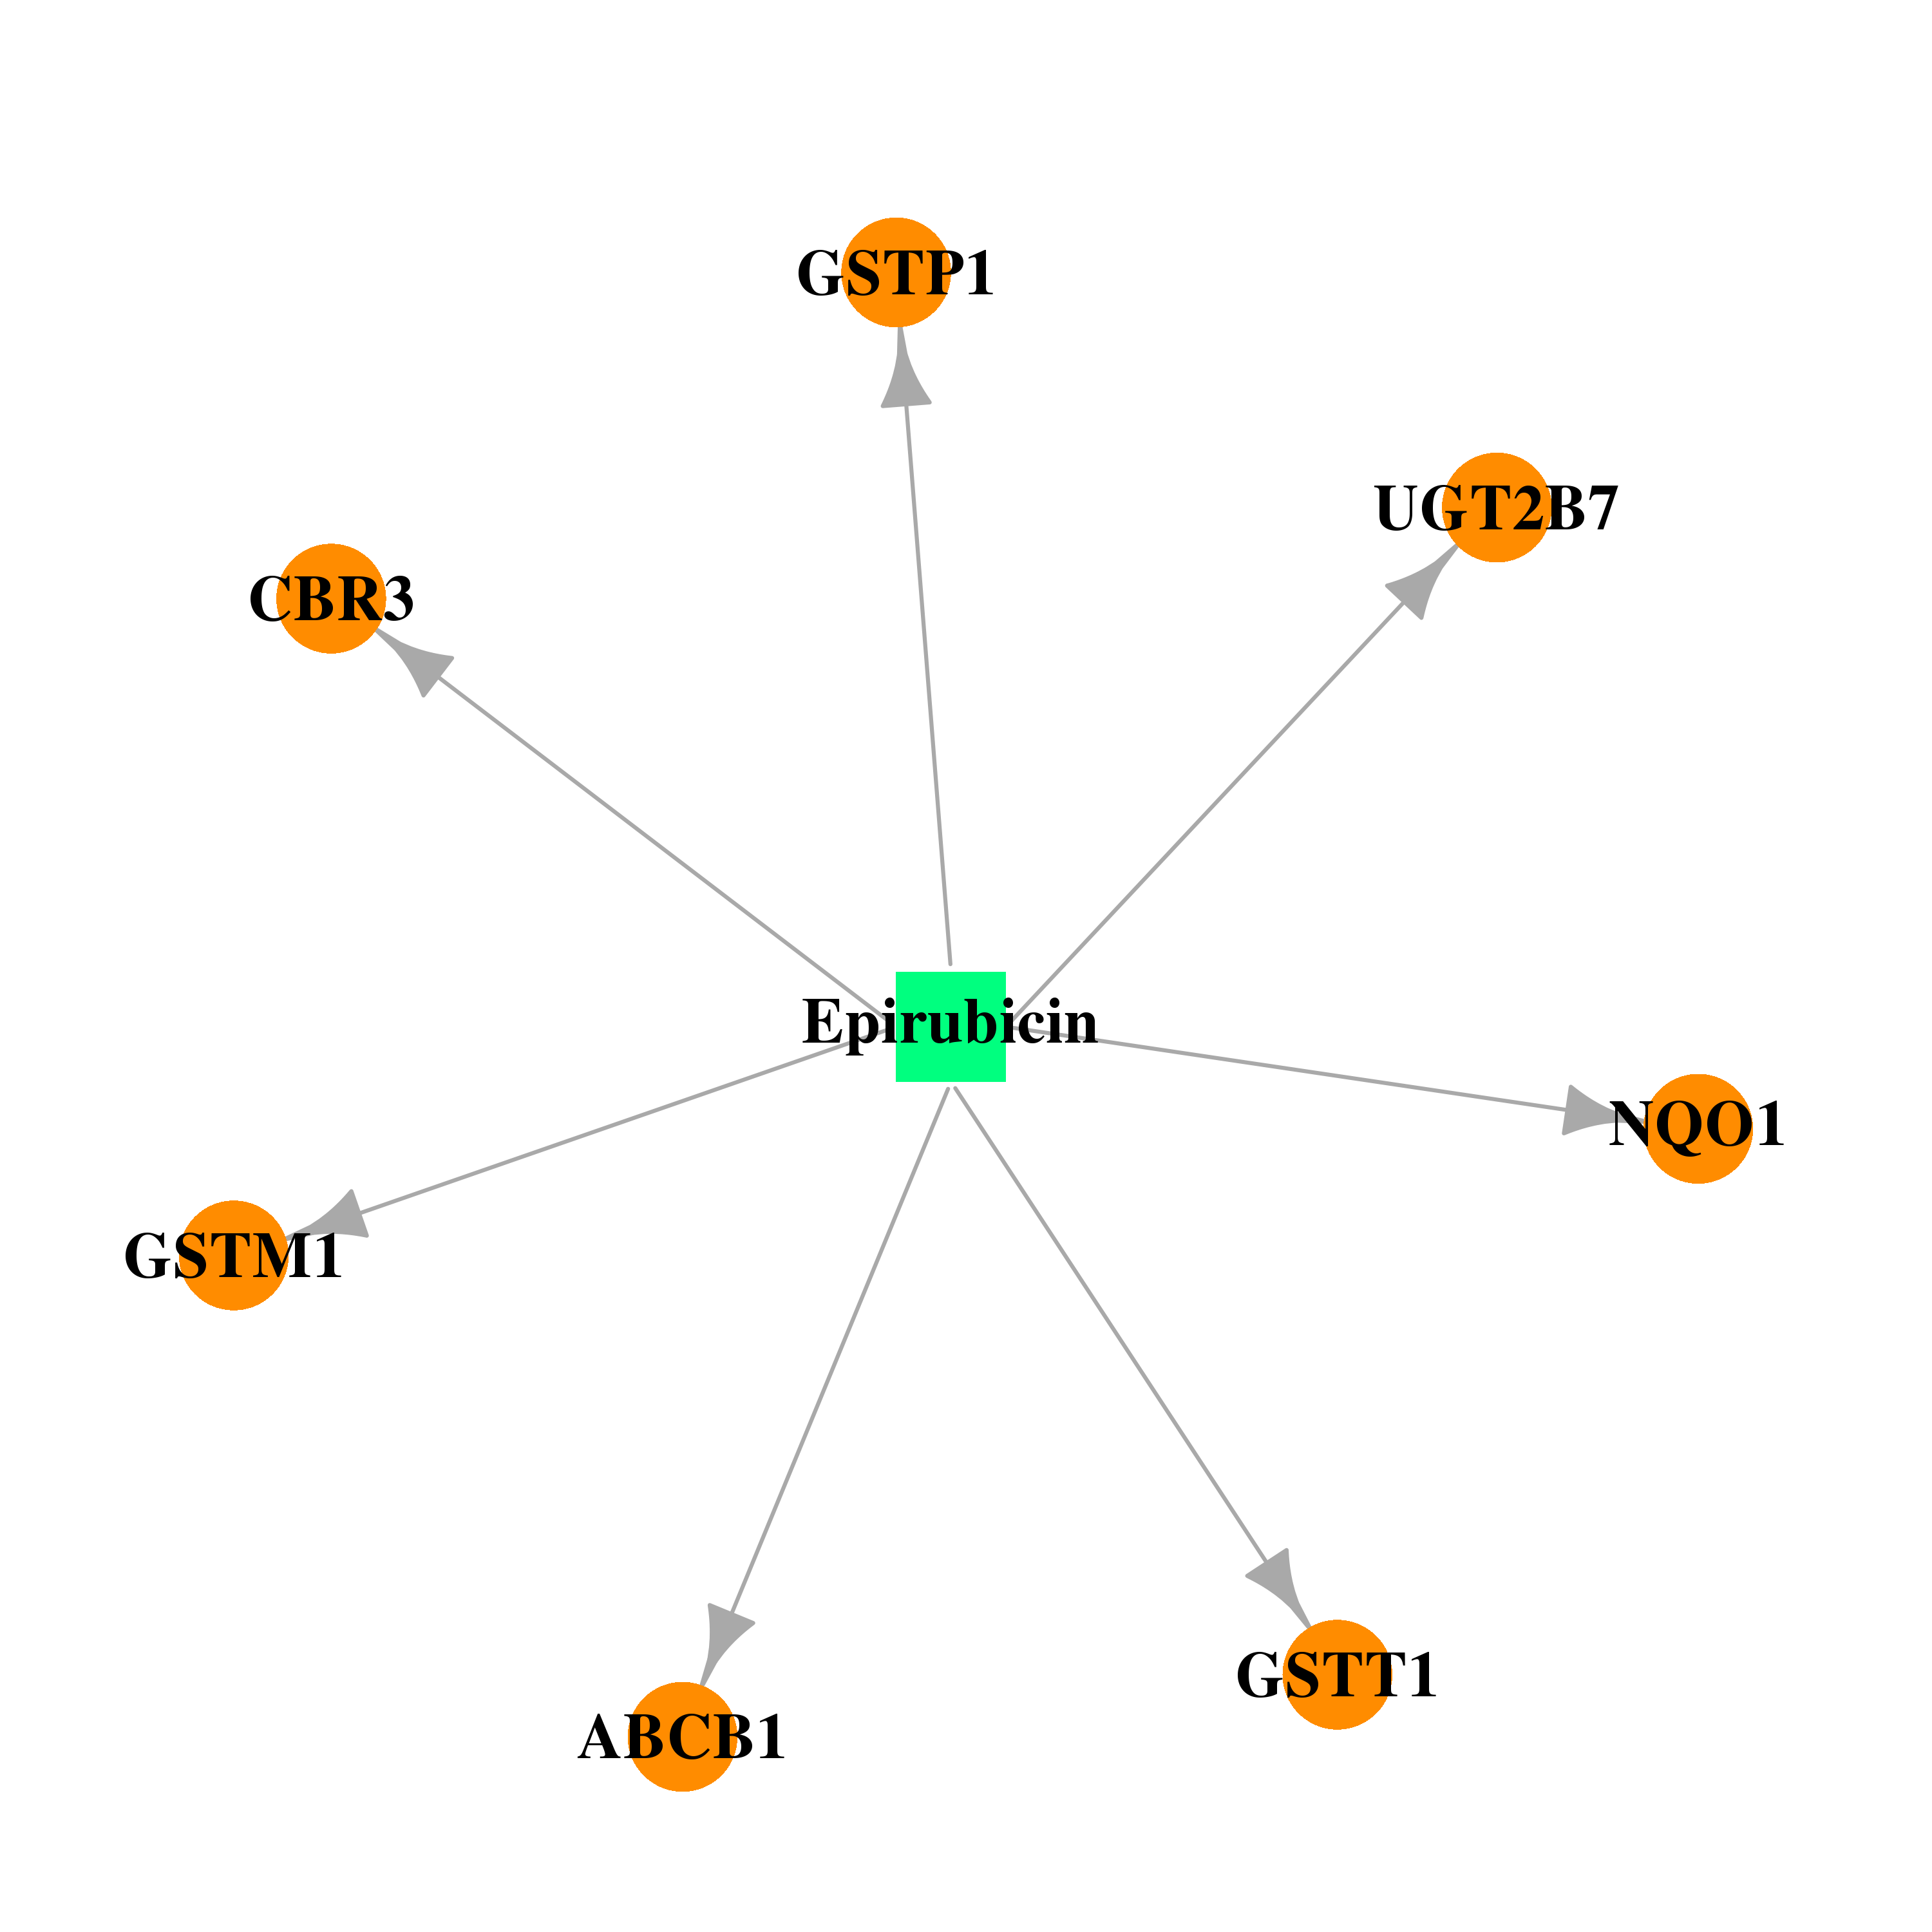 | 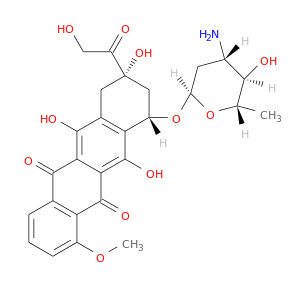 |
| DB03033 | NAD(P)H dehydrogenase, quinone 1 | experimental | 1-Methyloxy-4-Sulfone-Benzene | 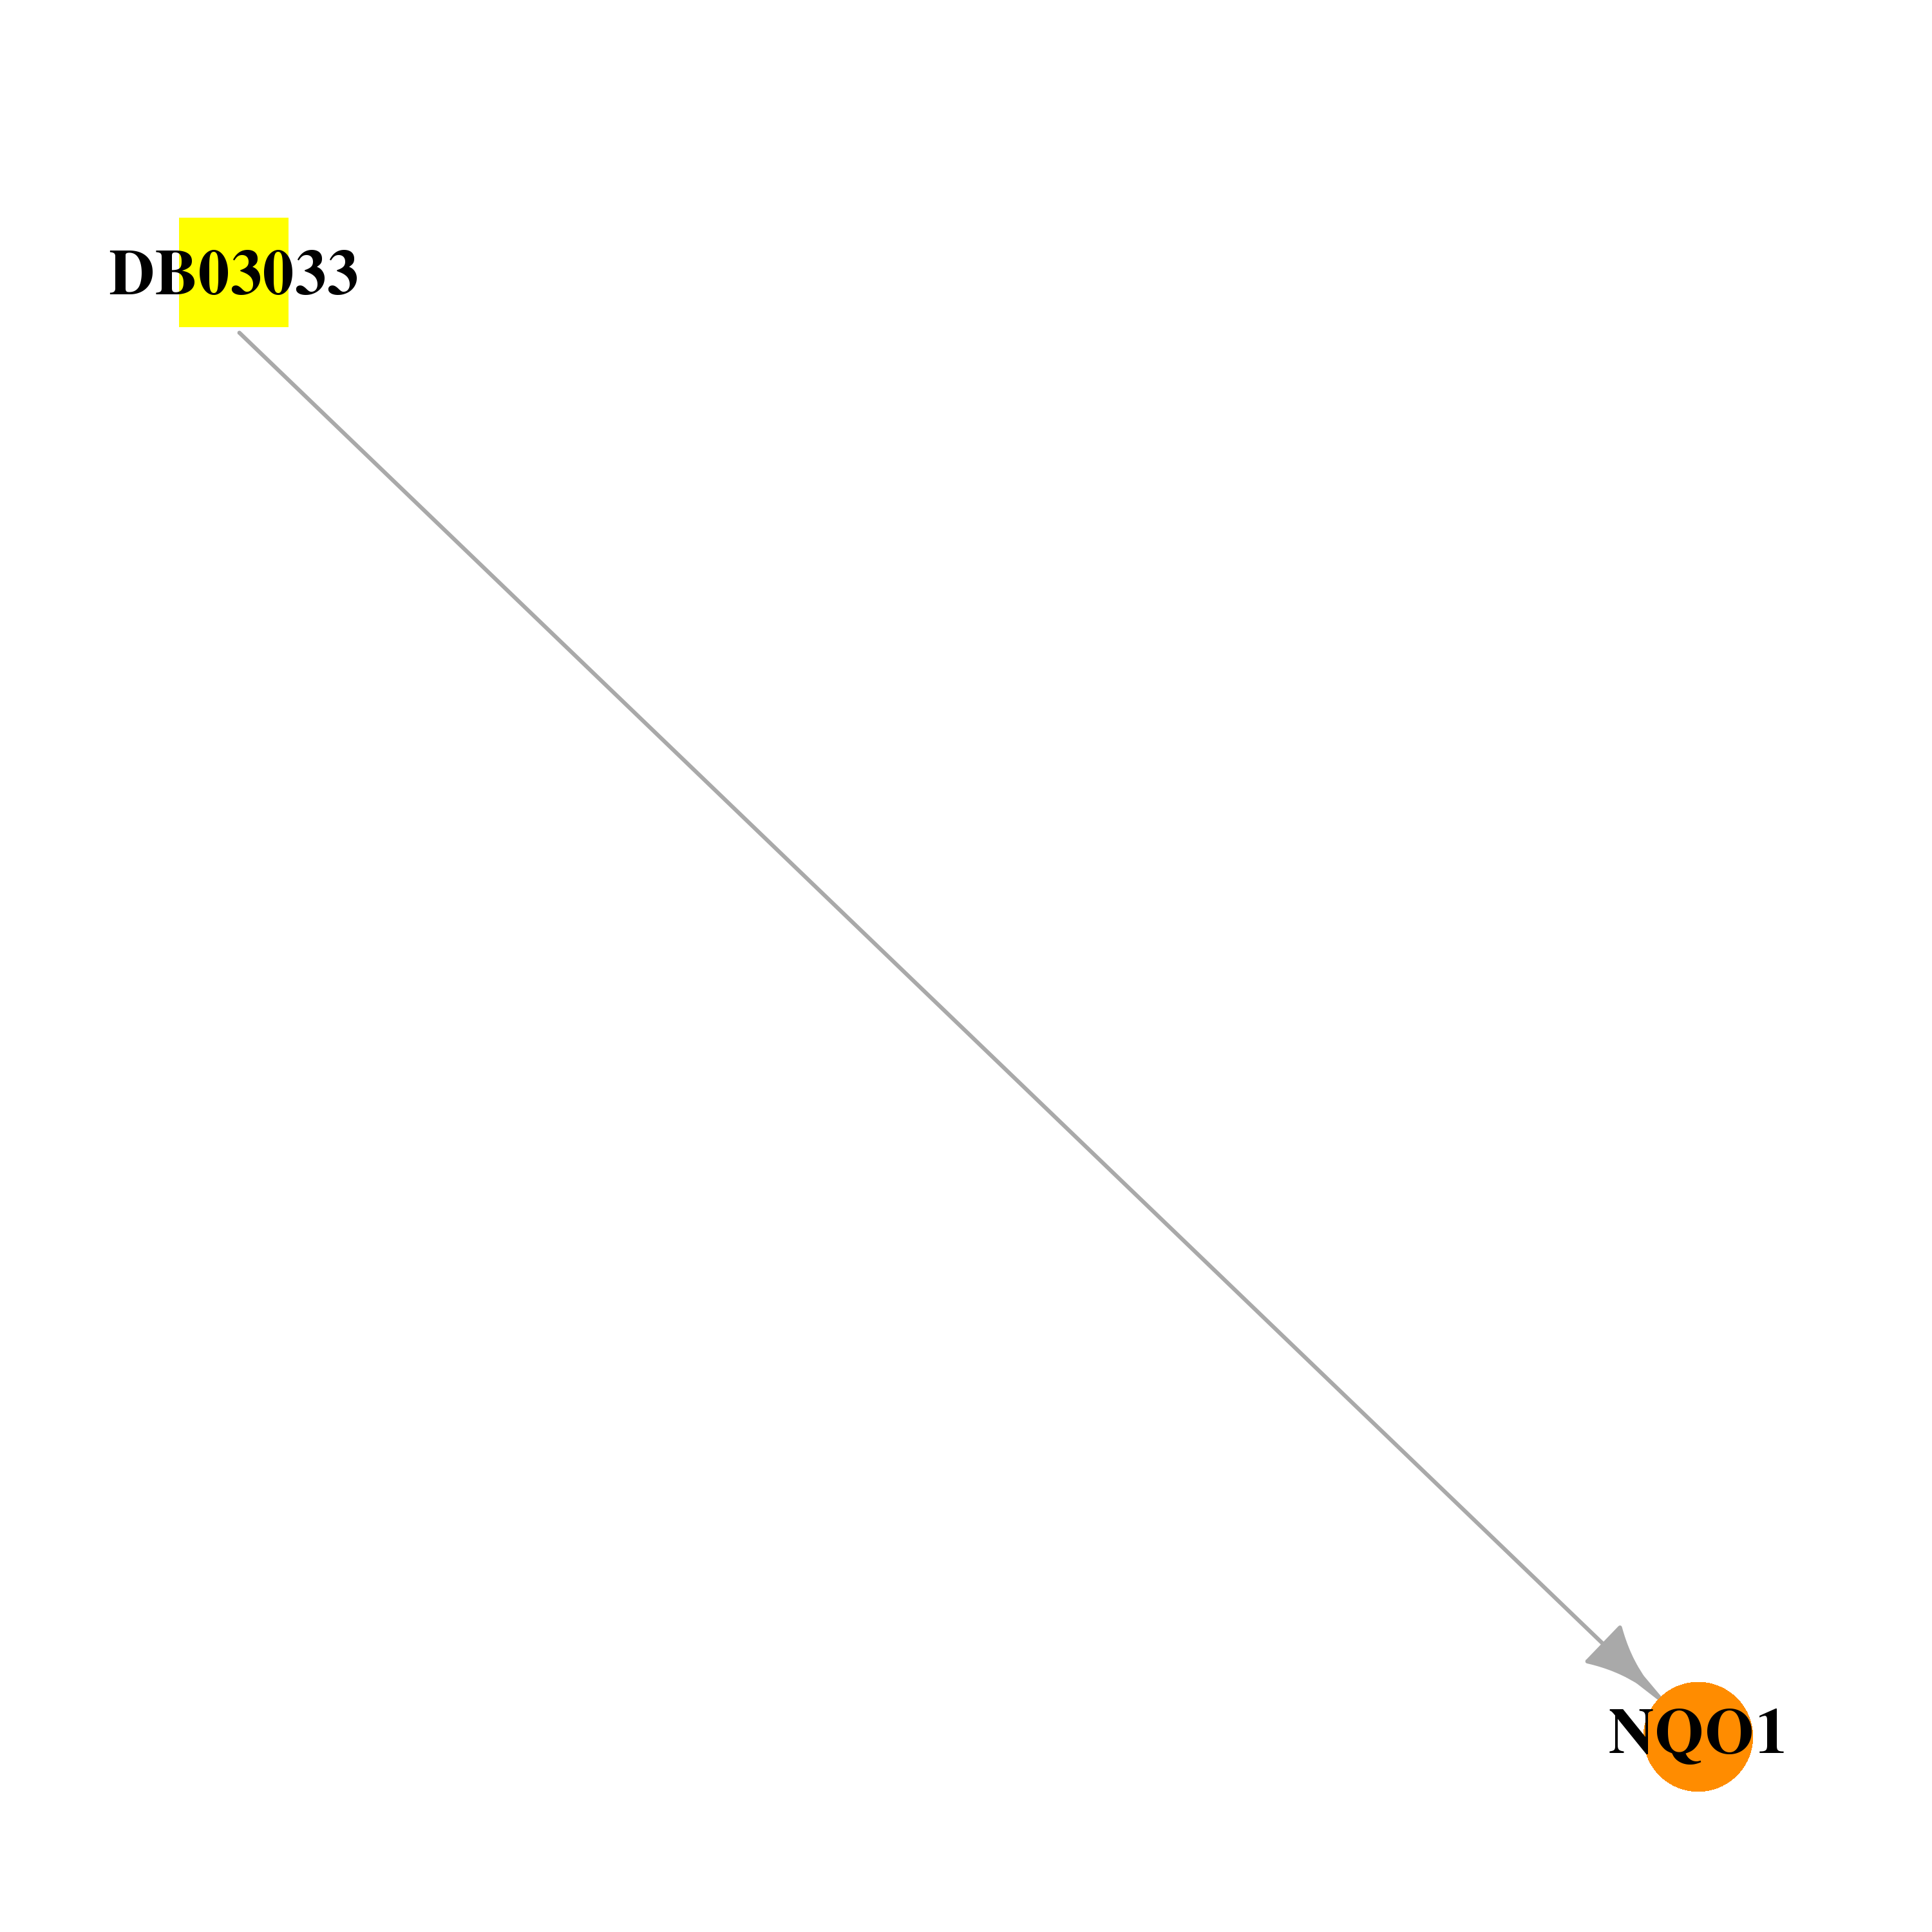 | 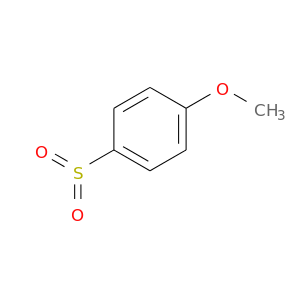 |
| DB01022 | NAD(P)H dehydrogenase, quinone 1 | approved | Phytonadione | 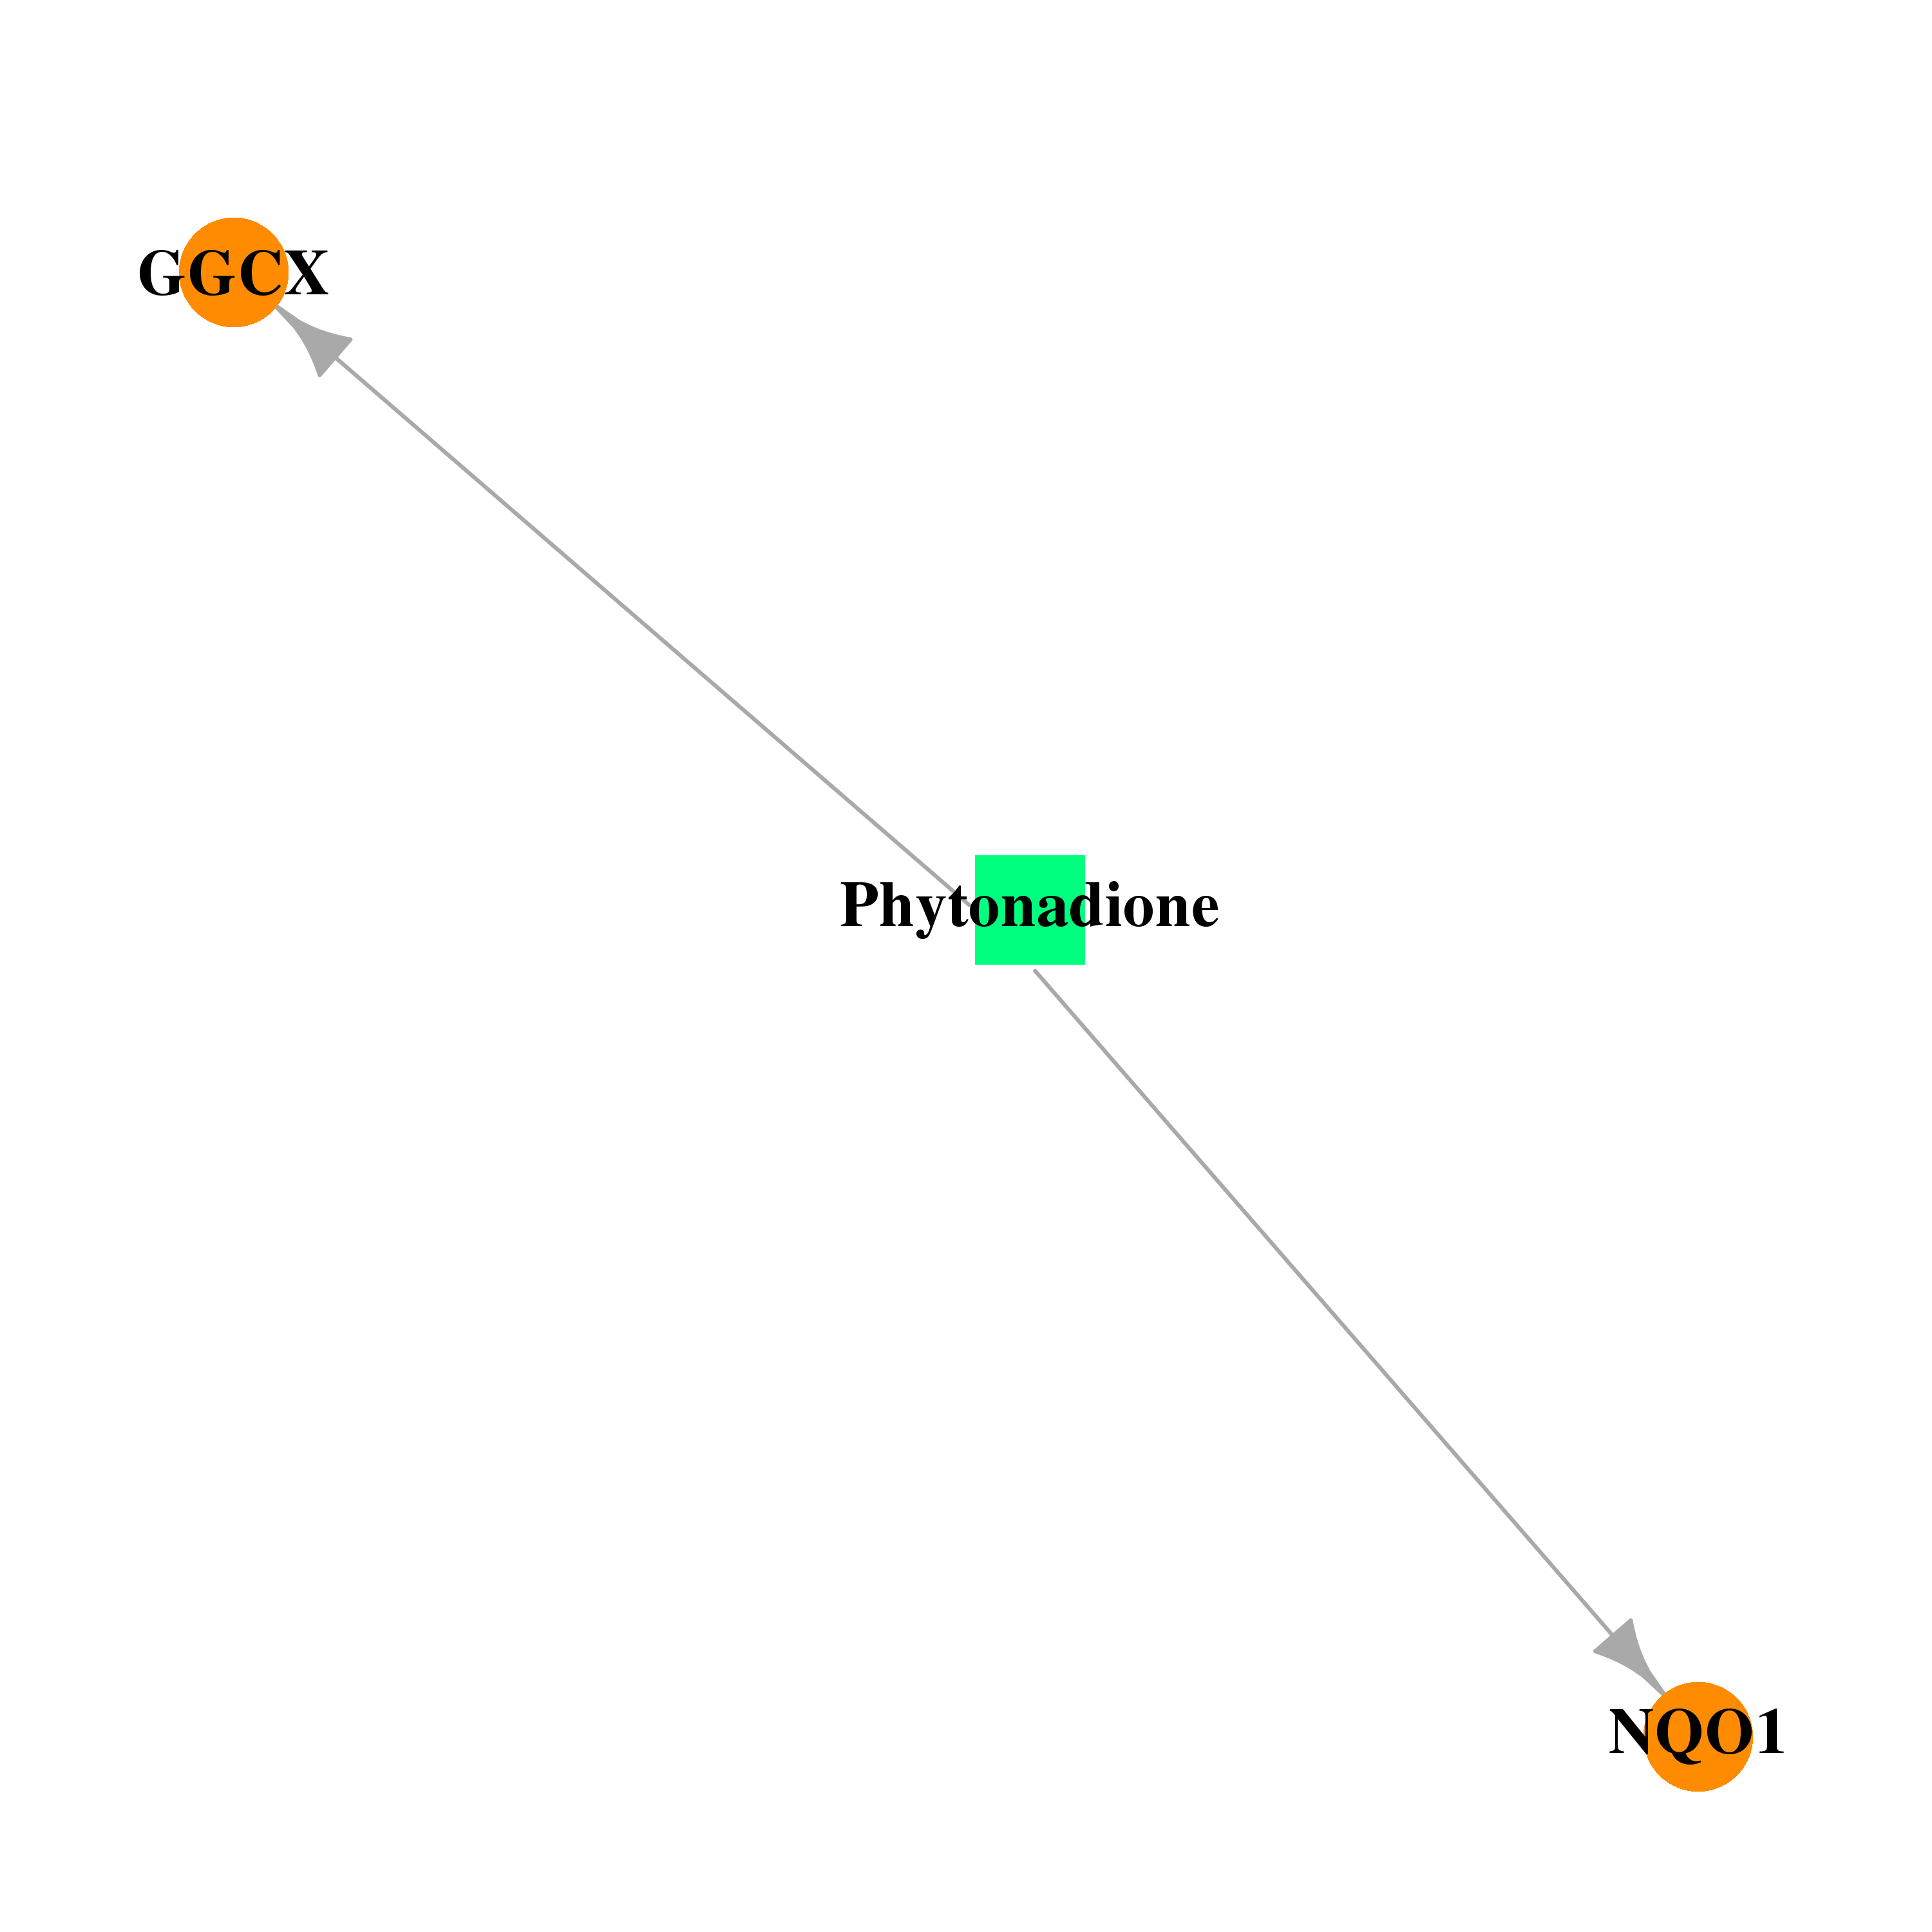 | 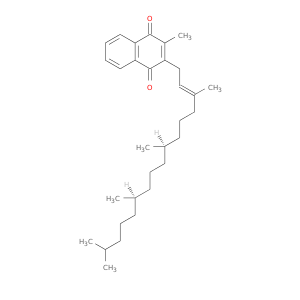 |
| Top |
| Cross referenced IDs for NQO1 |
| * We obtained these cross-references from Uniprot database. It covers 150 different DBs, 18 categories. http://www.uniprot.org/help/cross_references_section |
: Open all cross reference information
|
Copyright © 2016-Present - The Univsersity of Texas Health Science Center at Houston @ |