|
||||||||||||||||||||
| |
| Phenotypic Information (metabolism pathway, cancer, disease, phenome) |
| |
| |
| Gene-Gene Network Information: Co-Expression Network, Interacting Genes & KEGG |
| |
|


| Gene Summary for DIO1 |
| Top |
| Phenotypic Information for DIO1(metabolism pathway, cancer, disease, phenome) |
| Cancer | CGAP: DIO1 |
| Familial Cancer Database: DIO1 | |
| * This gene is included in those cancer gene databases. |
|
|
|
|
|
|
| ||||||||||||||
Oncogene 1 | Significant driver gene in | |||||||||||||||||||
| cf) number; DB name 1 Oncogene; http://nar.oxfordjournals.org/content/35/suppl_1/D721.long, 2 Tumor Suppressor gene; https://bioinfo.uth.edu/TSGene/, 3 Cancer Gene Census; http://www.nature.com/nrc/journal/v4/n3/abs/nrc1299.html, 4 CancerGenes; http://nar.oxfordjournals.org/content/35/suppl_1/D721.long, 5 Network of Cancer Gene; http://ncg.kcl.ac.uk/index.php, 1Therapeutic Vulnerabilities in Cancer; http://cbio.mskcc.org/cancergenomics/statius/ |
| REACTOME_METABOLISM_OF_AMINO_ACIDS_AND_DERIVATIVES | |
| OMIM | |
| Orphanet | |
| Disease | KEGG Disease: DIO1 |
| MedGen: DIO1 (Human Medical Genetics with Condition) | |
| ClinVar: DIO1 | |
| Phenotype | MGI: DIO1 (International Mouse Phenotyping Consortium) |
| PhenomicDB: DIO1 | |
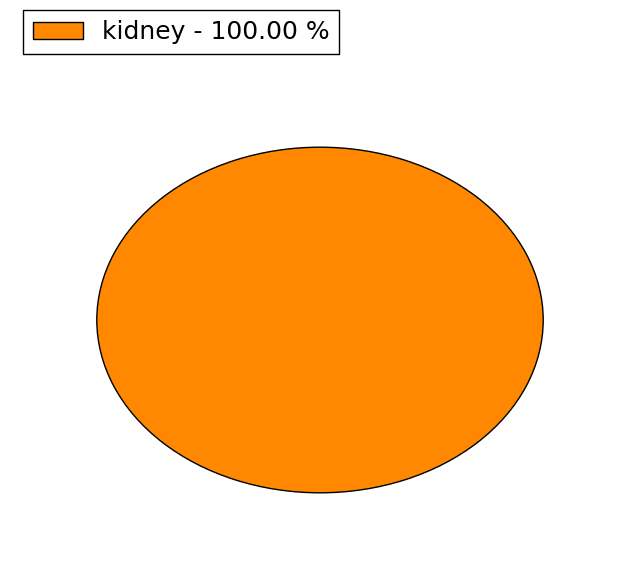
| Mutations for DIO1 |
| * Under tables are showing count per each tissue to give us broad intuition about tissue specific mutation patterns.You can go to the detailed page for each mutation database's web site. |
| - Statistics for Tissue and Mutation type | Top |
 |
| - For Inter-chromosomal Variations |
| There's no inter-chromosomal structural variation. |
| - For Intra-chromosomal Variations |
| * Intra-chromosomal variantions includes 'intrachromosomal amplicon to amplicon', 'intrachromosomal amplicon to non-amplified dna', 'intrachromosomal deletion', 'intrachromosomal fold-back inversion', 'intrachromosomal inversion', 'intrachromosomal tandem duplication', 'Intrachromosomal unknown type', 'intrachromosomal with inverted orientation', 'intrachromosomal with non-inverted orientation'. |
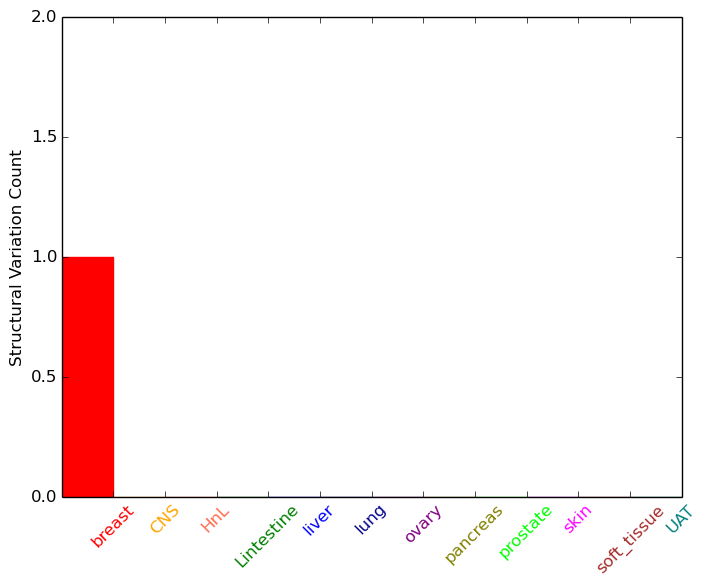 |
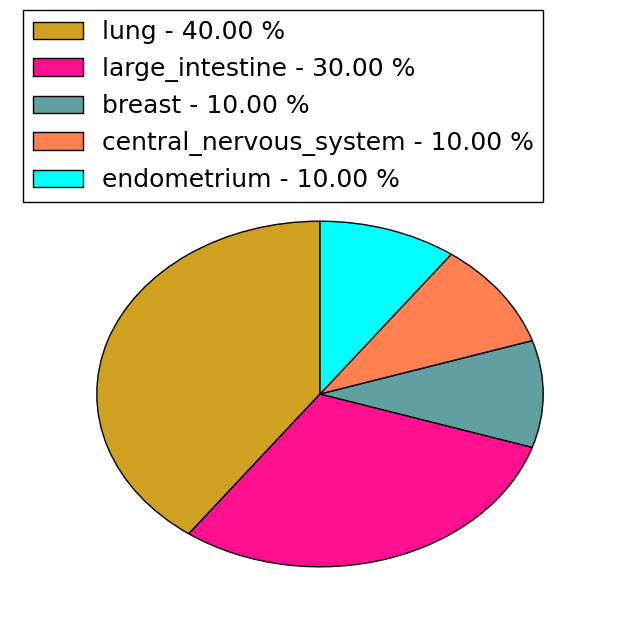
| Sample | Symbol_a | Chr_a | Start_a | End_a | Symbol_b | Chr_b | Start_b | End_b |
| breast | DIO1 | chr1 | 54369421 | 54369421 | chr1 | 54378944 | 54378944 |
| cf) Tissue number; Tissue name (1;Breast, 2;Central_nervous_system, 3;Haematopoietic_and_lymphoid_tissue, 4;Large_intestine, 5;Liver, 6;Lung, 7;Ovary, 8;Pancreas, 9;Prostate, 10;Skin, 11;Soft_tissue, 12;Upper_aerodigestive_tract) |
| * From mRNA Sanger sequences, Chitars2.0 arranged chimeric transcripts. This table shows DIO1 related fusion information. |
| ID | Head Gene | Tail Gene | Accession | Gene_a | qStart_a | qEnd_a | Chromosome_a | tStart_a | tEnd_a | Gene_a | qStart_a | qEnd_a | Chromosome_a | tStart_a | tEnd_a |
| DA641783 | LOC100507412 | 1 | 106 | ? | 112074 | 112179 | DIO1 | 107 | 534 | 1 | 54359860 | 54370405 | |
| Top |
| There's no copy number variation information in COSMIC data for this gene. |
| Top |
|
 |
| Top |
| Stat. for Non-Synonymous SNVs (# total SNVs=18) | (# total SNVs=10) |
 |  |
(# total SNVs=1) | (# total SNVs=0) |
 |
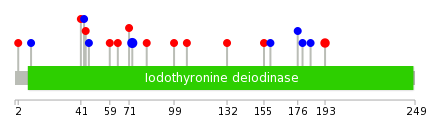
| Top |
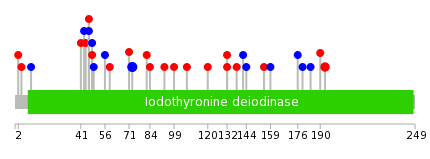
| * When you move the cursor on each content, you can see more deailed mutation information on the Tooltip. Those are primary_site,primary_histology,mutation(aa),pubmedID. |
| GRCh37 position | Mutation(aa) | Unique sampleID count |
| chr1:54359925-54359925 | p.W14* | 3 |
| chr1:54360102-54360102 | p.F73F | 3 |
| chr1:54375643-54375643 | p.R193C | 2 |
| chr1:54371825-54371825 | p.R132H | 1 |
| chr1:54360096-54360096 | p.F71L | 1 |
| chr1:54371842-54371842 | p.L138I | 1 |
| chr1:54360005-54360005 | p.I41N | 1 |
| chr1:54371856-54371856 | p.R142R | 1 |
| chr1:54360012-54360012 | p.A43A | 1 |
| chr1:54360124-54360124 | p.R81* | 1 |
| Top |
|
 |
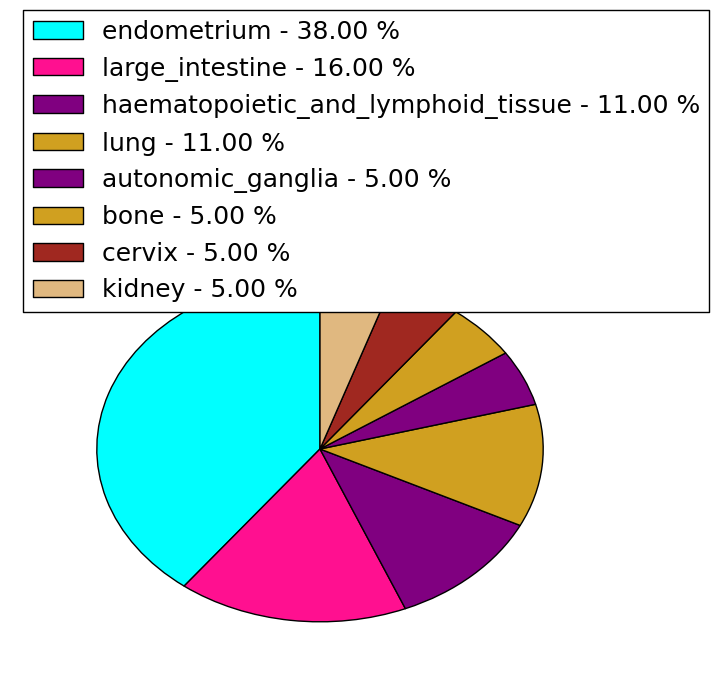
| Point Mutation/ Tissue ID | 1 | 2 | 3 | 4 | 5 | 6 | 7 | 8 | 9 | 10 | 11 | 12 | 13 | 14 | 15 | 16 | 17 | 18 | 19 | 20 |
| # sample | 1 | 1 | 4 | 3 | 1 | 4 | 1 | 1 | 7 | |||||||||||
| # mutation | 1 | 1 | 4 | 3 | 1 | 4 | 1 | 1 | 6 | |||||||||||
| nonsynonymous SNV | 1 | 2 | 2 | 1 | 1 | 5 | ||||||||||||||
| synonymous SNV | 1 | 1 | 3 | 1 | 1 | 2 | 1 |
| cf) Tissue ID; Tissue type (1; BLCA[Bladder Urothelial Carcinoma], 2; BRCA[Breast invasive carcinoma], 3; CESC[Cervical squamous cell carcinoma and endocervical adenocarcinoma], 4; COAD[Colon adenocarcinoma], 5; GBM[Glioblastoma multiforme], 6; Glioma Low Grade, 7; HNSC[Head and Neck squamous cell carcinoma], 8; KICH[Kidney Chromophobe], 9; KIRC[Kidney renal clear cell carcinoma], 10; KIRP[Kidney renal papillary cell carcinoma], 11; LAML[Acute Myeloid Leukemia], 12; LUAD[Lung adenocarcinoma], 13; LUSC[Lung squamous cell carcinoma], 14; OV[Ovarian serous cystadenocarcinoma ], 15; PAAD[Pancreatic adenocarcinoma], 16; PRAD[Prostate adenocarcinoma], 17; SKCM[Skin Cutaneous Melanoma], 18:STAD[Stomach adenocarcinoma], 19:THCA[Thyroid carcinoma], 20:UCEC[Uterine Corpus Endometrial Carcinoma]) |
| Top |
| * We represented just top 10 SNVs. When you move the cursor on each content, you can see more deailed mutation information on the Tooltip. Those are primary_site, primary_histology, mutation(aa), pubmedID. |
| Genomic Position | Mutation(aa) | Unique sampleID count |
| chr1:54360102 | p.F73F | 3 |
| chr1:54375643 | p.R193C | 2 |
| chr1:54360012 | p.A43A | 1 |
| chr1:54371895 | p.M44T | 1 |
| chr1:54360014 | p.E46E | 1 |
| chr1:54371907 | p.D59N | 1 |
| chr1:54360021 | p.T64A | 1 |
| chr1:54371958 | p.F71L | 1 |
| chr1:54360058 | p.L82P | 1 |
| chr1:54371967 | p.R99H | 1 |
| * Copy number data were extracted from TCGA using R package TCGA-Assembler. The URLs of all public data files on TCGA DCC data server were gathered on Jan-05-2015. Function ProcessCNAData in TCGA-Assembler package was used to obtain gene-level copy number value which is calculated as the average copy number of the genomic region of a gene. |
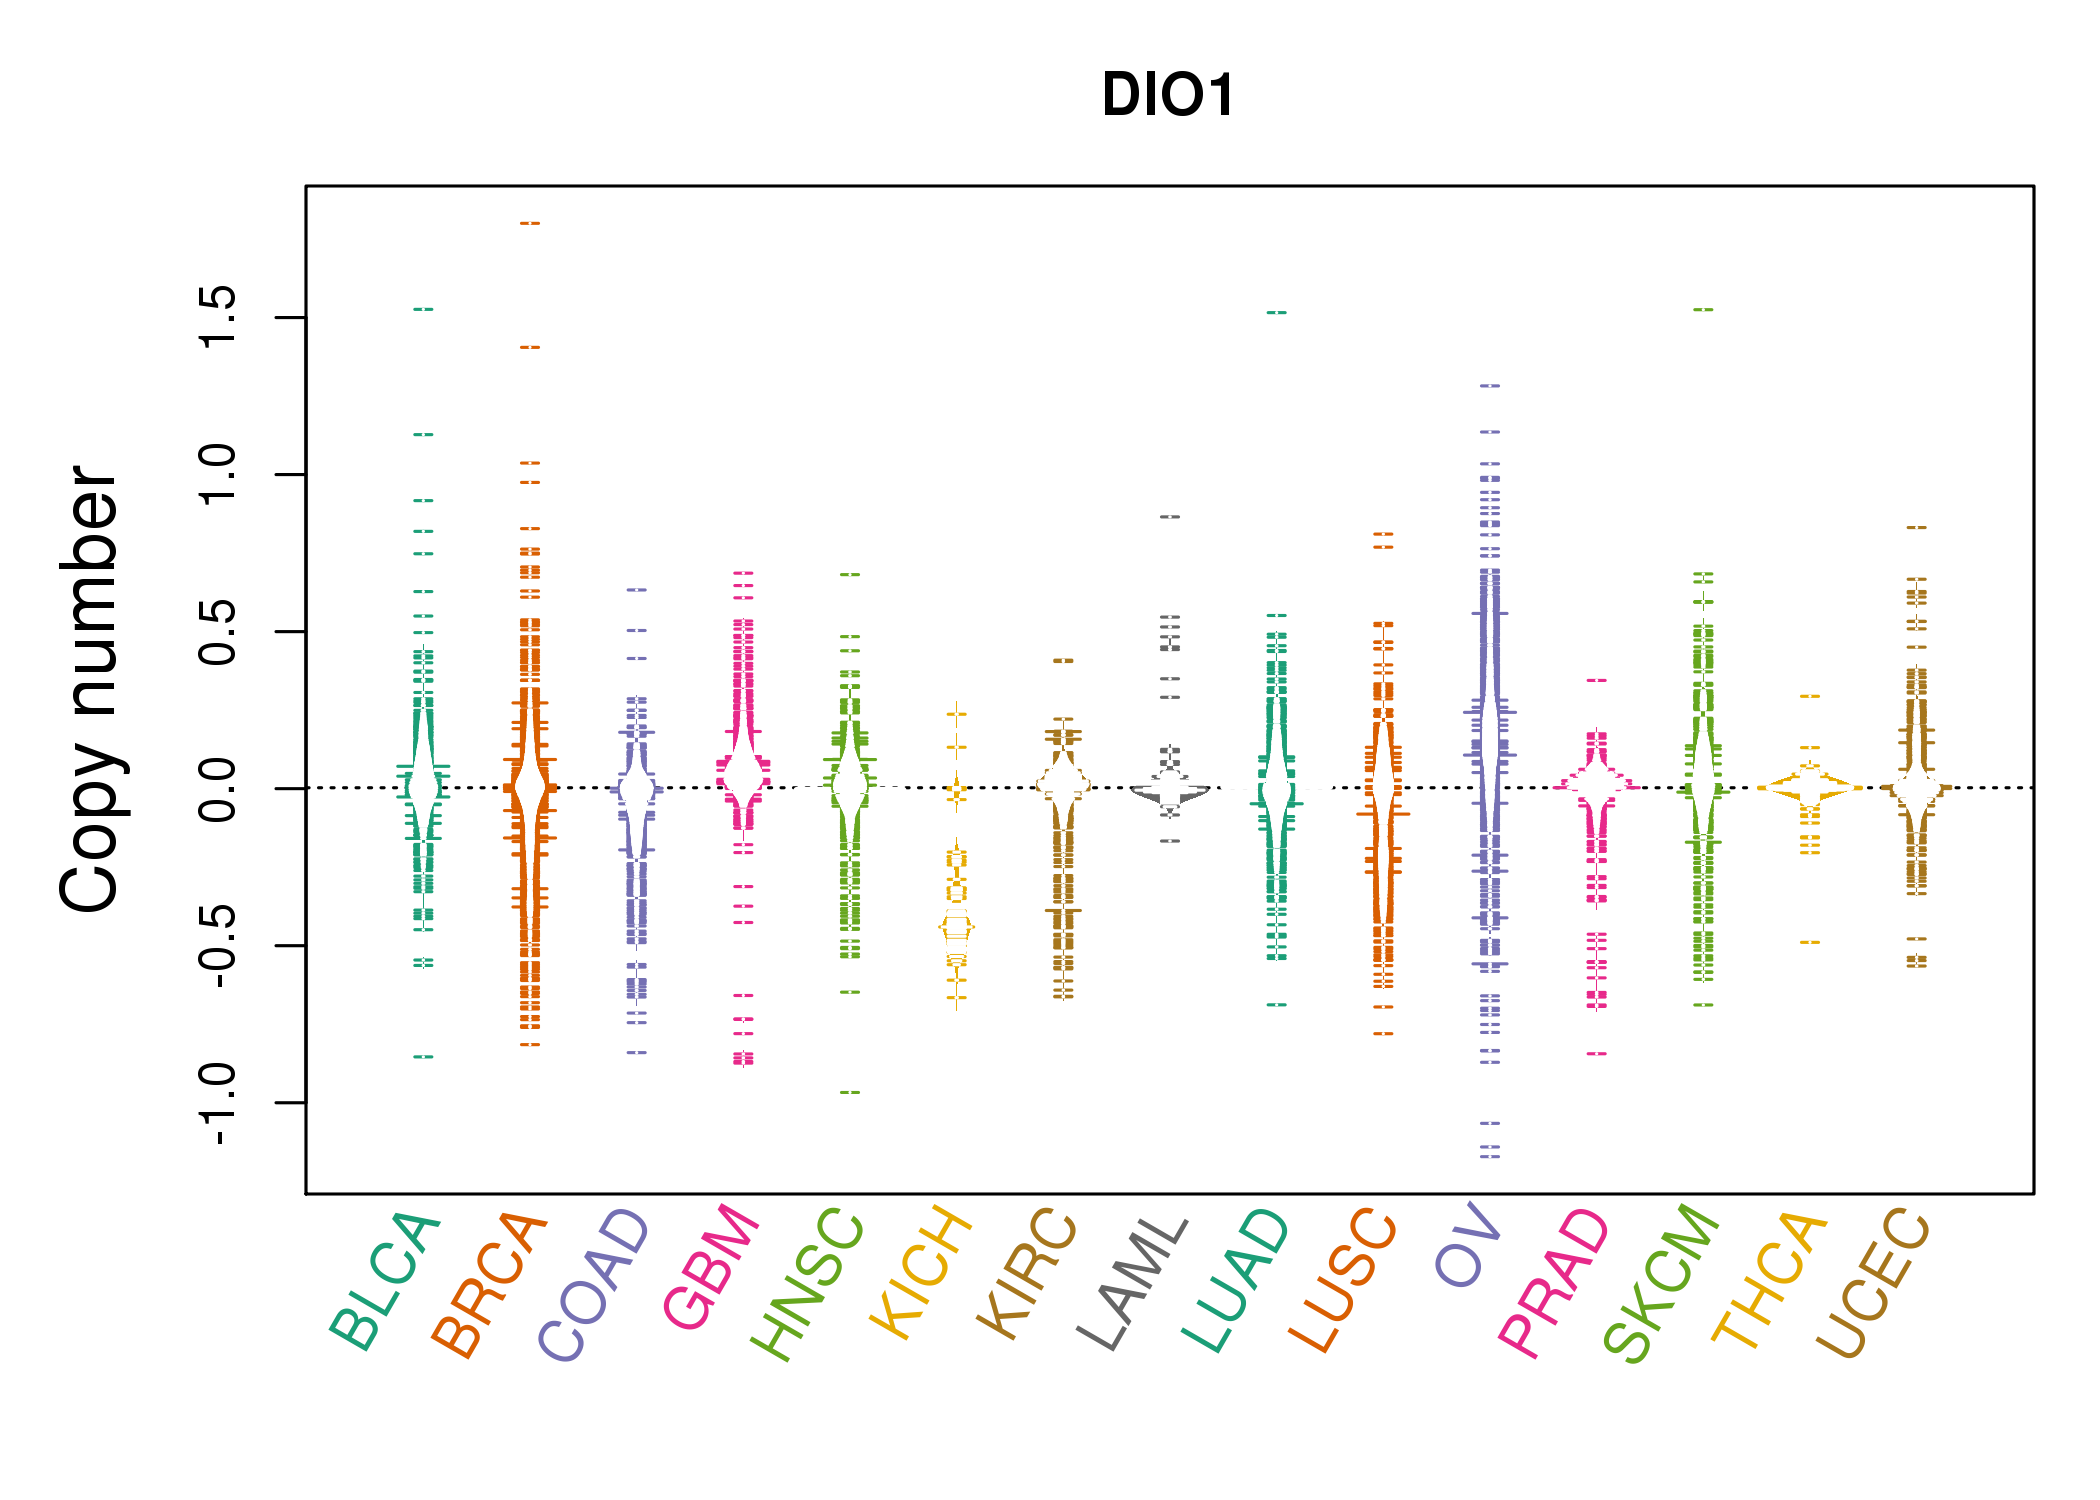 |
| cf) Tissue ID[Tissue type]: BLCA[Bladder Urothelial Carcinoma], BRCA[Breast invasive carcinoma], CESC[Cervical squamous cell carcinoma and endocervical adenocarcinoma], COAD[Colon adenocarcinoma], GBM[Glioblastoma multiforme], Glioma Low Grade, HNSC[Head and Neck squamous cell carcinoma], KICH[Kidney Chromophobe], KIRC[Kidney renal clear cell carcinoma], KIRP[Kidney renal papillary cell carcinoma], LAML[Acute Myeloid Leukemia], LUAD[Lung adenocarcinoma], LUSC[Lung squamous cell carcinoma], OV[Ovarian serous cystadenocarcinoma ], PAAD[Pancreatic adenocarcinoma], PRAD[Prostate adenocarcinoma], SKCM[Skin Cutaneous Melanoma], STAD[Stomach adenocarcinoma], THCA[Thyroid carcinoma], UCEC[Uterine Corpus Endometrial Carcinoma] |
| Top |
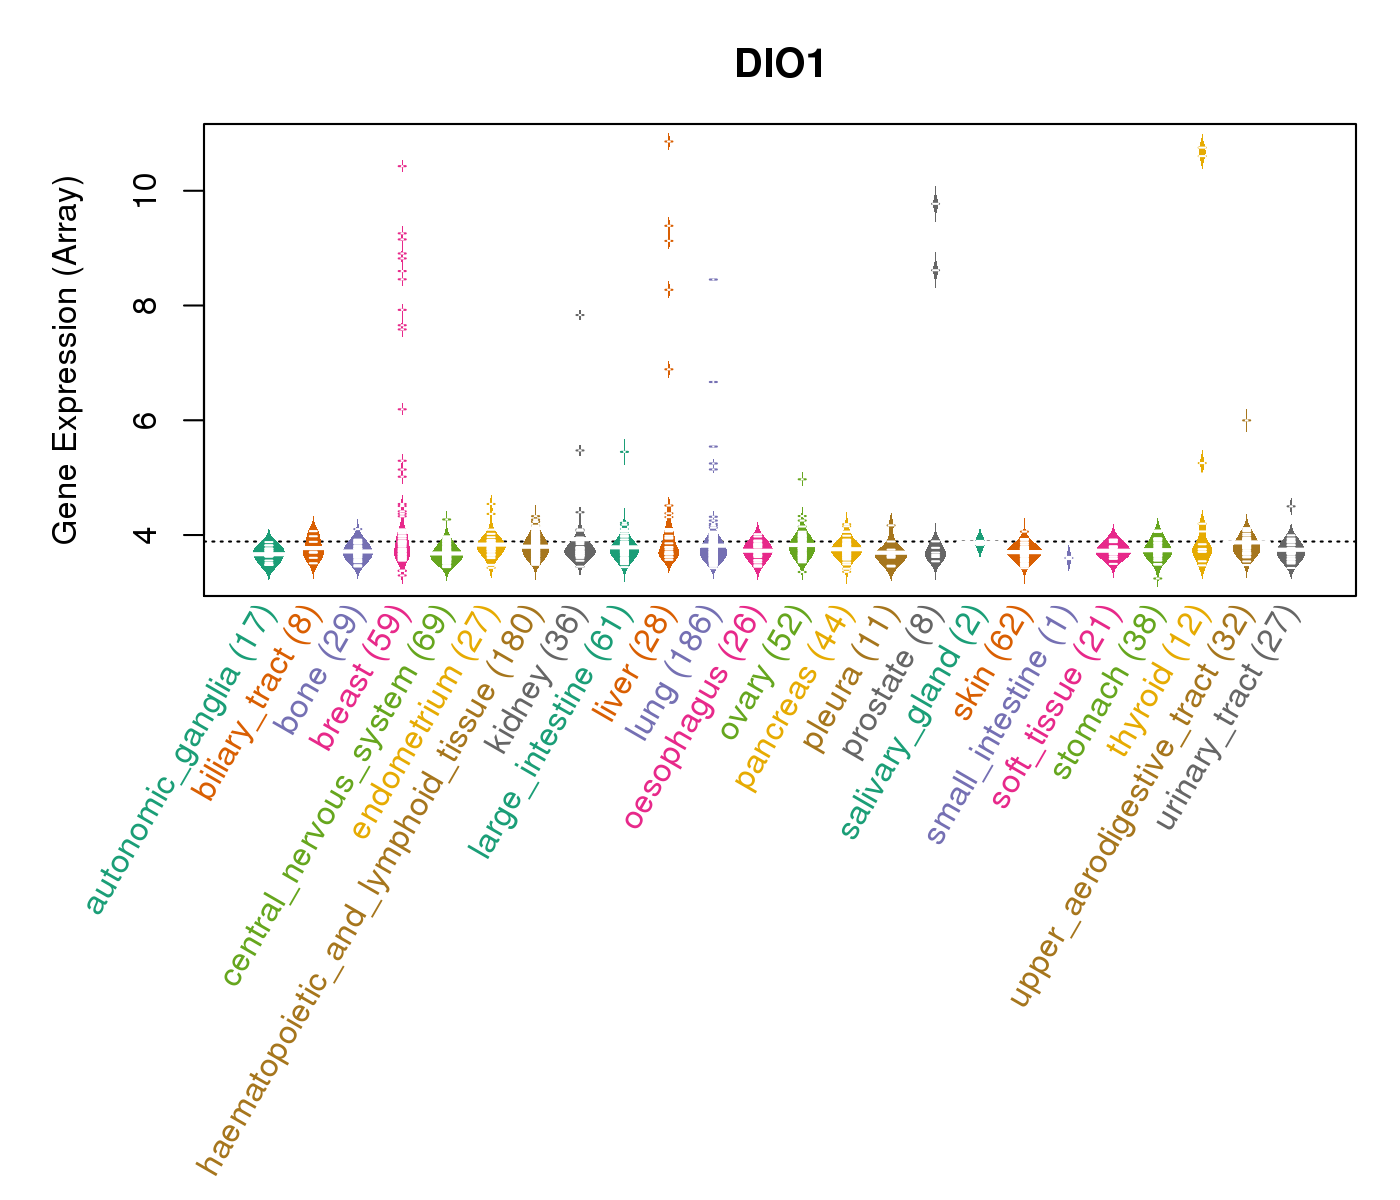
| Gene Expression for DIO1 |
| * CCLE gene expression data were extracted from CCLE_Expression_Entrez_2012-10-18.res: Gene-centric RMA-normalized mRNA expression data. |
 |
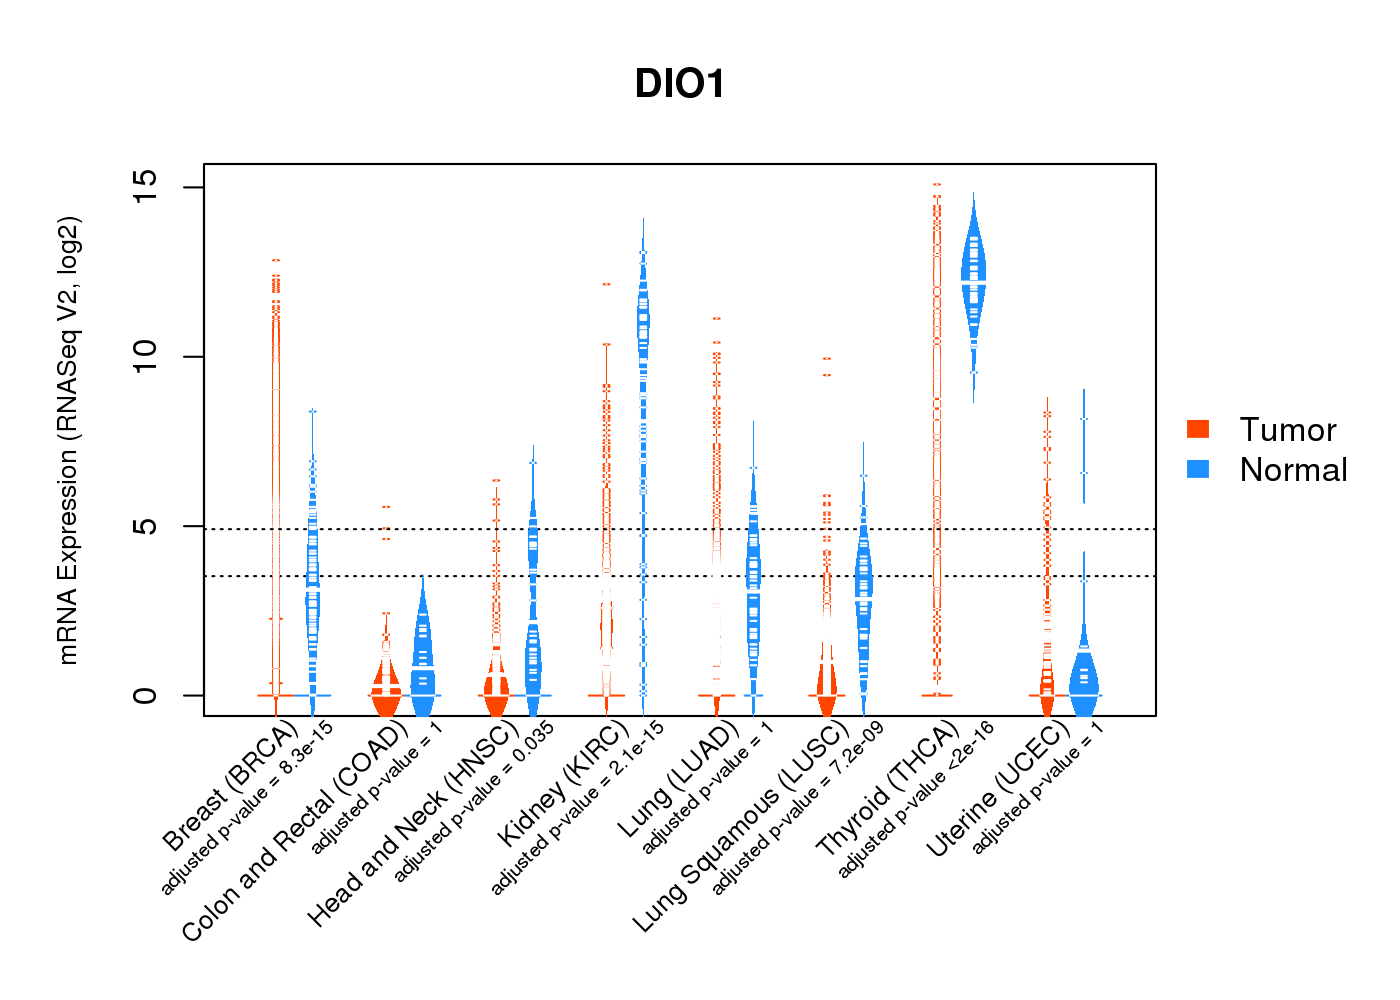
| * Normalized gene expression data of RNASeqV2 was extracted from TCGA using R package TCGA-Assembler. The URLs of all public data files on TCGA DCC data server were gathered at Jan-05-2015. Only eight cancer types have enough normal control samples for differential expression analysis. (t test, adjusted p<0.05 (using Benjamini-Hochberg FDR)) |
 |
| Top |
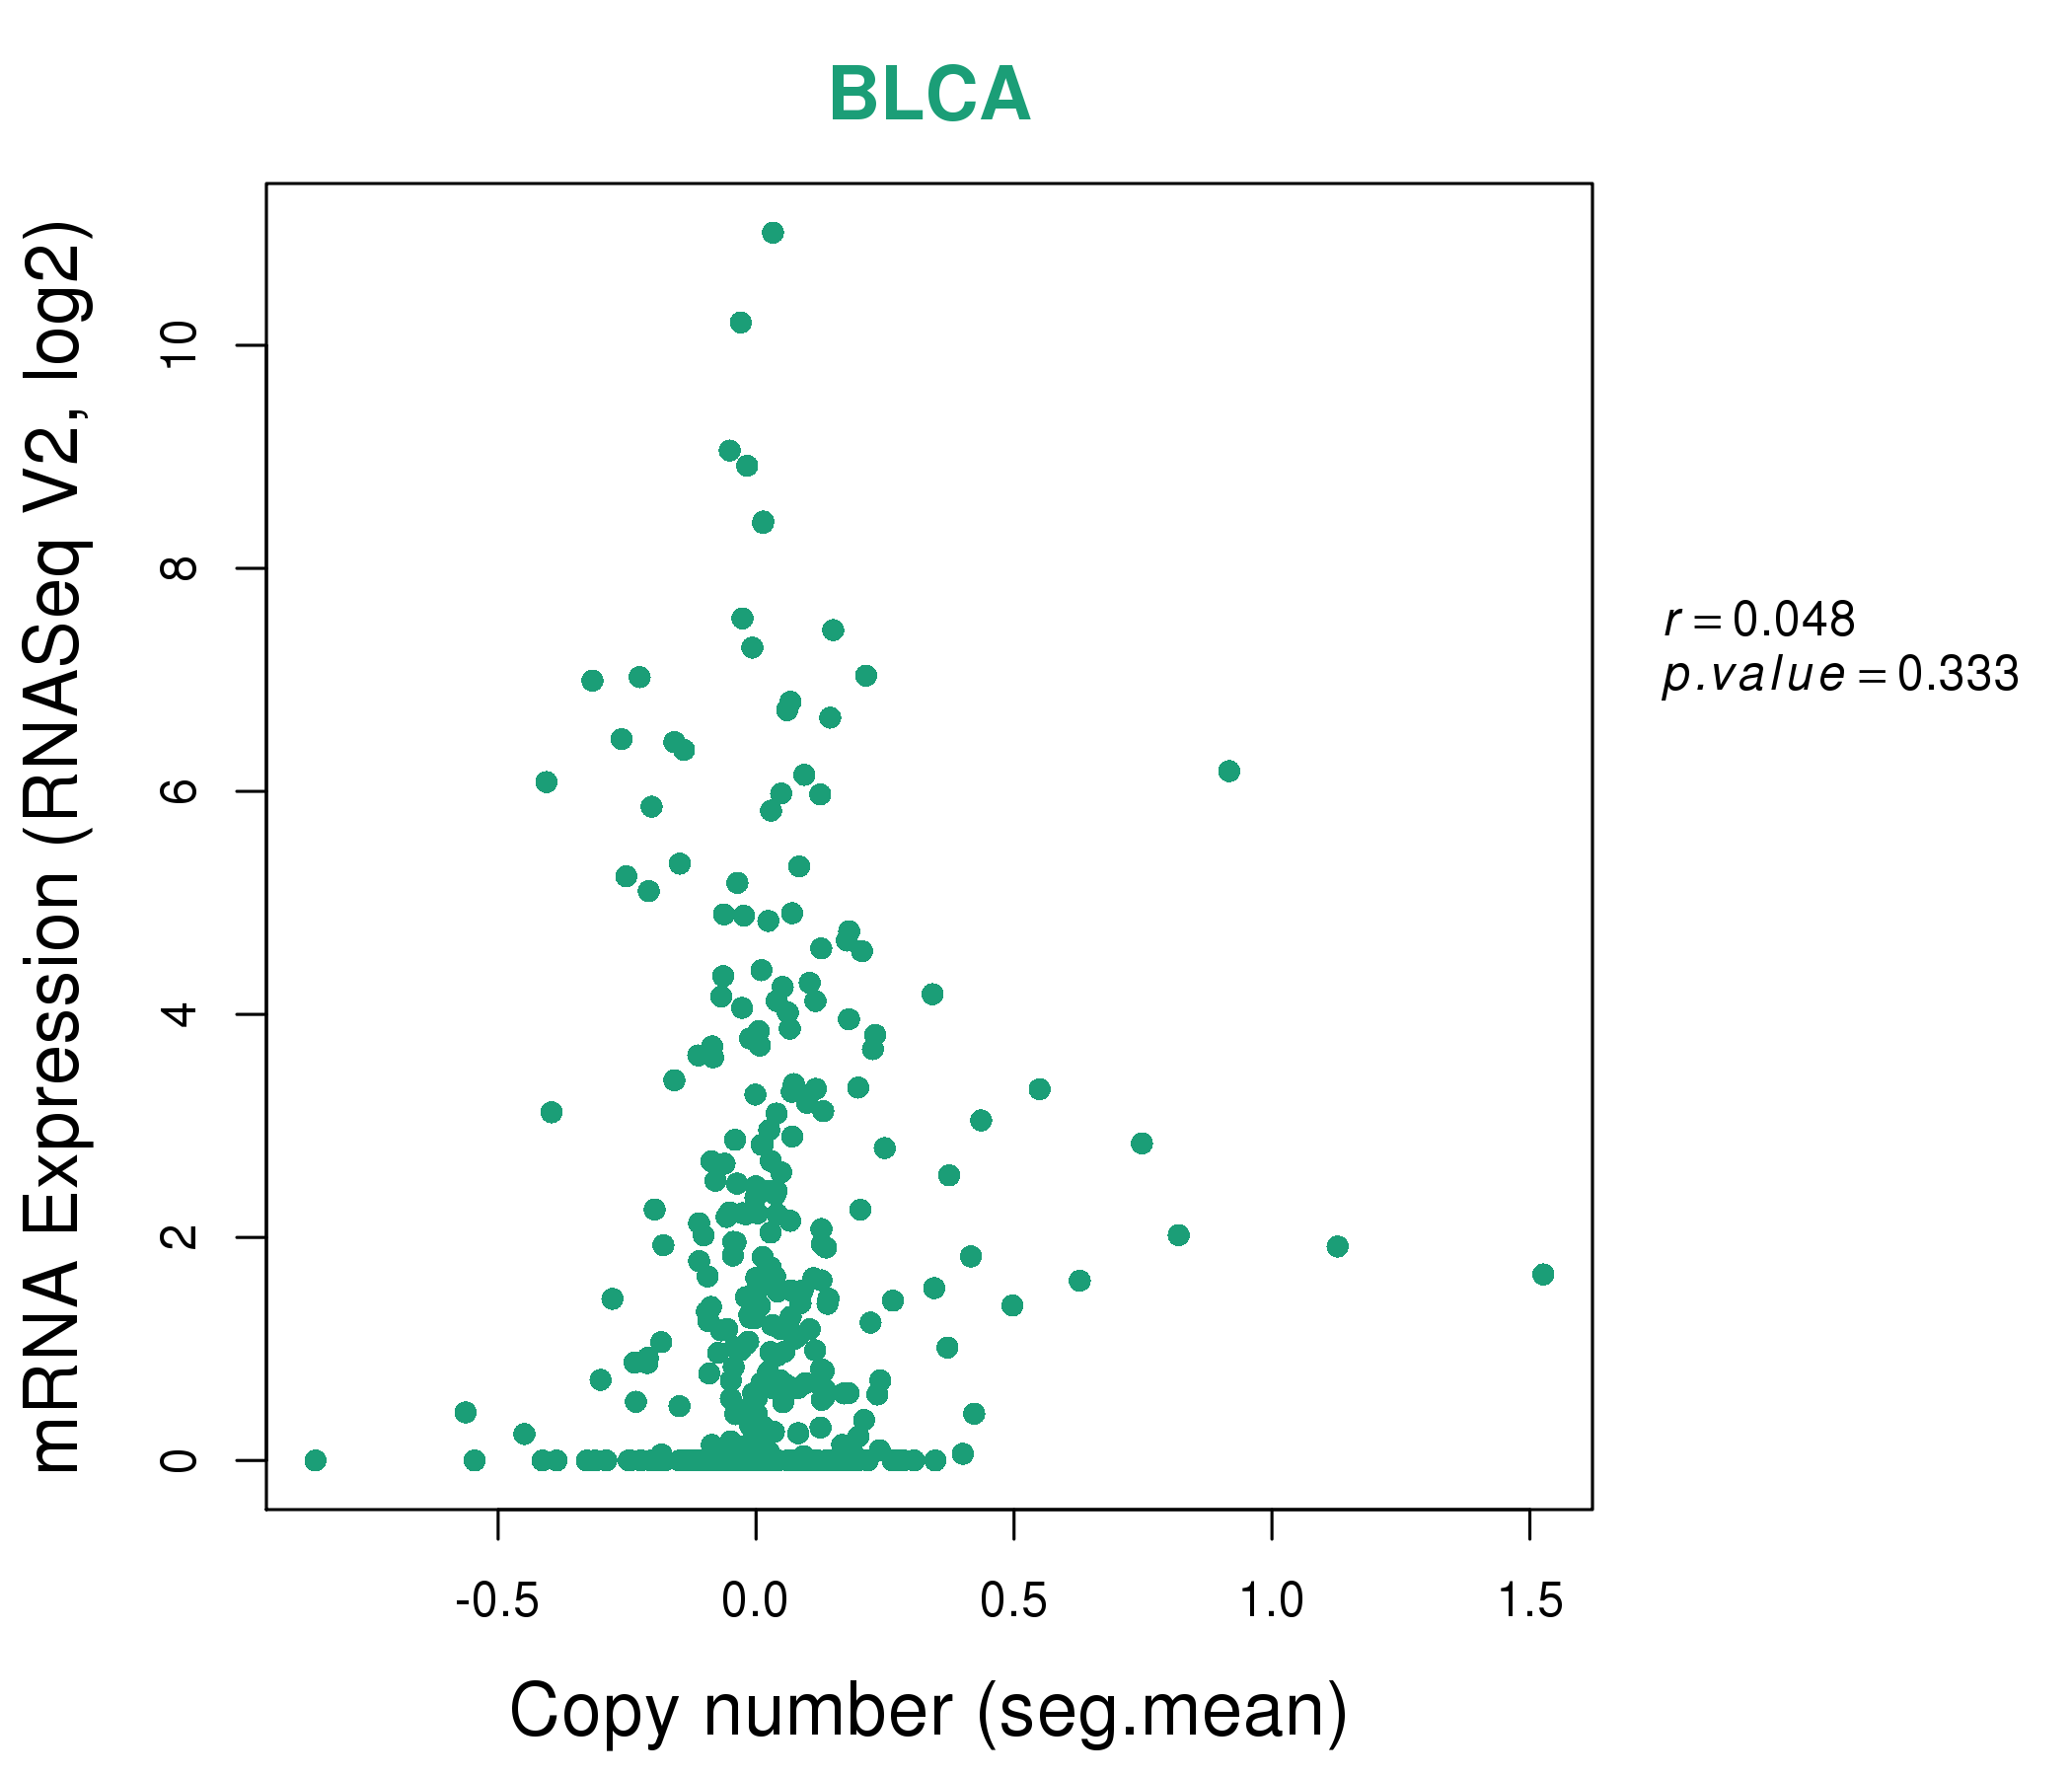
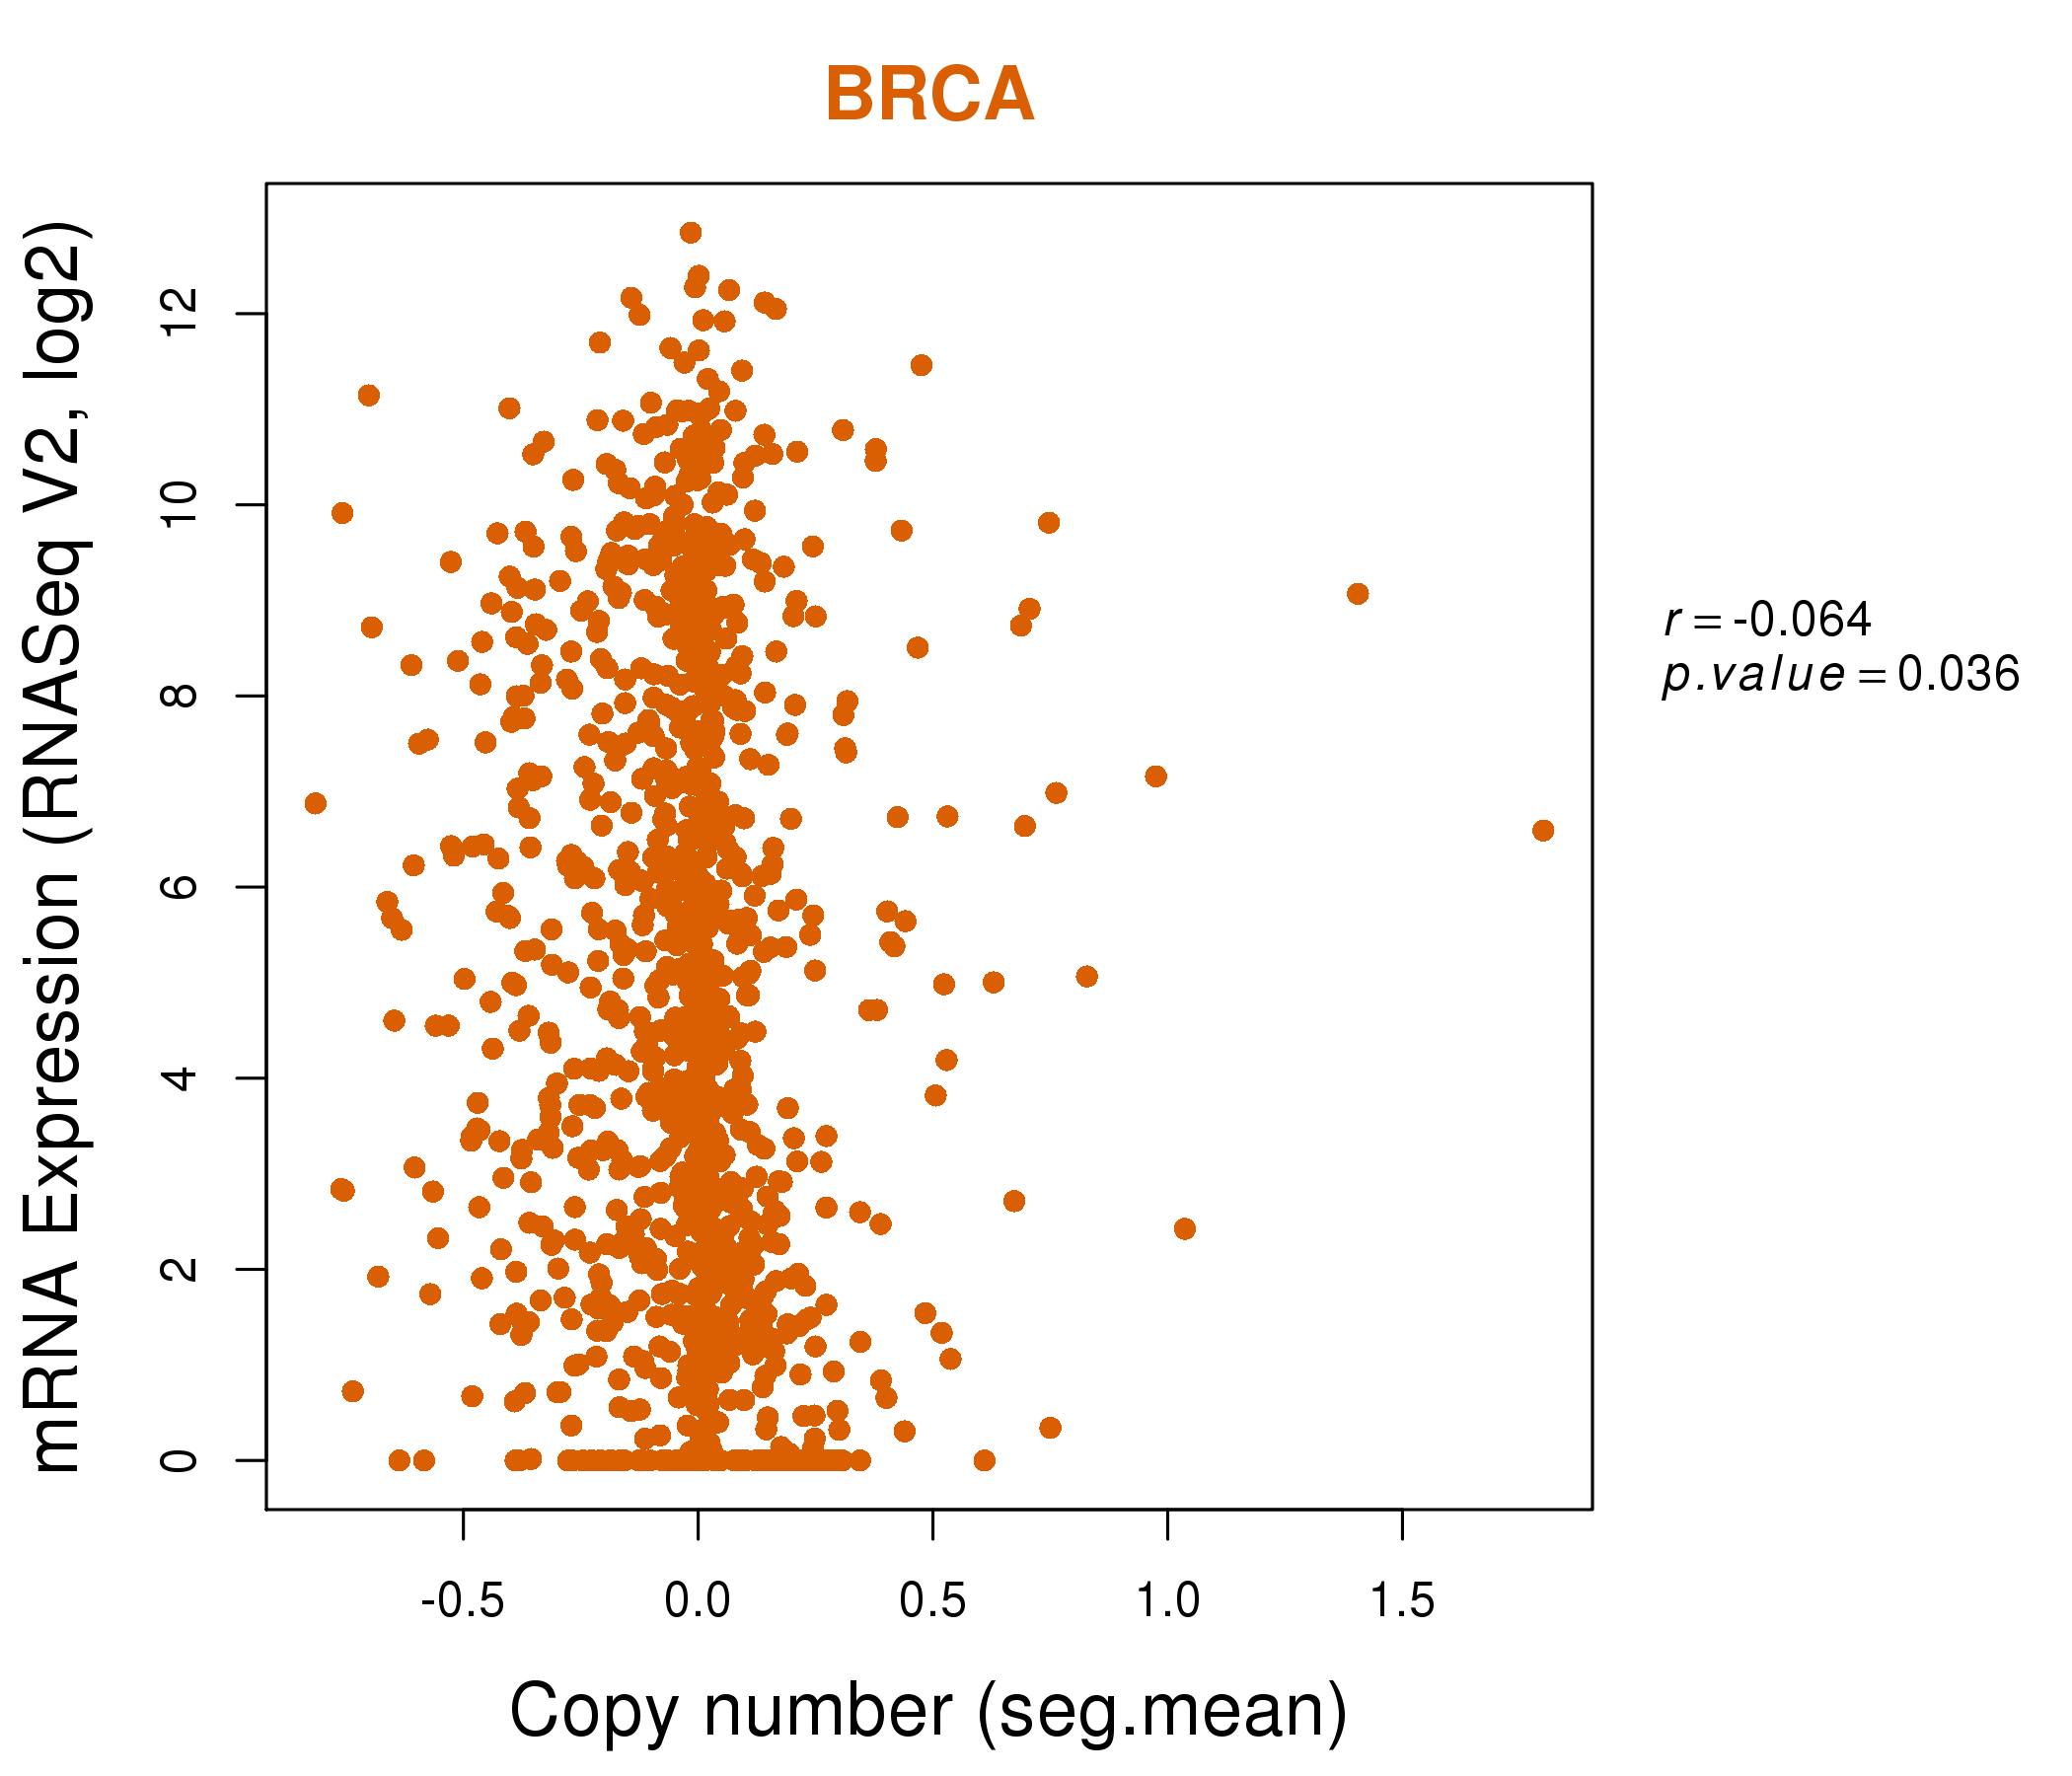
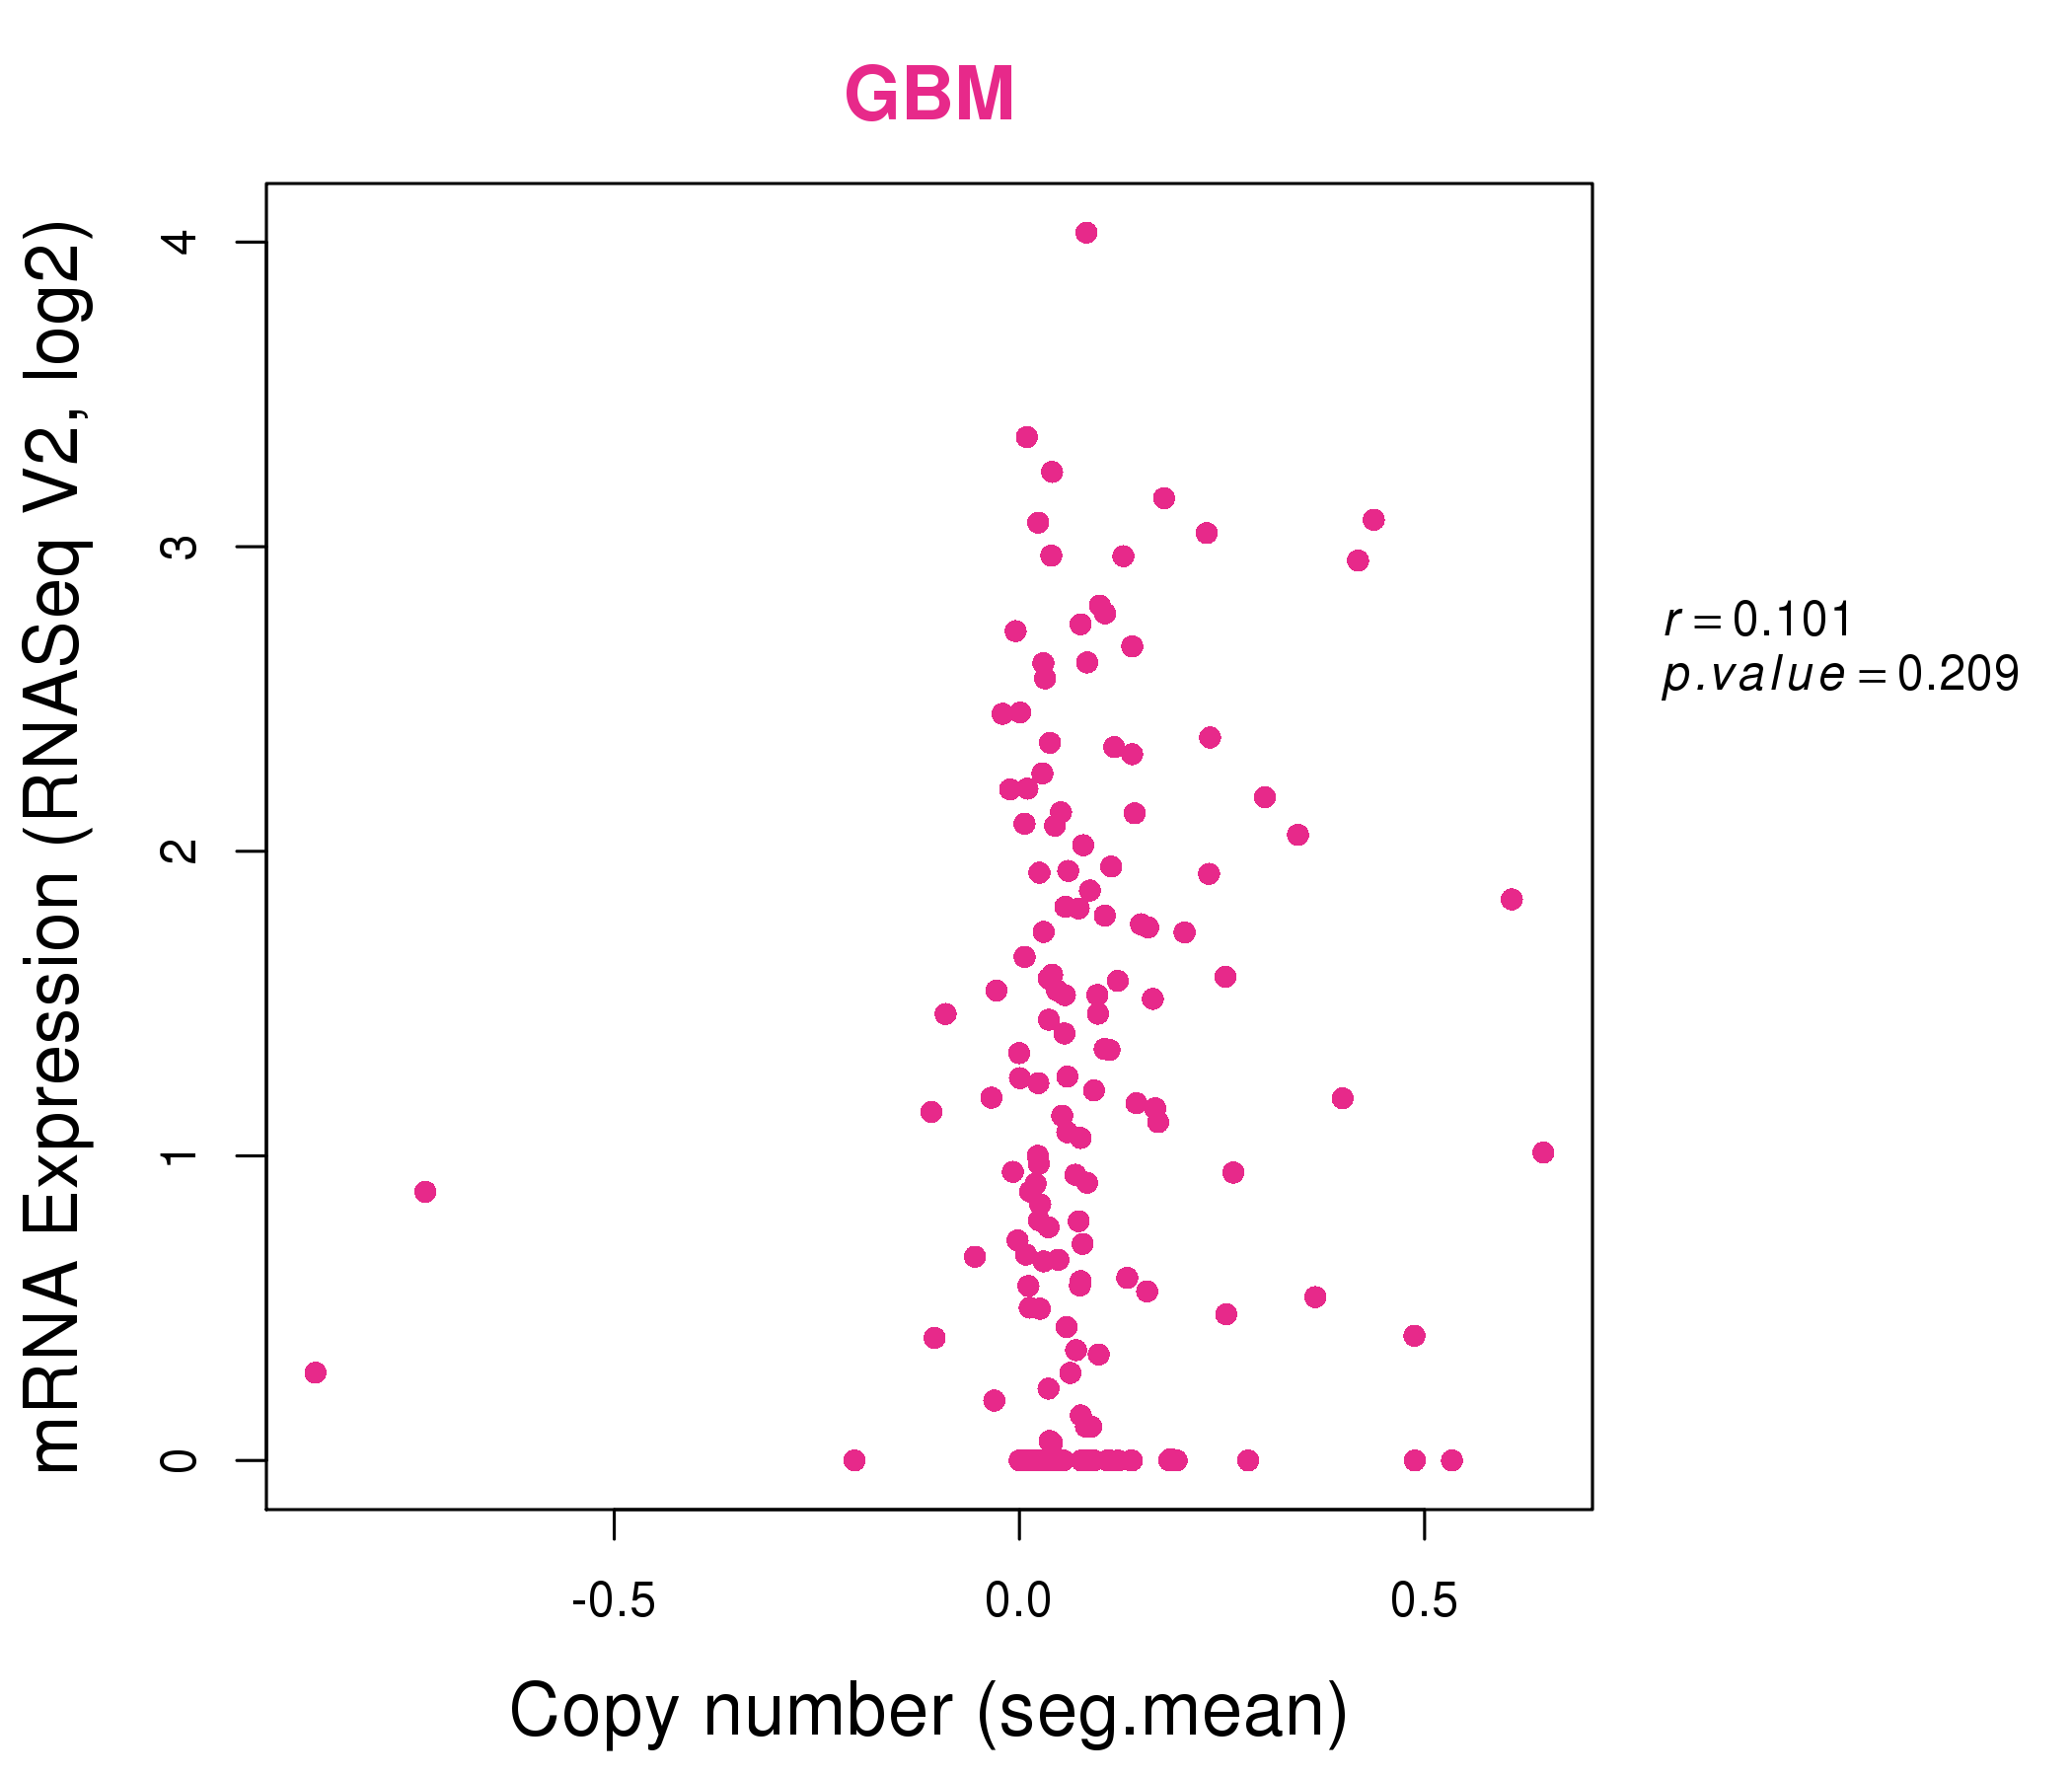
| * This plots show the correlation between CNV and gene expression. |
: Open all plots for all cancer types
 |
|
 |
|
| Top |
| Gene-Gene Network Information |
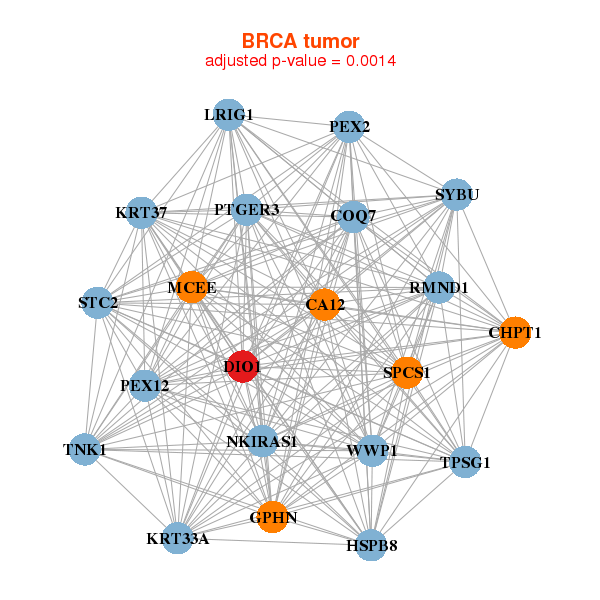
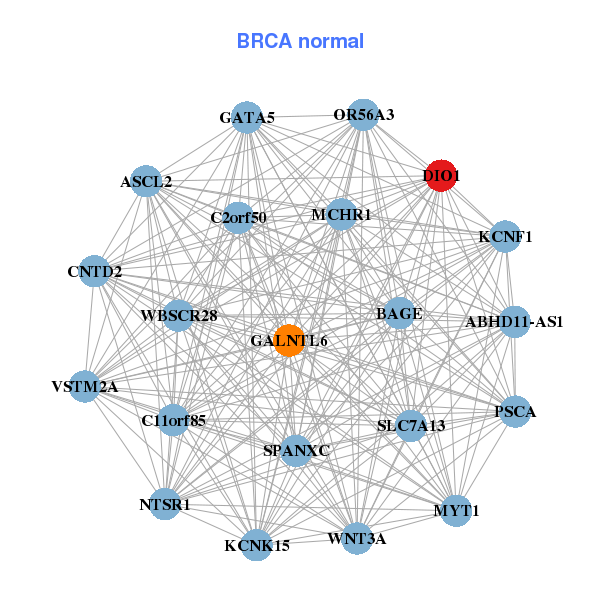
| * Co-Expression network figures were drawn using R package igraph. Only the top 20 genes with the highest correlations were shown. Red circle: input gene, orange circle: cell metabolism gene, sky circle: other gene |
: Open all plots for all cancer types
 |
| ||||
| CA12,CHPT1,COQ7,DIO1,GPHN,HSPB8,KRT33A, KRT37,LRIG1,MCEE,NKIRAS1,PEX12,PEX2,PTGER3, RMND1,SPCS1,STC2,SYBU,TNK1,TPSG1,WWP1 | ASCL2,BAGE,C11orf85,C2orf50,CNTD2,DIO1,GALNTL6, GATA5,KCNF1,KCNK15,MCHR1,MYT1,NTSR1,OR56A3, PSCA,SLC7A13,SPANXC,VSTM2A,ABHD11-AS1,WBSCR28,WNT3A | ||||
 |
| ||||
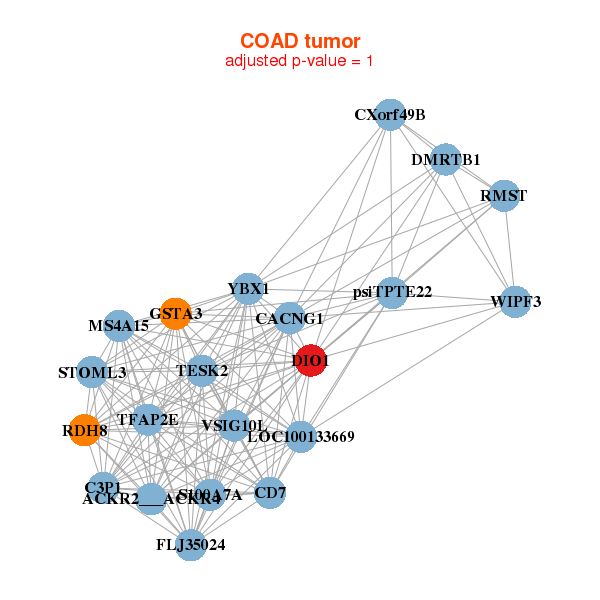
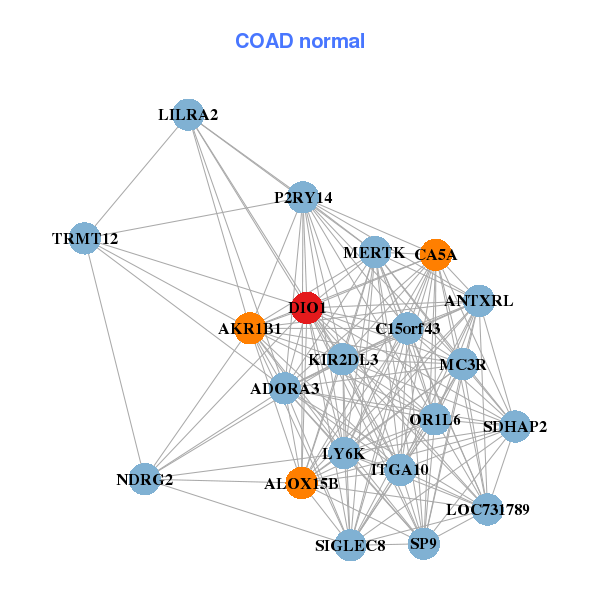
| C3P1,CACNG1,ACKR2___ACKR4,CD7,CXorf49B,DIO1,DMRTB1, FLJ35024,GSTA3,LOC100133669,MS4A15,psiTPTE22,RDH8,RMST, S100A7A,STOML3,TESK2,TFAP2E,VSIG10L,WIPF3,YBX1 | ADORA3,AKR1B1,ALOX15B,ANTXRL,C15orf43,CA5A,DIO1, ITGA10,KIR2DL3,LILRA2,LOC731789,LY6K,MC3R,MERTK, NDRG2,OR1L6,P2RY14,SDHAP2,SIGLEC8,SP9,TRMT12 |
| * Co-Expression network figures were drawn using R package igraph. Only the top 20 genes with the highest correlations were shown. Red circle: input gene, orange circle: cell metabolism gene, sky circle: other gene |
: Open all plots for all cancer types
| Top |
: Open all interacting genes' information including KEGG pathway for all interacting genes from DAVID
| Top |
| Pharmacological Information for DIO1 |
| DB Category | DB Name | DB's ID and Url link |
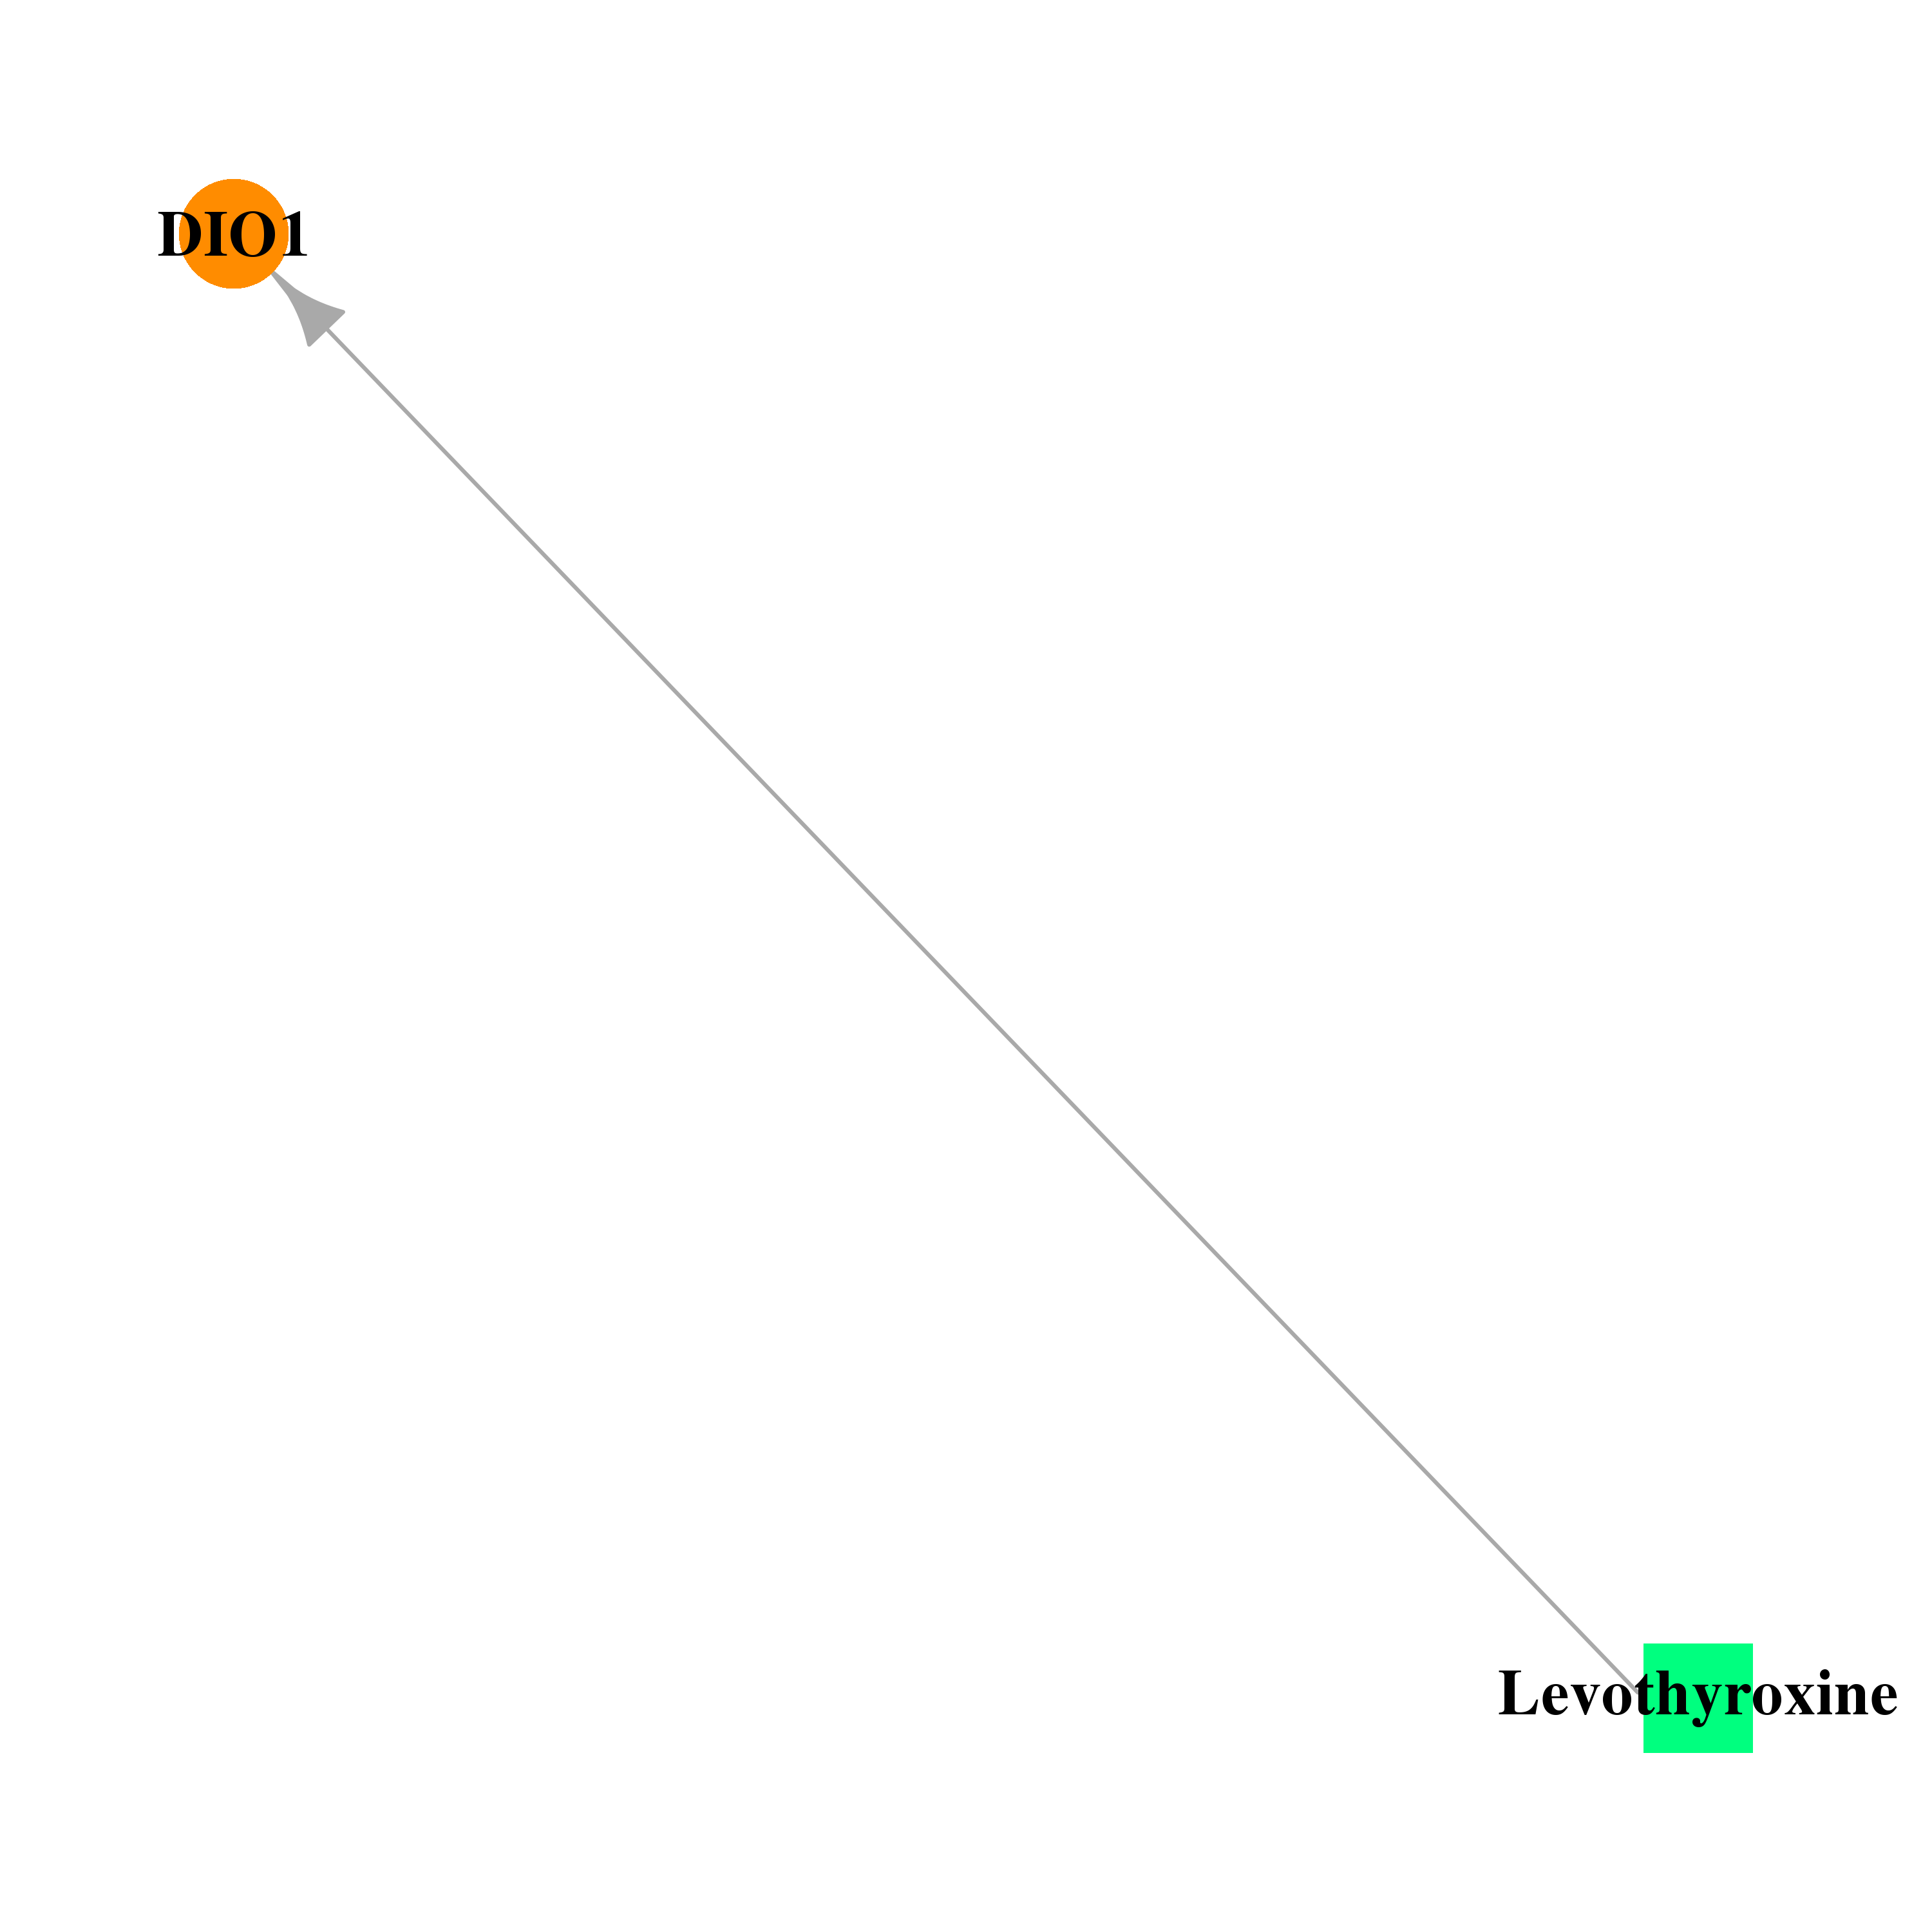
| * Gene Centered Interaction Network. |
 |
| * Drug Centered Interaction Network. |
| DrugBank ID | Target Name | Drug Groups | Generic Name | Drug Centered Network | Drug Structure |
| DB00451 | deiodinase, iodothyronine, type I | approved | Levothyroxine | 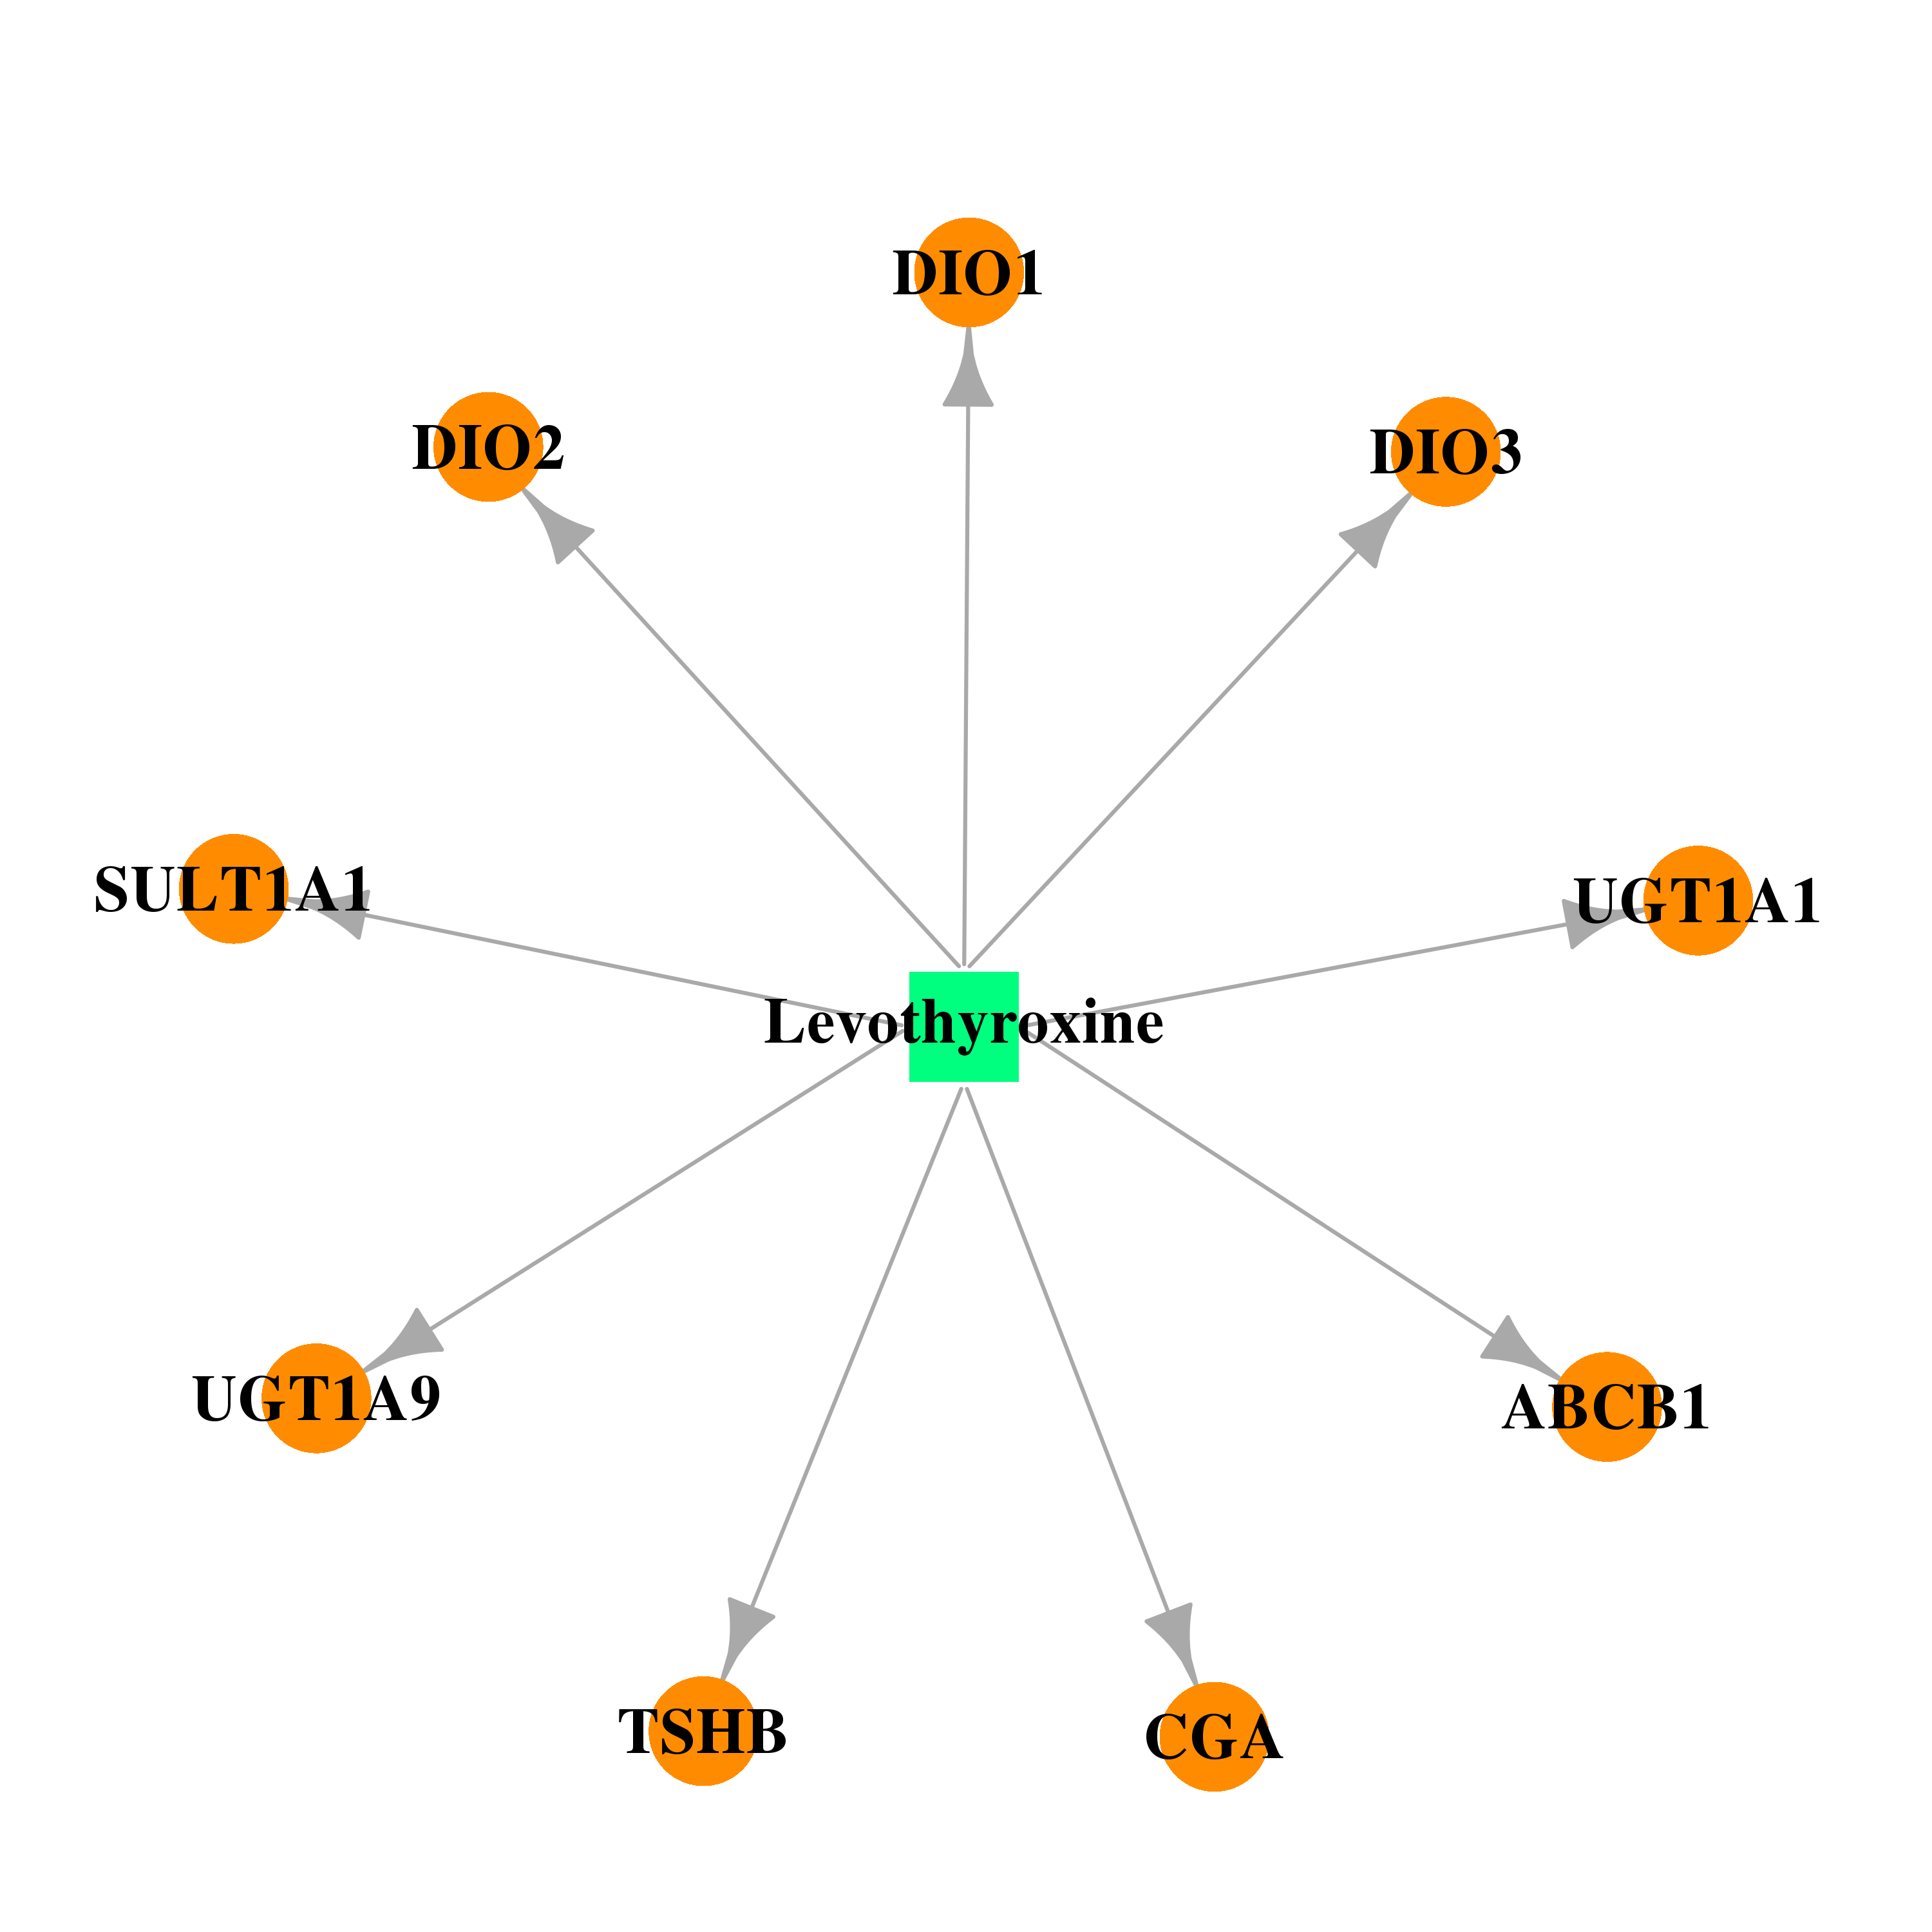 | 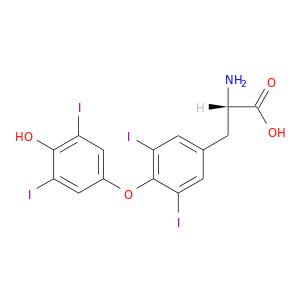 |
| Top |
| Cross referenced IDs for DIO1 |
| * We obtained these cross-references from Uniprot database. It covers 150 different DBs, 18 categories. http://www.uniprot.org/help/cross_references_section |
: Open all cross reference information
|
Copyright © 2016-Present - The Univsersity of Texas Health Science Center at Houston @ |