|
||||||||||||||||||||
| |
| Phenotypic Information (metabolism pathway, cancer, disease, phenome) |
| |
| |
| Gene-Gene Network Information: Co-Expression Network, Interacting Genes & KEGG |
| |
|


| Gene Summary for DLAT |
| Basic gene info. | Gene symbol | DLAT |
| Gene name | dihydrolipoamide S-acetyltransferase | |
| Synonyms | DLTA|PDC-E2|PDCE2 | |
| Cytomap | UCSC genome browser: 11q23.1 | |
| Genomic location | chr11 :111895537-111935002 | |
| Type of gene | protein-coding | |
| RefGenes | NM_001931.4, | |
| Ensembl id | ENSG00000263032 | |
| Description | 70 kDa mitochondrial autoantigen of primary biliary cirrhosisE2 component of pyruvate dehydrogenase complexM2 antigen complex 70 kDa subunitPBCdihydrolipoamide acetyltransferase component of pyruvate dehydrogenase complexdihydrolipoyllysine-residue a | |
| Modification date | 20141207 | |
| dbXrefs | MIM : 608770 | |
| HGNC : HGNC | ||
| Ensembl : ENSG00000150768 | ||
| HPRD : 10578 | ||
| Vega : OTTHUMG00000133751 | ||
| Protein | UniProt: go to UniProt's Cross Reference DB Table | |
| Expression | CleanEX: HS_DLAT | |
| BioGPS: 1737 | ||
| Gene Expression Atlas: ENSG00000263032 | ||
| The Human Protein Atlas: ENSG00000263032 | ||
| Pathway | NCI Pathway Interaction Database: DLAT | |
| KEGG: DLAT | ||
| REACTOME: DLAT | ||
| ConsensusPathDB | ||
| Pathway Commons: DLAT | ||
| Metabolism | MetaCyc: DLAT | |
| HUMANCyc: DLAT | ||
| Regulation | Ensembl's Regulation: ENSG00000263032 | |
| miRBase: chr11 :111,895,537-111,935,002 | ||
| TargetScan: NM_001931 | ||
| cisRED: ENSG00000263032 | ||
| Context | iHOP: DLAT | |
| cancer metabolism search in PubMed: DLAT | ||
| UCL Cancer Institute: DLAT | ||
| Assigned class in ccmGDB | C | |
| Top |
| Phenotypic Information for DLAT(metabolism pathway, cancer, disease, phenome) |
| Cancer | CGAP: DLAT |
| Familial Cancer Database: DLAT | |
| * This gene is included in those cancer gene databases. |
|
|
|
|
|
|
| ||||||||||||||
Oncogene 1 | Significant driver gene in | |||||||||||||||||||
| cf) number; DB name 1 Oncogene; http://nar.oxfordjournals.org/content/35/suppl_1/D721.long, 2 Tumor Suppressor gene; https://bioinfo.uth.edu/TSGene/, 3 Cancer Gene Census; http://www.nature.com/nrc/journal/v4/n3/abs/nrc1299.html, 4 CancerGenes; http://nar.oxfordjournals.org/content/35/suppl_1/D721.long, 5 Network of Cancer Gene; http://ncg.kcl.ac.uk/index.php, 1Therapeutic Vulnerabilities in Cancer; http://cbio.mskcc.org/cancergenomics/statius/ |
| KEGG_GLYCOLYSIS_GLUCONEOGENESIS KEGG_PYRUVATE_METABOLISM REACTOME_PYRUVATE_METABOLISM_AND_CITRIC_ACID_TCA_CYCLE REACTOME_PYRUVATE_METABOLISM | |
| OMIM | |
| Orphanet | |
| Disease | KEGG Disease: DLAT |
| MedGen: DLAT (Human Medical Genetics with Condition) | |
| ClinVar: DLAT | |
| Phenotype | MGI: DLAT (International Mouse Phenotyping Consortium) |
| PhenomicDB: DLAT | |
| Mutations for DLAT |
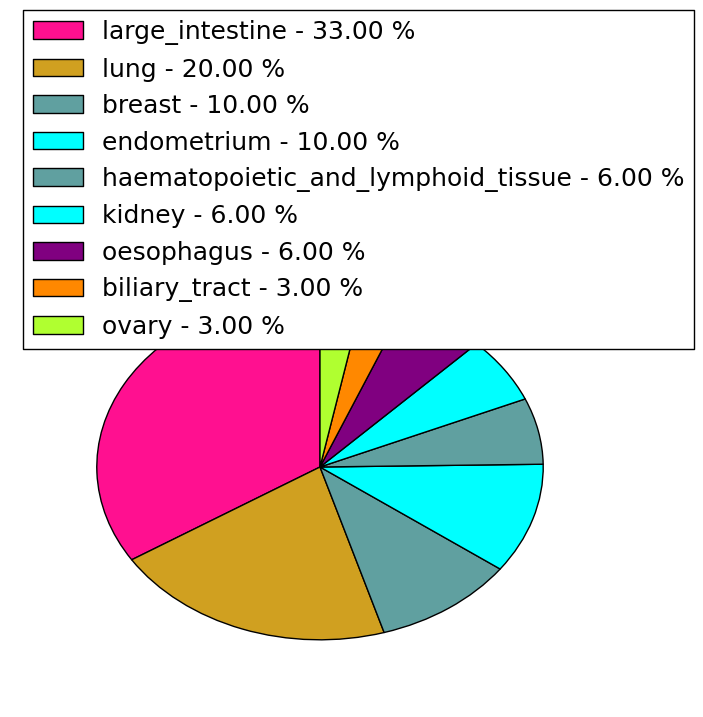
| * Under tables are showing count per each tissue to give us broad intuition about tissue specific mutation patterns.You can go to the detailed page for each mutation database's web site. |
| - Statistics for Tissue and Mutation type | Top |
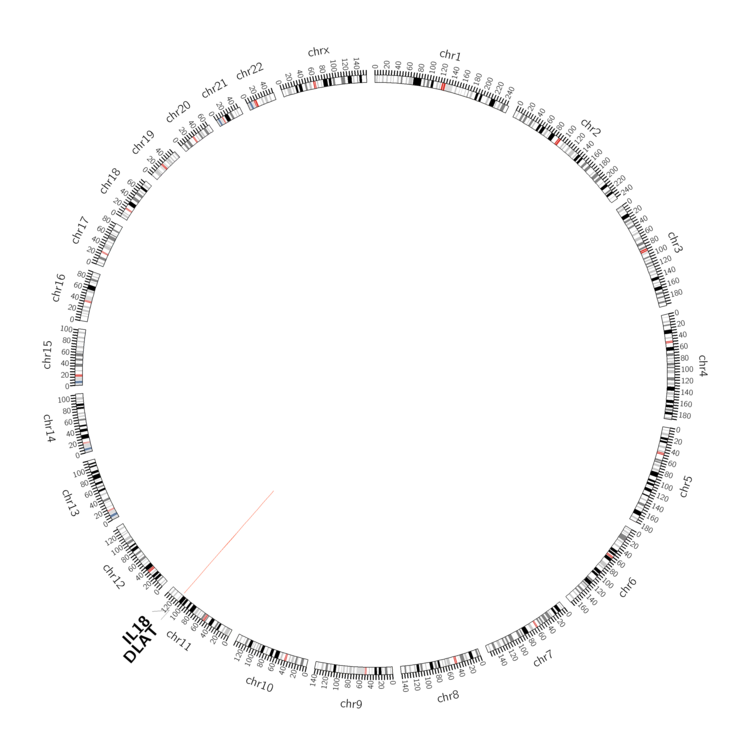 |
| - For Inter-chromosomal Variations |
| There's no inter-chromosomal structural variation. |
| - For Intra-chromosomal Variations |
| * Intra-chromosomal variantions includes 'intrachromosomal amplicon to amplicon', 'intrachromosomal amplicon to non-amplified dna', 'intrachromosomal deletion', 'intrachromosomal fold-back inversion', 'intrachromosomal inversion', 'intrachromosomal tandem duplication', 'Intrachromosomal unknown type', 'intrachromosomal with inverted orientation', 'intrachromosomal with non-inverted orientation'. |
 |
| Sample | Symbol_a | Chr_a | Start_a | End_a | Symbol_b | Chr_b | Start_b | End_b |
| breast | DLAT | chr11 | 111932285 | 111932285 | IL18 | chr11 | 112030719 | 112030719 |
| cf) Tissue number; Tissue name (1;Breast, 2;Central_nervous_system, 3;Haematopoietic_and_lymphoid_tissue, 4;Large_intestine, 5;Liver, 6;Lung, 7;Ovary, 8;Pancreas, 9;Prostate, 10;Skin, 11;Soft_tissue, 12;Upper_aerodigestive_tract) |
| * From mRNA Sanger sequences, Chitars2.0 arranged chimeric transcripts. This table shows DLAT related fusion information. |
| ID | Head Gene | Tail Gene | Accession | Gene_a | qStart_a | qEnd_a | Chromosome_a | tStart_a | tEnd_a | Gene_a | qStart_a | qEnd_a | Chromosome_a | tStart_a | tEnd_a |
| AI022776 | SPTB | 34 | 154 | 14 | 65318952 | 65319074 | DLAT | 149 | 313 | 11 | 111896173 | 111896337 | |
| AL079484 | DLAT | 24 | 97 | 11 | 111933848 | 111933924 | DLAT | 87 | 462 | 11 | 111933916 | 111934296 | |
| H49884 | DLAT | 11 | 189 | 11 | 111896173 | 111896352 | SPTB | 184 | 293 | 14 | 65318966 | 65319074 | |
| Top |
| There's no copy number variation information in COSMIC data for this gene. |
| Top |
|
 |
| Top |
| Stat. for Non-Synonymous SNVs (# total SNVs=30) | (# total SNVs=12) |
 |  |
(# total SNVs=3) | (# total SNVs=1) |
 |  |
| Top |
| * When you move the cursor on each content, you can see more deailed mutation information on the Tooltip. Those are primary_site,primary_histology,mutation(aa),pubmedID. |
| GRCh37 position | Mutation(aa) | Unique sampleID count |
| chr11:111896324-111896324 | p.A43V | 3 |
| chr11:111904183-111904183 | p.E239G | 3 |
| chr11:111896927-111896927 | p.P95P | 3 |
| chr11:111904177-111904177 | p.R237T | 2 |
| chr11:111896360-111896360 | p.V55G | 2 |
| chr11:111899524-111899524 | p.D172A | 2 |
| chr11:111922036-111922036 | p.E493K | 2 |
| chr11:111915910-111915910 | p.P416S | 2 |
| chr11:111899614-111899614 | p.S202L | 2 |
| chr11:111899620-111899620 | p.P204H | 1 |
| Top |
|
 |
| Point Mutation/ Tissue ID | 1 | 2 | 3 | 4 | 5 | 6 | 7 | 8 | 9 | 10 | 11 | 12 | 13 | 14 | 15 | 16 | 17 | 18 | 19 | 20 |
| # sample | 1 | 4 | 1 | 2 | 2 | 6 | 3 | 1 | 4 | 5 | 1 | 4 | ||||||||
| # mutation | 1 | 4 | 1 | 2 | 2 | 8 | 3 | 1 | 4 | 5 | 1 | 4 | ||||||||
| nonsynonymous SNV | 1 | 4 | 1 | 1 | 6 | 1 | 1 | 1 | 5 | 1 | 3 | |||||||||
| synonymous SNV | 1 | 1 | 1 | 2 | 2 | 3 | 1 |
| cf) Tissue ID; Tissue type (1; BLCA[Bladder Urothelial Carcinoma], 2; BRCA[Breast invasive carcinoma], 3; CESC[Cervical squamous cell carcinoma and endocervical adenocarcinoma], 4; COAD[Colon adenocarcinoma], 5; GBM[Glioblastoma multiforme], 6; Glioma Low Grade, 7; HNSC[Head and Neck squamous cell carcinoma], 8; KICH[Kidney Chromophobe], 9; KIRC[Kidney renal clear cell carcinoma], 10; KIRP[Kidney renal papillary cell carcinoma], 11; LAML[Acute Myeloid Leukemia], 12; LUAD[Lung adenocarcinoma], 13; LUSC[Lung squamous cell carcinoma], 14; OV[Ovarian serous cystadenocarcinoma ], 15; PAAD[Pancreatic adenocarcinoma], 16; PRAD[Prostate adenocarcinoma], 17; SKCM[Skin Cutaneous Melanoma], 18:STAD[Stomach adenocarcinoma], 19:THCA[Thyroid carcinoma], 20:UCEC[Uterine Corpus Endometrial Carcinoma]) |
| Top |
| * We represented just top 10 SNVs. When you move the cursor on each content, you can see more deailed mutation information on the Tooltip. Those are primary_site, primary_histology, mutation(aa), pubmedID. |
| Genomic Position | Mutation(aa) | Unique sampleID count |
| chr11:111922036 | p.S202L | 2 |
| chr11:111899614 | p.E493K | 2 |
| chr11:111915933 | p.V34M | 1 |
| chr11:111896296 | p.P359H | 1 |
| chr11:111933176 | p.R621W | 1 |
| chr11:111899661 | p.S38F | 1 |
| chr11:111916646 | p.G369W | 1 |
| chr11:111896309 | p.A57T | 1 |
| chr11:111904183 | p.P401A | 1 |
| chr11:111916693 | p.S80P | 1 |
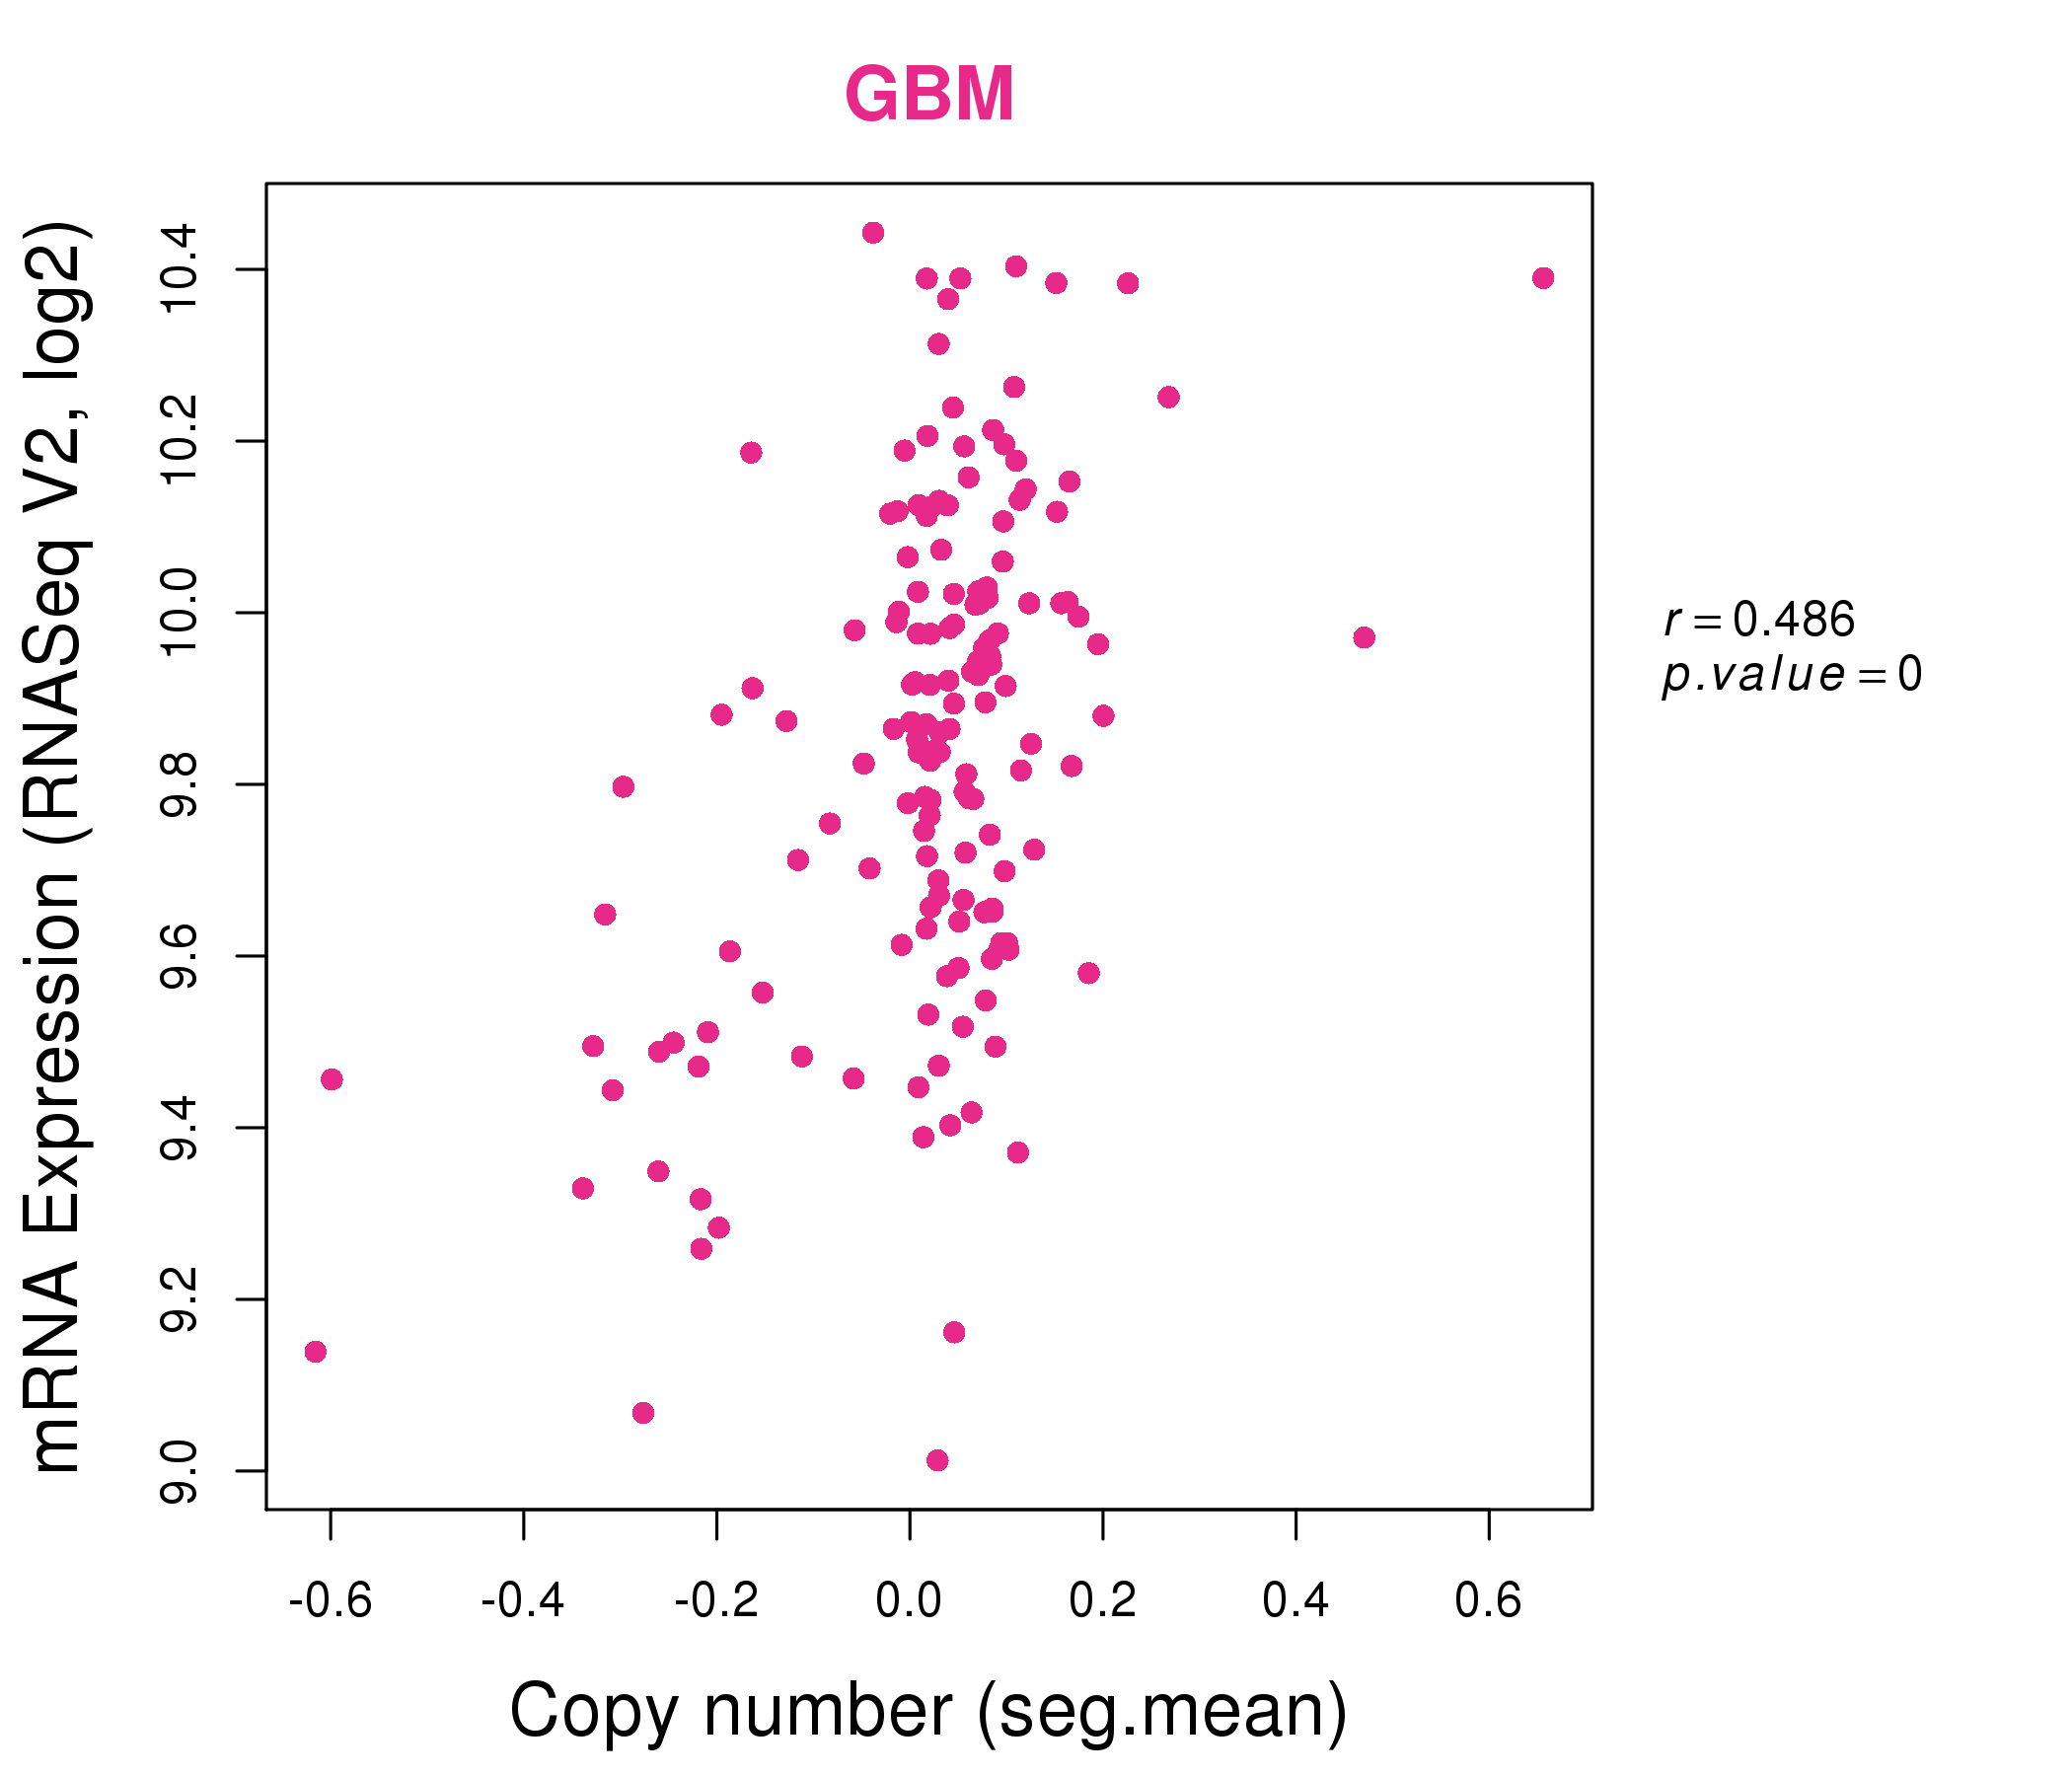
| * Copy number data were extracted from TCGA using R package TCGA-Assembler. The URLs of all public data files on TCGA DCC data server were gathered on Jan-05-2015. Function ProcessCNAData in TCGA-Assembler package was used to obtain gene-level copy number value which is calculated as the average copy number of the genomic region of a gene. |
 |
| cf) Tissue ID[Tissue type]: BLCA[Bladder Urothelial Carcinoma], BRCA[Breast invasive carcinoma], CESC[Cervical squamous cell carcinoma and endocervical adenocarcinoma], COAD[Colon adenocarcinoma], GBM[Glioblastoma multiforme], Glioma Low Grade, HNSC[Head and Neck squamous cell carcinoma], KICH[Kidney Chromophobe], KIRC[Kidney renal clear cell carcinoma], KIRP[Kidney renal papillary cell carcinoma], LAML[Acute Myeloid Leukemia], LUAD[Lung adenocarcinoma], LUSC[Lung squamous cell carcinoma], OV[Ovarian serous cystadenocarcinoma ], PAAD[Pancreatic adenocarcinoma], PRAD[Prostate adenocarcinoma], SKCM[Skin Cutaneous Melanoma], STAD[Stomach adenocarcinoma], THCA[Thyroid carcinoma], UCEC[Uterine Corpus Endometrial Carcinoma] |
| Top |
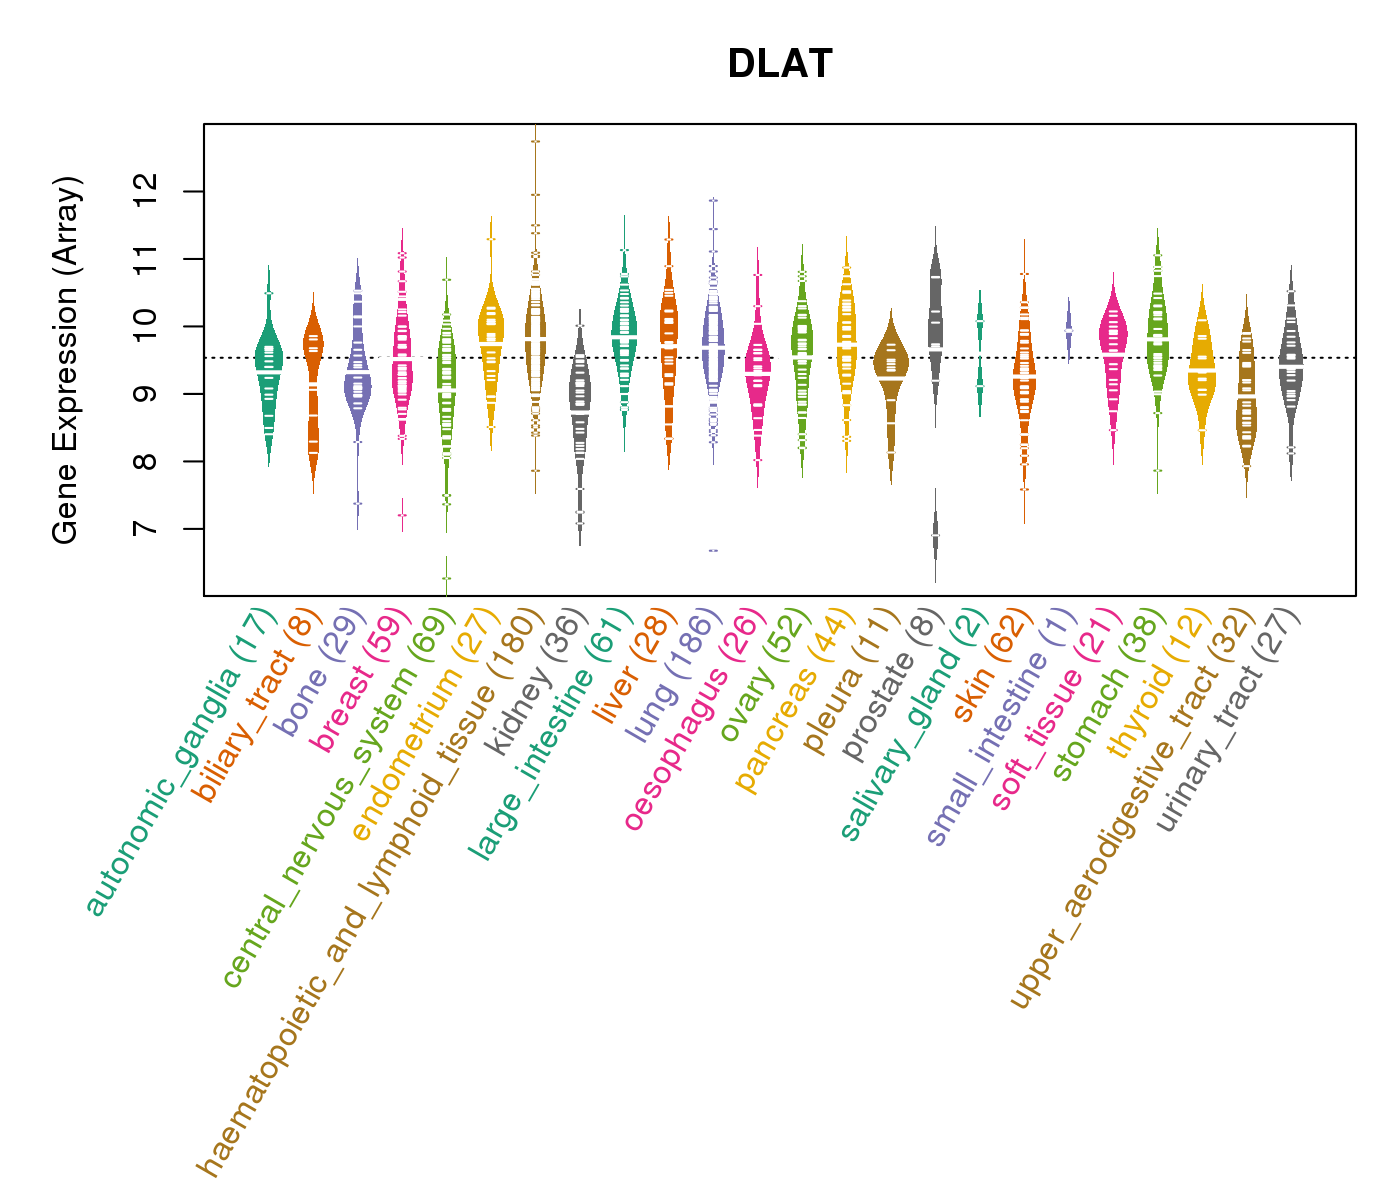
| Gene Expression for DLAT |
| * CCLE gene expression data were extracted from CCLE_Expression_Entrez_2012-10-18.res: Gene-centric RMA-normalized mRNA expression data. |
 |
| * Normalized gene expression data of RNASeqV2 was extracted from TCGA using R package TCGA-Assembler. The URLs of all public data files on TCGA DCC data server were gathered at Jan-05-2015. Only eight cancer types have enough normal control samples for differential expression analysis. (t test, adjusted p<0.05 (using Benjamini-Hochberg FDR)) |
 |
| Top |
| * This plots show the correlation between CNV and gene expression. |
: Open all plots for all cancer types
 |
|
 |
|

| Top |
| Gene-Gene Network Information |
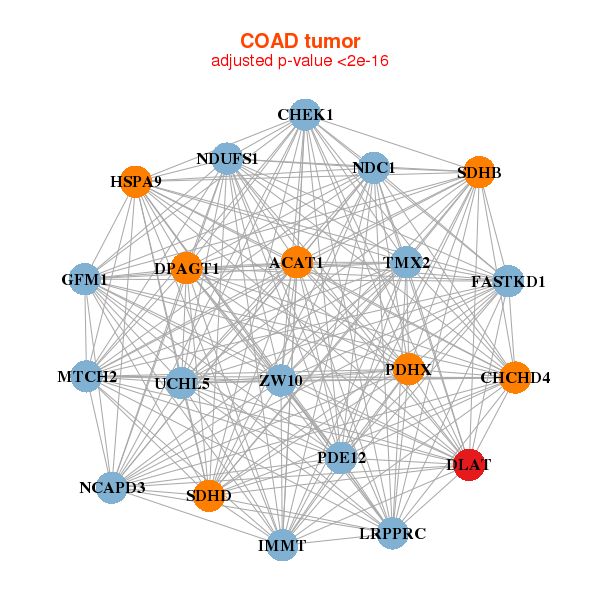
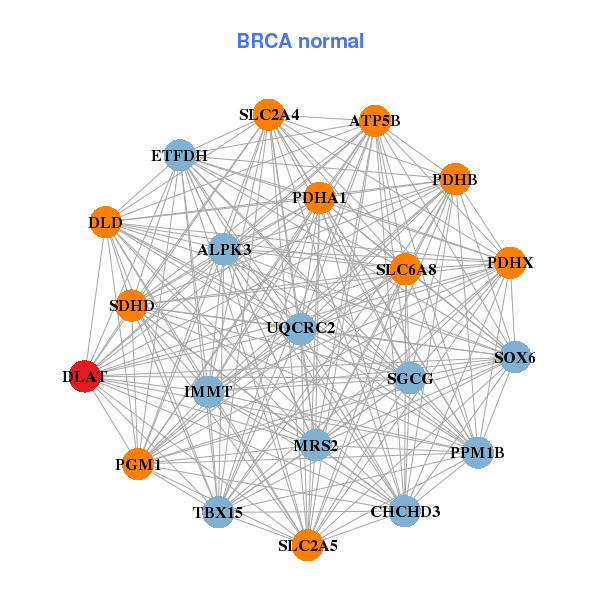
| * Co-Expression network figures were drawn using R package igraph. Only the top 20 genes with the highest correlations were shown. Red circle: input gene, orange circle: cell metabolism gene, sky circle: other gene |
: Open all plots for all cancer types
 |
| ||||
| AASDHPPT,ALG9,ARCN1,C11orf57,CHEK1,CUL5,DDX10, DLAT,EI24,EXPH5,NPAT,PAFAH1B2,RBM7,RDX, RNF214,SDHD,STT3A,TMEM123,UBE4A,USP28,ZW10 | ALPK3,ATP5B,CHCHD3,DLAT,DLD,ETFDH,IMMT, MRS2,PDHA1,PDHB,PDHX,PGM1,PPM1B,SDHD, SGCG,SLC2A4,SLC2A5,SLC6A8,SOX6,TBX15,UQCRC2 | ||||
 |
| ||||
| ACAT1,CHCHD4,CHEK1,DLAT,DPAGT1,FASTKD1,GFM1, HSPA9,IMMT,LRPPRC,MTCH2,NCAPD3,NDUFS1,PDE12, PDHX,SDHB,SDHD,NDC1,TMX2,UCHL5,ZW10 | CENPN,DBF4,DLAT,DPH2,EIF4A3,FAM136A,FARSB, FASTKD1,FH,GOT1,HSPA9,MIPEP,MRPL35,PDHX, PIGW,PPIF,QRSL1,SEH1L,TBRG4,TDG,WDR12 |
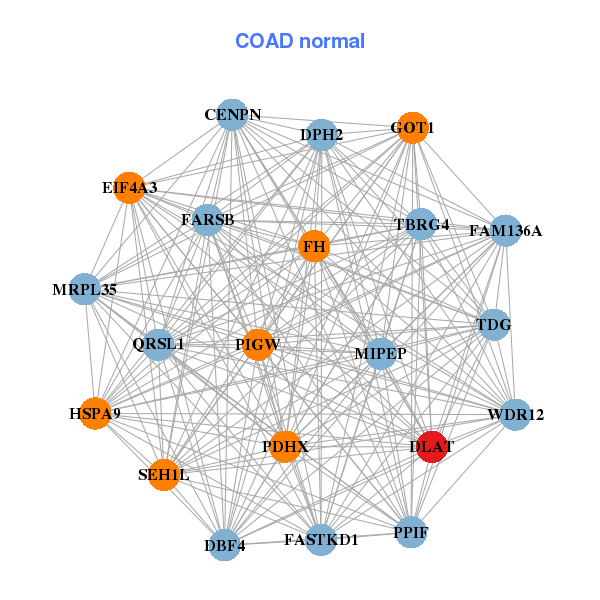
| * Co-Expression network figures were drawn using R package igraph. Only the top 20 genes with the highest correlations were shown. Red circle: input gene, orange circle: cell metabolism gene, sky circle: other gene |
: Open all plots for all cancer types
| Top |
: Open all interacting genes' information including KEGG pathway for all interacting genes from DAVID
| Top |
| Pharmacological Information for DLAT |
| DB Category | DB Name | DB's ID and Url link |
| * Gene Centered Interaction Network. |
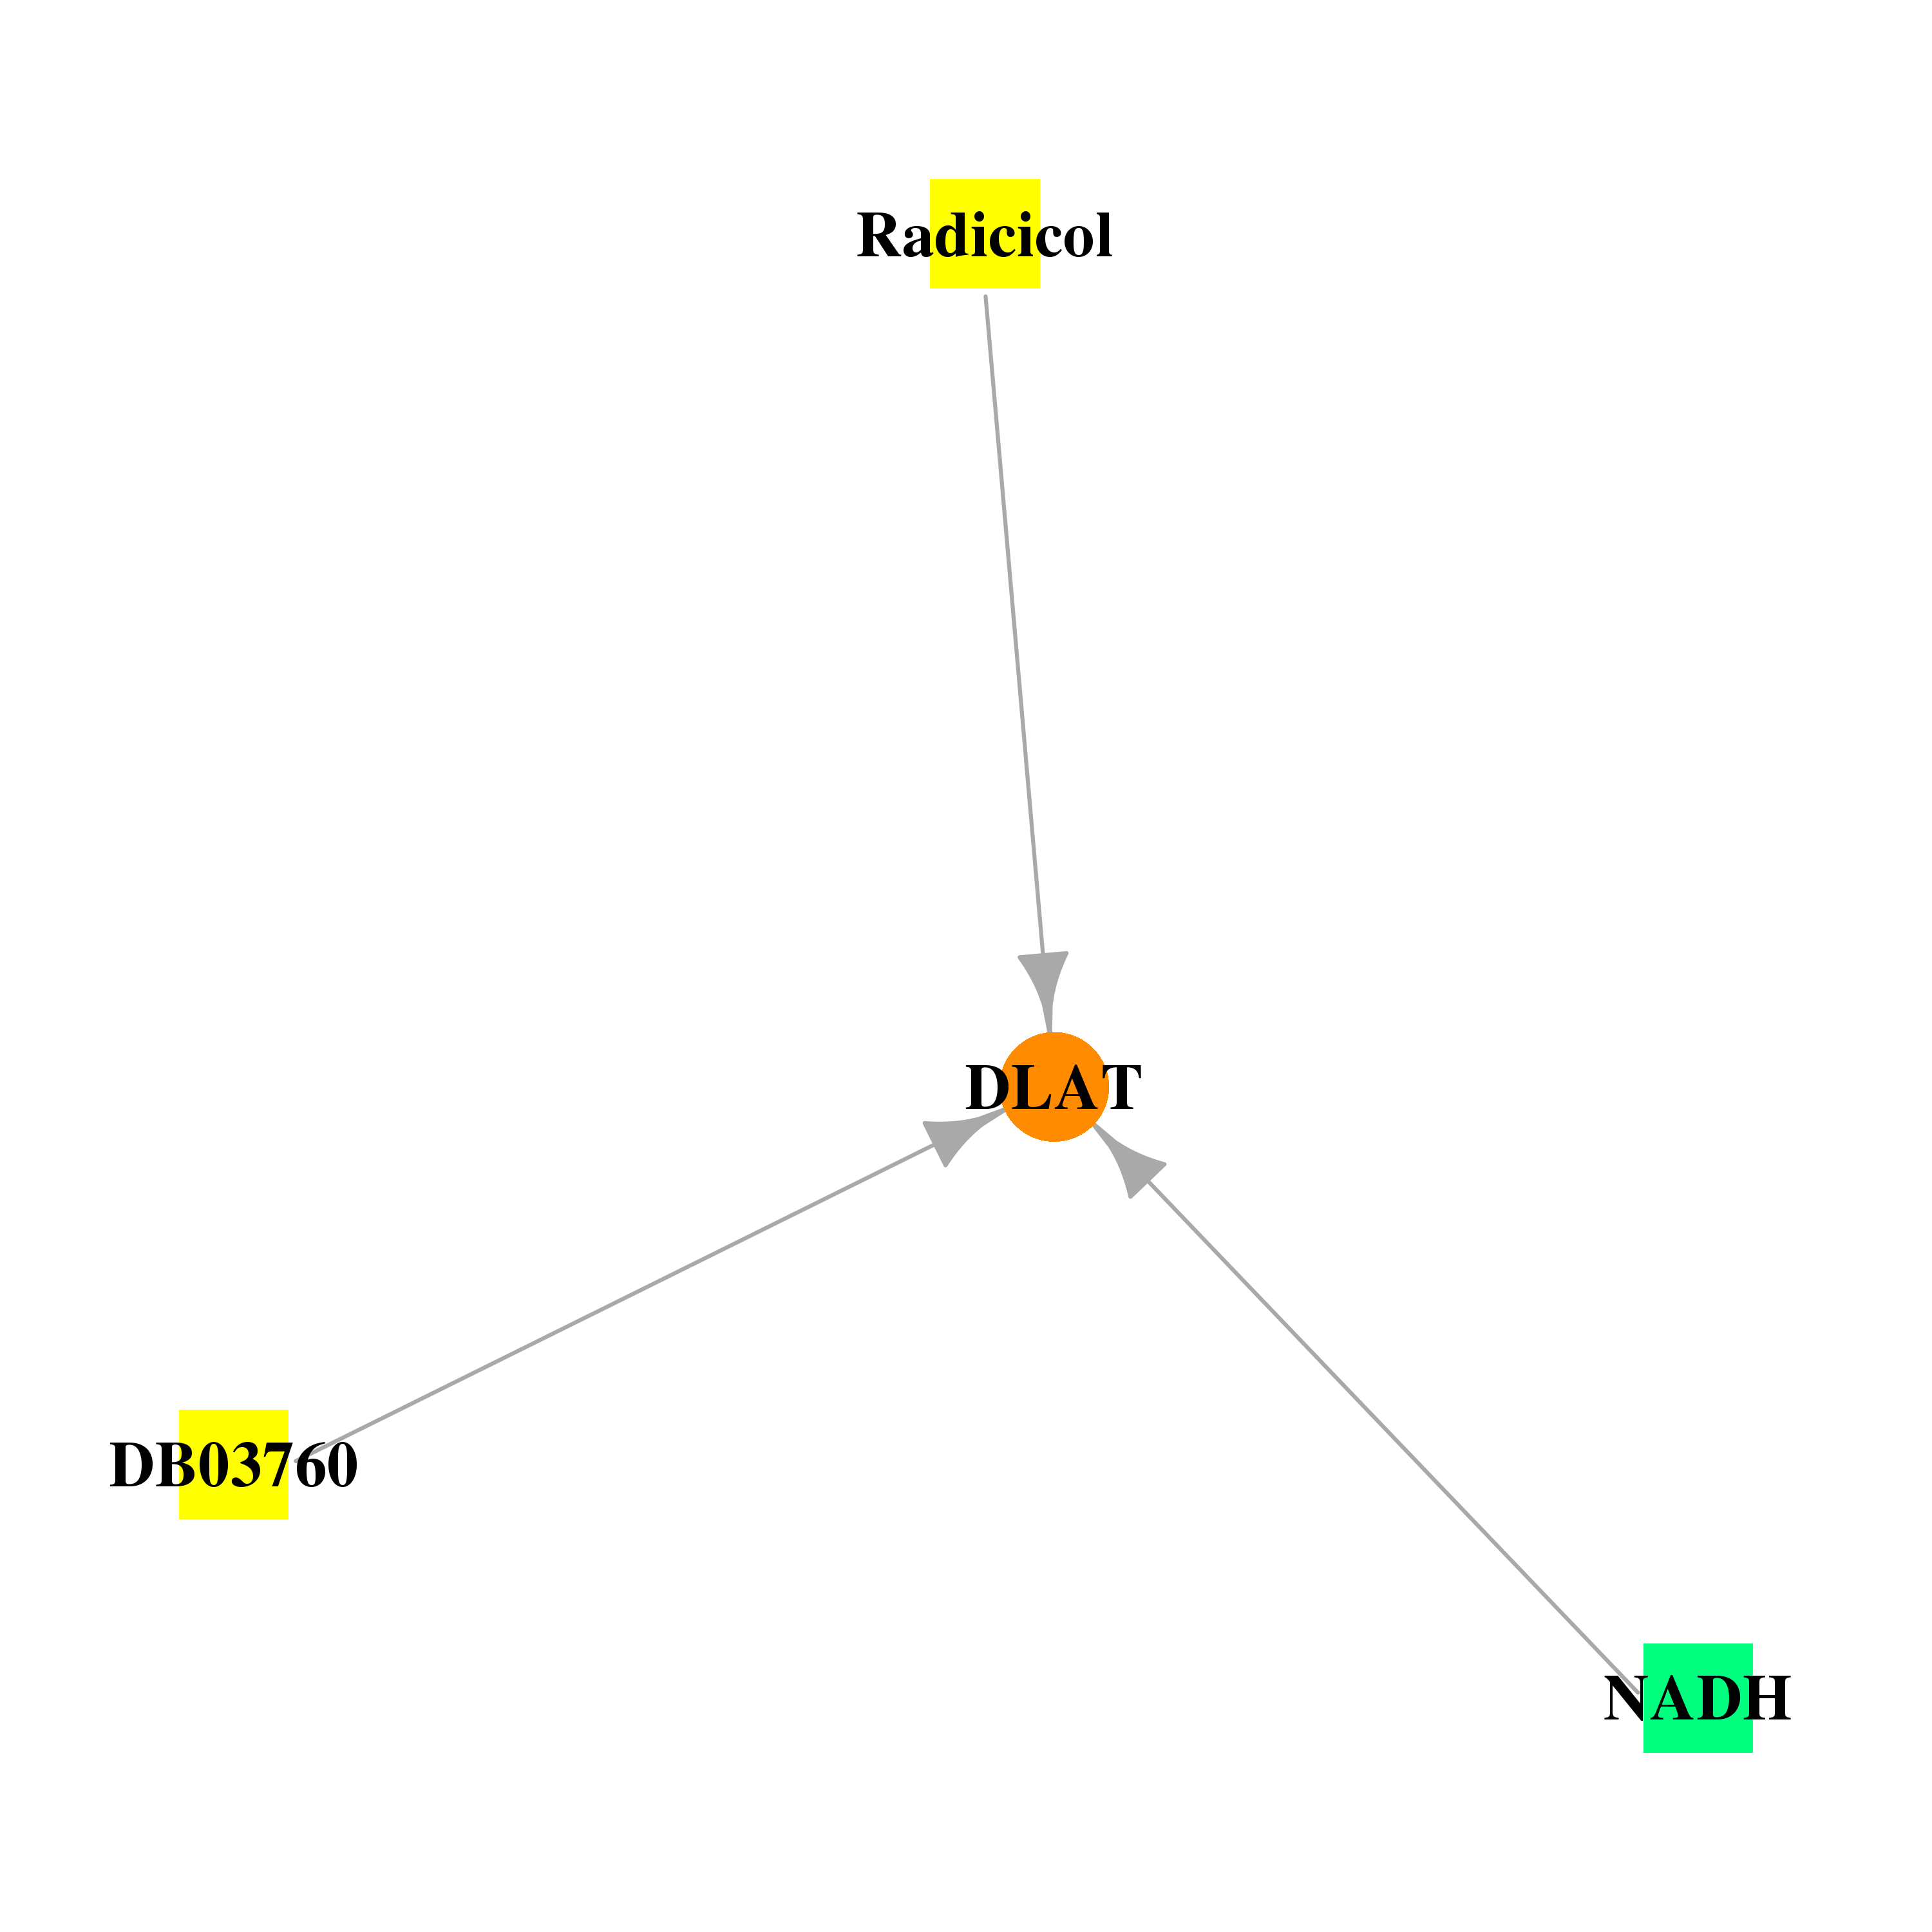 |
| * Drug Centered Interaction Network. |
| DrugBank ID | Target Name | Drug Groups | Generic Name | Drug Centered Network | Drug Structure |
| DB00157 | dihydrolipoamide S-acetyltransferase | approved; nutraceutical | NADH |  |  |
| DB03758 | dihydrolipoamide S-acetyltransferase | experimental | Radicicol | 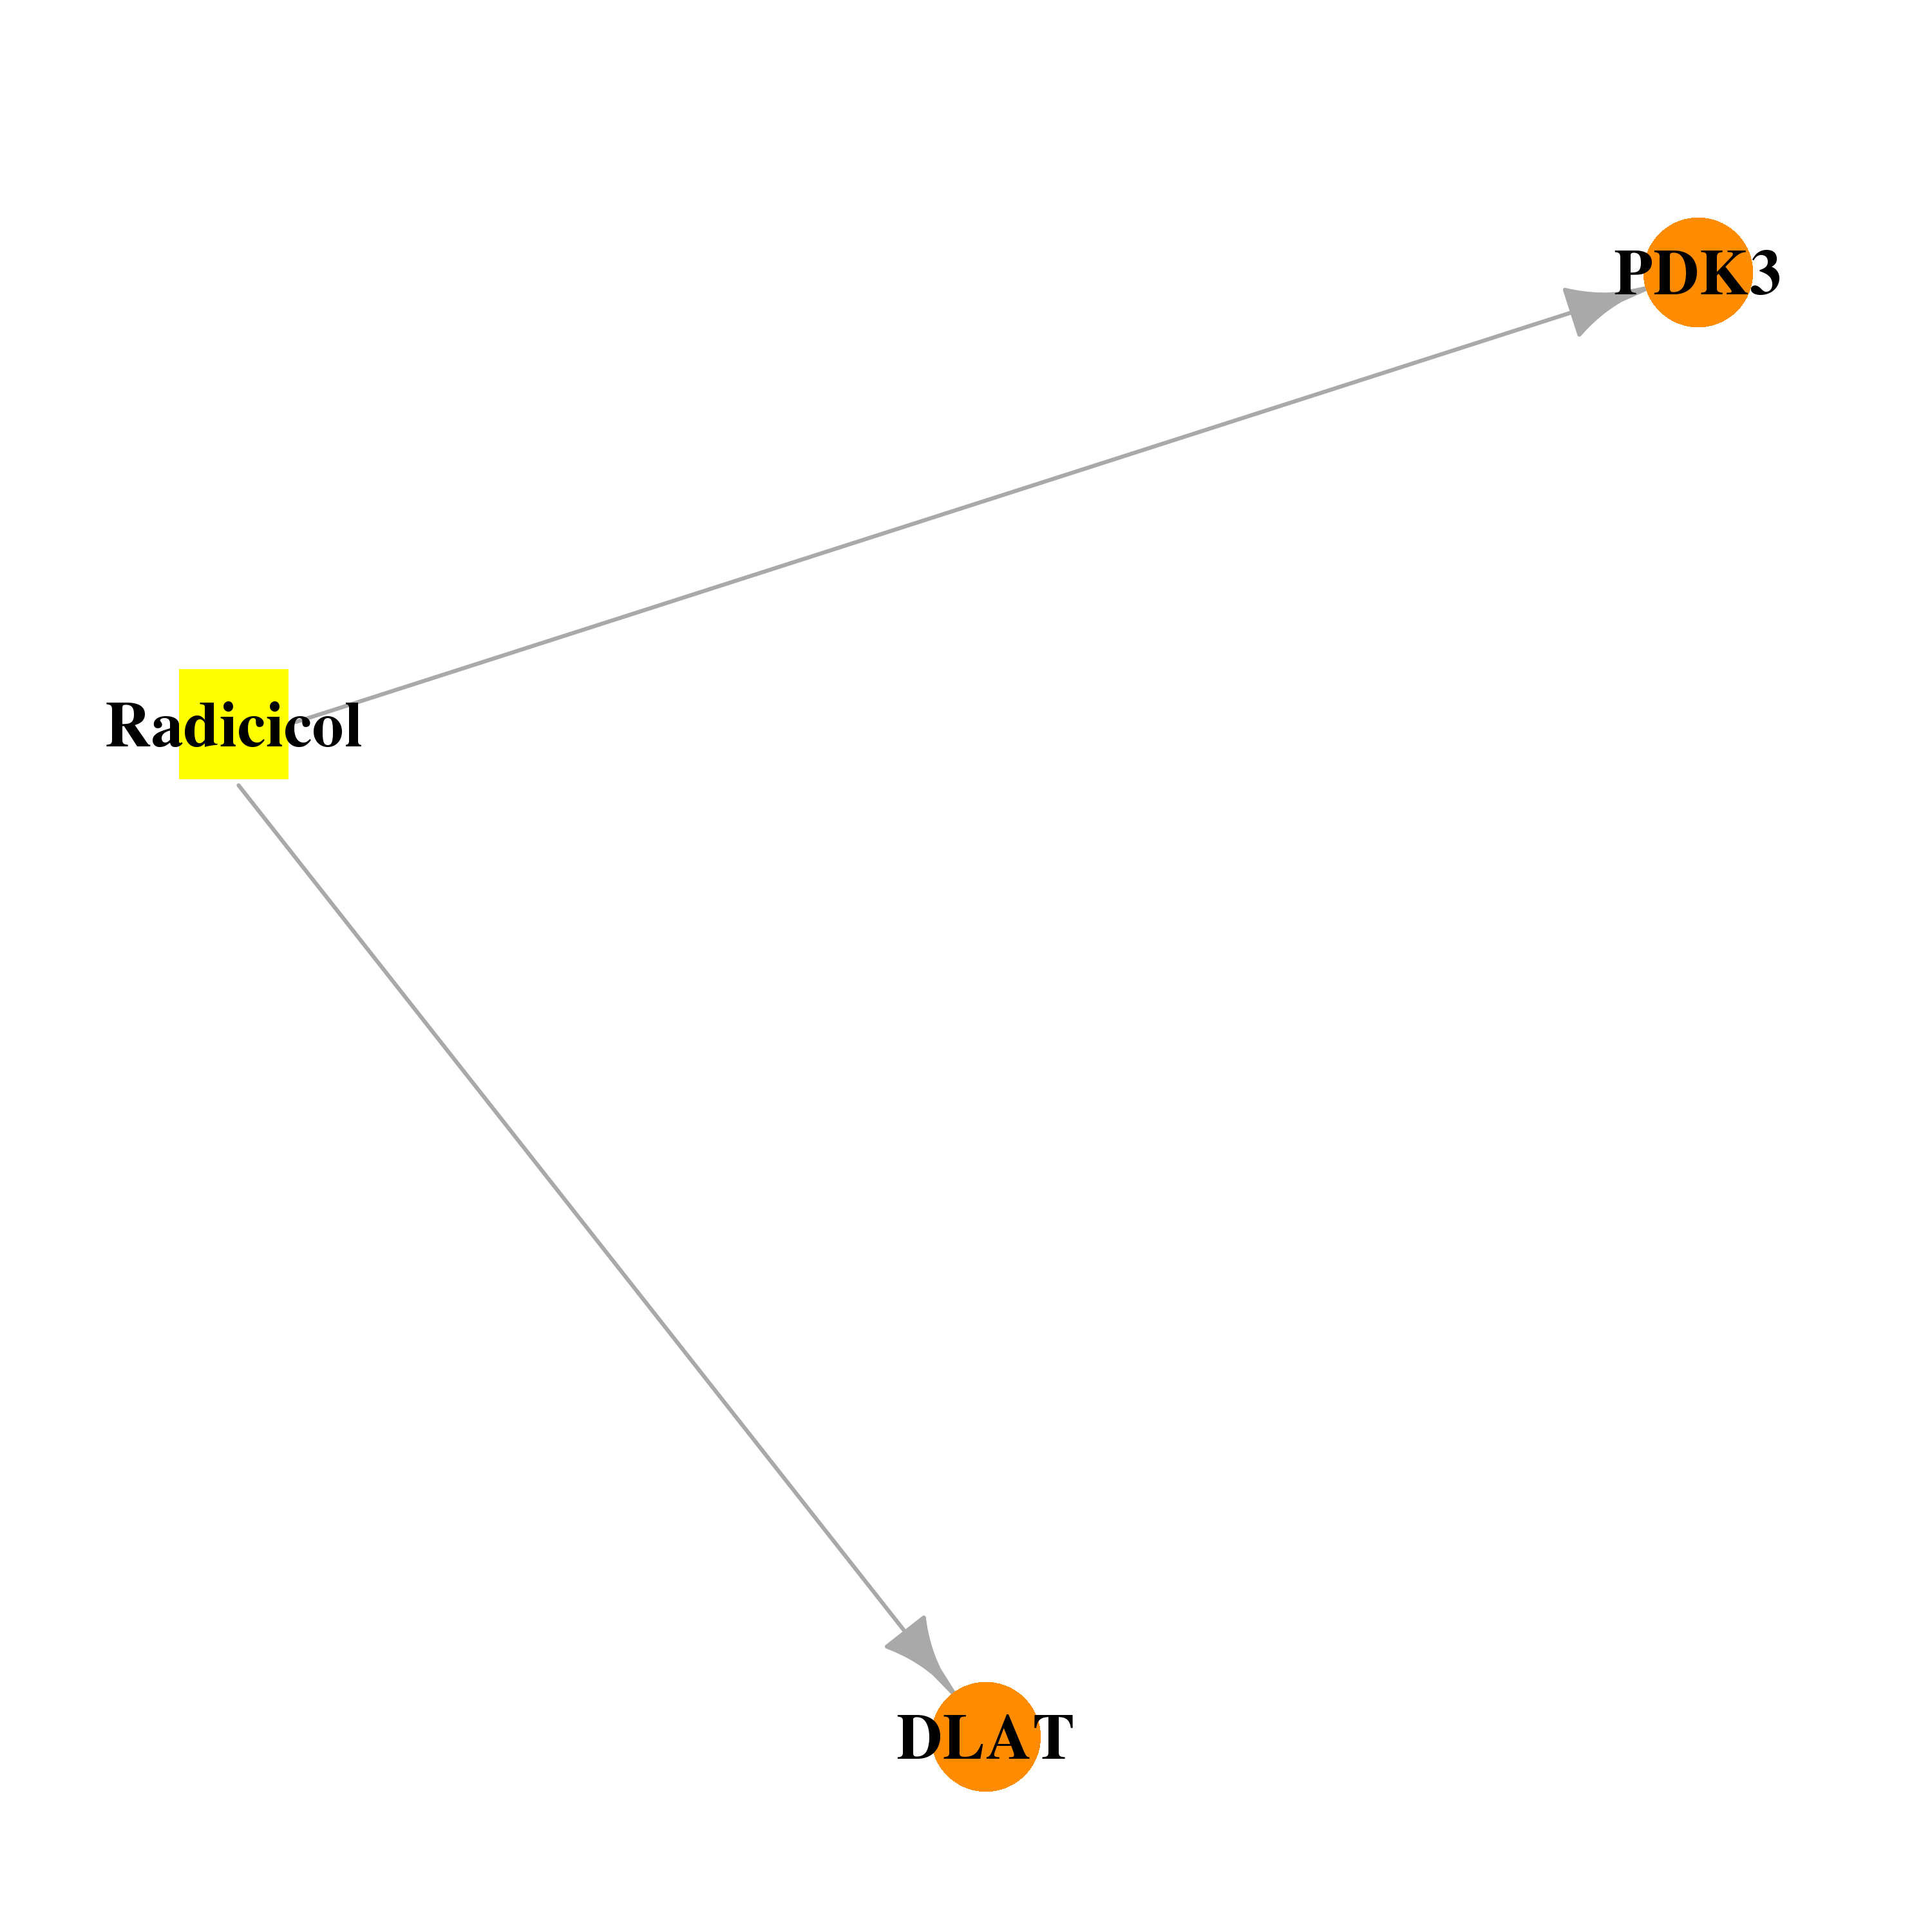 | 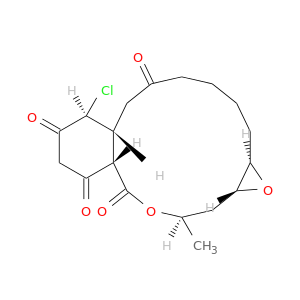 |
| DB03760 | dihydrolipoamide S-acetyltransferase | experimental | Dihydrolipoic Acid | 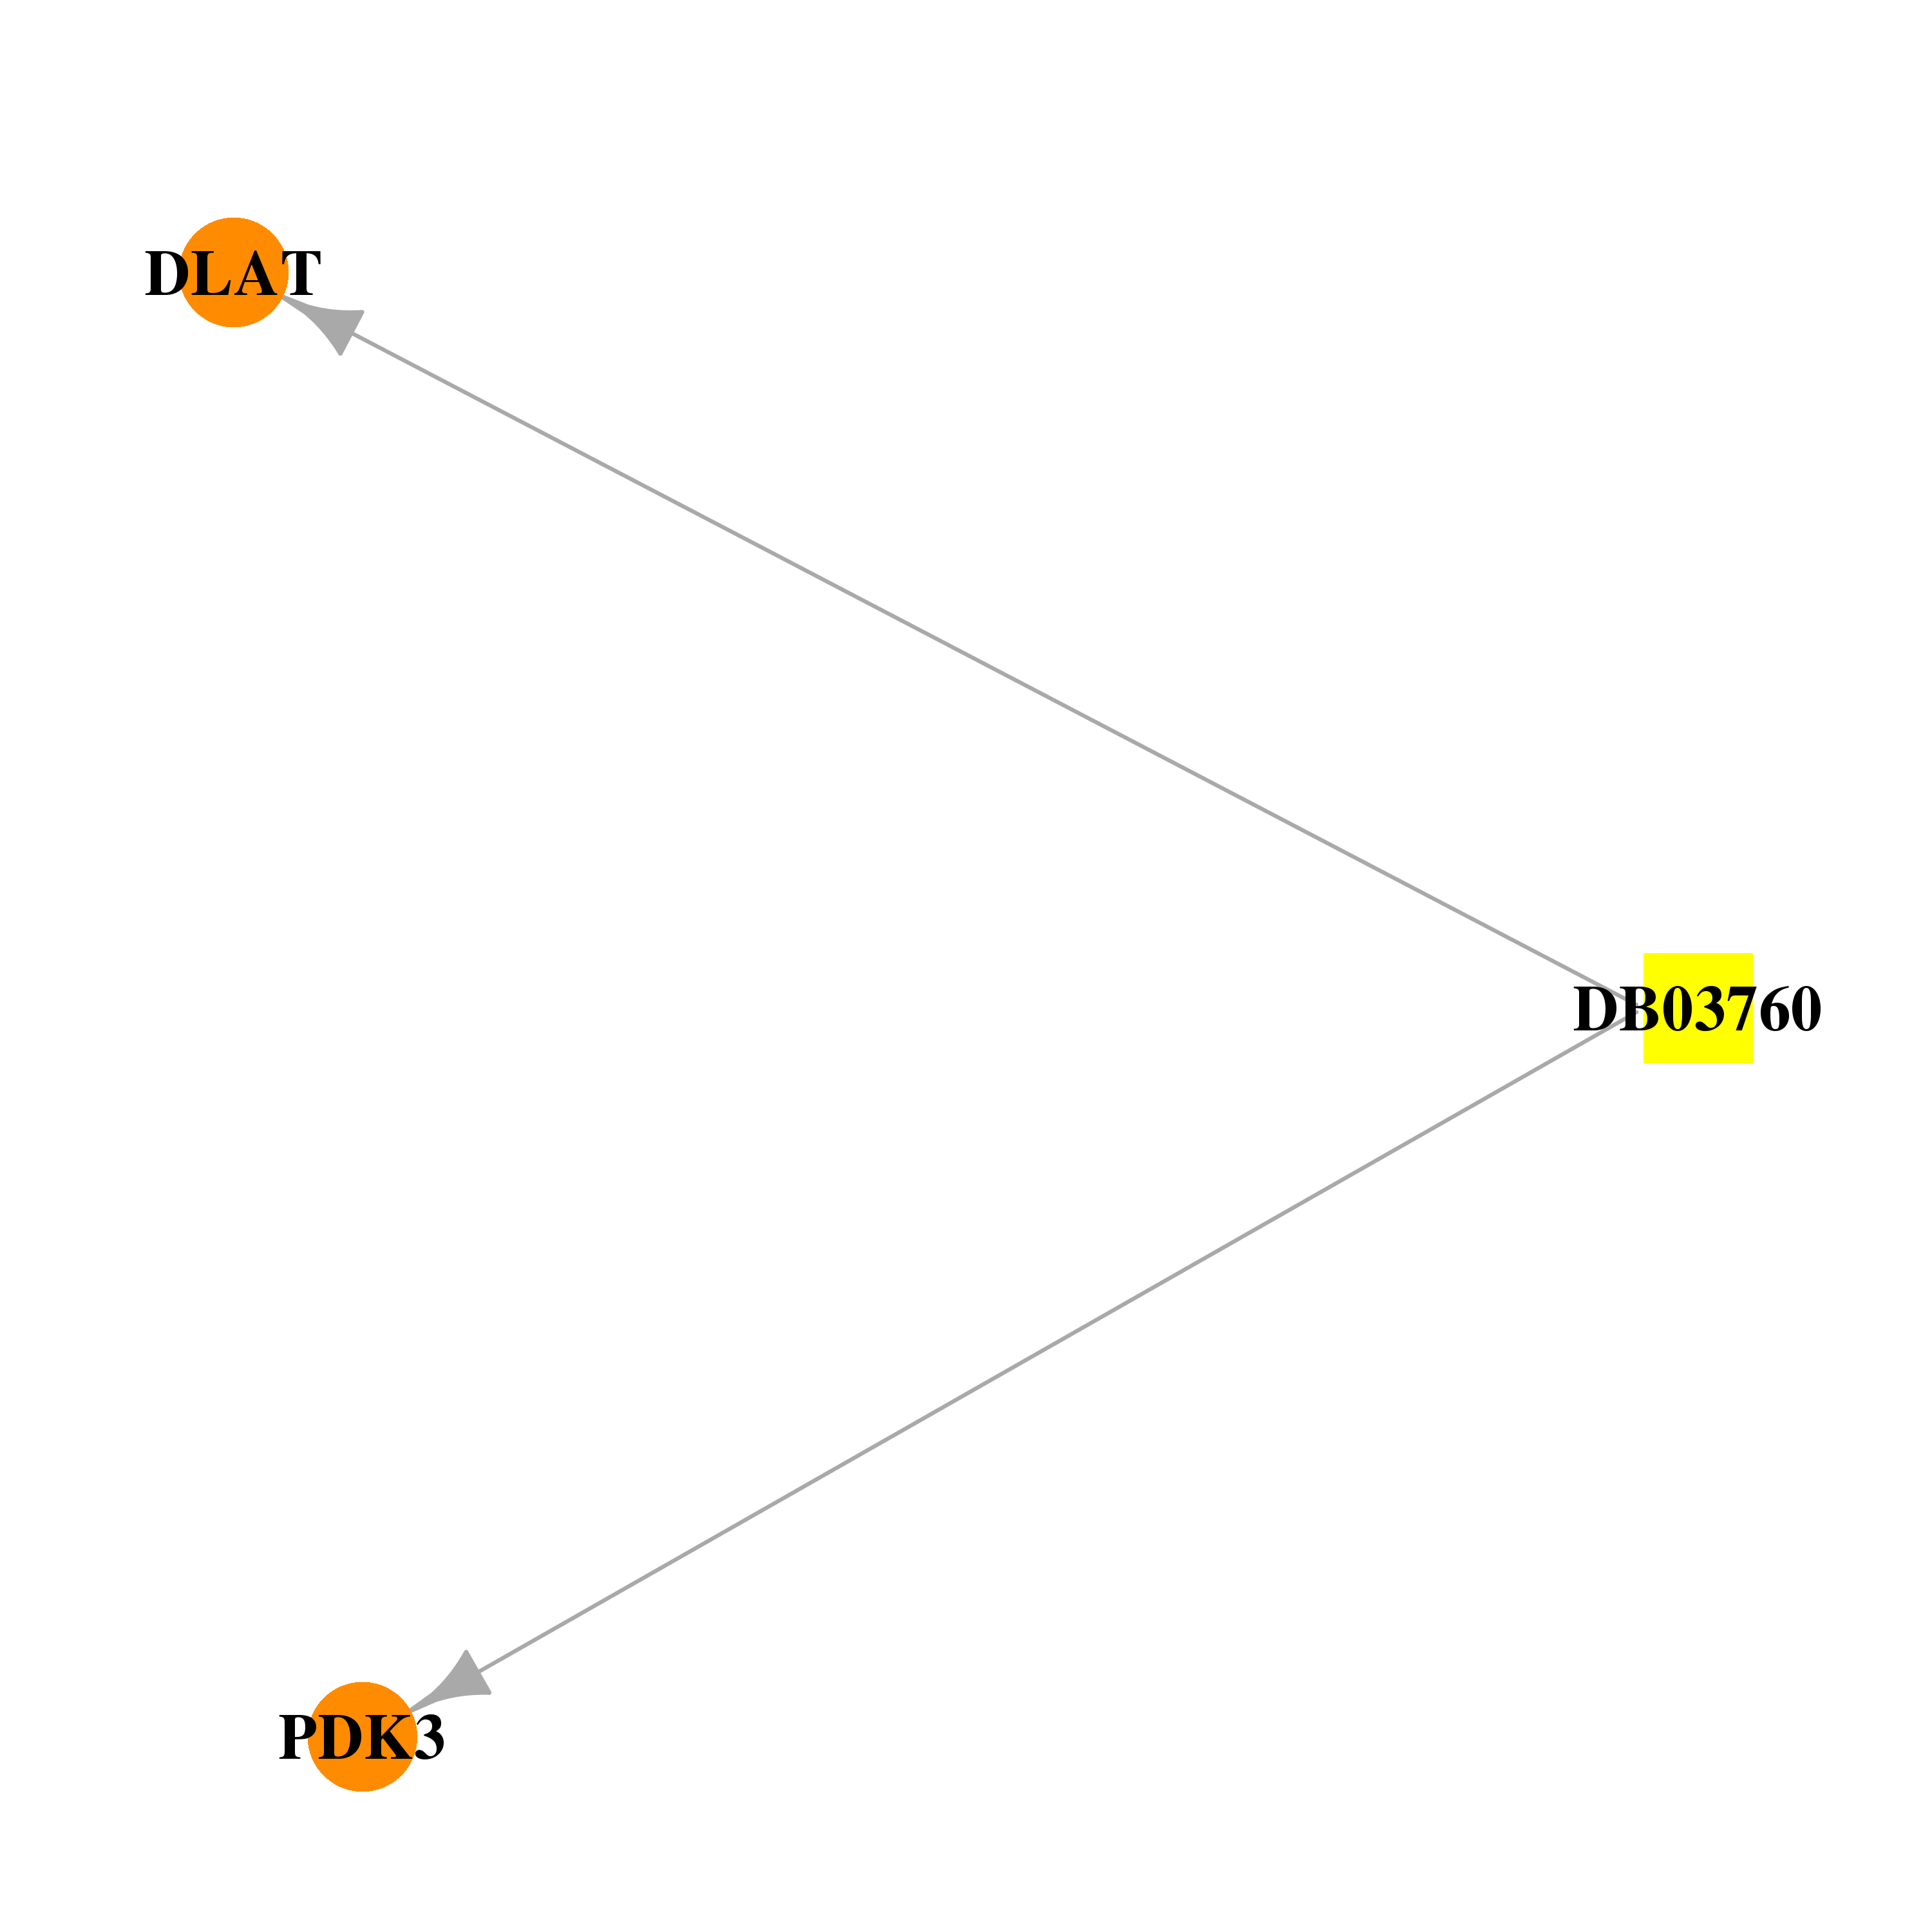 | 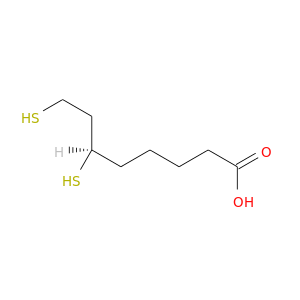 |
| Top |
| Cross referenced IDs for DLAT |
| * We obtained these cross-references from Uniprot database. It covers 150 different DBs, 18 categories. http://www.uniprot.org/help/cross_references_section |
: Open all cross reference information
|
Copyright © 2016-Present - The Univsersity of Texas Health Science Center at Houston @ |