|
|||||||||||||||||||||||||||||||||||||||||||||||||||||||||||||||||||||||||||||||||||||||||||||||||||||||||||||||||||||||||||||||||||||||||||||||||||||||||||||||||||||||||||||||||||||||||||||||||||||||||||||||||||||||||||||||||||||||||||||||||||||||||||||||||||||||||||||||||||||||||||||||||||||||||||||||||||||||||||||||||||||||||||||||||||||||||
| |
| Phenotypic Information (metabolism pathway, cancer, disease, phenome) |
| |
| |
| Gene-Gene Network Information: Co-Expression Network, Interacting Genes & KEGG |
| |
|


| Gene Summary for DLD |
| Basic gene info. | Gene symbol | DLD |
| Gene name | dihydrolipoamide dehydrogenase | |
| Synonyms | DLDD|DLDH|E3|GCSL|LAD|PHE3 | |
| Cytomap | UCSC genome browser: 7q31-q32 | |
| Genomic location | chr7 :107531585-107561643 | |
| Type of gene | protein-coding | |
| RefGenes | NM_000108.4, NM_001289750.1,NM_001289751.1,NM_001289752.1, | |
| Ensembl id | ENSG00000091140 | |
| Description | E3 component of pyruvate dehydrogenase complex, 2-oxo-glutarate complex, branched chain keto acid dehydrogenase complexdiaphorasedihydrolipoyl dehydrogenase, mitochondrialglycine cleavage system L proteinglycine cleavage system protein Llipoamide deh | |
| Modification date | 20141207 | |
| dbXrefs | MIM : 238331 | |
| HGNC : HGNC | ||
| Ensembl : ENSG00000091140 | ||
| HPRD : 02006 | ||
| Vega : OTTHUMG00000154813 | ||
| Protein | UniProt: go to UniProt's Cross Reference DB Table | |
| Expression | CleanEX: HS_DLD | |
| BioGPS: 1738 | ||
| Gene Expression Atlas: ENSG00000091140 | ||
| The Human Protein Atlas: ENSG00000091140 | ||
| Pathway | NCI Pathway Interaction Database: DLD | |
| KEGG: DLD | ||
| REACTOME: DLD | ||
| ConsensusPathDB | ||
| Pathway Commons: DLD | ||
| Metabolism | MetaCyc: DLD | |
| HUMANCyc: DLD | ||
| Regulation | Ensembl's Regulation: ENSG00000091140 | |
| miRBase: chr7 :107,531,585-107,561,643 | ||
| TargetScan: NM_000108 | ||
| cisRED: ENSG00000091140 | ||
| Context | iHOP: DLD | |
| cancer metabolism search in PubMed: DLD | ||
| UCL Cancer Institute: DLD | ||
| Assigned class in ccmGDB | C | |
| Top |
| Phenotypic Information for DLD(metabolism pathway, cancer, disease, phenome) |
| Cancer | CGAP: DLD |
| Familial Cancer Database: DLD | |
| * This gene is included in those cancer gene databases. |
|
|
|
|
|
|
| |||||||||||||||||||||||||||||||||||||||||||||||||||||||||||||||||||||||||||||||||||||||||||||||||||||||||||||||||||||||||||||||||||||||||||||||||||||||||||||||||||||||||||||||||||||||||||||||||||||||||||||||||||||||||||||||||||||||||||||||||||||||||||||||||||||||||||||||||||||||||||||||||||||||||||||||||||||||||||||||||||||||||||||||||||
Oncogene 1 | Significant driver gene in | ||||||||||||||||||||||||||||||||||||||||||||||||||||||||||||||||||||||||||||||||||||||||||||||||||||||||||||||||||||||||||||||||||||||||||||||||||||||||||||||||||||||||||||||||||||||||||||||||||||||||||||||||||||||||||||||||||||||||||||||||||||||||||||||||||||||||||||||||||||||||||||||||||||||||||||||||||||||||||||||||||||||||||||||||||||||||
| cf) number; DB name 1 Oncogene; http://nar.oxfordjournals.org/content/35/suppl_1/D721.long, 2 Tumor Suppressor gene; https://bioinfo.uth.edu/TSGene/, 3 Cancer Gene Census; http://www.nature.com/nrc/journal/v4/n3/abs/nrc1299.html, 4 CancerGenes; http://nar.oxfordjournals.org/content/35/suppl_1/D721.long, 5 Network of Cancer Gene; http://ncg.kcl.ac.uk/index.php, 1Therapeutic Vulnerabilities in Cancer; http://cbio.mskcc.org/cancergenomics/statius/ |
| KEGG_GLYCOLYSIS_GLUCONEOGENESIS KEGG_GLYCINE_SERINE_AND_THREONINE_METABOLISM KEGG_PYRUVATE_METABOLISM REACTOME_PYRUVATE_METABOLISM_AND_CITRIC_ACID_TCA_CYCLE REACTOME_METABOLISM_OF_AMINO_ACIDS_AND_DERIVATIVES REACTOME_PYRUVATE_METABOLISM | |
| OMIM | |
| Orphanet | |
| Disease | KEGG Disease: DLD |
| MedGen: DLD (Human Medical Genetics with Condition) | |
| ClinVar: DLD | |
| Phenotype | MGI: DLD (International Mouse Phenotyping Consortium) |
| PhenomicDB: DLD | |
| Mutations for DLD |
| * Under tables are showing count per each tissue to give us broad intuition about tissue specific mutation patterns.You can go to the detailed page for each mutation database's web site. |
| - Statistics for Tissue and Mutation type | Top |
 |
| - For Inter-chromosomal Variations |
| There's no inter-chromosomal structural variation. |
| - For Intra-chromosomal Variations |
| * Intra-chromosomal variantions includes 'intrachromosomal amplicon to amplicon', 'intrachromosomal amplicon to non-amplified dna', 'intrachromosomal deletion', 'intrachromosomal fold-back inversion', 'intrachromosomal inversion', 'intrachromosomal tandem duplication', 'Intrachromosomal unknown type', 'intrachromosomal with inverted orientation', 'intrachromosomal with non-inverted orientation'. |
 |
| Sample | Symbol_a | Chr_a | Start_a | End_a | Symbol_b | Chr_b | Start_b | End_b |
| breast | DLD | chr7 | 107535122 | 107535122 | NRCAM | chr7 | 107818574 | 107818574 |
| ovary | DLD | chr7 | 107551266 | 107551286 | chr7 | 107374232 | 107374252 |
| cf) Tissue number; Tissue name (1;Breast, 2;Central_nervous_system, 3;Haematopoietic_and_lymphoid_tissue, 4;Large_intestine, 5;Liver, 6;Lung, 7;Ovary, 8;Pancreas, 9;Prostate, 10;Skin, 11;Soft_tissue, 12;Upper_aerodigestive_tract) |
| * From mRNA Sanger sequences, Chitars2.0 arranged chimeric transcripts. This table shows DLD related fusion information. |
| ID | Head Gene | Tail Gene | Accession | Gene_a | qStart_a | qEnd_a | Chromosome_a | tStart_a | tEnd_a | Gene_a | qStart_a | qEnd_a | Chromosome_a | tStart_a | tEnd_a |
| CV348467 | IKBKB | 1 | 314 | 8 | 42181155 | 42181470 | DLD | 304 | 497 | 7 | 107557272 | 107557773 | |
| BG952037 | DLD | 9 | 114 | 7 | 107560077 | 107560184 | SURF4 | 102 | 298 | 9 | 136228391 | 136228587 | |
| Top |
| Mutation type/ Tissue ID | brca | cns | cerv | endome | haematopo | kidn | Lintest | liver | lung | ns | ovary | pancre | prost | skin | stoma | thyro | urina | |||
| Total # sample | 1 | |||||||||||||||||||
| GAIN (# sample) | 1 | |||||||||||||||||||
| LOSS (# sample) |
| cf) Tissue ID; Tissue type (1; Breast, 2; Central_nervous_system, 3; Cervix, 4; Endometrium, 5; Haematopoietic_and_lymphoid_tissue, 6; Kidney, 7; Large_intestine, 8; Liver, 9; Lung, 10; NS, 11; Ovary, 12; Pancreas, 13; Prostate, 14; Skin, 15; Stomach, 16; Thyroid, 17; Urinary_tract) |
| Top |
|
 |
| Top |
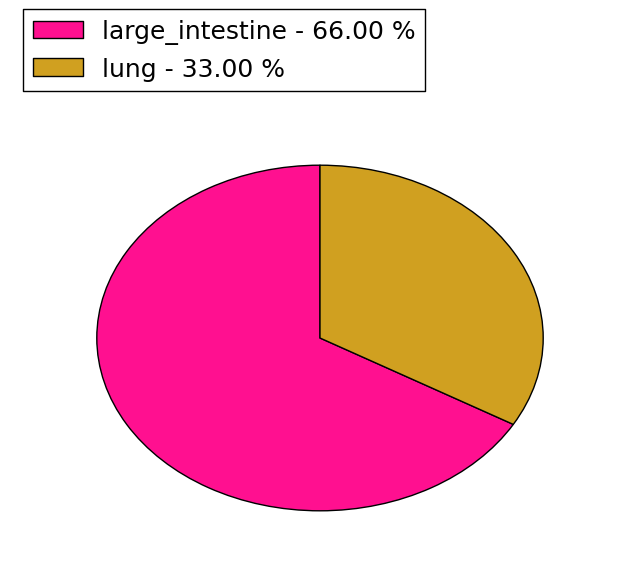
| Stat. for Non-Synonymous SNVs (# total SNVs=33) | (# total SNVs=7) |
 | 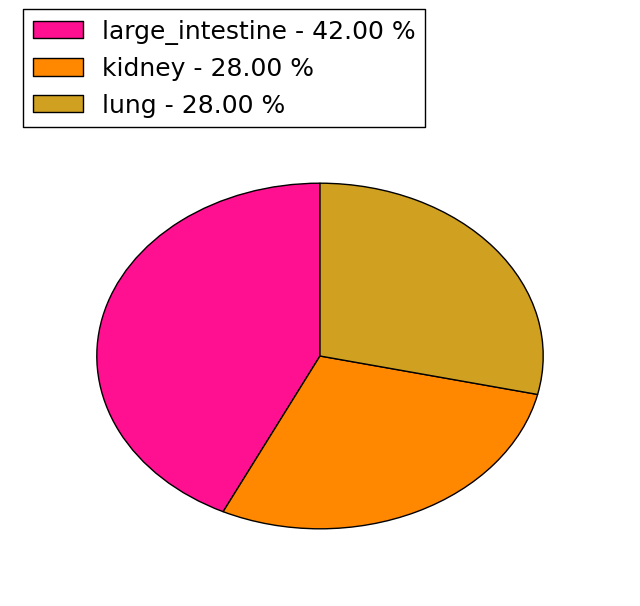 |
(# total SNVs=3) | (# total SNVs=0) |
 |
| Top |
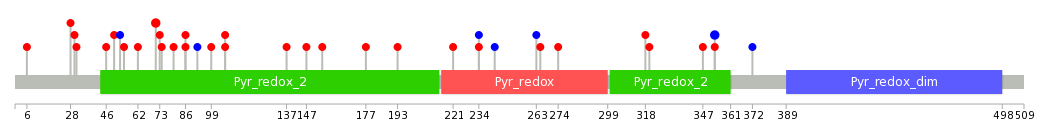
| * When you move the cursor on each content, you can see more deailed mutation information on the Tooltip. Those are primary_site,primary_histology,mutation(aa),pubmedID. |
| GRCh37 position | Mutation(aa) | Unique sampleID count |
| chr7:107557813-107557813 | p.A381D | 3 |
| chr7:107557346-107557346 | p.G328E | 2 |
| chr7:107558487-107558487 | p.G452A | 2 |
| chr7:107545876-107545876 | p.G170D | 2 |
| chr7:107558488-107558488 | p.G452G | 2 |
| chr7:107557721-107557721 | p.I350M | 2 |
| chr7:107557761-107557761 | p.H364Y | 2 |
| chr7:107545502-107545502 | p.K146M | 1 |
| chr7:107557860-107557860 | p.P397S | 1 |
| chr7:107546721-107546721 | p.D198N | 1 |
| Top |
|
 |
| Point Mutation/ Tissue ID | 1 | 2 | 3 | 4 | 5 | 6 | 7 | 8 | 9 | 10 | 11 | 12 | 13 | 14 | 15 | 16 | 17 | 18 | 19 | 20 |
| # sample | 1 | 1 | 1 | 5 | 2 | 3 | 1 | 1 | 9 | 2 | 2 | 4 | 4 | |||||||
| # mutation | 1 | 1 | 1 | 4 | 2 | 5 | 1 | 1 | 10 | 2 | 2 | 4 | 4 | |||||||
| nonsynonymous SNV | 1 | 1 | 1 | 2 | 2 | 4 | 1 | 1 | 8 | 1 | 2 | 3 | 4 | |||||||
| synonymous SNV | 2 | 1 | 2 | 1 | 1 |
| cf) Tissue ID; Tissue type (1; BLCA[Bladder Urothelial Carcinoma], 2; BRCA[Breast invasive carcinoma], 3; CESC[Cervical squamous cell carcinoma and endocervical adenocarcinoma], 4; COAD[Colon adenocarcinoma], 5; GBM[Glioblastoma multiforme], 6; Glioma Low Grade, 7; HNSC[Head and Neck squamous cell carcinoma], 8; KICH[Kidney Chromophobe], 9; KIRC[Kidney renal clear cell carcinoma], 10; KIRP[Kidney renal papillary cell carcinoma], 11; LAML[Acute Myeloid Leukemia], 12; LUAD[Lung adenocarcinoma], 13; LUSC[Lung squamous cell carcinoma], 14; OV[Ovarian serous cystadenocarcinoma ], 15; PAAD[Pancreatic adenocarcinoma], 16; PRAD[Prostate adenocarcinoma], 17; SKCM[Skin Cutaneous Melanoma], 18:STAD[Stomach adenocarcinoma], 19:THCA[Thyroid carcinoma], 20:UCEC[Uterine Corpus Endometrial Carcinoma]) |
| Top |
| * We represented just top 10 SNVs. When you move the cursor on each content, you can see more deailed mutation information on the Tooltip. Those are primary_site, primary_histology, mutation(aa), pubmedID. |
| Genomic Position | Mutation(aa) | Unique sampleID count |
| chr7:107545876 | p.G71D,DLD | 2 |
| chr7:107558488 | p.G353G,DLD | 2 |
| chr7:107545882 | p.I86T,DLD | 1 |
| chr7:107557360 | p.T177K,DLD | 1 |
| chr7:107542792 | p.I86M,DLD | 1 |
| chr7:107559493 | p.S193F,DLD | 1 |
| chr7:107545940 | p.D6Y,DLD | 1 |
| chr7:107557362 | p.K221M,DLD | 1 |
| chr7:107542810 | p.A31E,DLD | 1 |
| chr7:107546721 | p.P234S,DLD | 1 |
| * Copy number data were extracted from TCGA using R package TCGA-Assembler. The URLs of all public data files on TCGA DCC data server were gathered on Jan-05-2015. Function ProcessCNAData in TCGA-Assembler package was used to obtain gene-level copy number value which is calculated as the average copy number of the genomic region of a gene. |
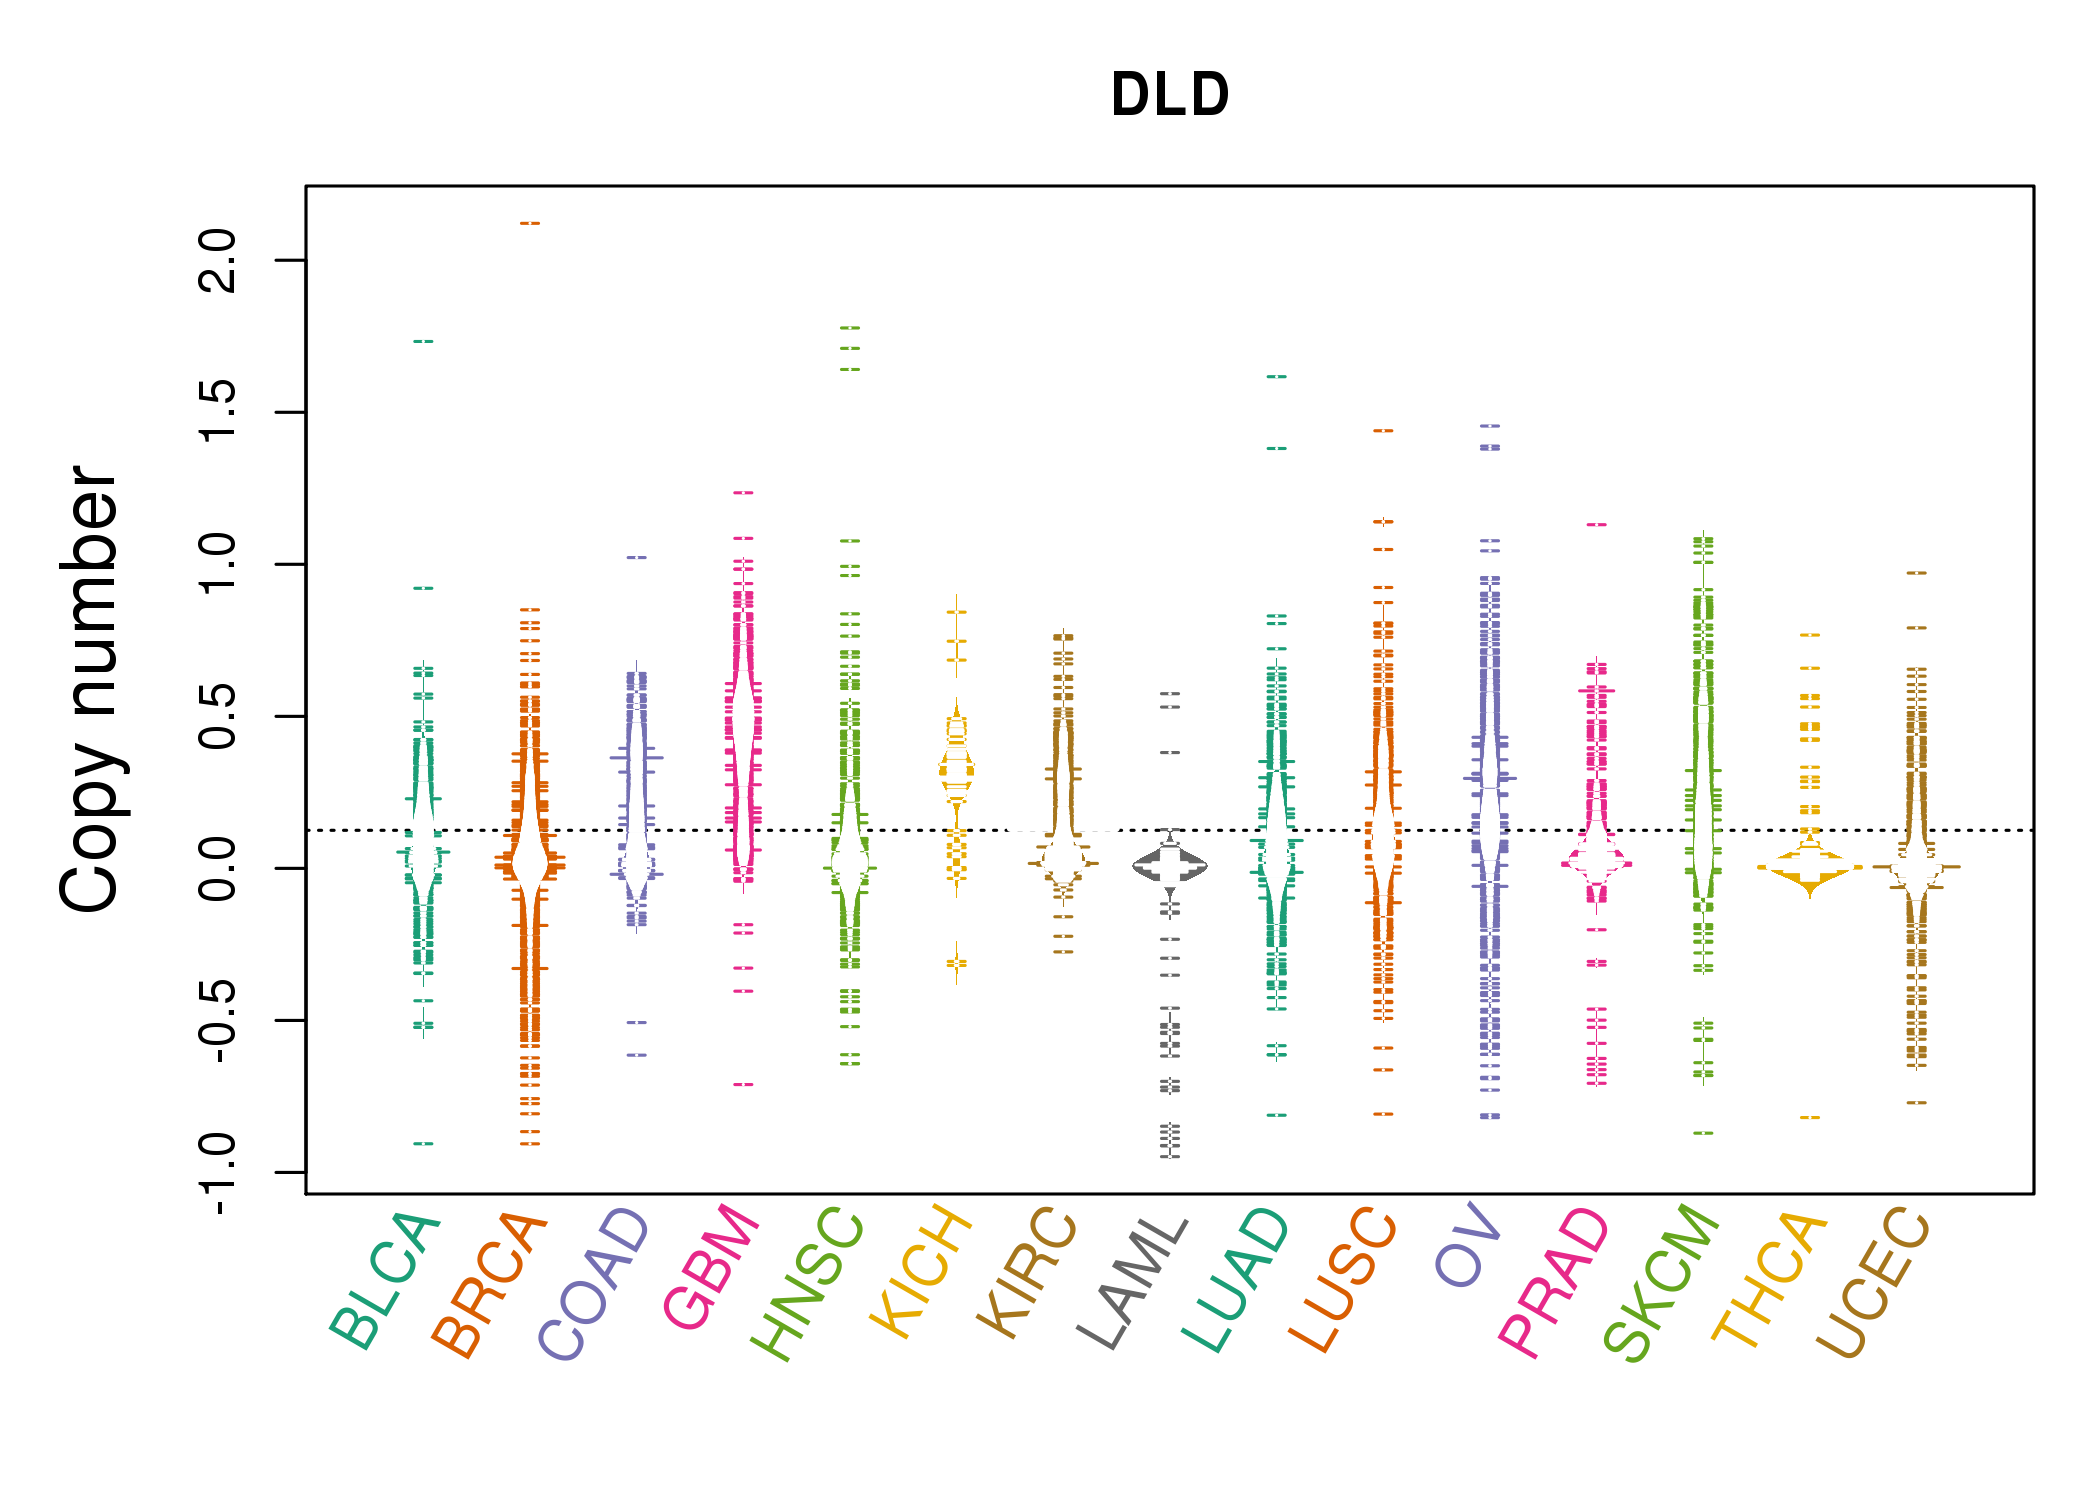 |
| cf) Tissue ID[Tissue type]: BLCA[Bladder Urothelial Carcinoma], BRCA[Breast invasive carcinoma], CESC[Cervical squamous cell carcinoma and endocervical adenocarcinoma], COAD[Colon adenocarcinoma], GBM[Glioblastoma multiforme], Glioma Low Grade, HNSC[Head and Neck squamous cell carcinoma], KICH[Kidney Chromophobe], KIRC[Kidney renal clear cell carcinoma], KIRP[Kidney renal papillary cell carcinoma], LAML[Acute Myeloid Leukemia], LUAD[Lung adenocarcinoma], LUSC[Lung squamous cell carcinoma], OV[Ovarian serous cystadenocarcinoma ], PAAD[Pancreatic adenocarcinoma], PRAD[Prostate adenocarcinoma], SKCM[Skin Cutaneous Melanoma], STAD[Stomach adenocarcinoma], THCA[Thyroid carcinoma], UCEC[Uterine Corpus Endometrial Carcinoma] |
| Top |
| Gene Expression for DLD |
| * CCLE gene expression data were extracted from CCLE_Expression_Entrez_2012-10-18.res: Gene-centric RMA-normalized mRNA expression data. |
 |
| * Normalized gene expression data of RNASeqV2 was extracted from TCGA using R package TCGA-Assembler. The URLs of all public data files on TCGA DCC data server were gathered at Jan-05-2015. Only eight cancer types have enough normal control samples for differential expression analysis. (t test, adjusted p<0.05 (using Benjamini-Hochberg FDR)) |
 |
| Top |
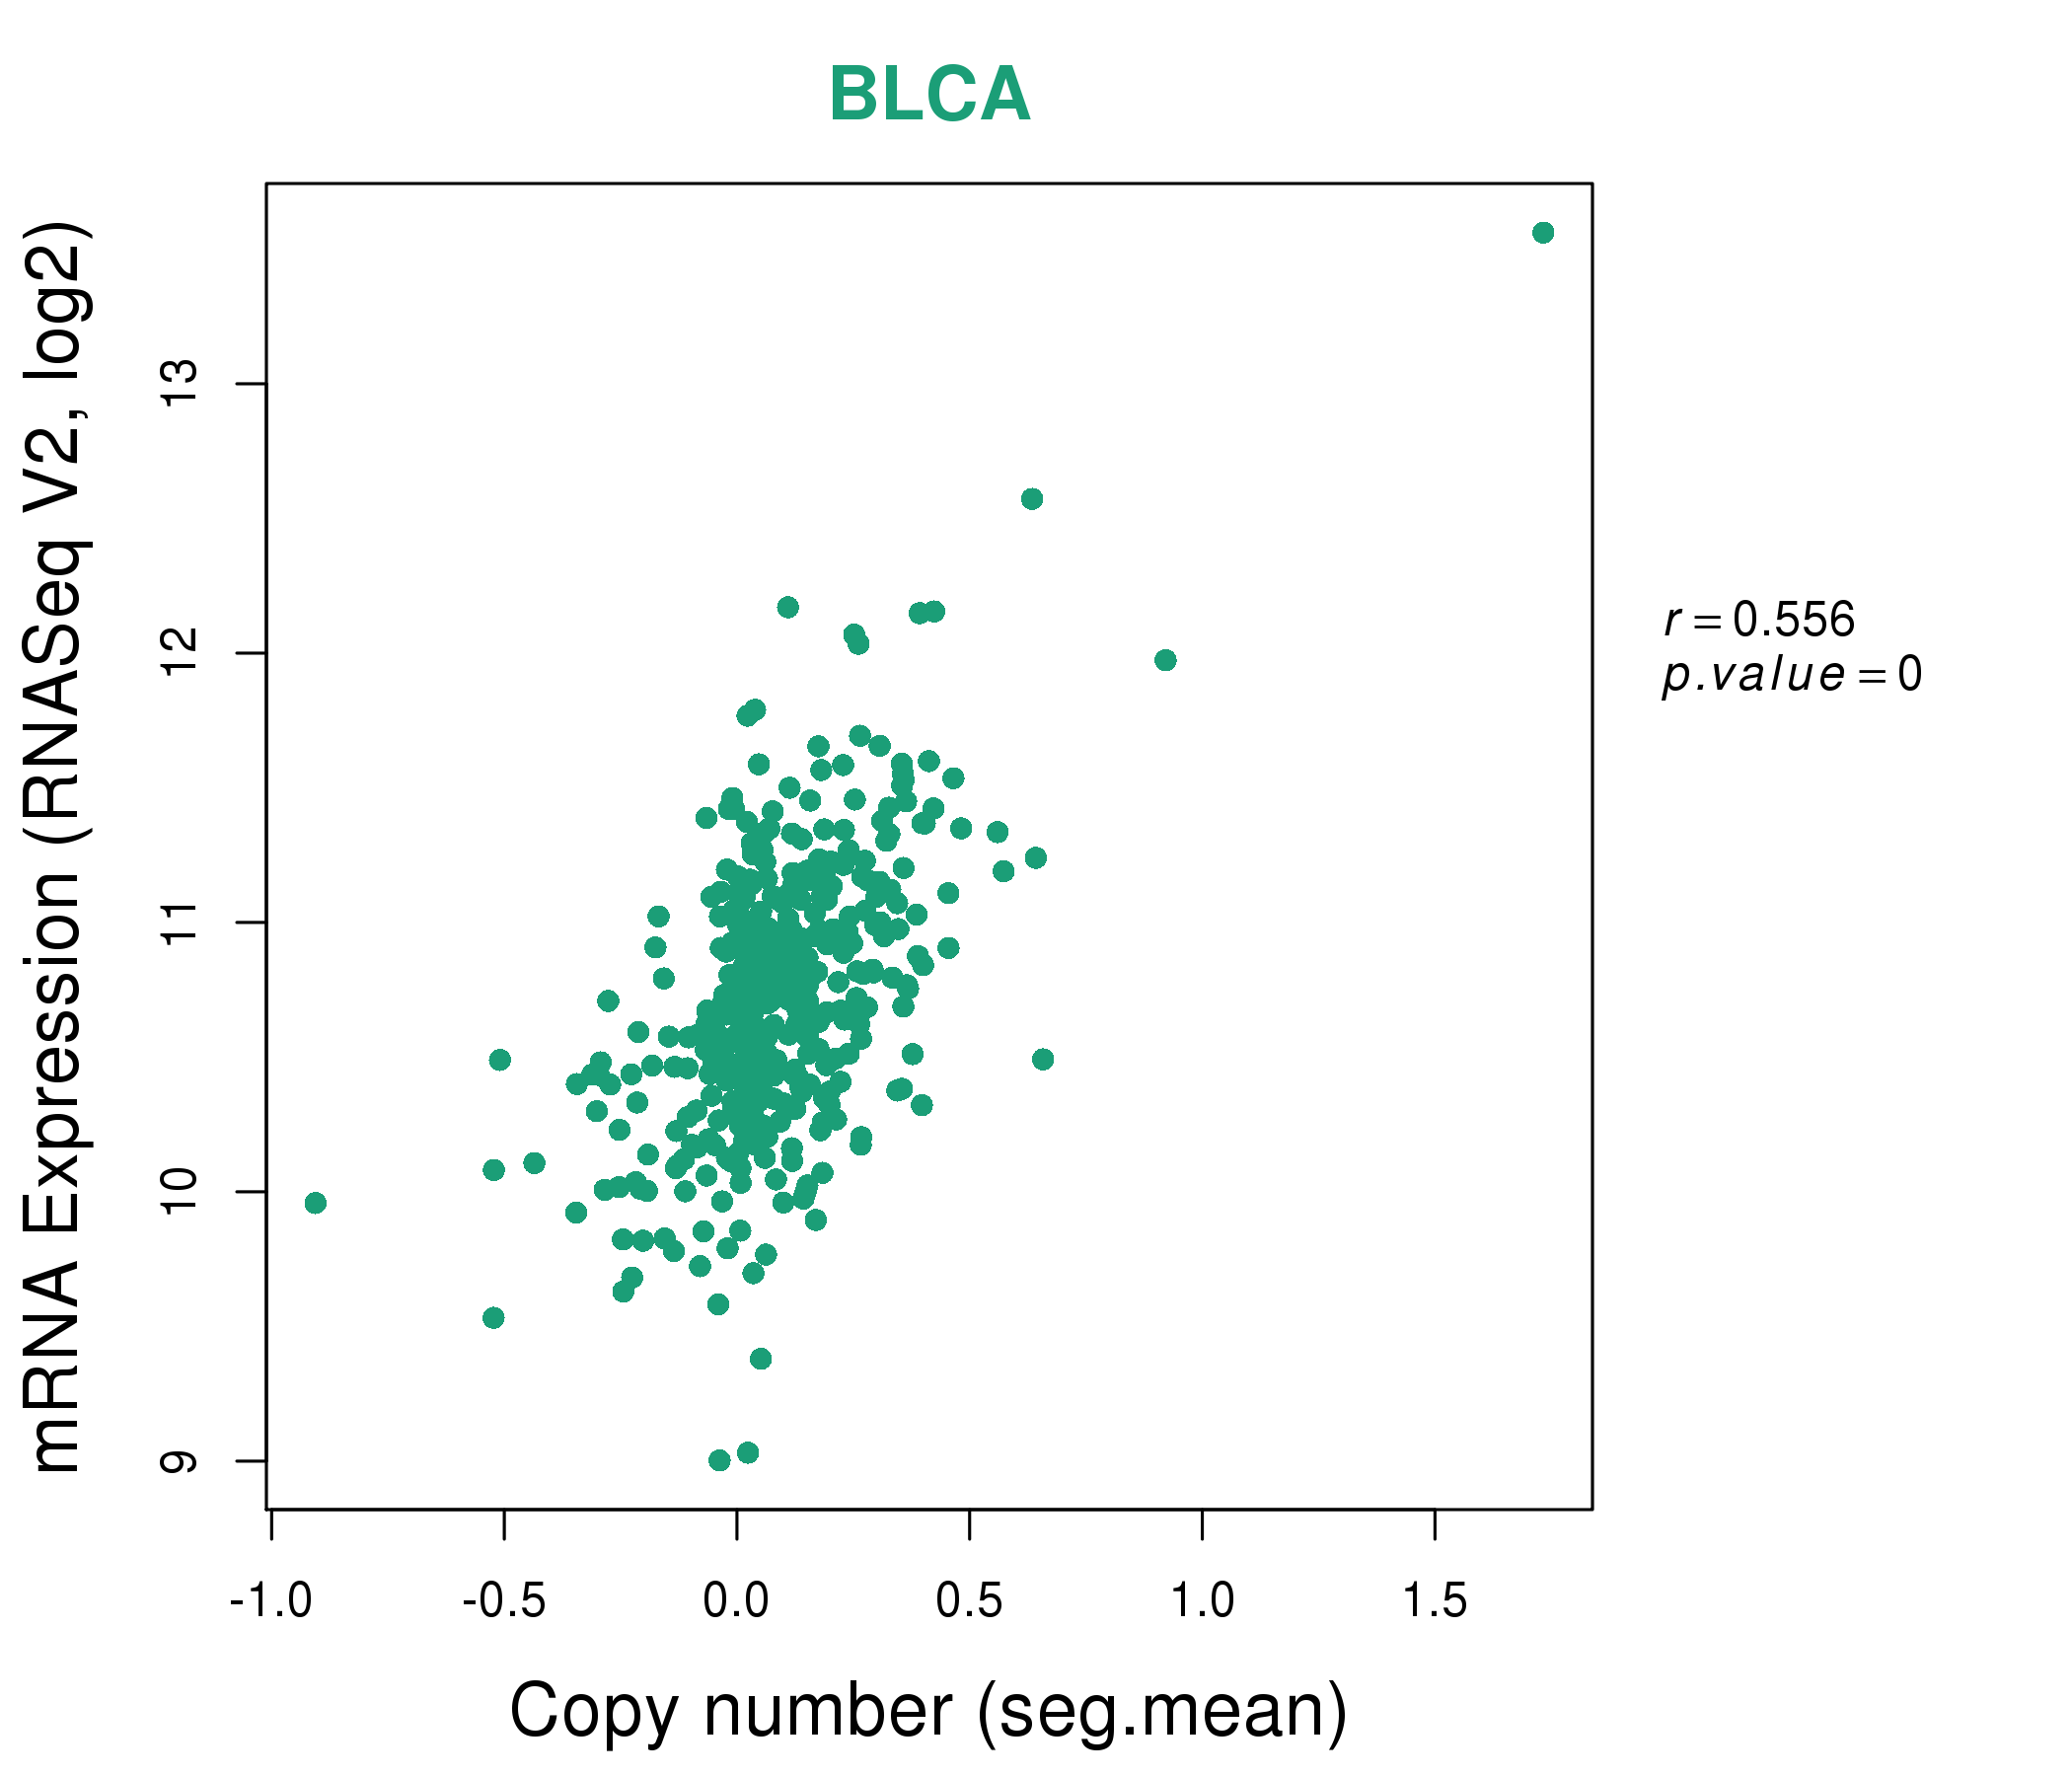
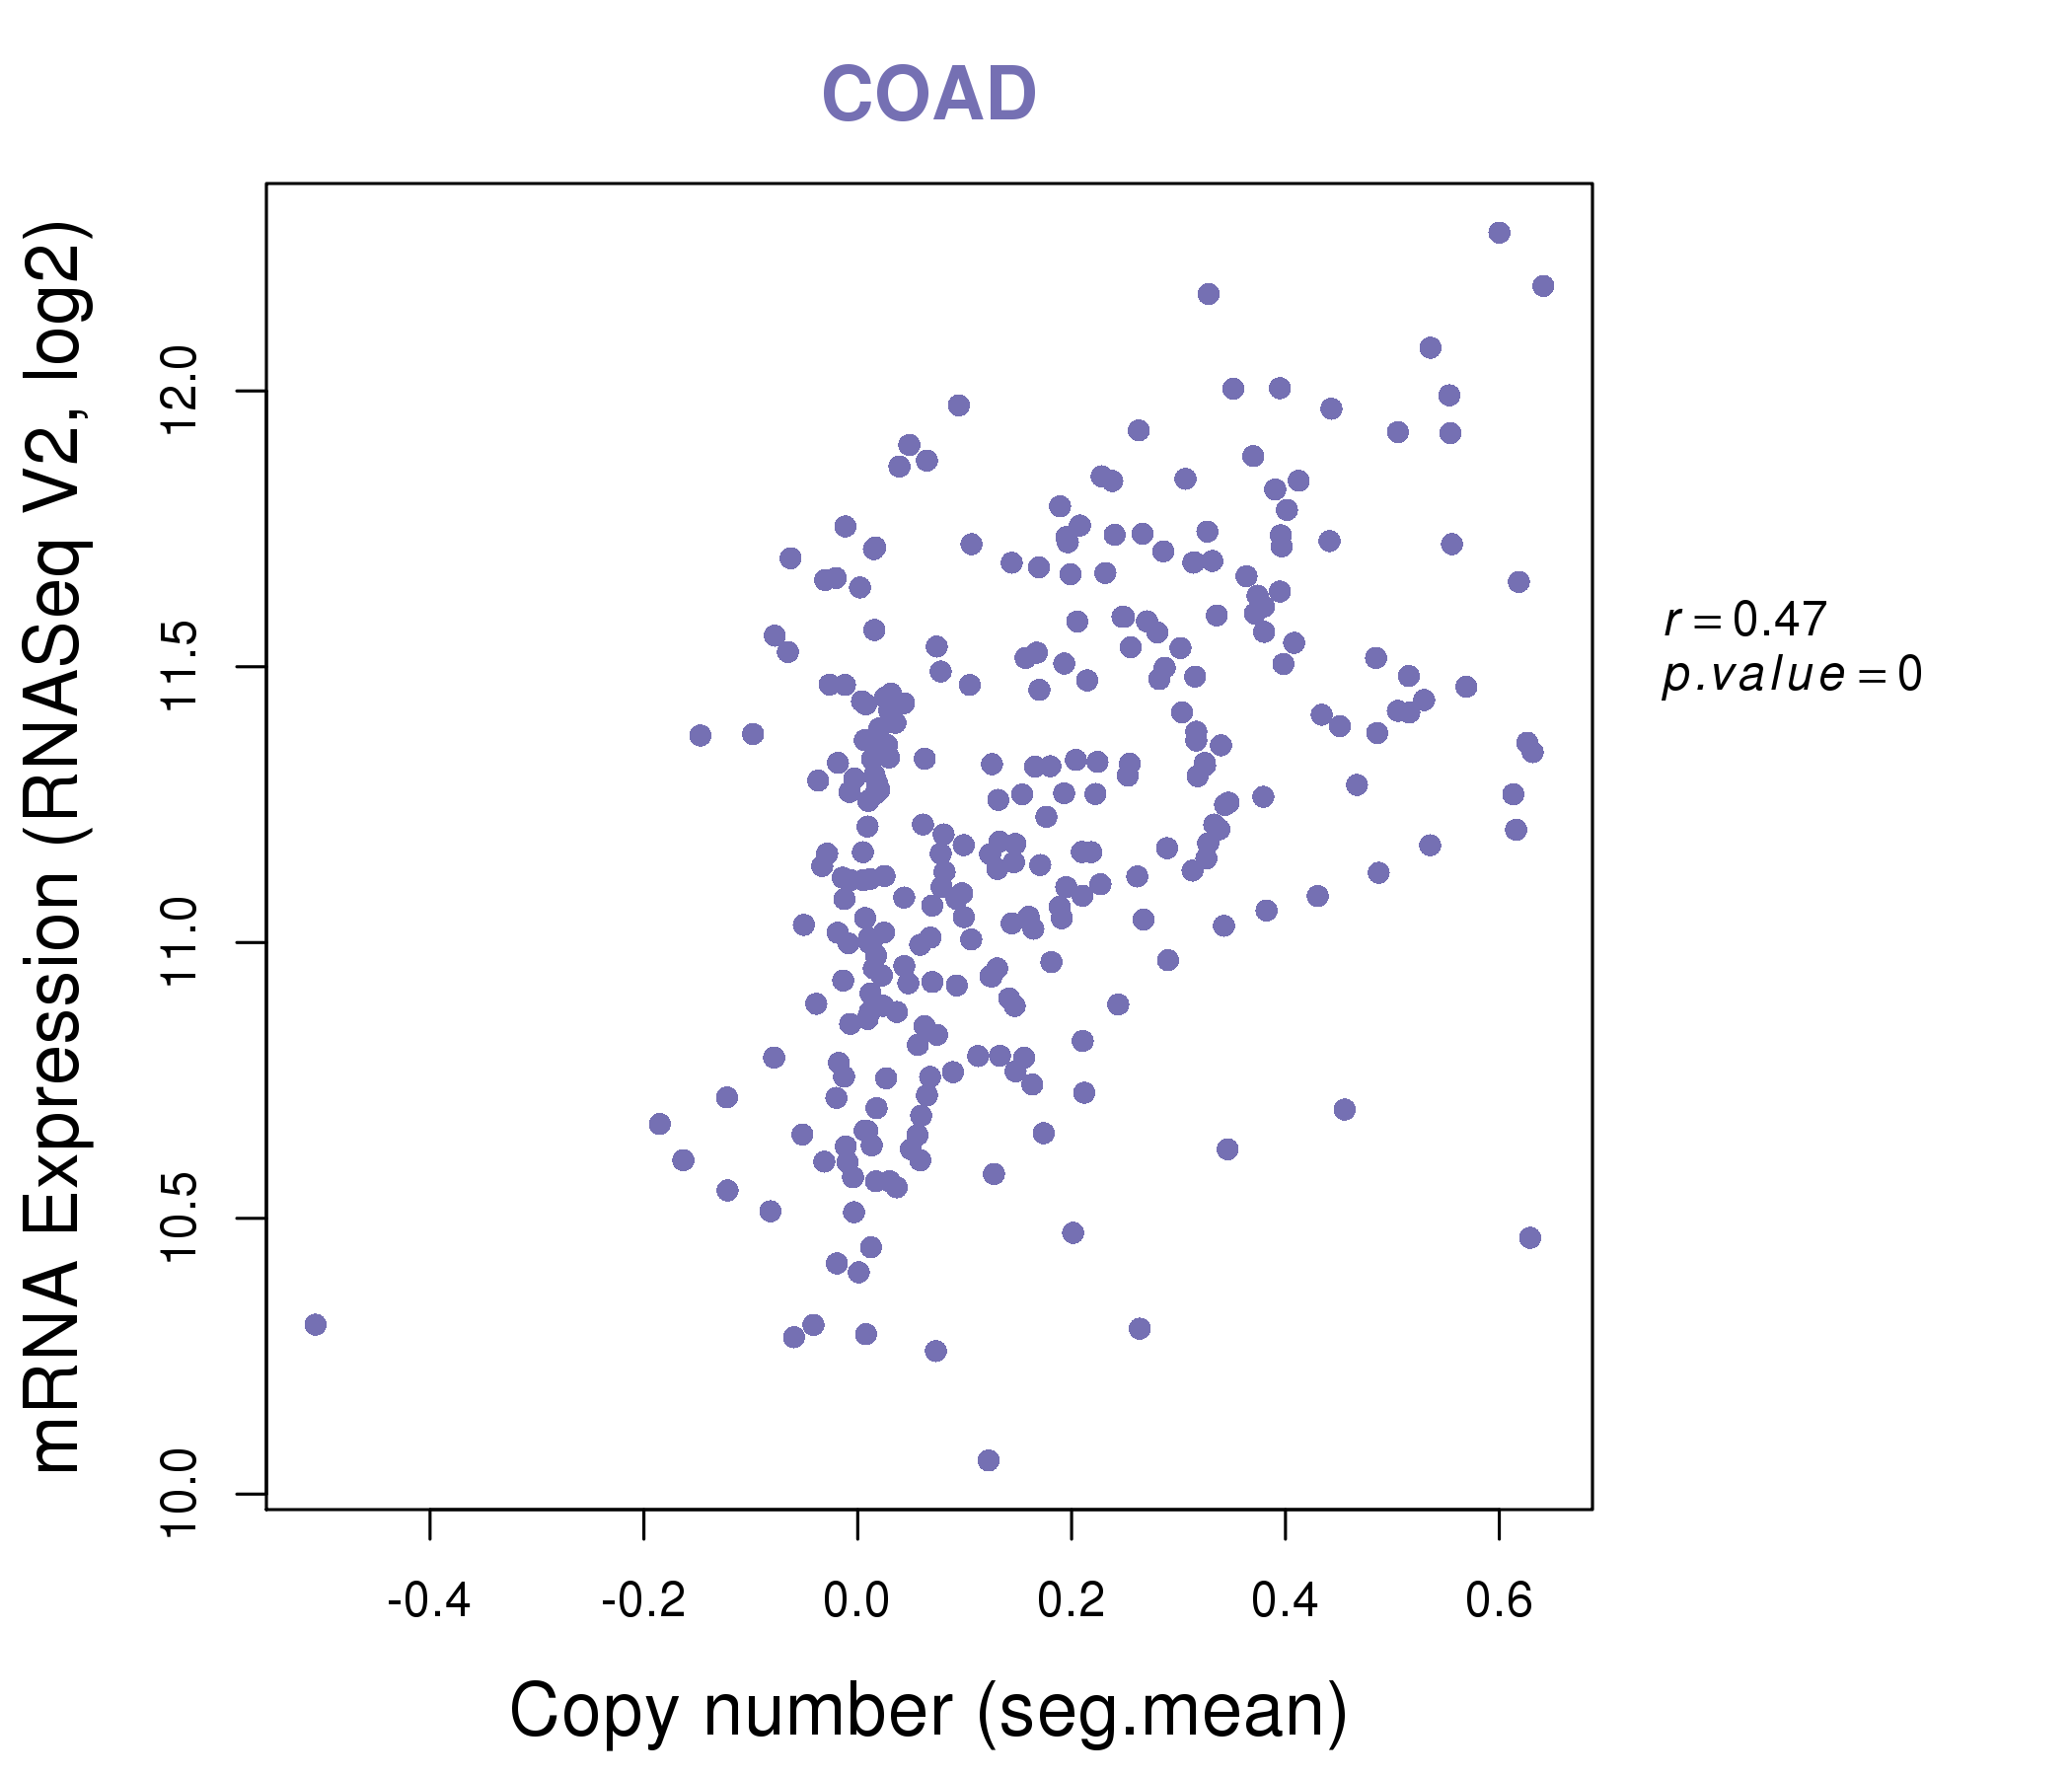
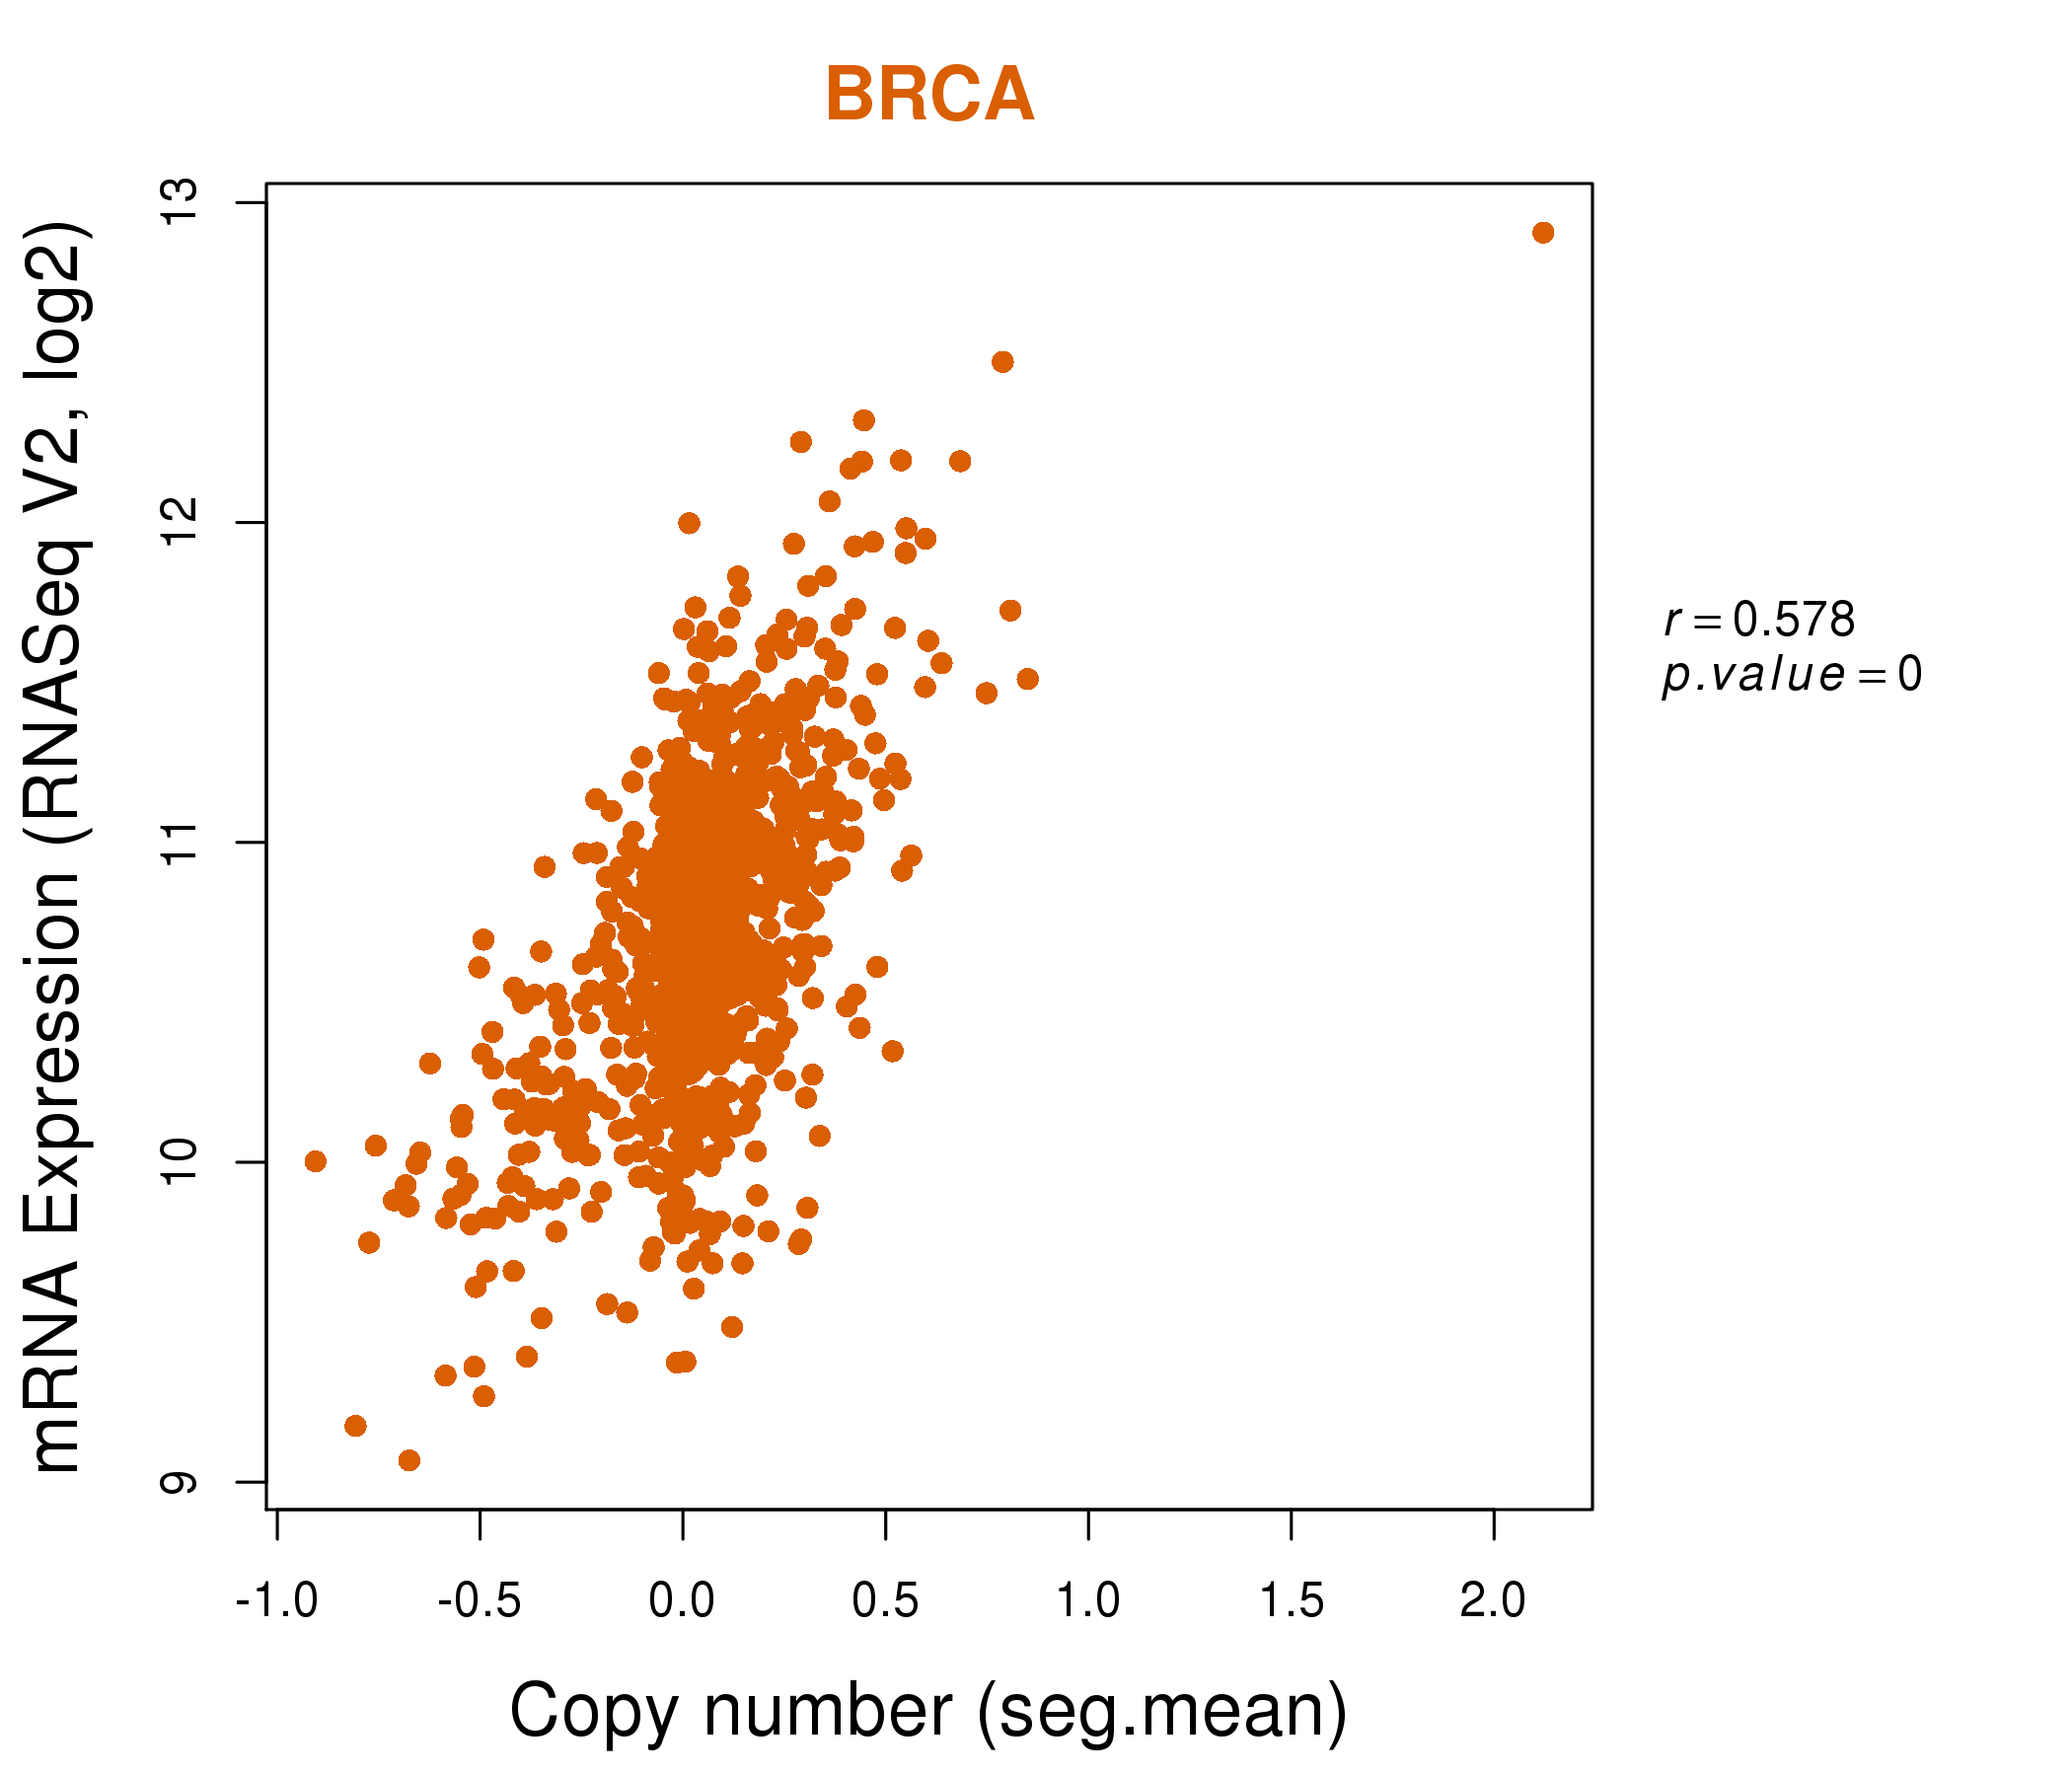
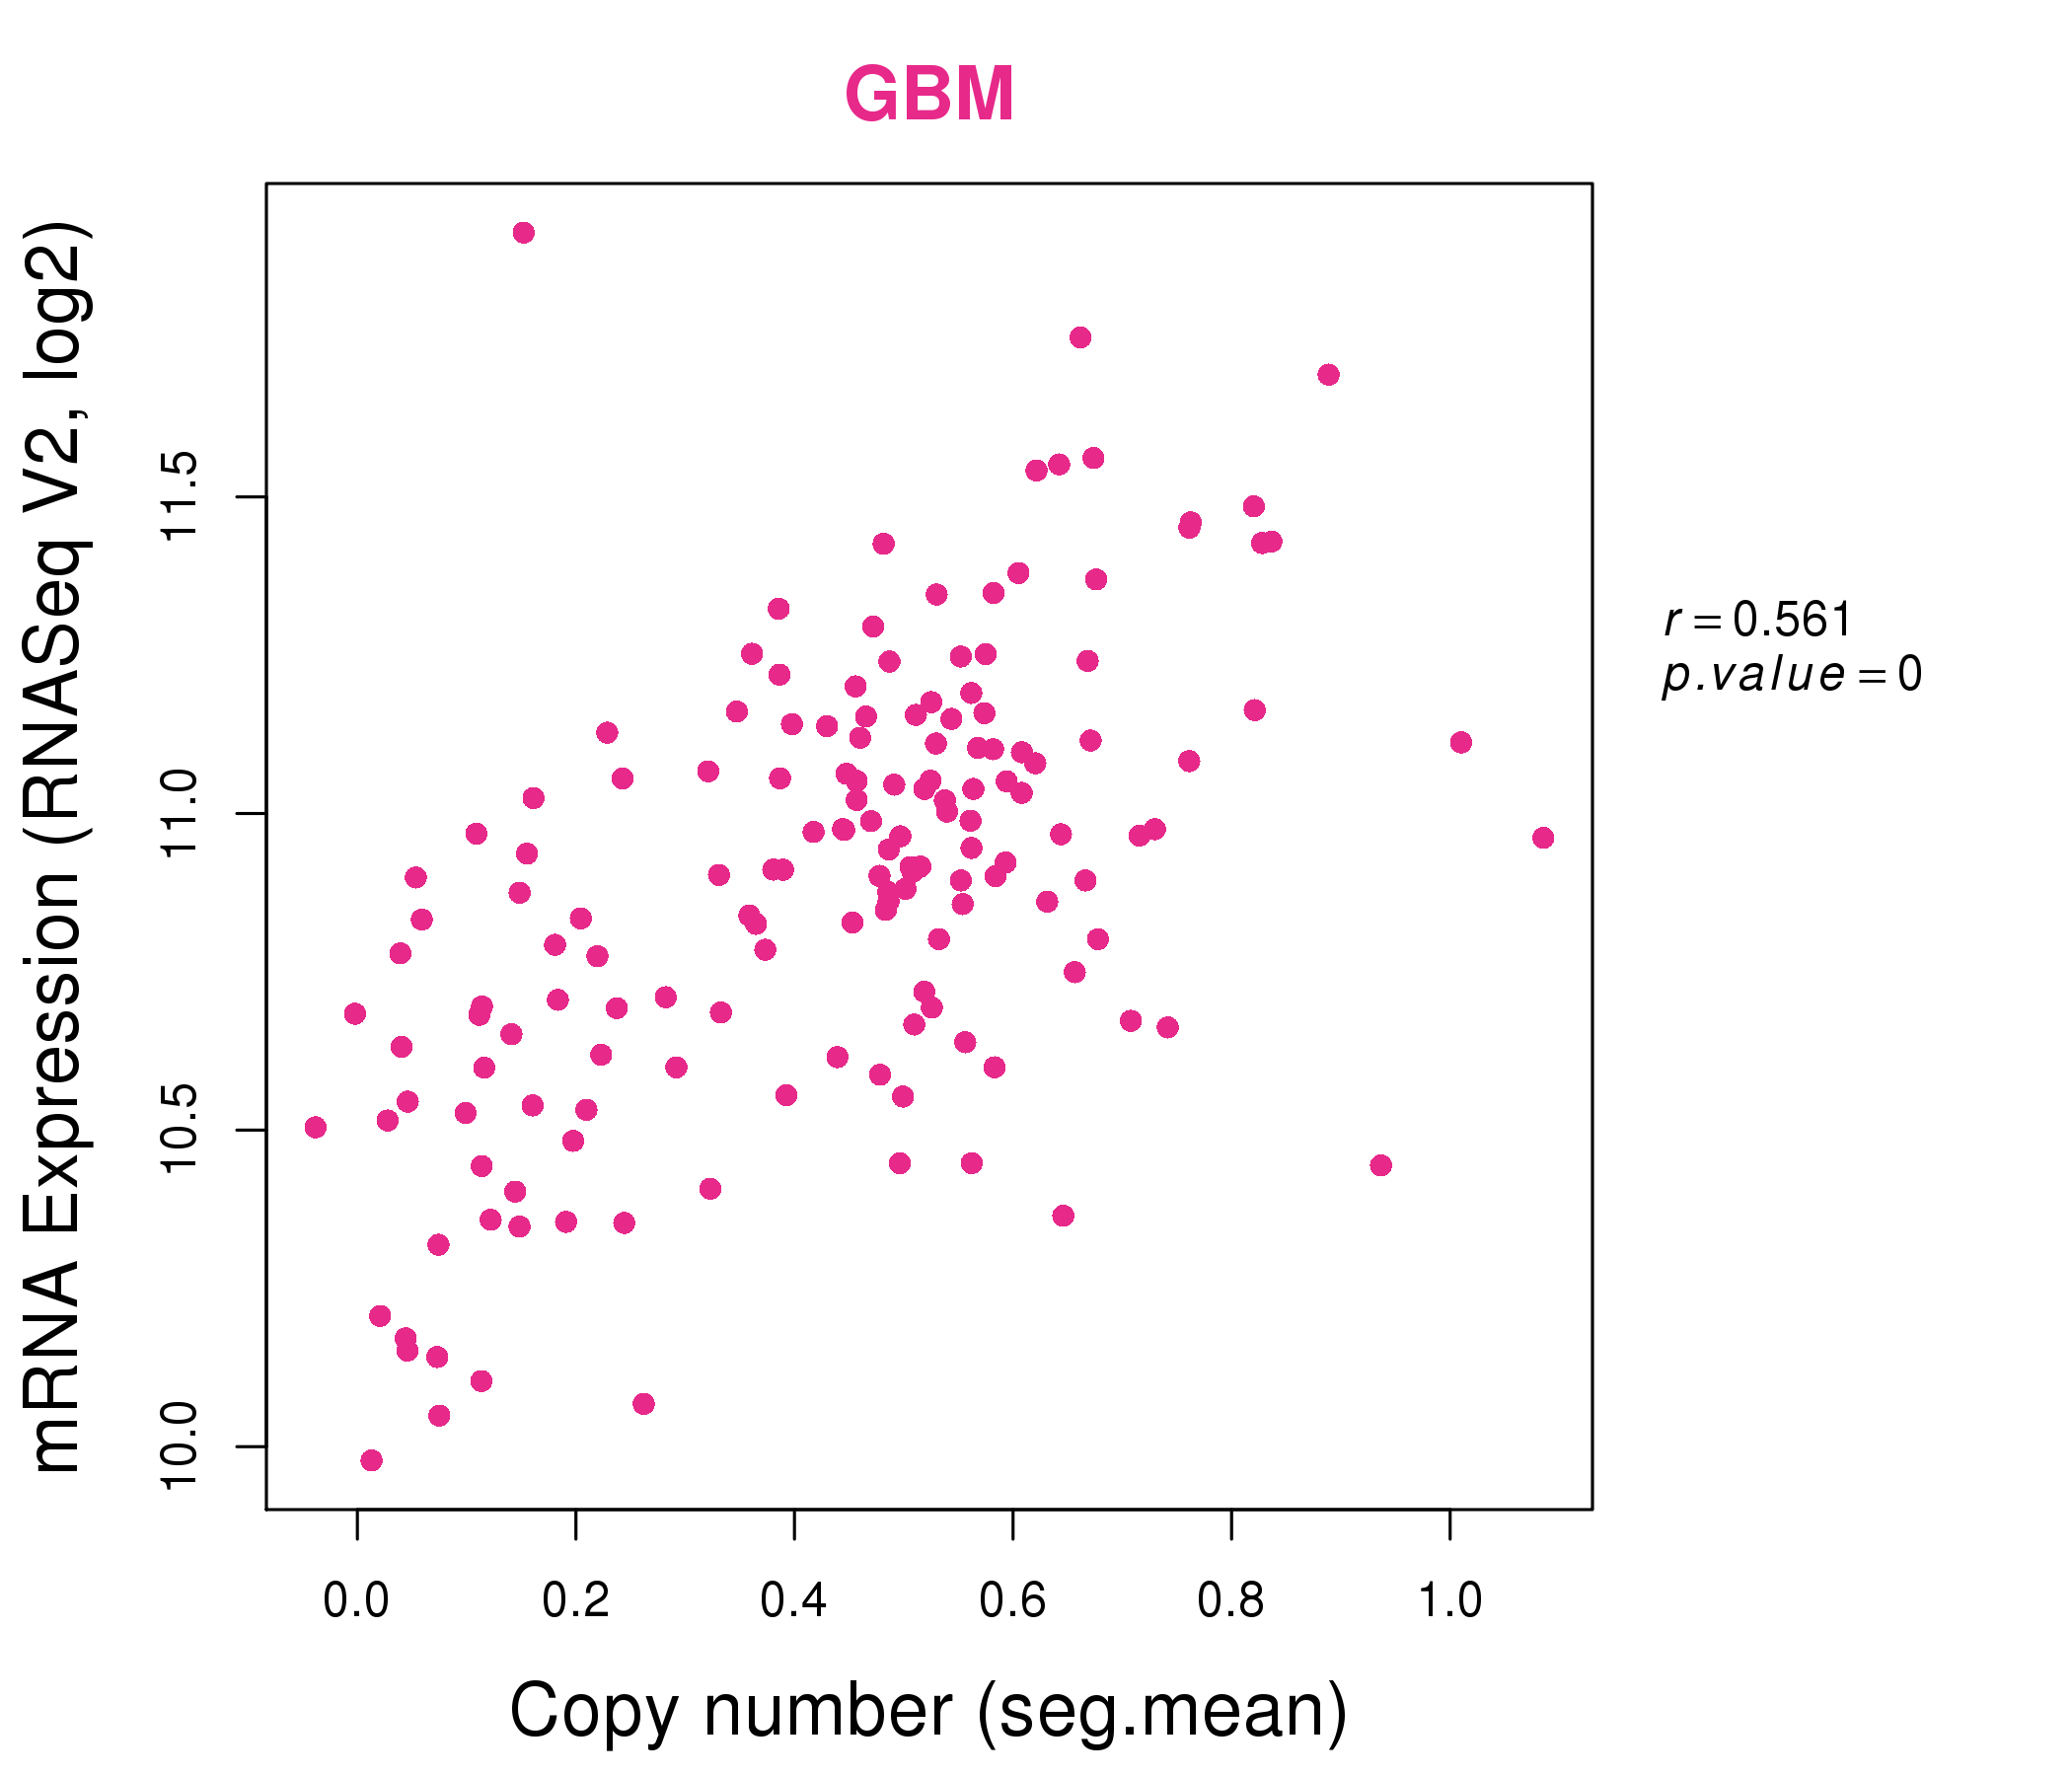
| * This plots show the correlation between CNV and gene expression. |
: Open all plots for all cancer types
 |
|
 |
|
| Top |
| Gene-Gene Network Information |
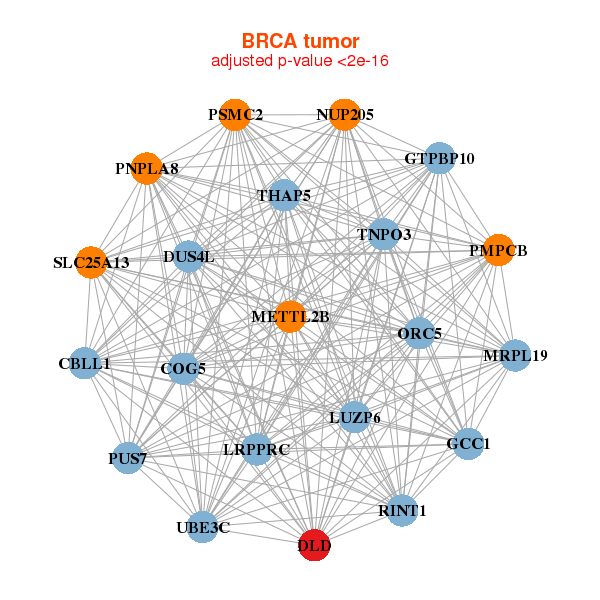
| * Co-Expression network figures were drawn using R package igraph. Only the top 20 genes with the highest correlations were shown. Red circle: input gene, orange circle: cell metabolism gene, sky circle: other gene |
: Open all plots for all cancer types
 |
| ||||
| CBLL1,COG5,DLD,DUS4L,GCC1,GTPBP10,LRPPRC, LUZP6,METTL2B,MRPL19,NUP205,ORC5,PMPCB,PNPLA8, PSMC2,PUS7,RINT1,SLC25A13,THAP5,TNPO3,UBE3C | ACAT1,AK3,ATPAF1,DLD,ETFDH,GHITM,GNPAT, HADHB,HOXA10,HSDL2,HSPB6,PDHX,PGM1,PHYH, RDX,RRAGD,SLC2A4,SOX6,STRADB,SUCLA2,TBX15 | ||||
 |
| ||||
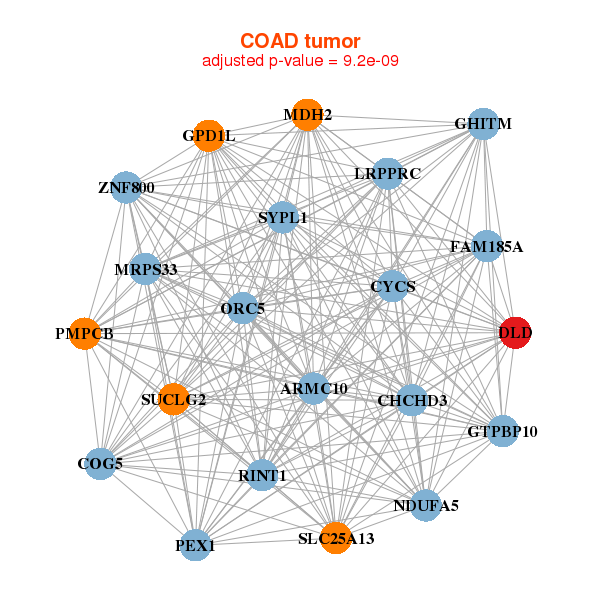
| ARMC10,CHCHD3,COG5,CYCS,DLD,FAM185A,GHITM, GPD1L,GTPBP10,LRPPRC,MDH2,MRPS33,NDUFA5,ORC5, PEX1,PMPCB,RINT1,SLC25A13,SUCLG2,SYPL1,ZNF800 | AIFM2,ANKRD13C,CA2,CYCS,DLAT,DLD,ETNK1, FH,GCLM,GHITM,LRP12,ME2,MIER1,NAA50, NDUFS1,RTN4IP1,SLC25A33,STK39,UBE2K,UGDH,VPS26A |

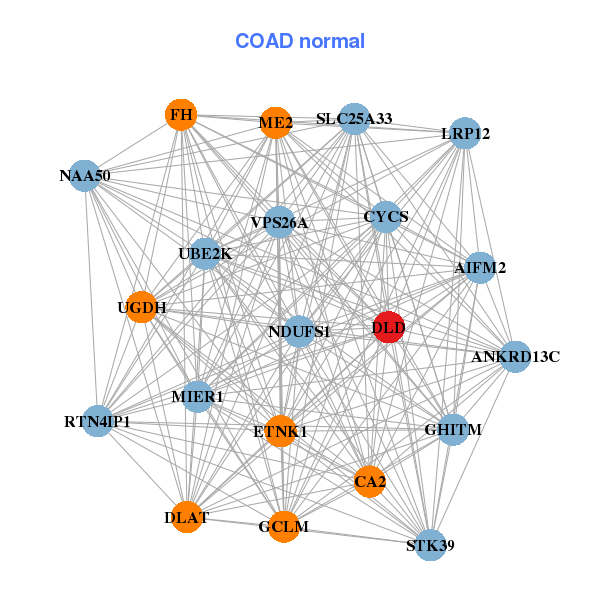
| * Co-Expression network figures were drawn using R package igraph. Only the top 20 genes with the highest correlations were shown. Red circle: input gene, orange circle: cell metabolism gene, sky circle: other gene |
: Open all plots for all cancer types
| Top |
: Open all interacting genes' information including KEGG pathway for all interacting genes from DAVID
| Top |
| Pharmacological Information for DLD |
| DB Category | DB Name | DB's ID and Url link |
| * Gene Centered Interaction Network. |
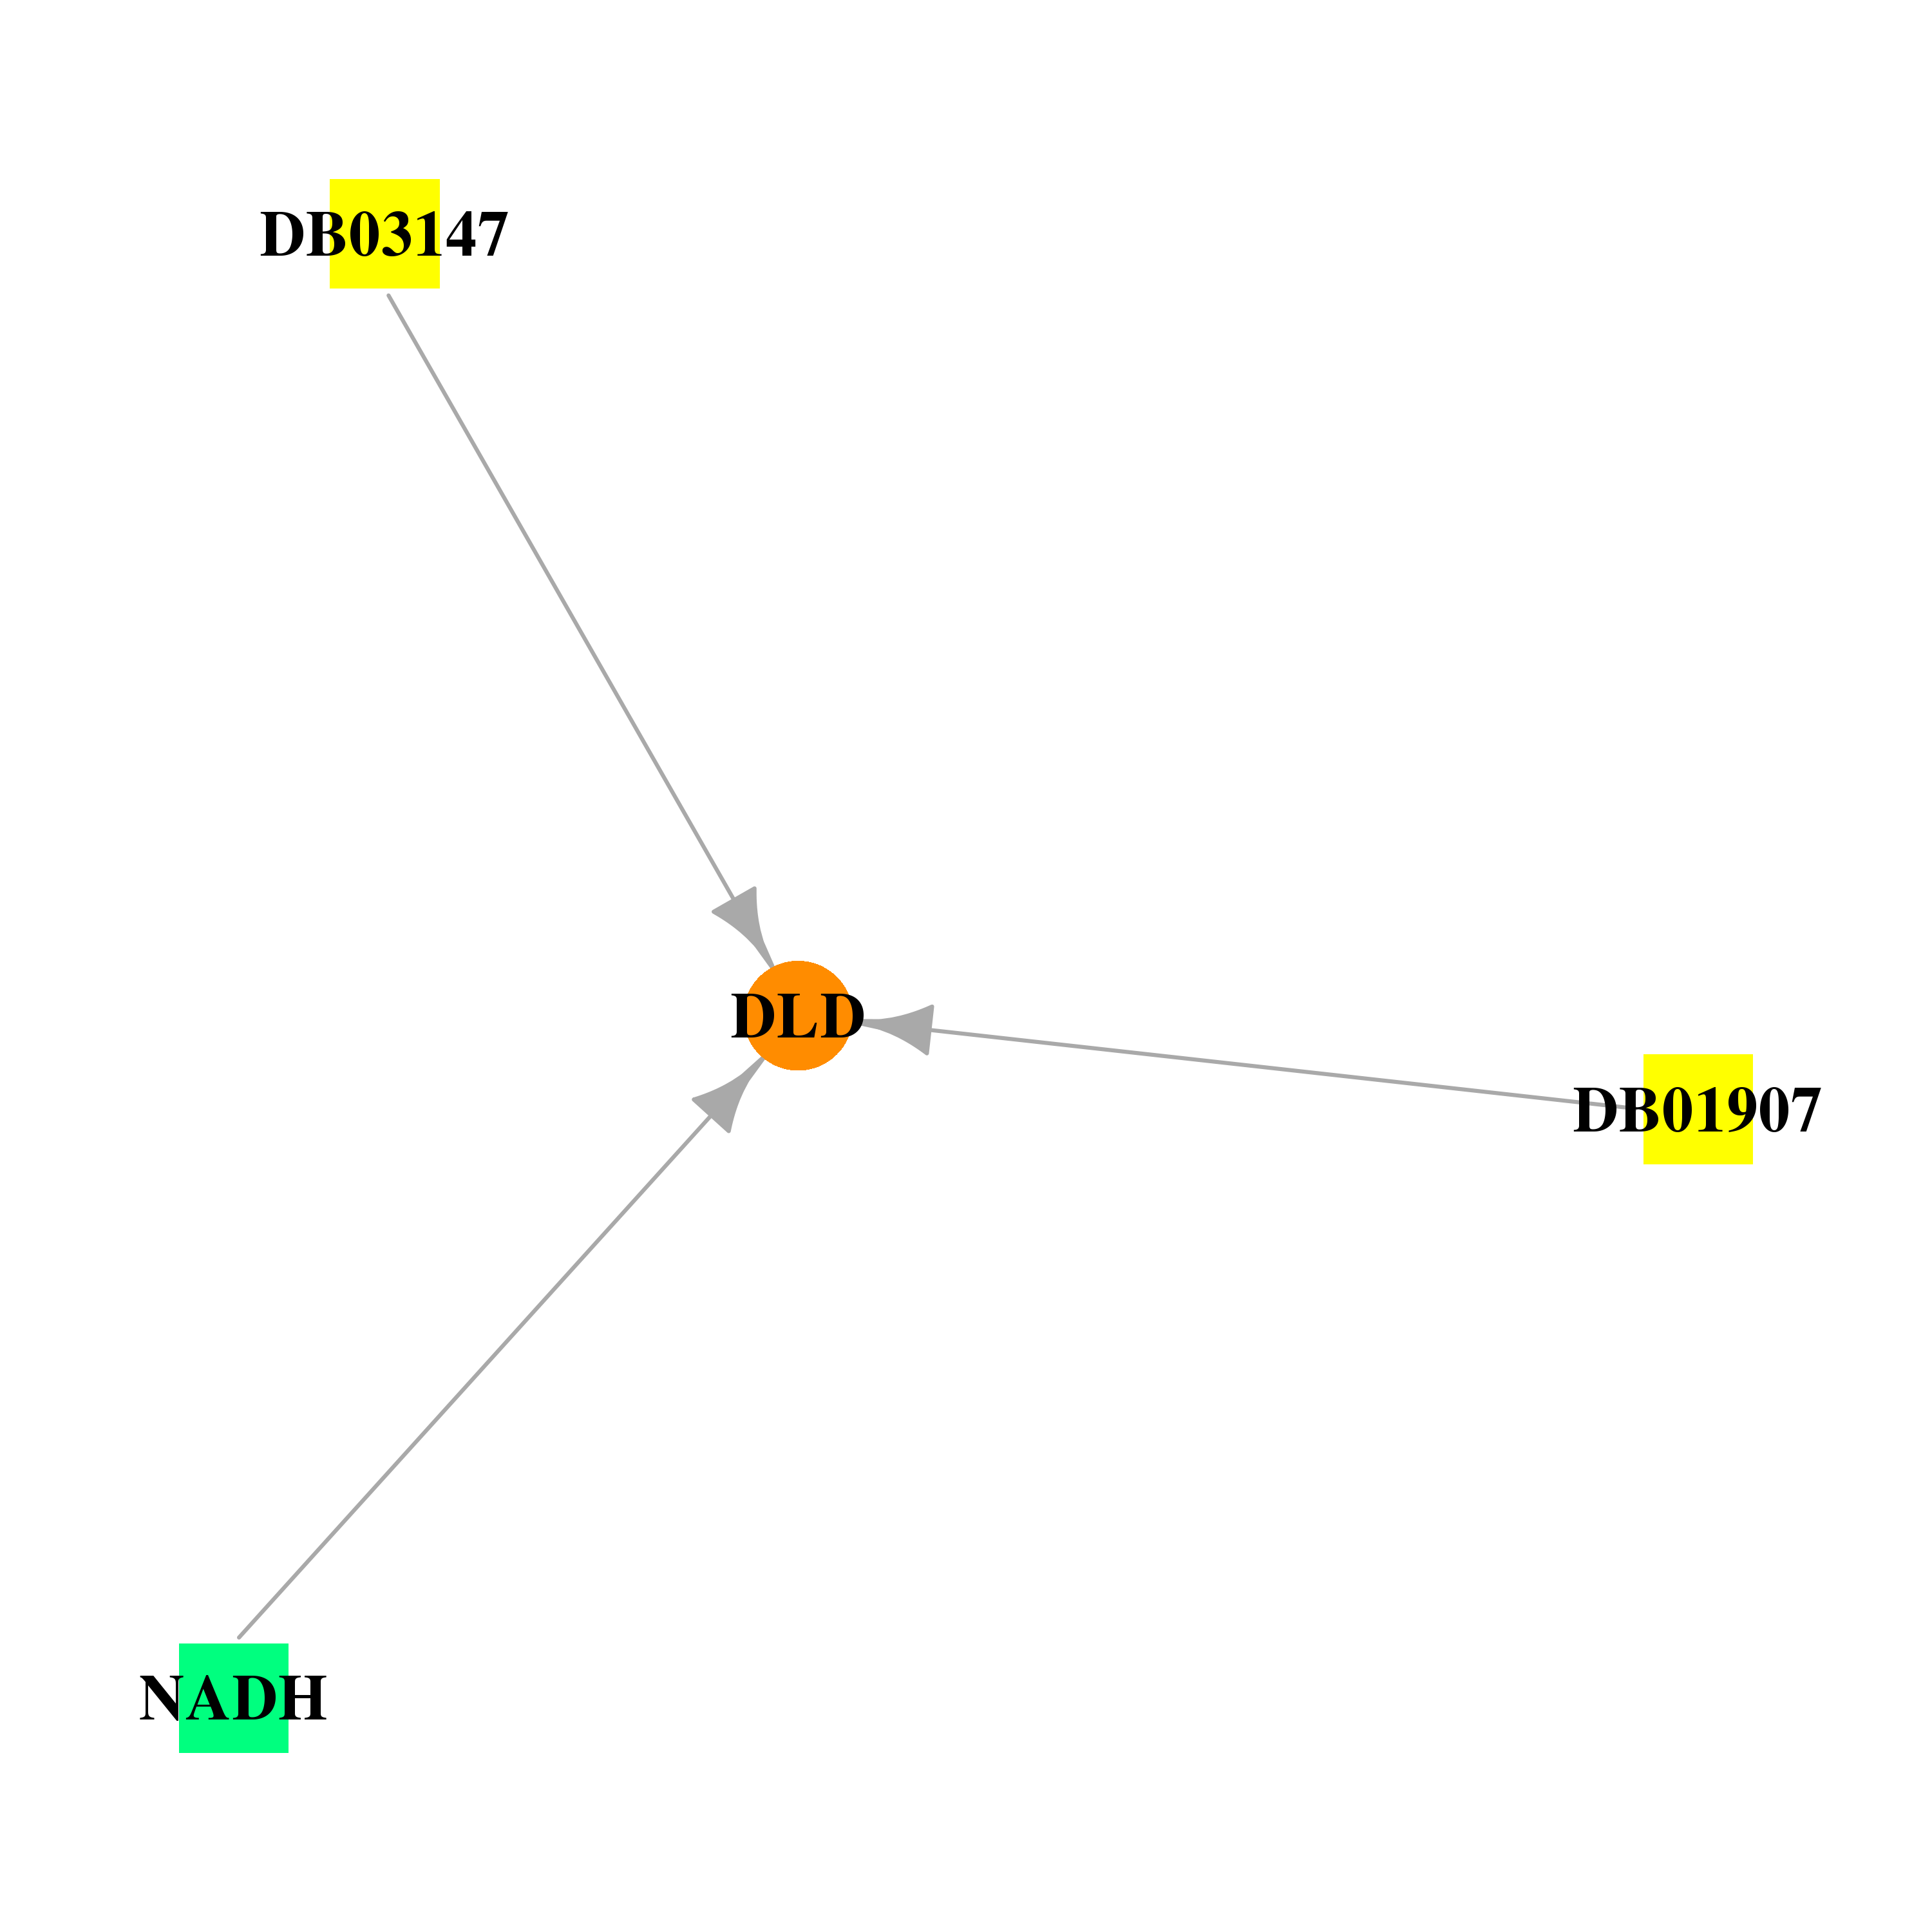 |
| * Drug Centered Interaction Network. |
| DrugBank ID | Target Name | Drug Groups | Generic Name | Drug Centered Network | Drug Structure |
| DB00157 | dihydrolipoamide dehydrogenase | approved; nutraceutical | NADH |  |  |
| DB01907 | dihydrolipoamide dehydrogenase | experimental | Nicotinamide-Adenine-Dinucleotide | 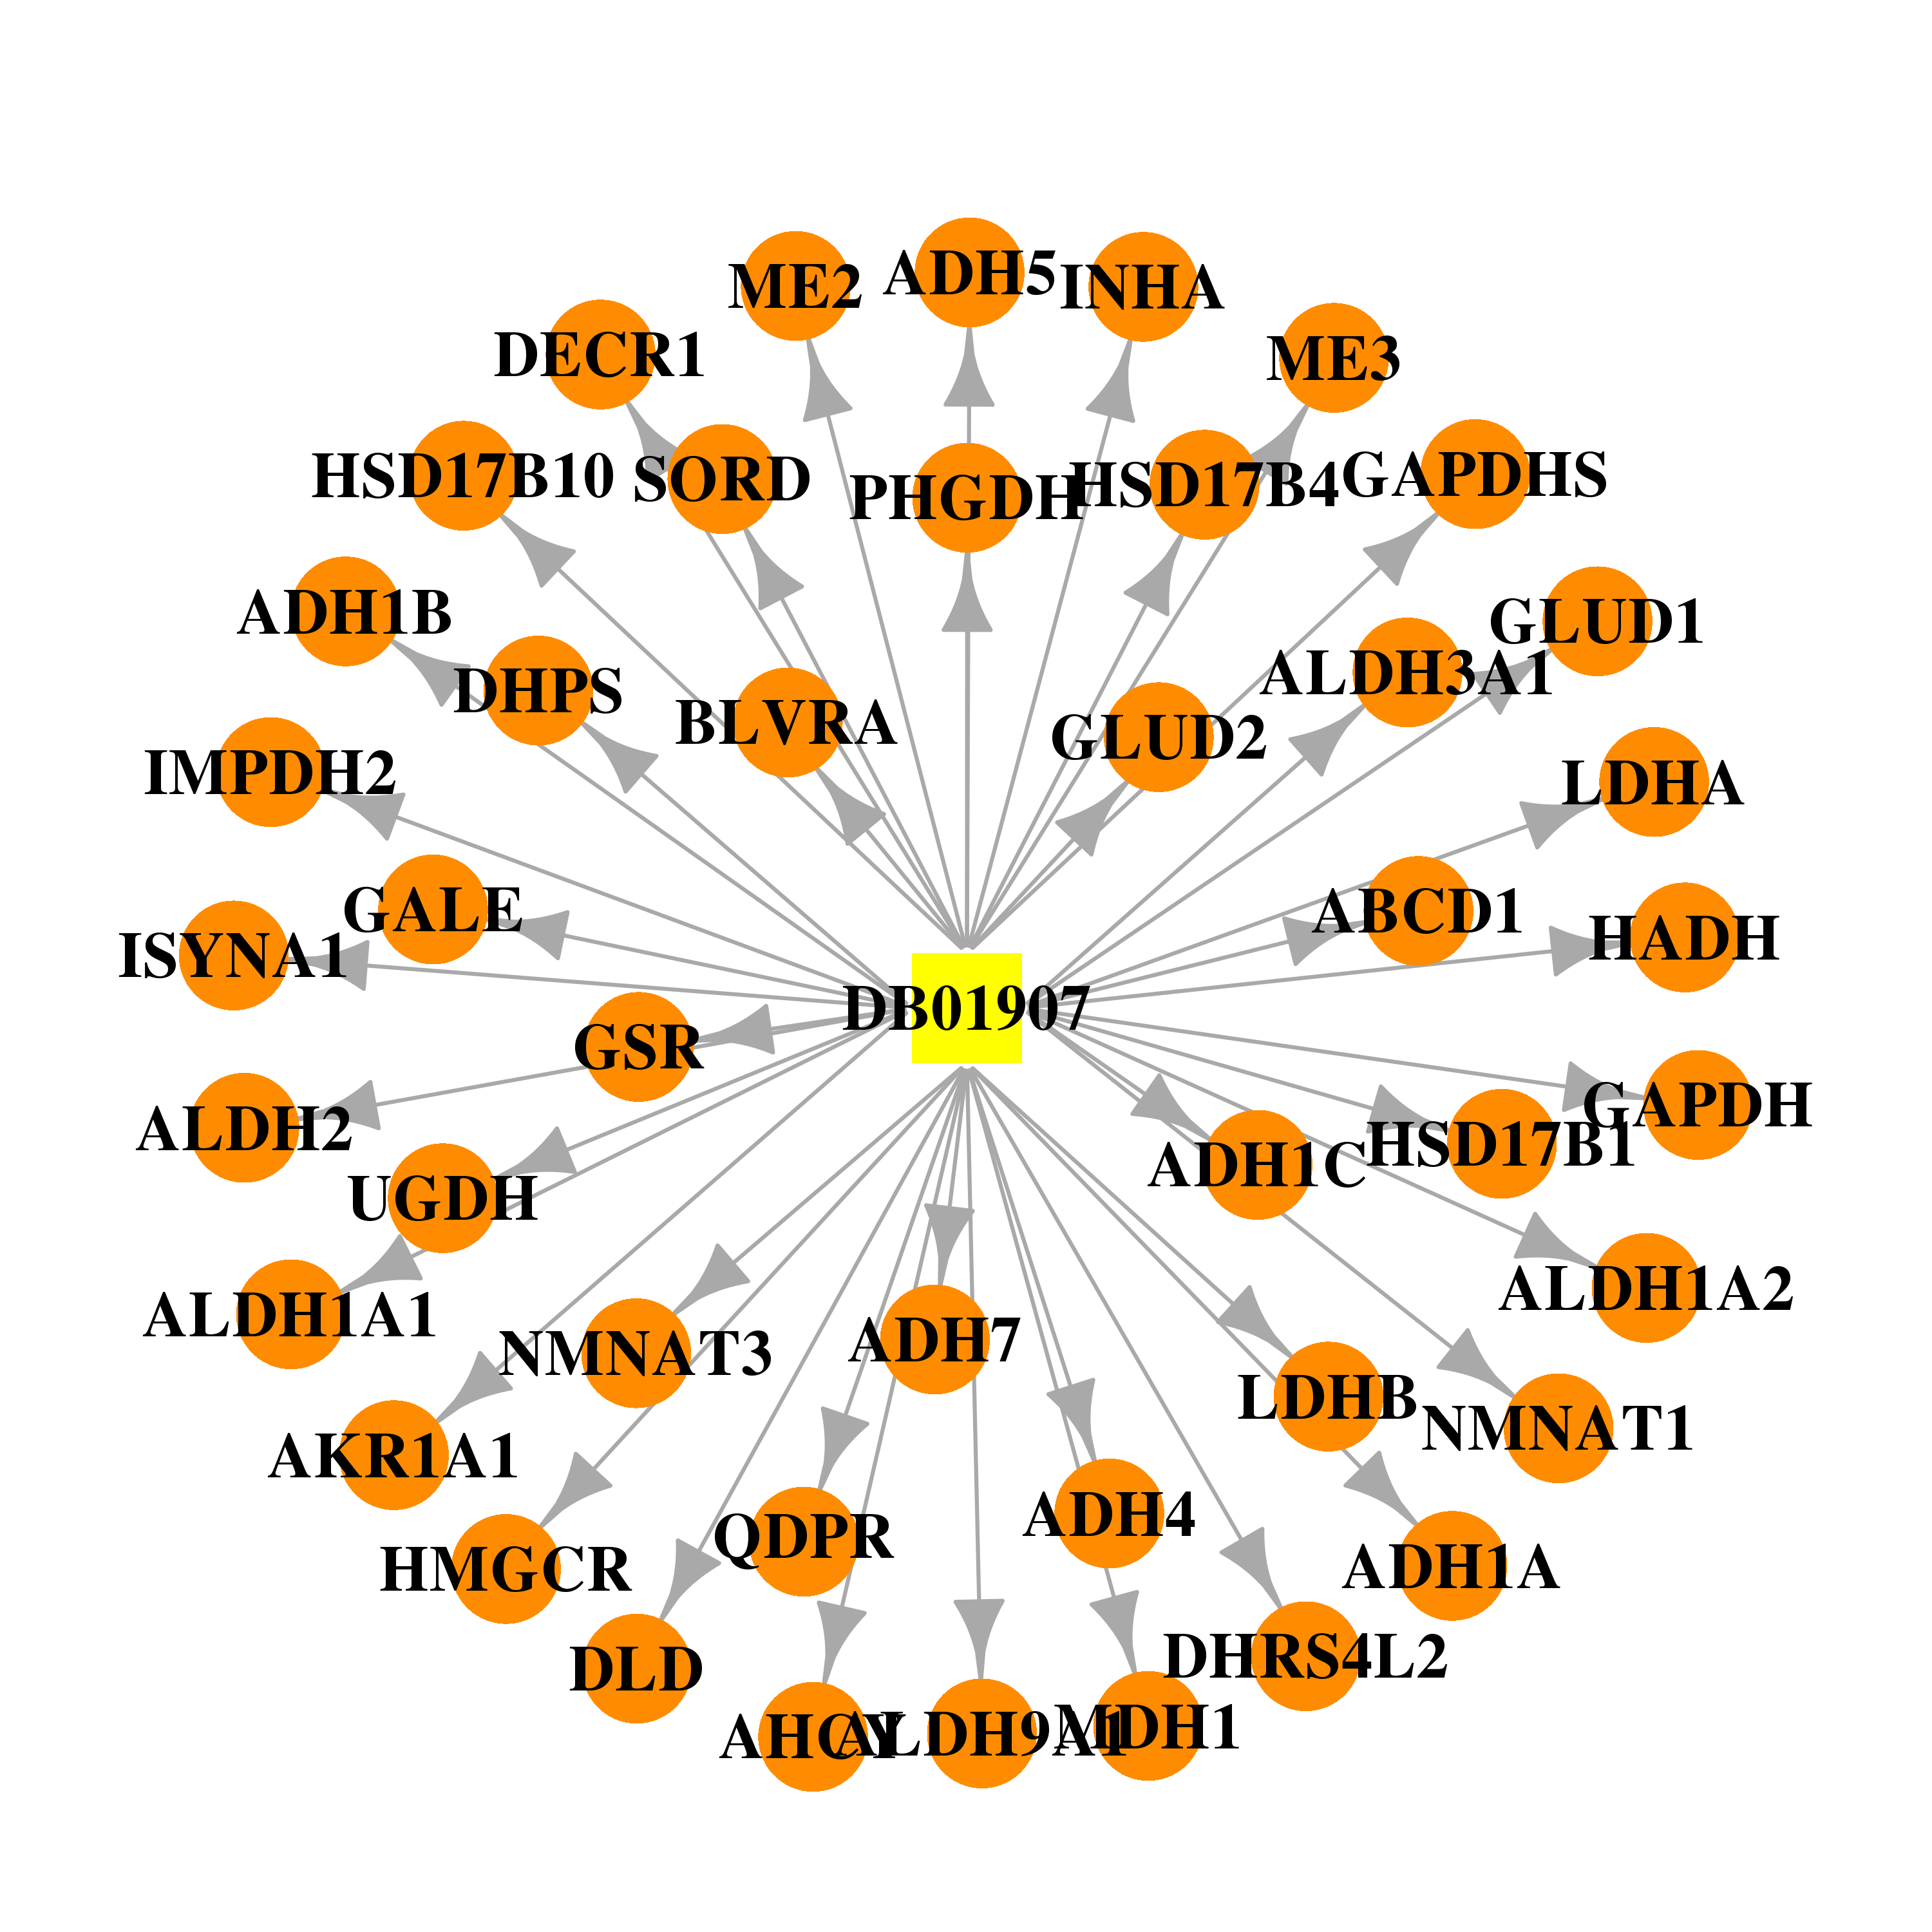 | 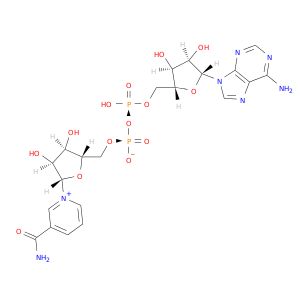 |
| DB03147 | dihydrolipoamide dehydrogenase | experimental | Flavin-Adenine Dinucleotide | 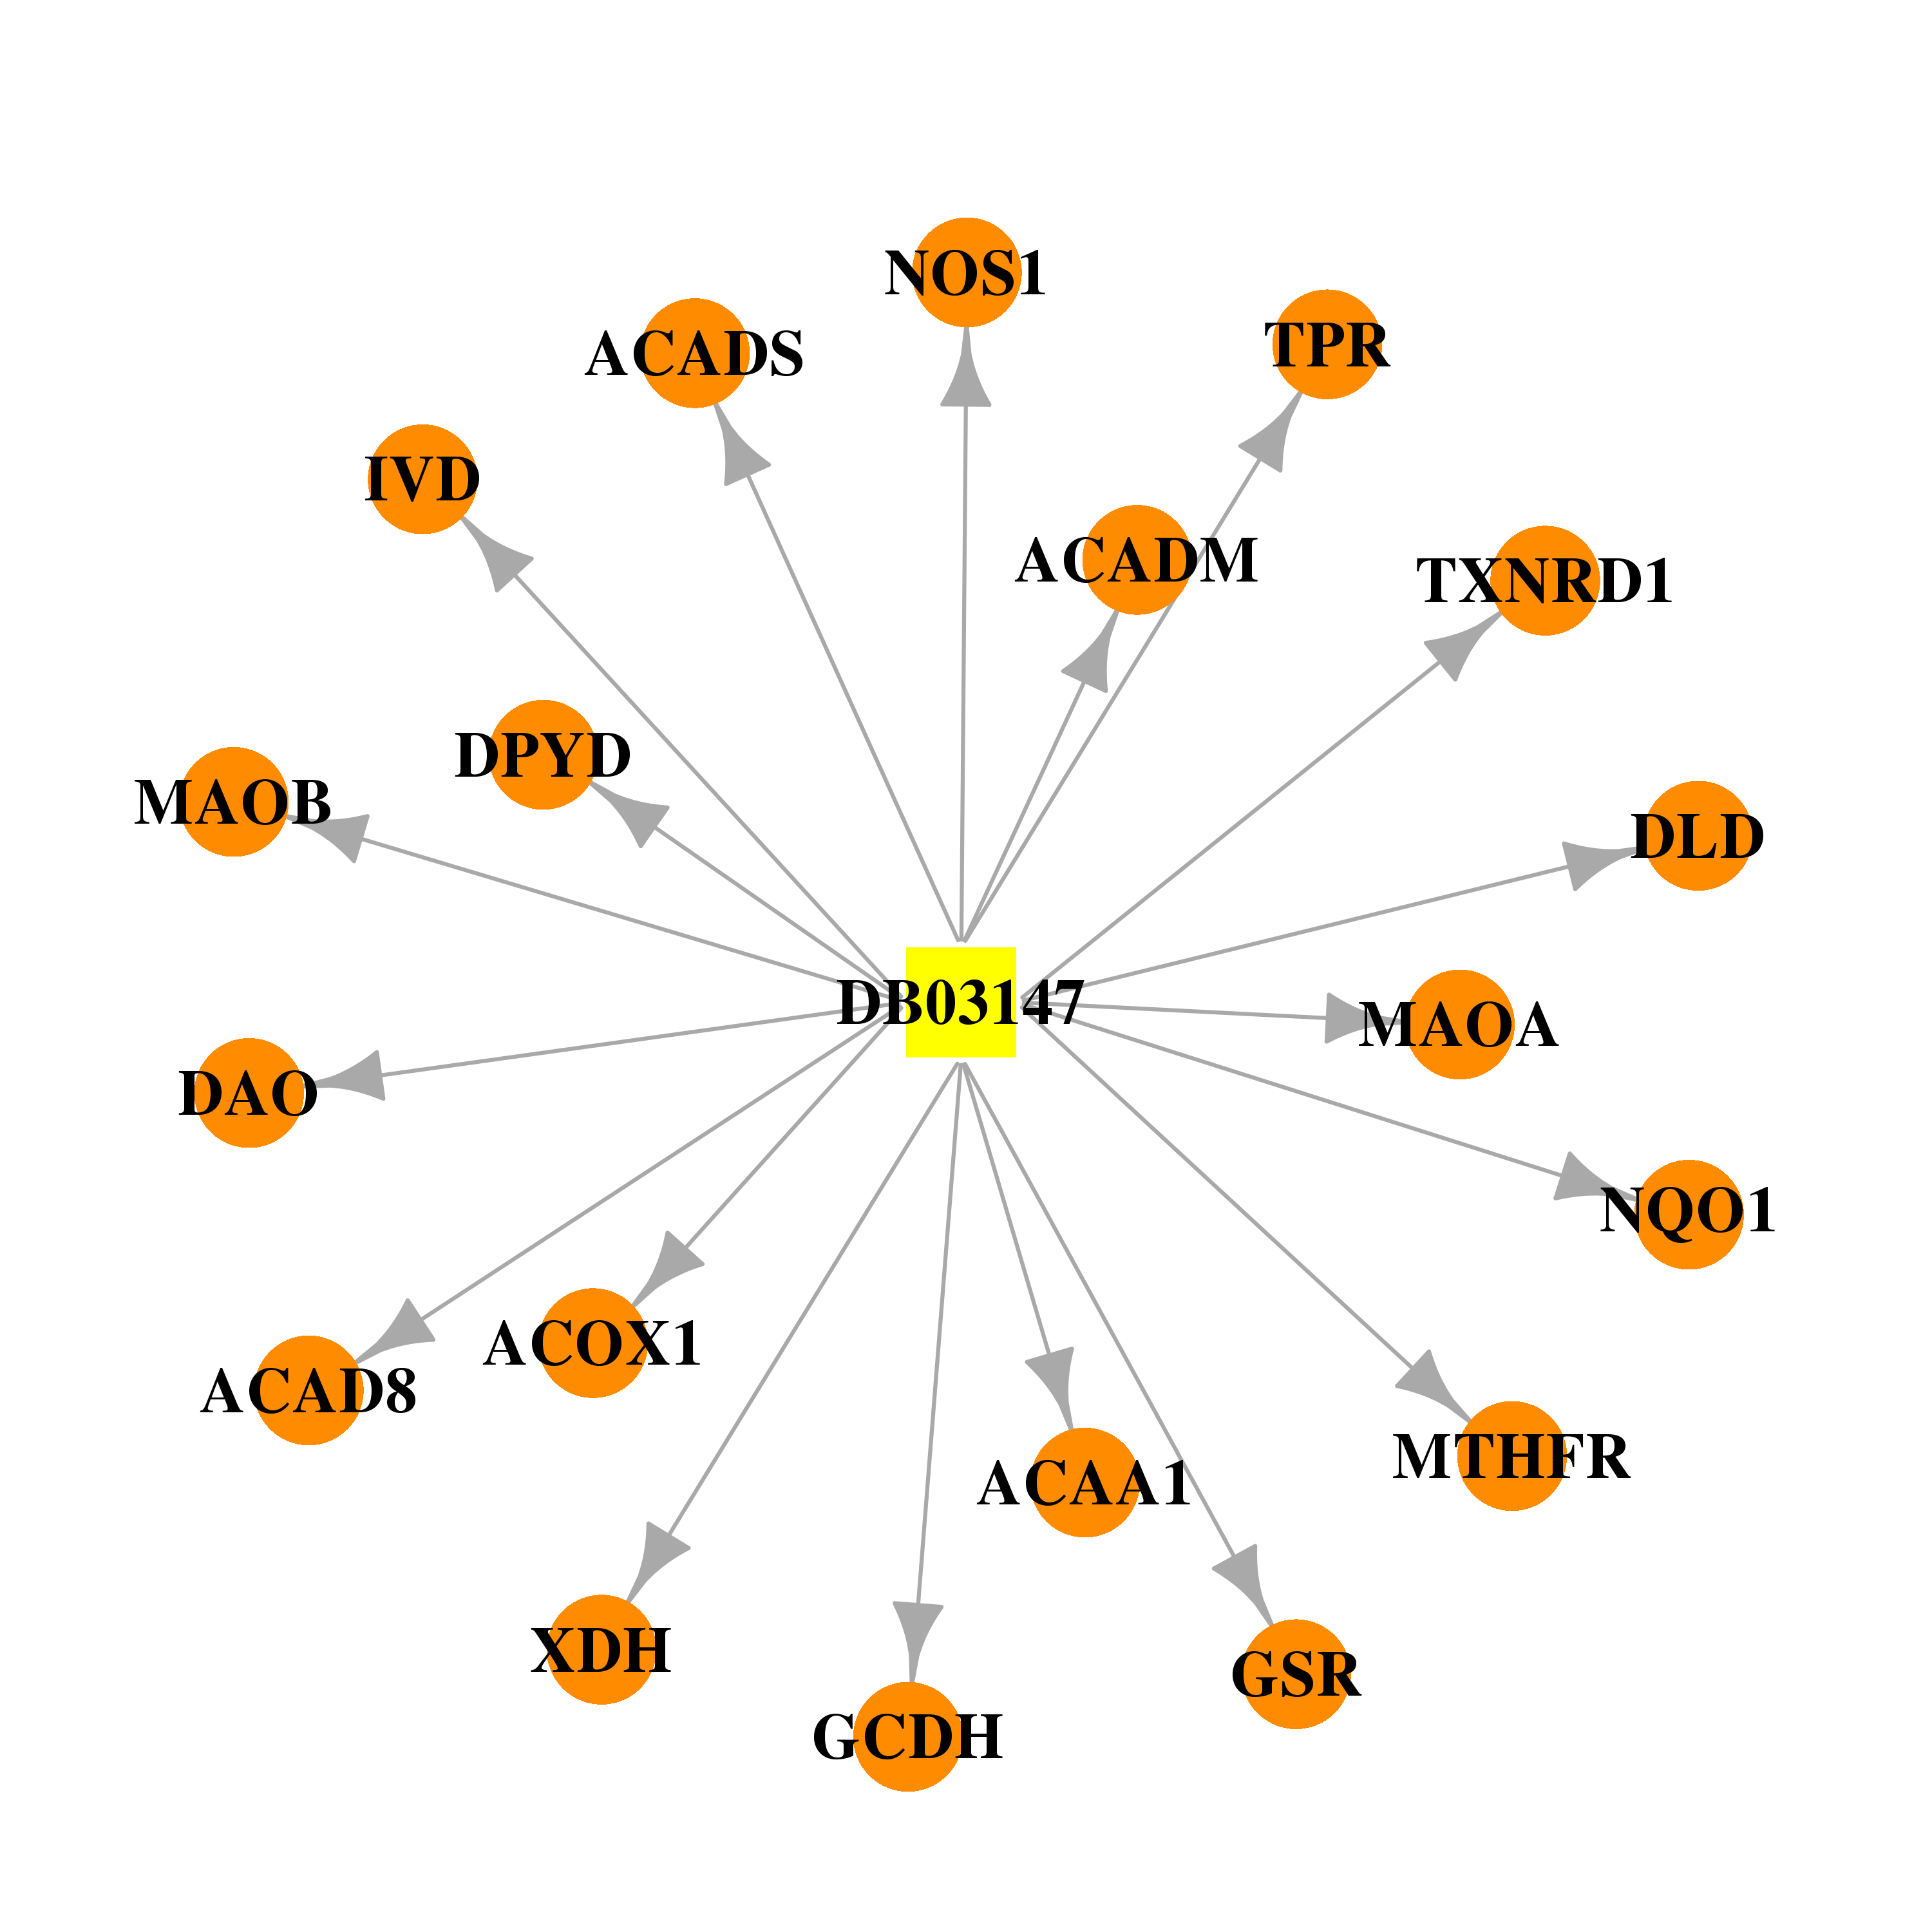 |  |
| Top |
| Cross referenced IDs for DLD |
| * We obtained these cross-references from Uniprot database. It covers 150 different DBs, 18 categories. http://www.uniprot.org/help/cross_references_section |
: Open all cross reference information
|
Copyright © 2016-Present - The Univsersity of Texas Health Science Center at Houston @ |