|
||||||||||||||||||||||||||||||||||||||||||||||||||||||||||||||||||||||||||||||||||||||||||||||||||||||||||||||||||||||||||||||||||||||||||||||||||||||||||||||||||||||||||||||||||||||||||||||||||||||||||||||||||||||||||||||||||||||||||||||||||||||||||||||||||||||||||||||||||||||||||||||||||||||||||||||||||||||||||
| |
| Phenotypic Information (metabolism pathway, cancer, disease, phenome) |
| |
| |
| Gene-Gene Network Information: Co-Expression Network, Interacting Genes & KEGG |
| |
|


| Gene Summary for SARDH |
| Top |
| Phenotypic Information for SARDH(metabolism pathway, cancer, disease, phenome) |
| Cancer | CGAP: SARDH |
| Familial Cancer Database: SARDH | |
| * This gene is included in those cancer gene databases. |
|
|
|
|
|
| . | ||||||||||||||||||||||||||||||||||||||||||||||||||||||||||||||||||||||||||||||||||||||||||||||||||||||||||||||||||||||||||||||||||||||||||||||||||||||||||||||||||||||||||||||||||||||||||||||||||||||||||||||||||||||||||||||||||||||||||||||||||||||||||||||||||||||||||||||||||||||||||||||||||||||||||||||||||||
Oncogene 1 | Significant driver gene in | |||||||||||||||||||||||||||||||||||||||||||||||||||||||||||||||||||||||||||||||||||||||||||||||||||||||||||||||||||||||||||||||||||||||||||||||||||||||||||||||||||||||||||||||||||||||||||||||||||||||||||||||||||||||||||||||||||||||||||||||||||||||||||||||||||||||||||||||||||||||||||||||||||||||||||||||||||||||||
| cf) number; DB name 1 Oncogene; http://nar.oxfordjournals.org/content/35/suppl_1/D721.long, 2 Tumor Suppressor gene; https://bioinfo.uth.edu/TSGene/, 3 Cancer Gene Census; http://www.nature.com/nrc/journal/v4/n3/abs/nrc1299.html, 4 CancerGenes; http://nar.oxfordjournals.org/content/35/suppl_1/D721.long, 5 Network of Cancer Gene; http://ncg.kcl.ac.uk/index.php, 1Therapeutic Vulnerabilities in Cancer; http://cbio.mskcc.org/cancergenomics/statius/ |
| KEGG_GLYCINE_SERINE_AND_THREONINE_METABOLISM | |
| OMIM | |
| Orphanet | |
| Disease | KEGG Disease: SARDH |
| MedGen: SARDH (Human Medical Genetics with Condition) | |
| ClinVar: SARDH | |
| Phenotype | MGI: SARDH (International Mouse Phenotyping Consortium) |
| PhenomicDB: SARDH | |
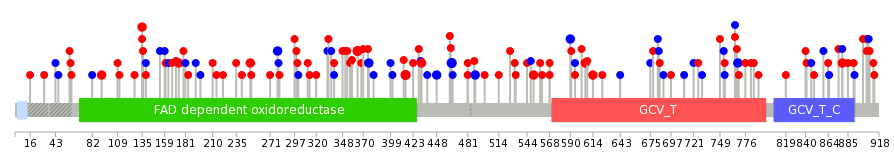
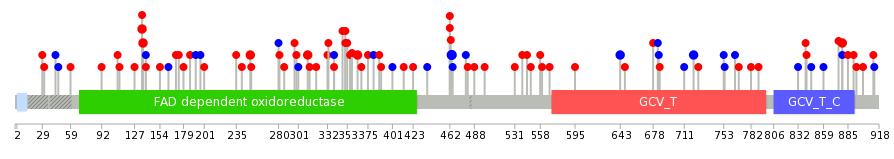
| Mutations for SARDH |
| * Under tables are showing count per each tissue to give us broad intuition about tissue specific mutation patterns.You can go to the detailed page for each mutation database's web site. |
| There's no structural variation information in COSMIC data for this gene. |
| * From mRNA Sanger sequences, Chitars2.0 arranged chimeric transcripts. This table shows SARDH related fusion information. |
| ID | Head Gene | Tail Gene | Accession | Gene_a | qStart_a | qEnd_a | Chromosome_a | tStart_a | tEnd_a | Gene_a | qStart_a | qEnd_a | Chromosome_a | tStart_a | tEnd_a |
| BC033217 | SARDH | 17 | 116 | 9 | 136578209 | 136582509 | SARDH | 109 | 2167 | 9 | 136528682 | 136578219 | |
| DA839467 | RASAL2 | 1 | 151 | 1 | 178443120 | 178443270 | SARDH | 152 | 554 | 9 | 136559458 | 136567650 | |
| Top |
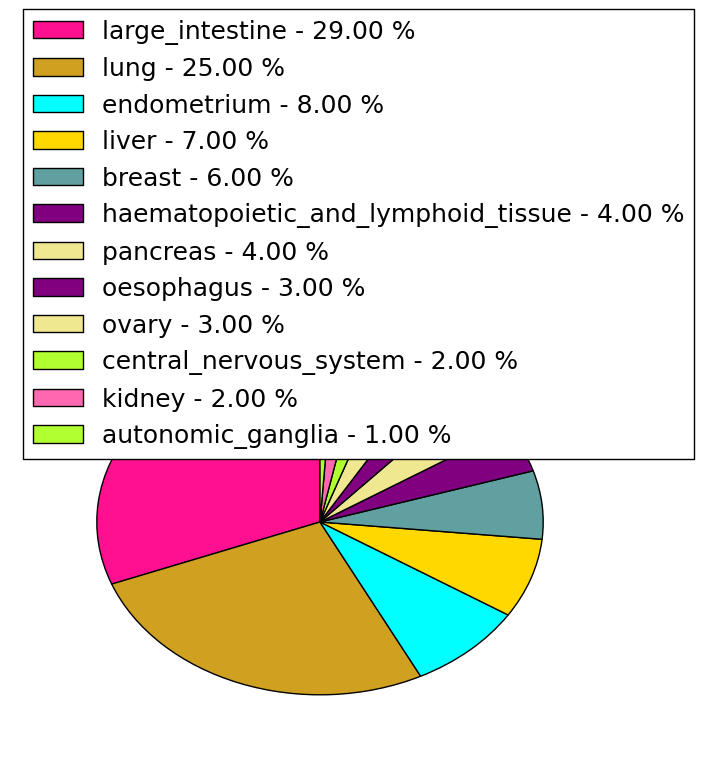
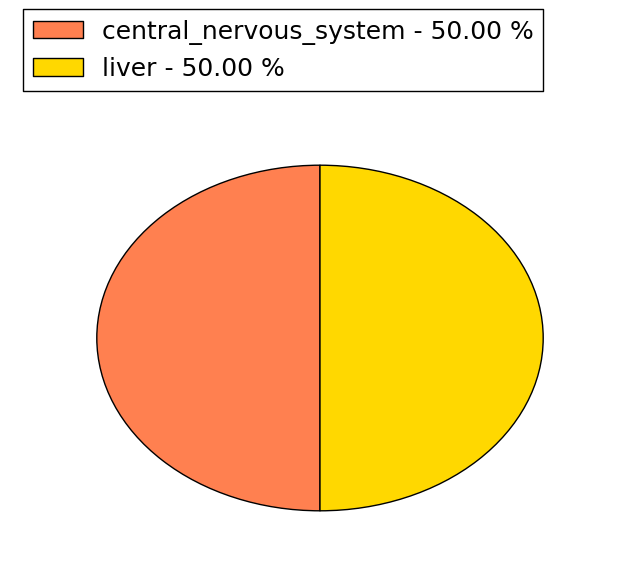
| Mutation type/ Tissue ID | brca | cns | cerv | endome | haematopo | kidn | Lintest | liver | lung | ns | ovary | pancre | prost | skin | stoma | thyro | urina | |||
| Total # sample | 2 | 1 | 2 | 1 | 1 | 1 | 1 | |||||||||||||
| GAIN (# sample) | 1 | 1 | ||||||||||||||||||
| LOSS (# sample) | 1 | 1 | 2 | 1 | 1 | 1 |
| cf) Tissue ID; Tissue type (1; Breast, 2; Central_nervous_system, 3; Cervix, 4; Endometrium, 5; Haematopoietic_and_lymphoid_tissue, 6; Kidney, 7; Large_intestine, 8; Liver, 9; Lung, 10; NS, 11; Ovary, 12; Pancreas, 13; Prostate, 14; Skin, 15; Stomach, 16; Thyroid, 17; Urinary_tract) |
| Top |
|
 |
| Top |
| Stat. for Non-Synonymous SNVs (# total SNVs=82) | (# total SNVs=28) |
 |  |
(# total SNVs=2) | (# total SNVs=0) |
 |
| Top |
| * When you move the cursor on each content, you can see more deailed mutation information on the Tooltip. Those are primary_site,primary_histology,mutation(aa),pubmedID. |
| GRCh37 position | Mutation(aa) | Unique sampleID count |
| chr9:136573487-136573487 | p.Y464Y | 3 |
| chr9:136577826-136577826 | p.M415L | 3 |
| chr9:136582508-136582508 | p.A364T | 3 |
| chr9:136595252-136595252 | p.R250W | 2 |
| chr9:136577775-136577775 | p.R432C | 2 |
| chr9:136596596-136596596 | p.A174V | 2 |
| chr9:136582470-136582470 | p.I376I | 2 |
| chr9:136529132-136529132 | p.S879L | 2 |
| chr9:136584065-136584065 | p.E339* | 2 |
| chr9:136599022-136599022 | p.G92R | 2 |
| Top |
|
 |
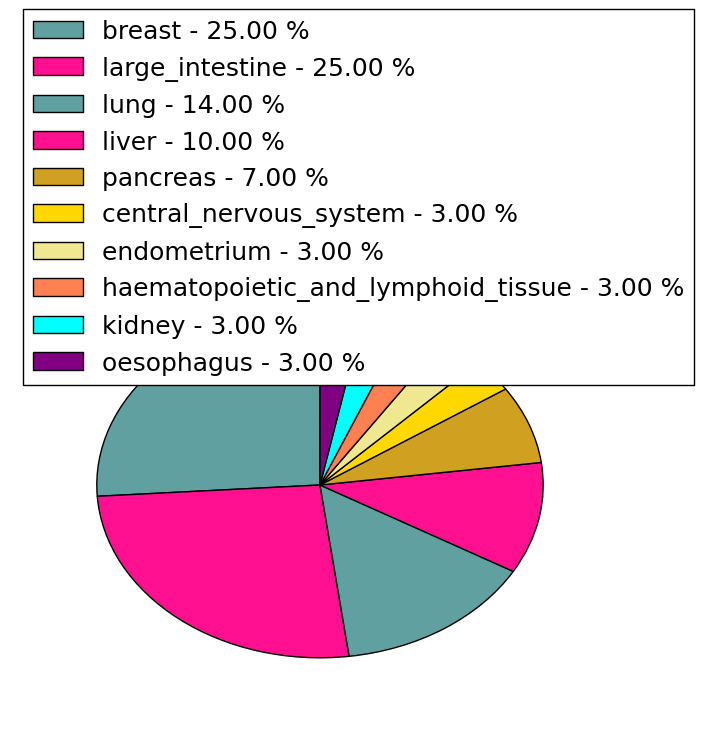
| Point Mutation/ Tissue ID | 1 | 2 | 3 | 4 | 5 | 6 | 7 | 8 | 9 | 10 | 11 | 12 | 13 | 14 | 15 | 16 | 17 | 18 | 19 | 20 |
| # sample | 3 | 5 | 19 | 1 | 5 | 4 | 9 | 7 | 2 | 1 | 2 | 16 | 13 | 1 | 6 | |||||
| # mutation | 3 | 5 | 20 | 1 | 6 | 4 | 9 | 7 | 2 | 1 | 2 | 24 | 17 | 1 | 7 | |||||
| nonsynonymous SNV | 2 | 15 | 1 | 5 | 3 | 7 | 7 | 2 | 1 | 2 | 17 | 10 | 1 | 6 | ||||||
| synonymous SNV | 3 | 3 | 5 | 1 | 1 | 2 | 7 | 7 | 1 |
| cf) Tissue ID; Tissue type (1; BLCA[Bladder Urothelial Carcinoma], 2; BRCA[Breast invasive carcinoma], 3; CESC[Cervical squamous cell carcinoma and endocervical adenocarcinoma], 4; COAD[Colon adenocarcinoma], 5; GBM[Glioblastoma multiforme], 6; Glioma Low Grade, 7; HNSC[Head and Neck squamous cell carcinoma], 8; KICH[Kidney Chromophobe], 9; KIRC[Kidney renal clear cell carcinoma], 10; KIRP[Kidney renal papillary cell carcinoma], 11; LAML[Acute Myeloid Leukemia], 12; LUAD[Lung adenocarcinoma], 13; LUSC[Lung squamous cell carcinoma], 14; OV[Ovarian serous cystadenocarcinoma ], 15; PAAD[Pancreatic adenocarcinoma], 16; PRAD[Prostate adenocarcinoma], 17; SKCM[Skin Cutaneous Melanoma], 18:STAD[Stomach adenocarcinoma], 19:THCA[Thyroid carcinoma], 20:UCEC[Uterine Corpus Endometrial Carcinoma]) |
| Top |
| * We represented just top 10 SNVs. When you move the cursor on each content, you can see more deailed mutation information on the Tooltip. Those are primary_site, primary_histology, mutation(aa), pubmedID. |
| Genomic Position | Mutation(aa) | Unique sampleID count |
| chr9:136573487 | p.Y464Y,SARDH | 3 |
| chr9:136550315 | p.R311C,SARDH | 2 |
| chr9:136595252 | p.L721L,SARDH | 2 |
| chr9:136582508 | p.S879L,SARDH | 2 |
| chr9:136597638 | p.A364T,SARDH | 2 |
| chr9:136597649 | p.E139E,SARDH | 2 |
| chr9:136584149 | p.E136K,SARDH | 2 |
| chr9:136597651 | p.R135Q,SARDH | 2 |
| chr9:136529132 | p.R250W,SARDH | 2 |
| chr9:136561450 | p.G111D,SARDH | 1 |
| * Copy number data were extracted from TCGA using R package TCGA-Assembler. The URLs of all public data files on TCGA DCC data server were gathered on Jan-05-2015. Function ProcessCNAData in TCGA-Assembler package was used to obtain gene-level copy number value which is calculated as the average copy number of the genomic region of a gene. |
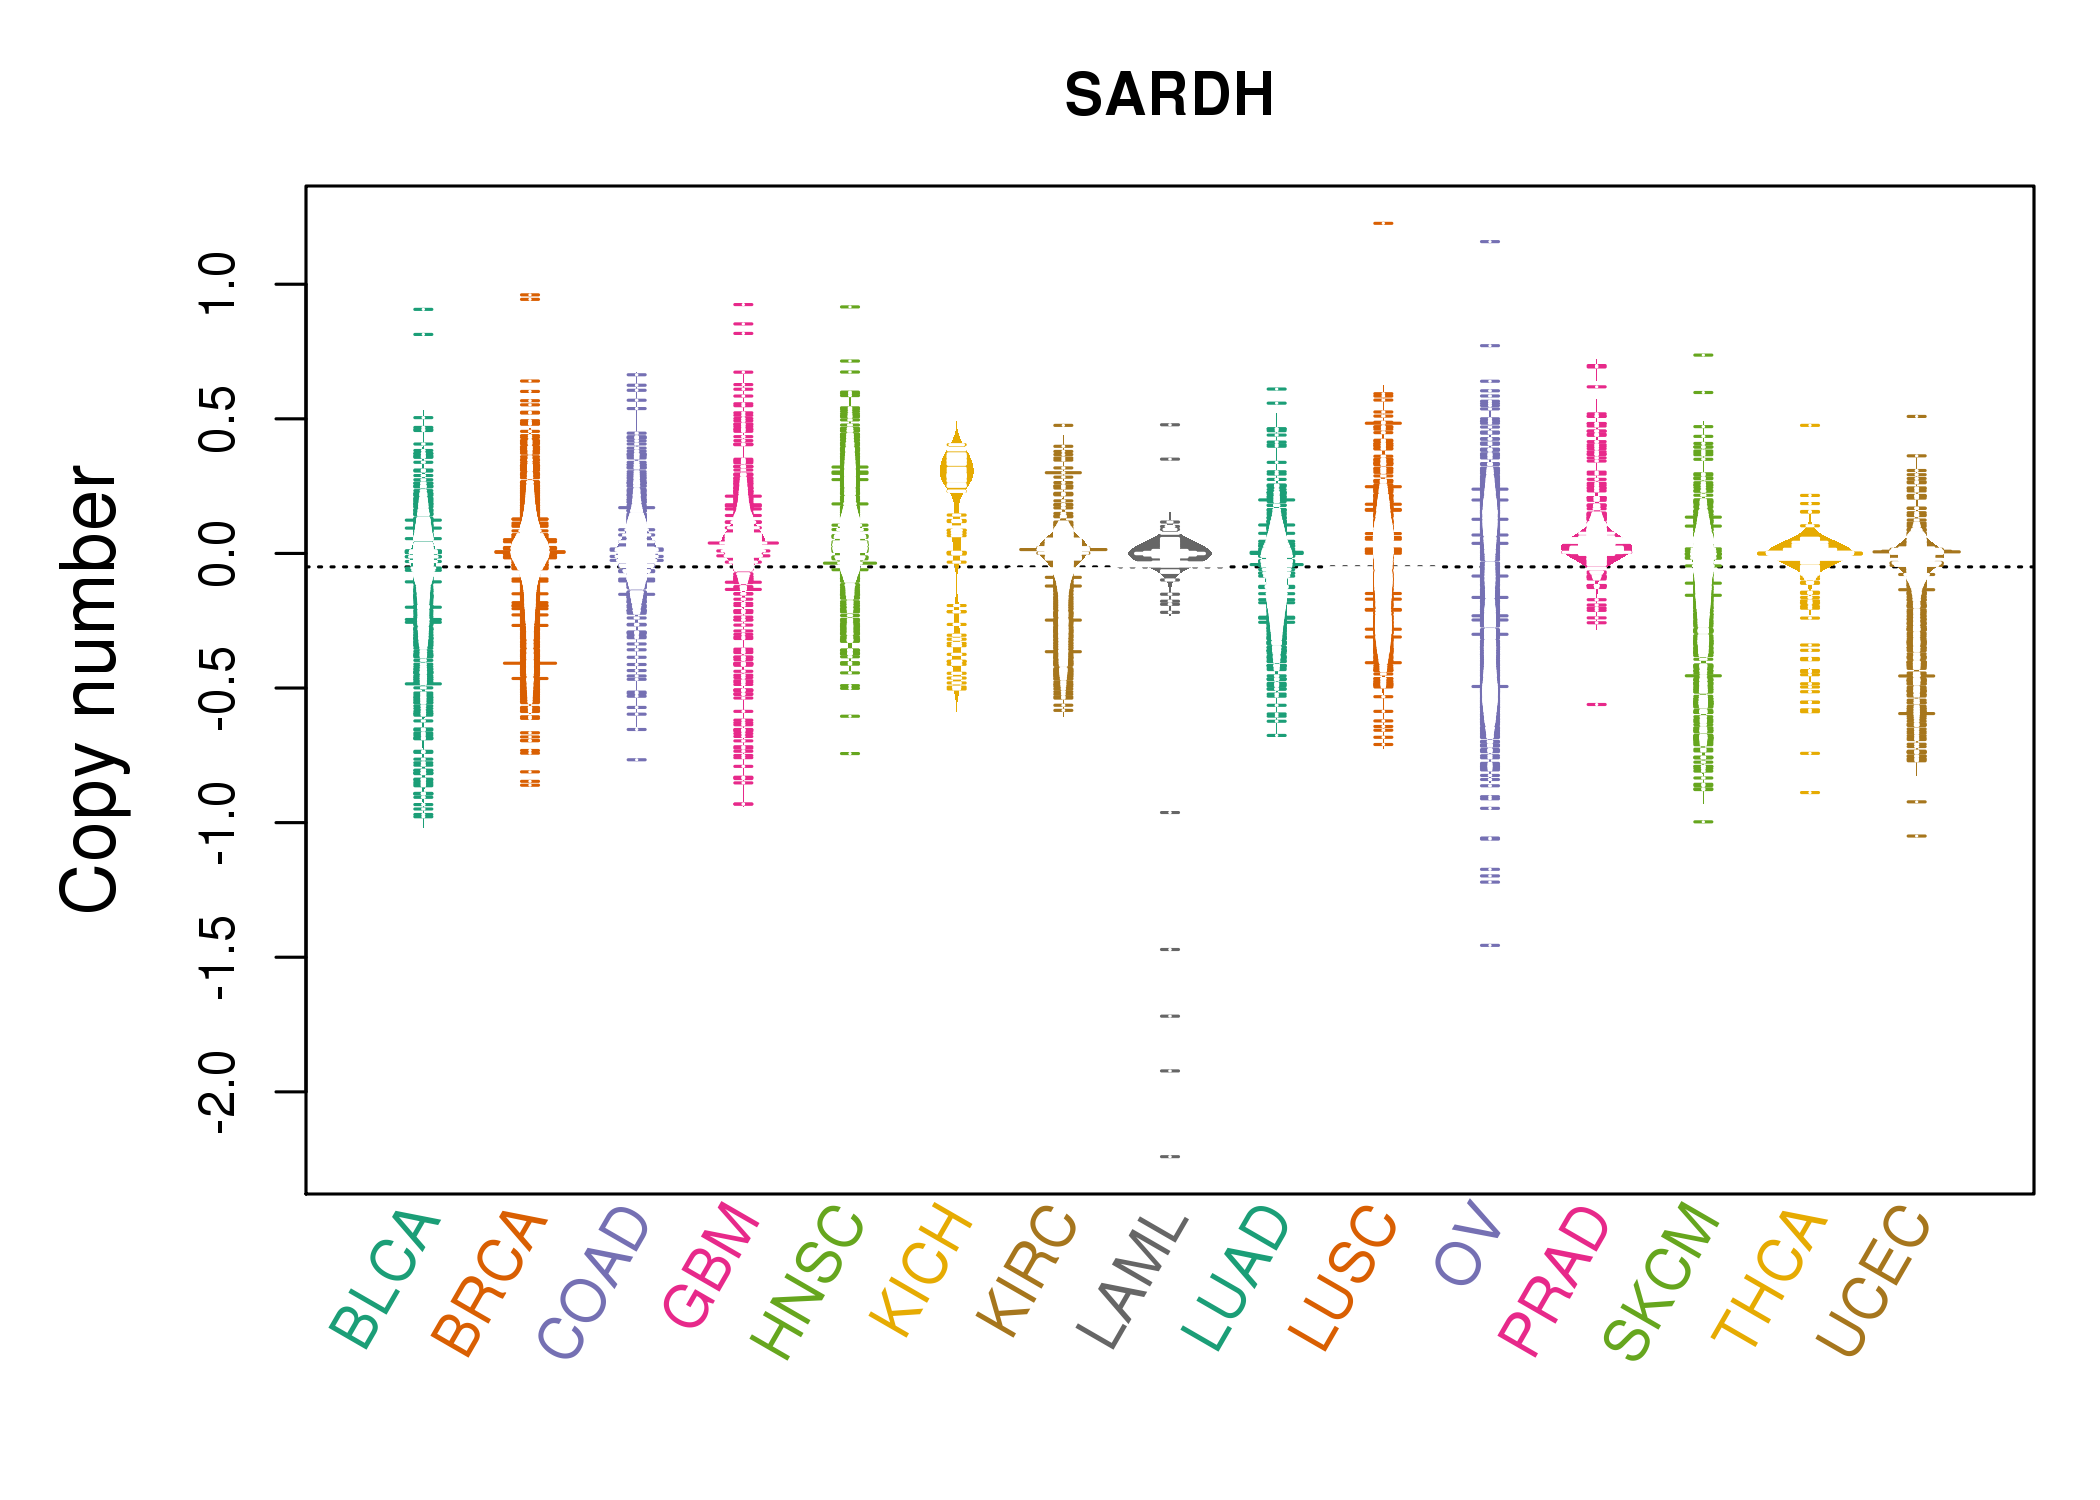 |
| cf) Tissue ID[Tissue type]: BLCA[Bladder Urothelial Carcinoma], BRCA[Breast invasive carcinoma], CESC[Cervical squamous cell carcinoma and endocervical adenocarcinoma], COAD[Colon adenocarcinoma], GBM[Glioblastoma multiforme], Glioma Low Grade, HNSC[Head and Neck squamous cell carcinoma], KICH[Kidney Chromophobe], KIRC[Kidney renal clear cell carcinoma], KIRP[Kidney renal papillary cell carcinoma], LAML[Acute Myeloid Leukemia], LUAD[Lung adenocarcinoma], LUSC[Lung squamous cell carcinoma], OV[Ovarian serous cystadenocarcinoma ], PAAD[Pancreatic adenocarcinoma], PRAD[Prostate adenocarcinoma], SKCM[Skin Cutaneous Melanoma], STAD[Stomach adenocarcinoma], THCA[Thyroid carcinoma], UCEC[Uterine Corpus Endometrial Carcinoma] |
| Top |
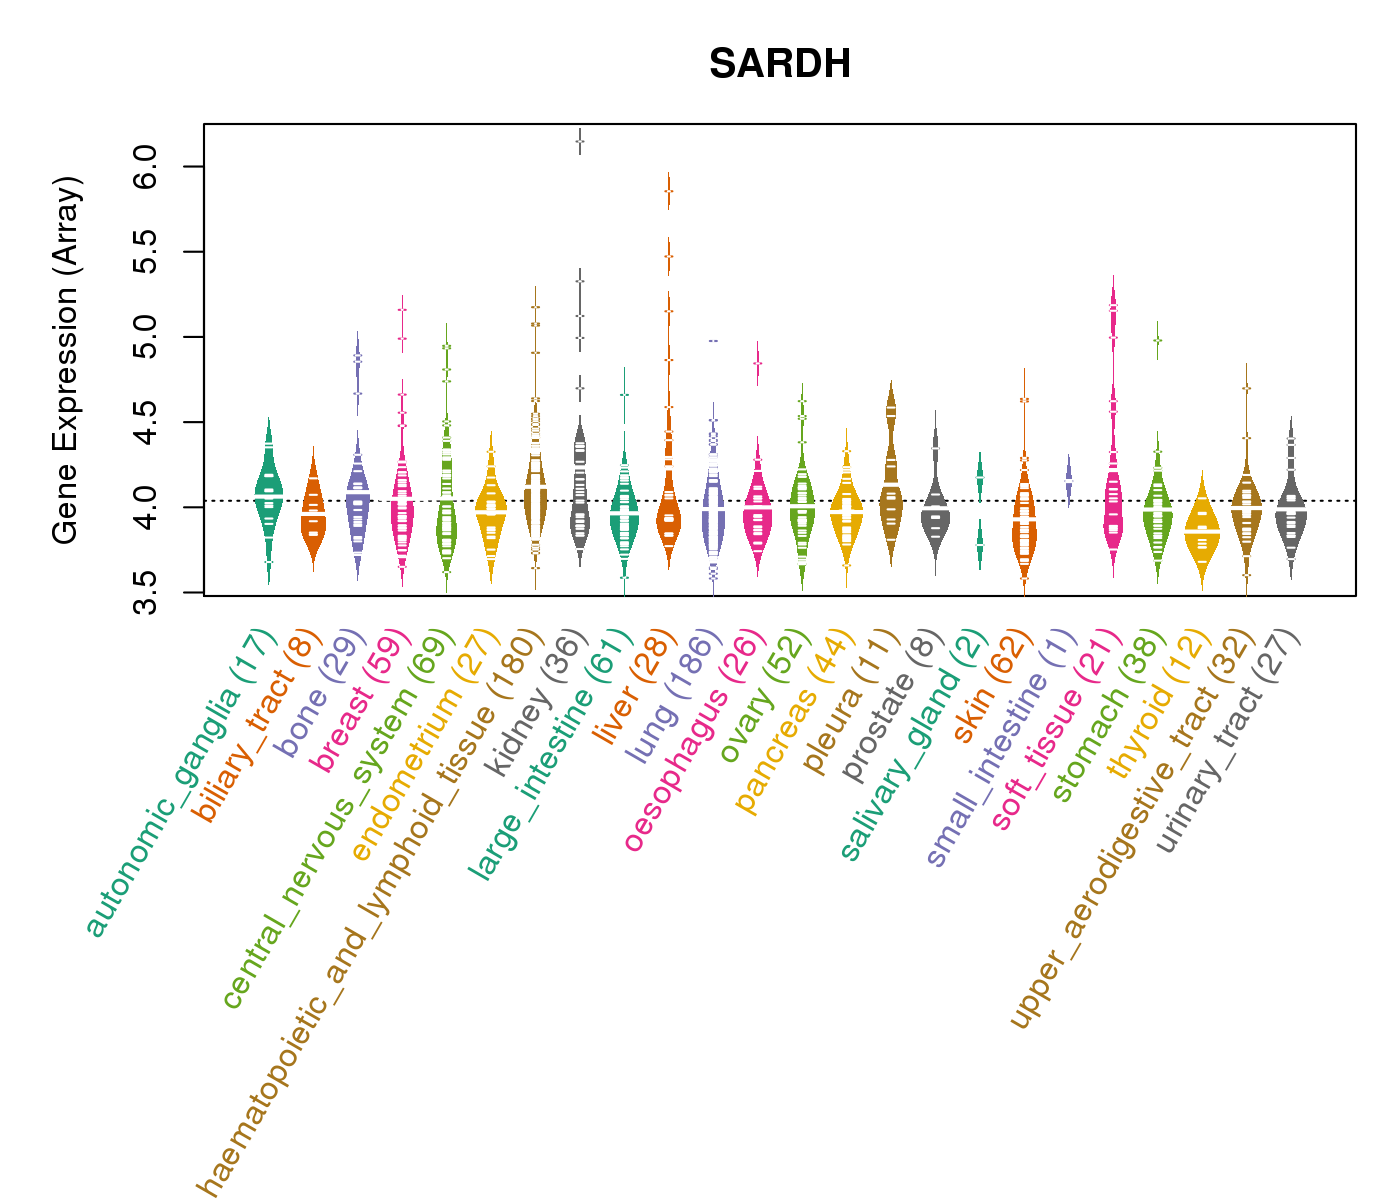
| Gene Expression for SARDH |
| * CCLE gene expression data were extracted from CCLE_Expression_Entrez_2012-10-18.res: Gene-centric RMA-normalized mRNA expression data. |
 |
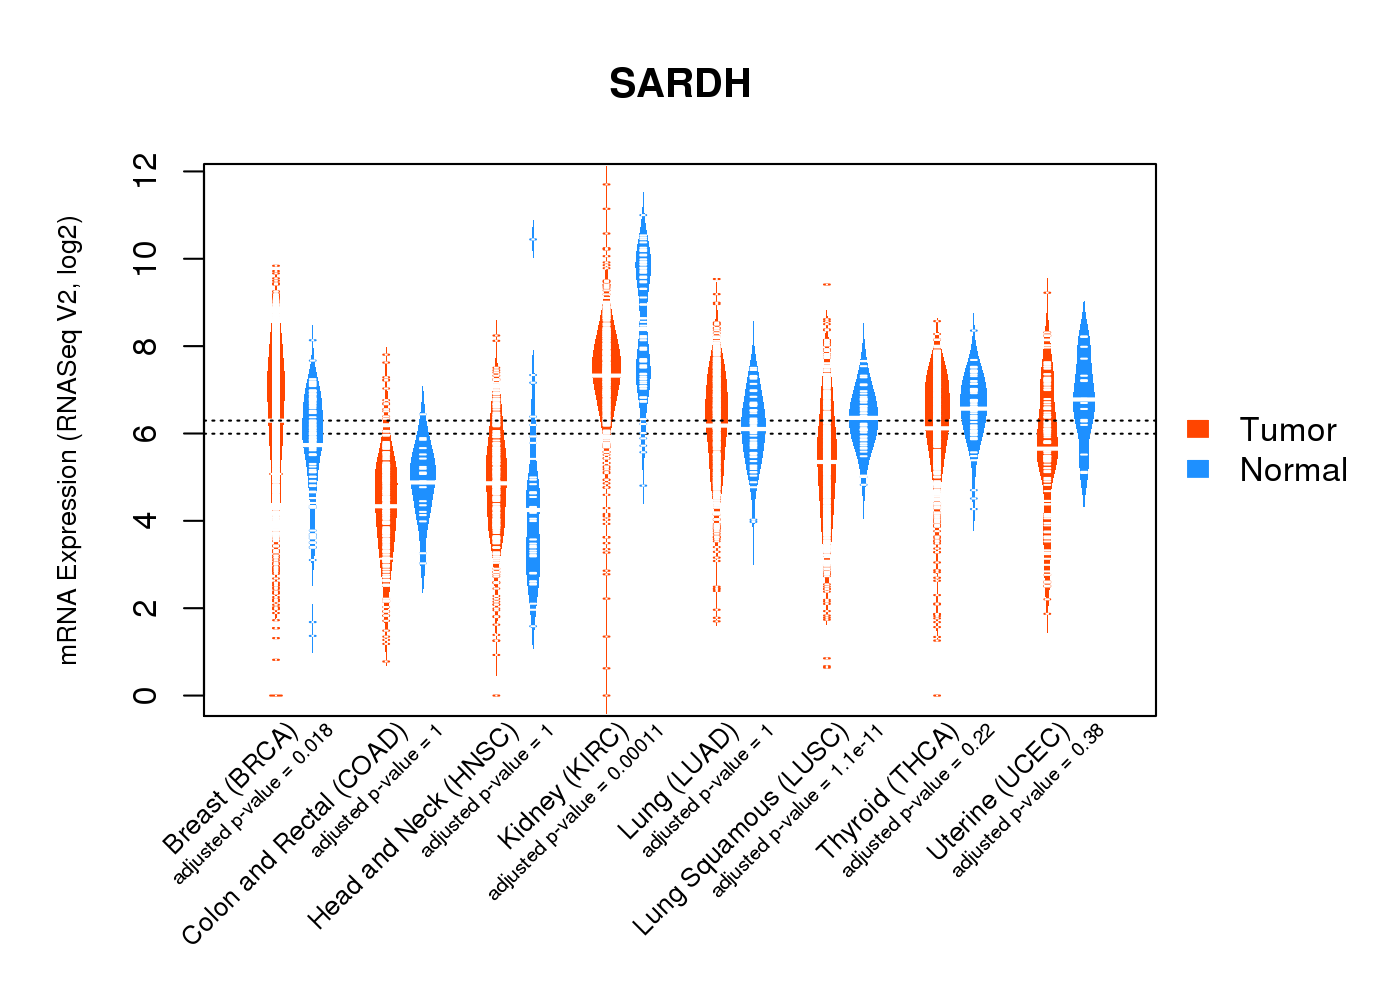
| * Normalized gene expression data of RNASeqV2 was extracted from TCGA using R package TCGA-Assembler. The URLs of all public data files on TCGA DCC data server were gathered at Jan-05-2015. Only eight cancer types have enough normal control samples for differential expression analysis. (t test, adjusted p<0.05 (using Benjamini-Hochberg FDR)) |
 |
| Top |
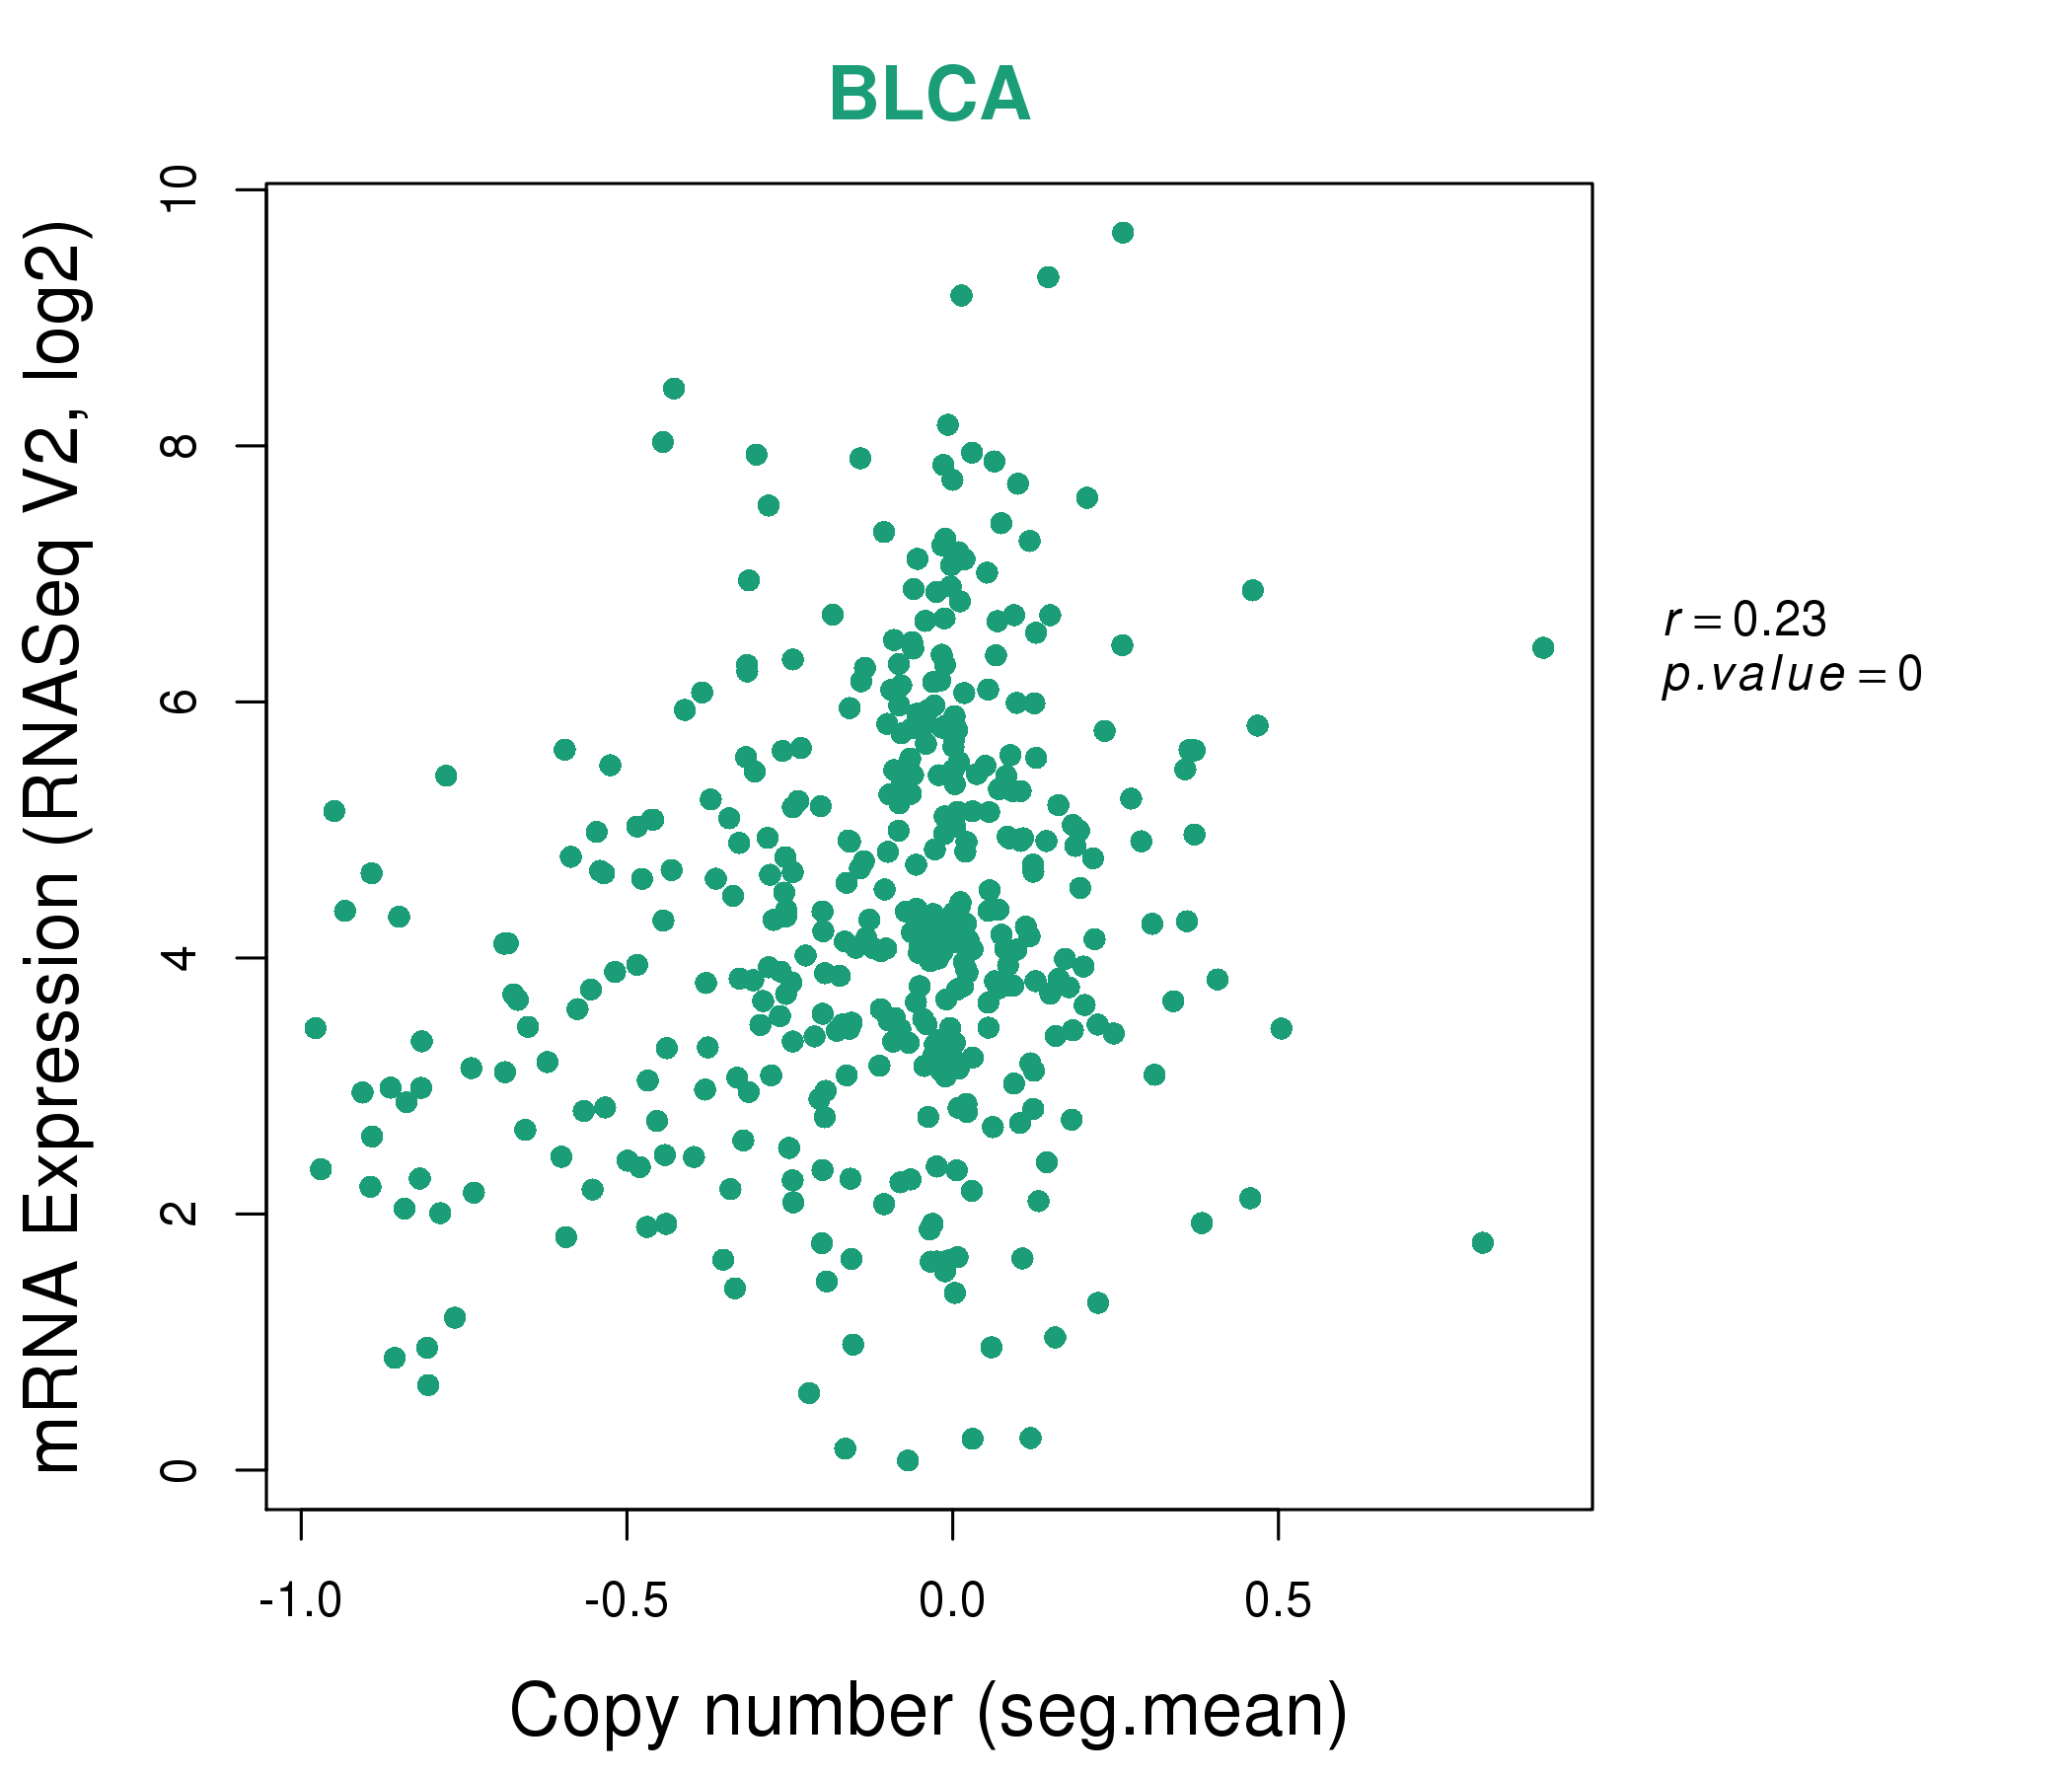
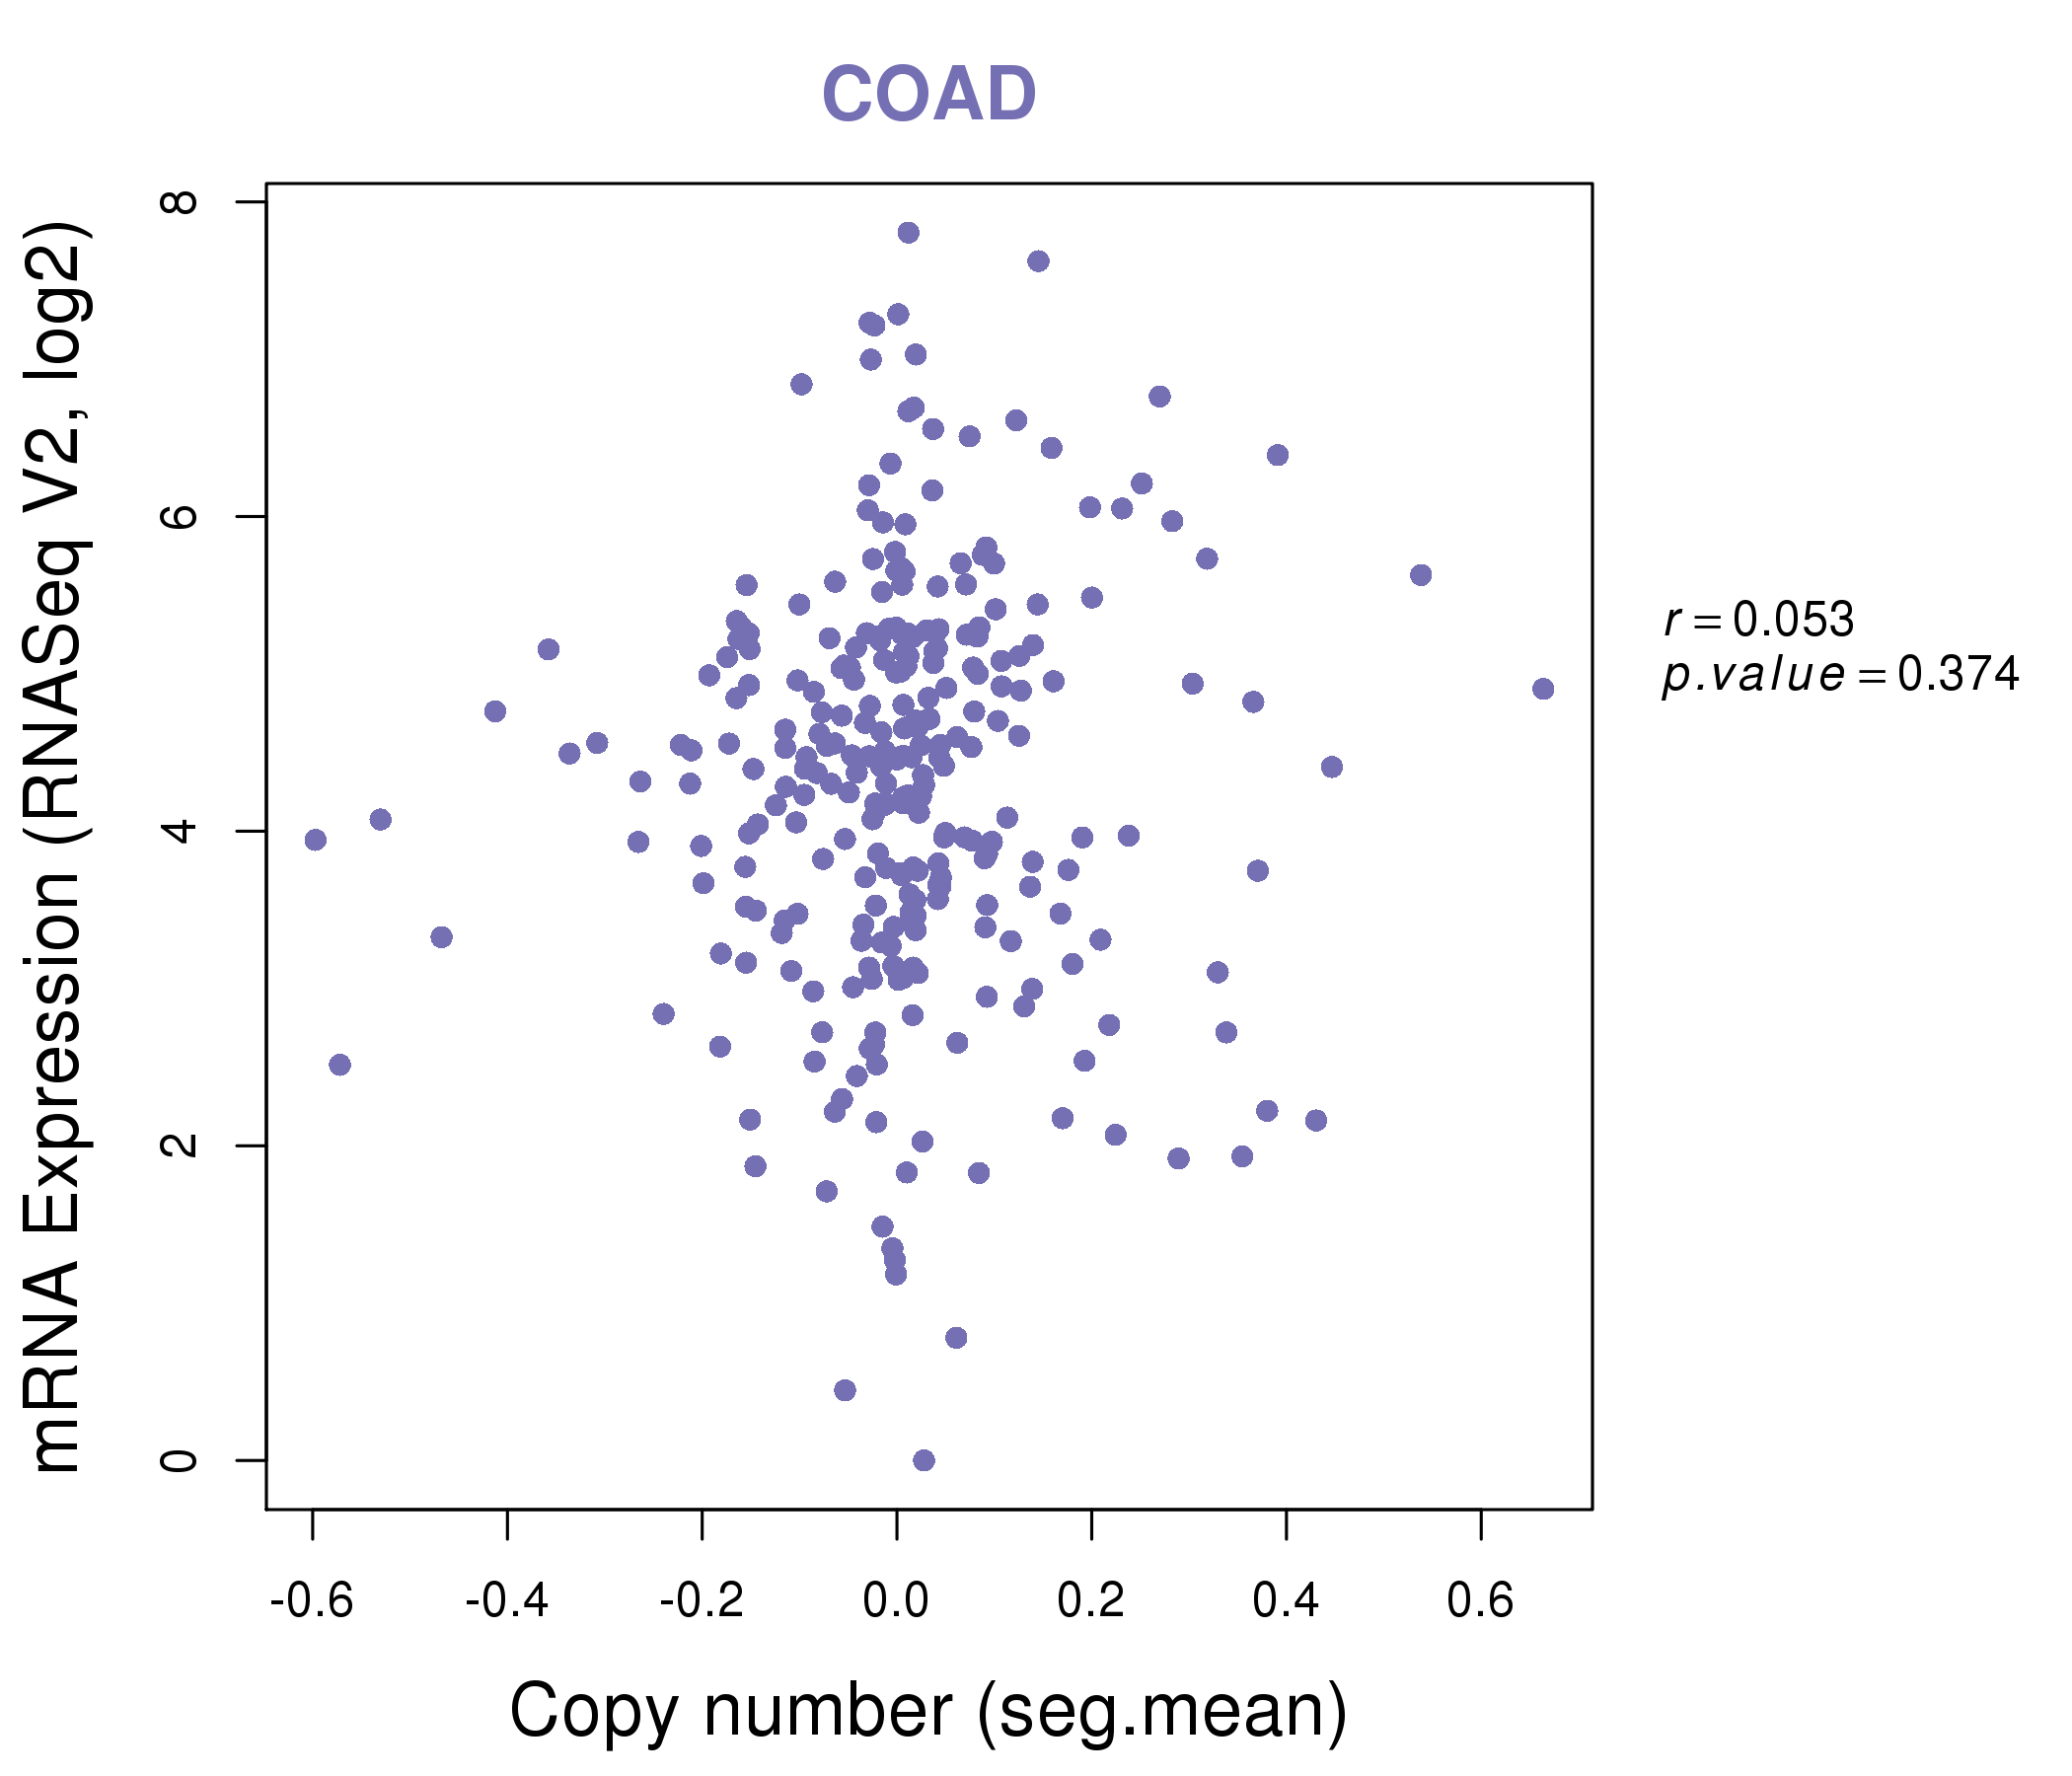
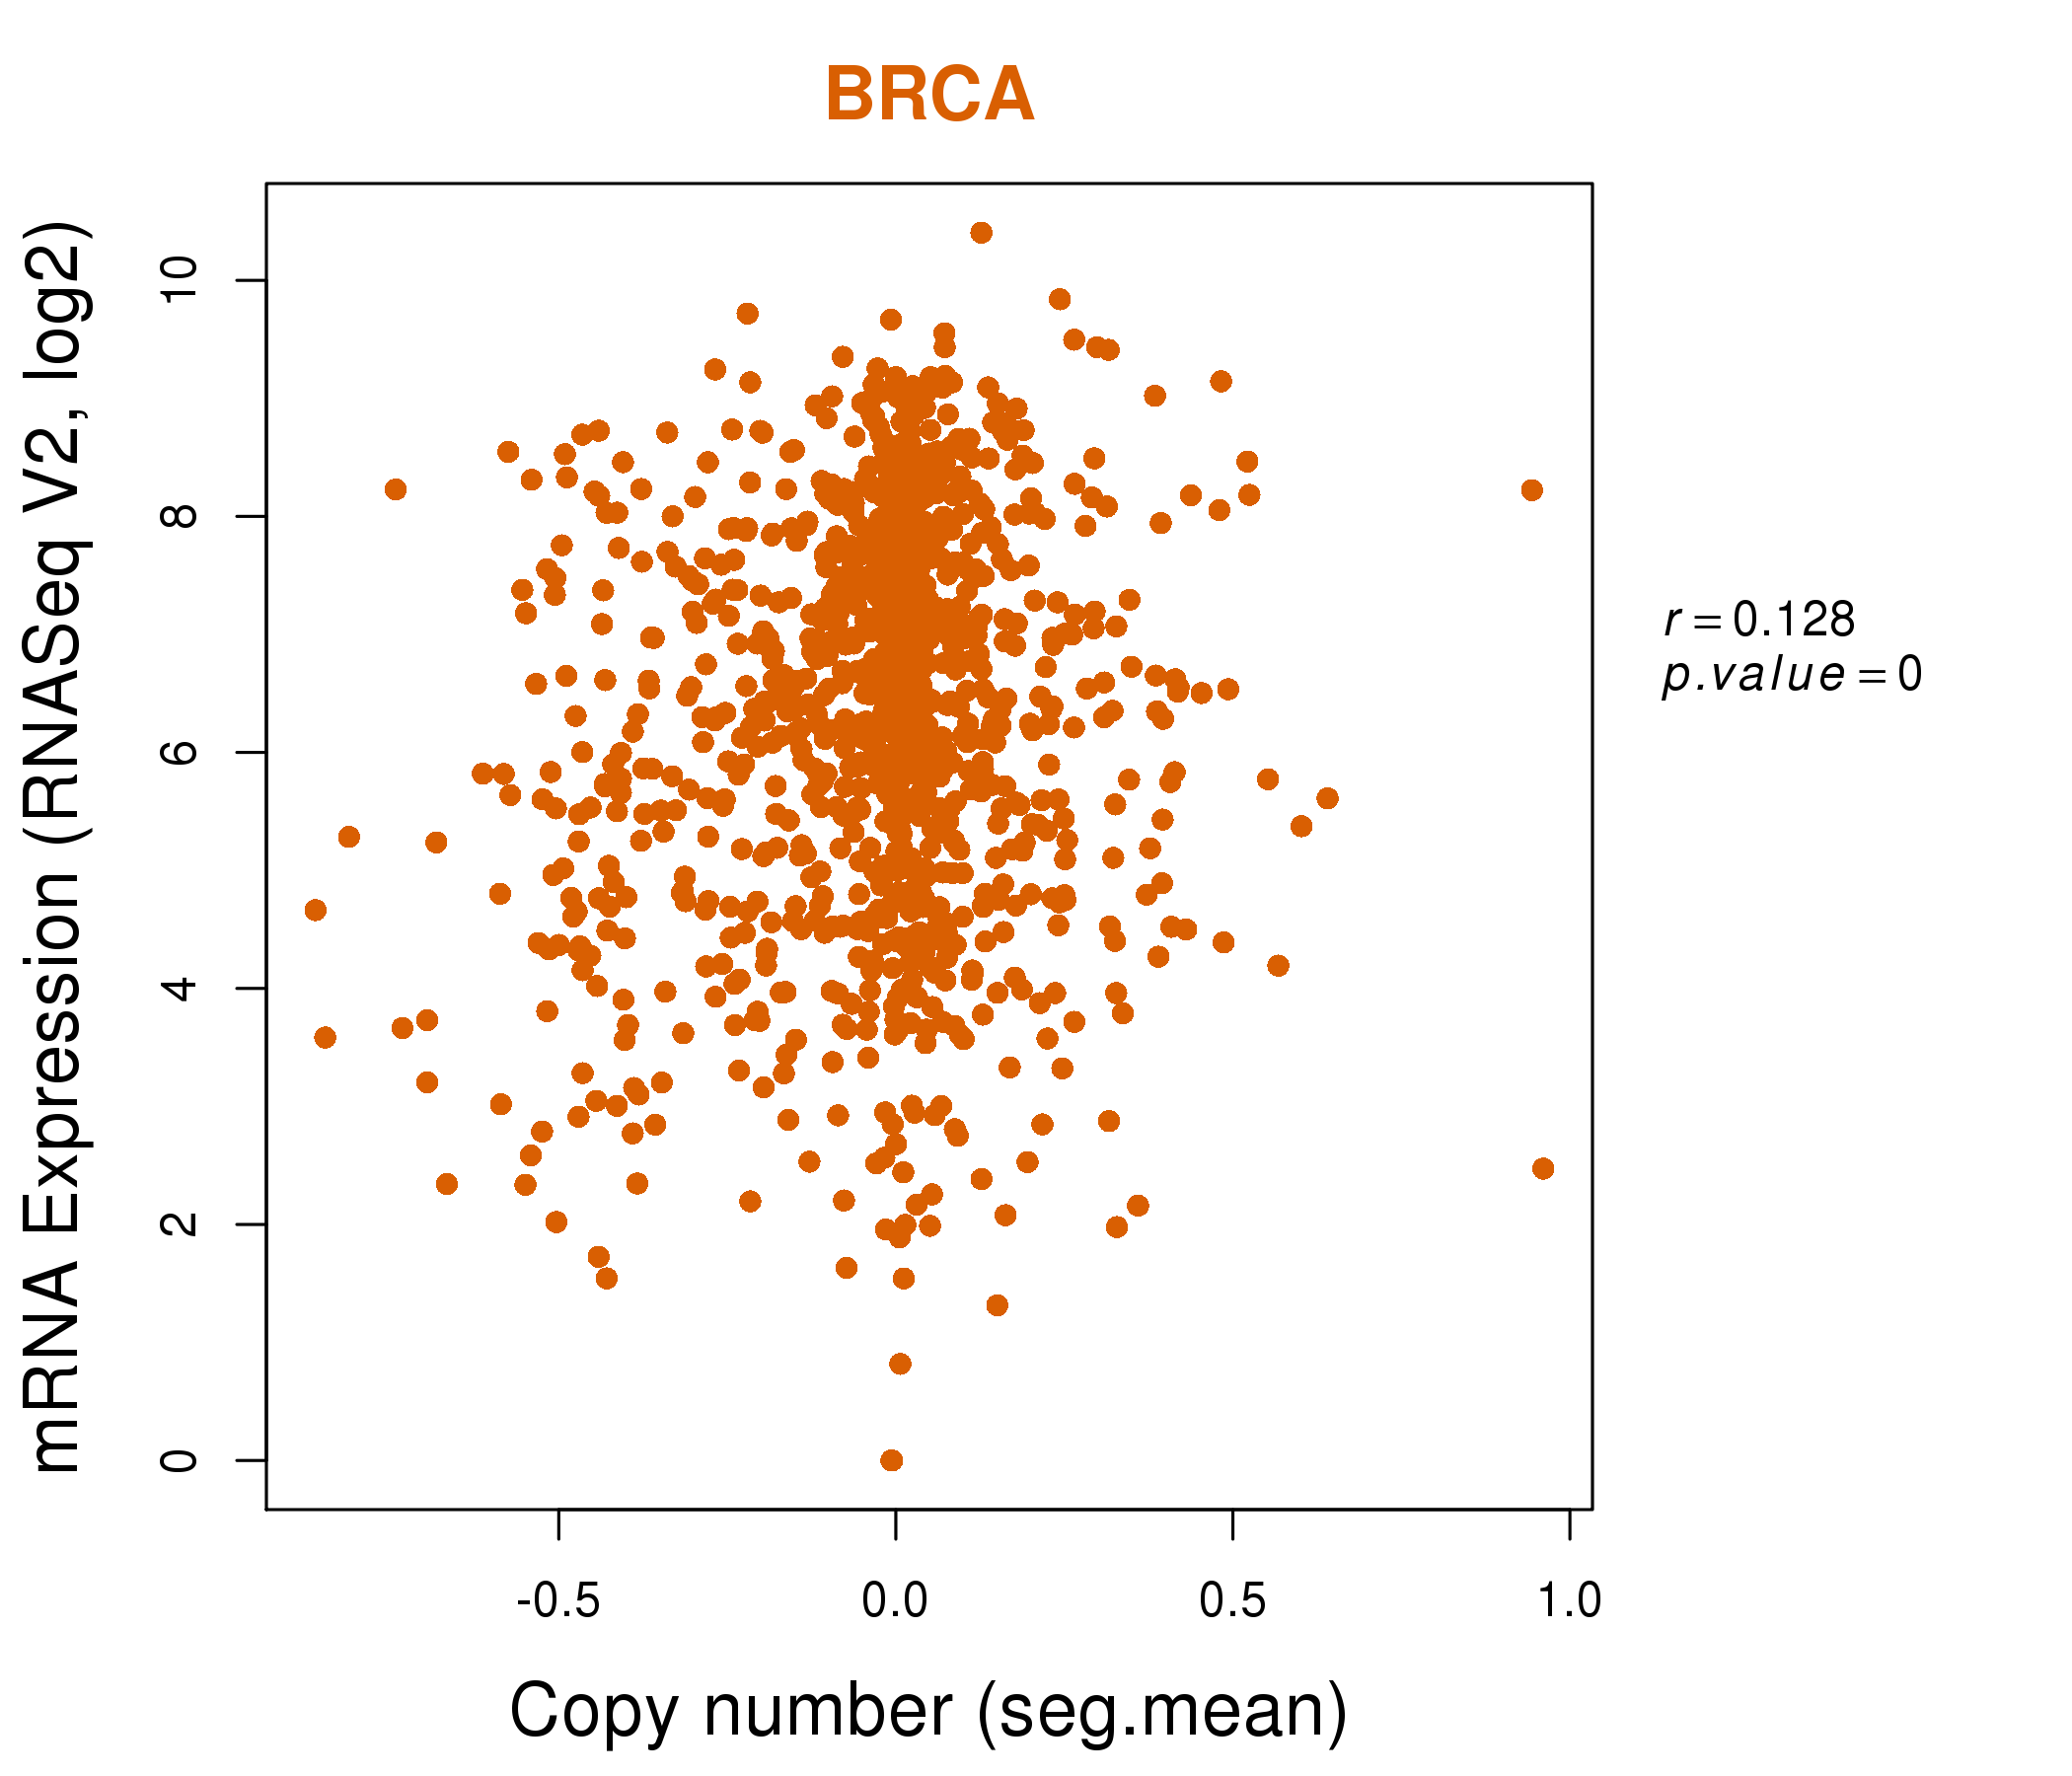
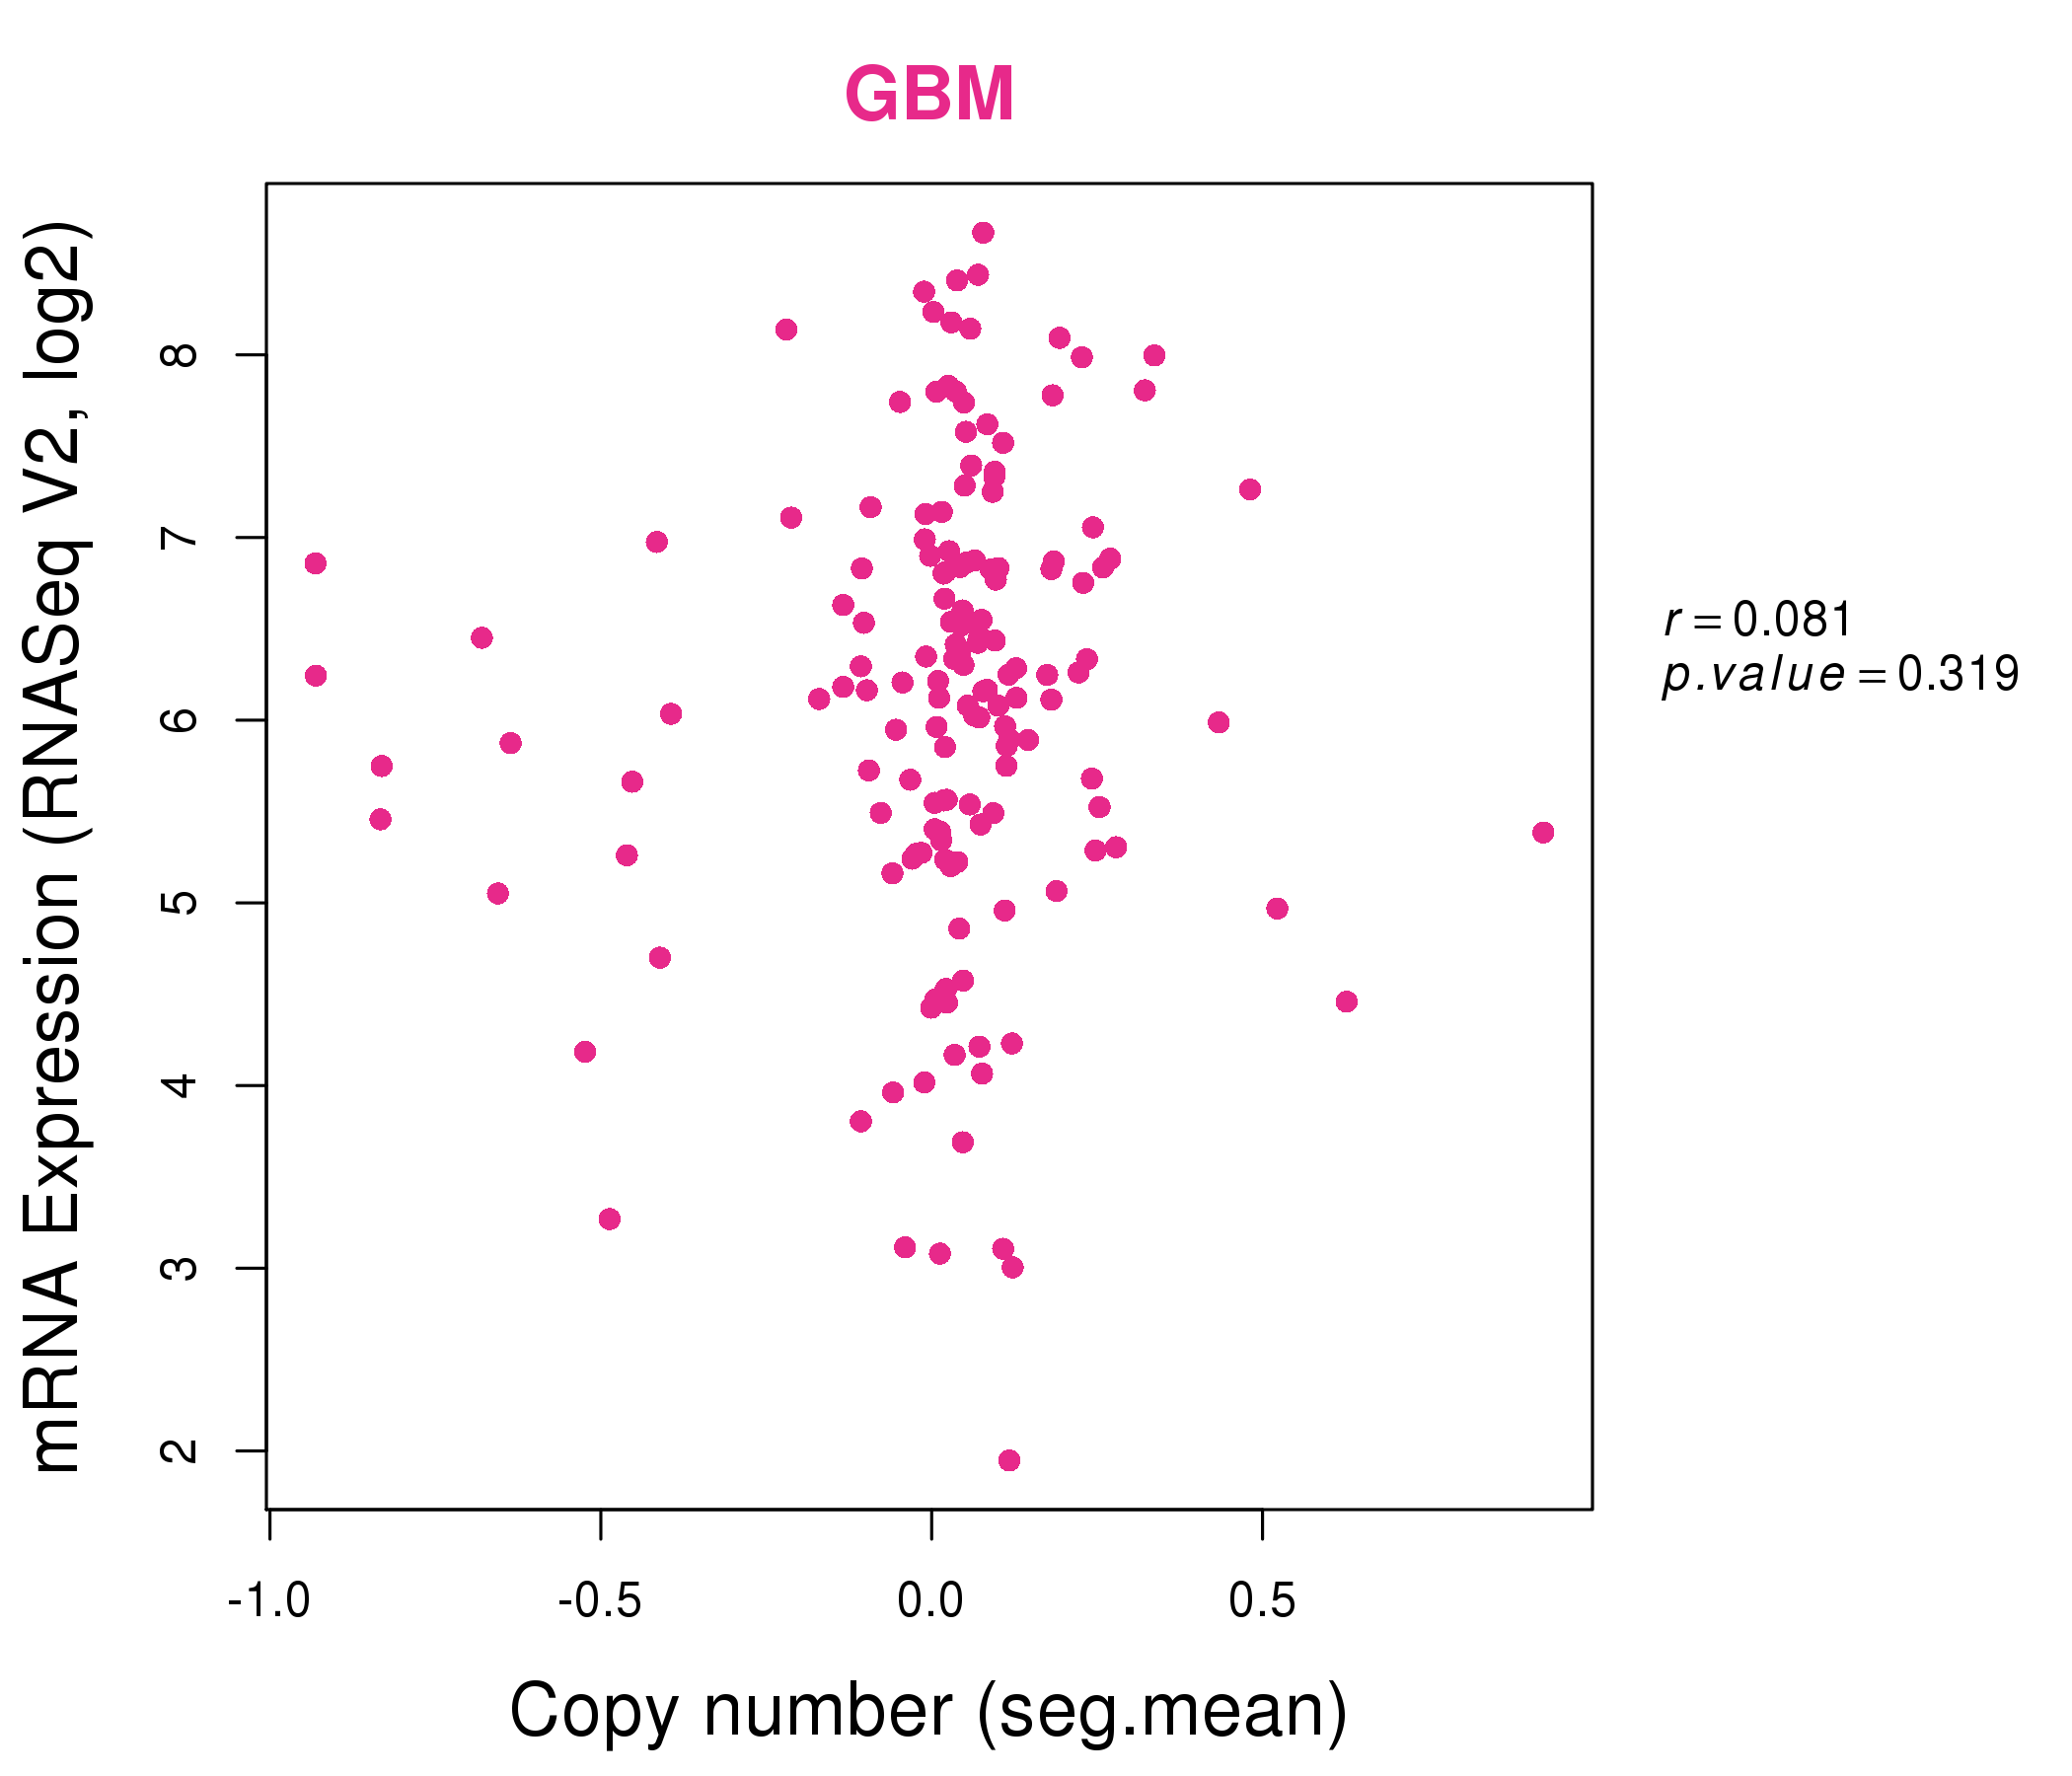
| * This plots show the correlation between CNV and gene expression. |
: Open all plots for all cancer types
 |
|
 |
|
| Top |
| Gene-Gene Network Information |
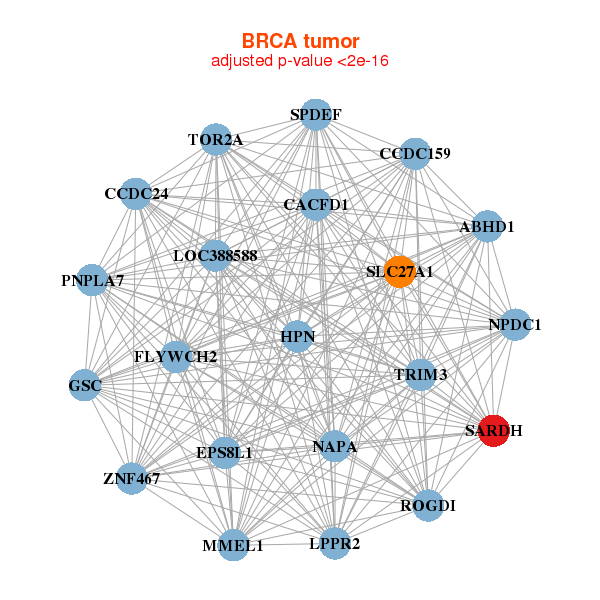
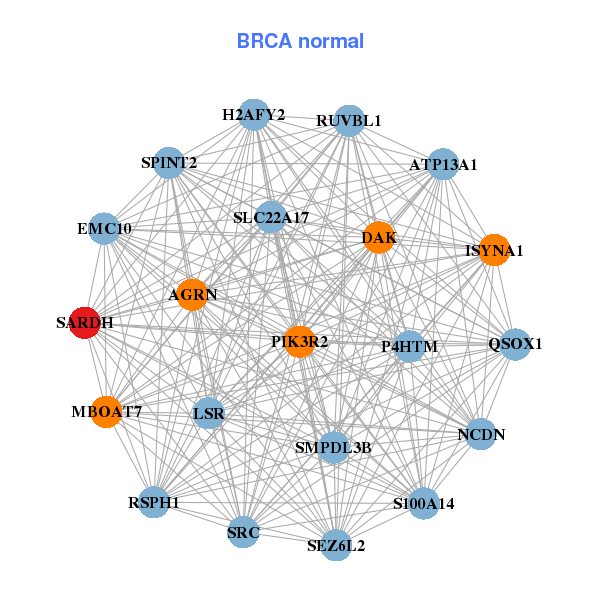
| * Co-Expression network figures were drawn using R package igraph. Only the top 20 genes with the highest correlations were shown. Red circle: input gene, orange circle: cell metabolism gene, sky circle: other gene |
: Open all plots for all cancer types
 |
|
| ABHD1,CACFD1,CCDC159,CCDC24,EPS8L1,FLYWCH2,GSC, HPN,LOC388588,LPPR2,MMEL1,NAPA,NPDC1,PNPLA7, ROGDI,SARDH,SLC27A1,SPDEF,TOR2A,TRIM3,ZNF467 | AGRN,ATP13A1,EMC10,DAK,H2AFY2,ISYNA1,LSR, MBOAT7,NCDN,P4HTM,PIK3R2,QSOX1,RSPH1,RUVBL1, S100A14,SARDH,SEZ6L2,SLC22A17,SMPDL3B,SPINT2,SRC |
 |
|
| ARHGAP25,ARHGAP30,ARHGAP9,FAM78A,FMNL1,GIMAP1,GIMAP4, IFFO1,IL21R,ITGAL,JAK3,LIMD2,LSP1,MIAT, PARVG,PDCD1,PLCB2,PSTPIP1,RASAL3,SARDH,WAS | C19orf44,CAMSAP1,CHD6,CRTC1,DVL3,EVC2,FLYWCH1, GPSM1,IQSEC1,KCND1,MTA1,NISCH,OBSCN,PHF2, PLEKHH2,PRX,SARDH,SLC23A2,UNKL,ZNF425,ZNF516 |
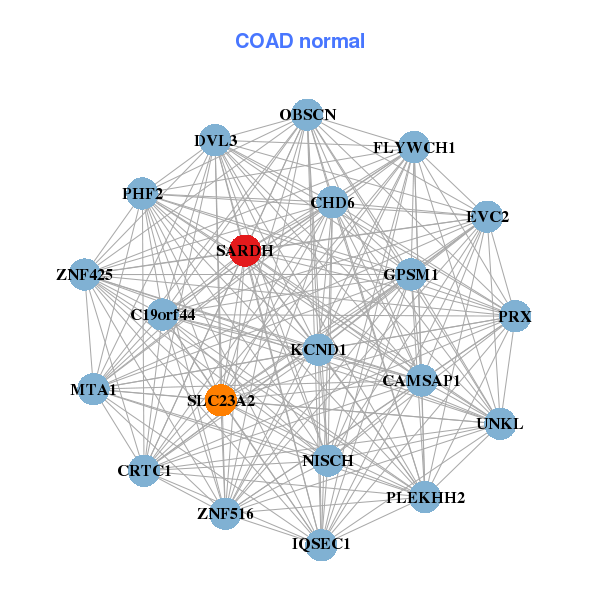
| * Co-Expression network figures were drawn using R package igraph. Only the top 20 genes with the highest correlations were shown. Red circle: input gene, orange circle: cell metabolism gene, sky circle: other gene |
: Open all plots for all cancer types
| Top |
: Open all interacting genes' information including KEGG pathway for all interacting genes from DAVID
| Top |
| Pharmacological Information for SARDH |
| There's no related Drug. |
| Top |
| Cross referenced IDs for SARDH |
| * We obtained these cross-references from Uniprot database. It covers 150 different DBs, 18 categories. http://www.uniprot.org/help/cross_references_section |
: Open all cross reference information
|
Copyright © 2016-Present - The Univsersity of Texas Health Science Center at Houston @ |