|
|||||||||||||||||||||||||||||||||||||||||||||||||||||||||||||||||||||||||||||||||||||||||||||||||||||||||||||||||||||||||||||||||||||||||||||||||||||||||||||||||||||||||||||||||||||||||||||||||||||||||||||||||||||||||||||||||||||||||||||||||||||||||||||||||||||||||||||||||||||||||||||||||||||||||||||||||||||||||||||||||||||||||||||
| |
| Phenotypic Information (metabolism pathway, cancer, disease, phenome) |
| |
| |
| Gene-Gene Network Information: Co-Expression Network, Interacting Genes & KEGG |
| |
|


| Gene Summary for ACAN |
| Basic gene info. | Gene symbol | ACAN |
| Gene name | aggrecan | |
| Synonyms | AGC1|AGCAN|CSPG1|CSPGCP|MSK16|SEDK | |
| Cytomap | UCSC genome browser: 15q26.1 | |
| Genomic location | chr15 :89346673-89418585 | |
| Type of gene | protein-coding | |
| RefGenes | NM_001135.3, NM_013227.3, | |
| Ensembl id | ENSG00000157766 | |
| Description | aggrecan core proteincartilage-specific proteoglycan core proteinchondroitin sulfate proteoglycan core protein 1large aggregating proteoglycan | |
| Modification date | 20141222 | |
| dbXrefs | MIM : 155760 | |
| HGNC : HGNC | ||
| Ensembl : ENSG00000157766 | ||
| HPRD : 01123 | ||
| Vega : OTTHUMG00000171989 | ||
| Protein | UniProt: P16112 go to UniProt's Cross Reference DB Table | |
| Expression | CleanEX: HS_ACAN | |
| BioGPS: 176 | ||
| Gene Expression Atlas: ENSG00000157766 | ||
| The Human Protein Atlas: ENSG00000157766 | ||
| Pathway | NCI Pathway Interaction Database: ACAN | |
| KEGG: ACAN | ||
| REACTOME: ACAN | ||
| ConsensusPathDB | ||
| Pathway Commons: ACAN | ||
| Metabolism | MetaCyc: ACAN | |
| HUMANCyc: ACAN | ||
| Regulation | Ensembl's Regulation: ENSG00000157766 | |
| miRBase: chr15 :89,346,673-89,418,585 | ||
| TargetScan: NM_001135 | ||
| cisRED: ENSG00000157766 | ||
| Context | iHOP: ACAN | |
| cancer metabolism search in PubMed: ACAN | ||
| UCL Cancer Institute: ACAN | ||
| Assigned class in ccmGDB | A - This gene has a literature evidence and it belongs to cancer gene. | |
| References showing role of ACAN in cancer cell metabolism | 1. Kim KN, Ham YM, Moon JY, Kim MJ, Jung YH, et al. (2012) Acanthoic acid induces cell apoptosis through activation of the p38 MAPK pathway in HL-60 human promyelocytic leukaemia. Food Chem 135: 2112-2117. doi: 10.1016/j.foodchem.2012.05.067. go to article 2. Asai N, Ohkawara B, Ito M, Masuda A, Ishiguro N, et al. (2014) LRP4 induces extracellular matrix productions and facilitates chondrocyte differentiation. Biochem Biophys Res Commun 451: 302-307. doi: 10.1016/j.bbrc.2014.07.125. go to article | |
| Top |
| Phenotypic Information for ACAN(metabolism pathway, cancer, disease, phenome) |
| Cancer | CGAP: ACAN |
| Familial Cancer Database: ACAN | |
| * This gene is included in those cancer gene databases. |
|
|
|
|
|
| . | |||||||||||||||||||||||||||||||||||||||||||||||||||||||||||||||||||||||||||||||||||||||||||||||||||||||||||||||||||||||||||||||||||||||||||||||||||||||||||||||||||||||||||||||||||||||||||||||||||||||||||||||||||||||||||||||||||||||||||||||||||||||||||||||||||||||||||||||||||||||||||||||||||||||||||||||||||||||||||||||||||||||
Oncogene 1 | Significant driver gene in | ||||||||||||||||||||||||||||||||||||||||||||||||||||||||||||||||||||||||||||||||||||||||||||||||||||||||||||||||||||||||||||||||||||||||||||||||||||||||||||||||||||||||||||||||||||||||||||||||||||||||||||||||||||||||||||||||||||||||||||||||||||||||||||||||||||||||||||||||||||||||||||||||||||||||||||||||||||||||||||||||||||||||||||
| cf) number; DB name 1 Oncogene; http://nar.oxfordjournals.org/content/35/suppl_1/D721.long, 2 Tumor Suppressor gene; https://bioinfo.uth.edu/TSGene/, 3 Cancer Gene Census; http://www.nature.com/nrc/journal/v4/n3/abs/nrc1299.html, 4 CancerGenes; http://nar.oxfordjournals.org/content/35/suppl_1/D721.long, 5 Network of Cancer Gene; http://ncg.kcl.ac.uk/index.php, 1Therapeutic Vulnerabilities in Cancer; http://cbio.mskcc.org/cancergenomics/statius/ |
| REACTOME_METABOLISM_OF_CARBOHYDRATES | |
| OMIM | |
| Orphanet | |
| Disease | KEGG Disease: ACAN |
| MedGen: ACAN (Human Medical Genetics with Condition) | |
| ClinVar: ACAN | |
| Phenotype | MGI: ACAN (International Mouse Phenotyping Consortium) |
| PhenomicDB: ACAN | |
| Mutations for ACAN |
| * Under tables are showing count per each tissue to give us broad intuition about tissue specific mutation patterns.You can go to the detailed page for each mutation database's web site. |
| - Statistics for Tissue and Mutation type | Top |
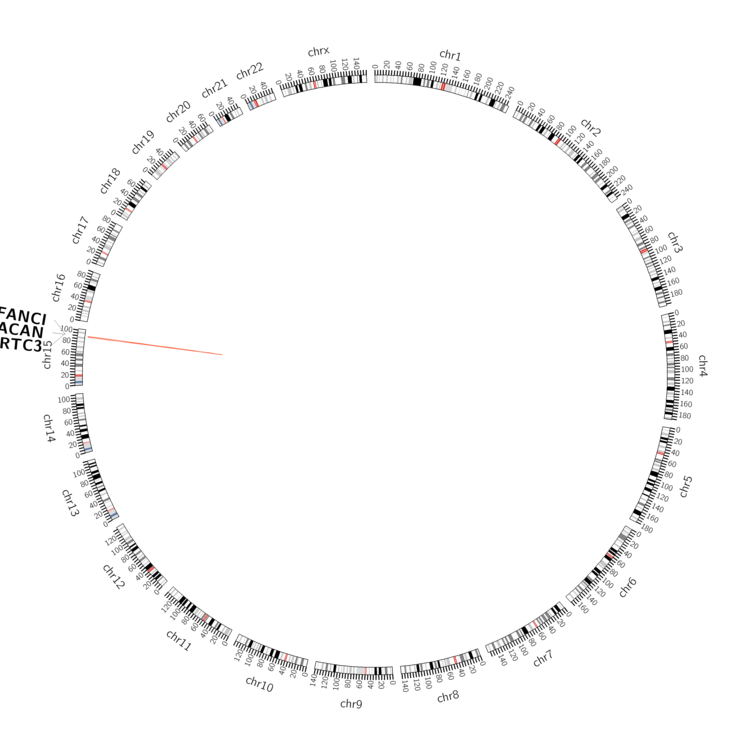 |
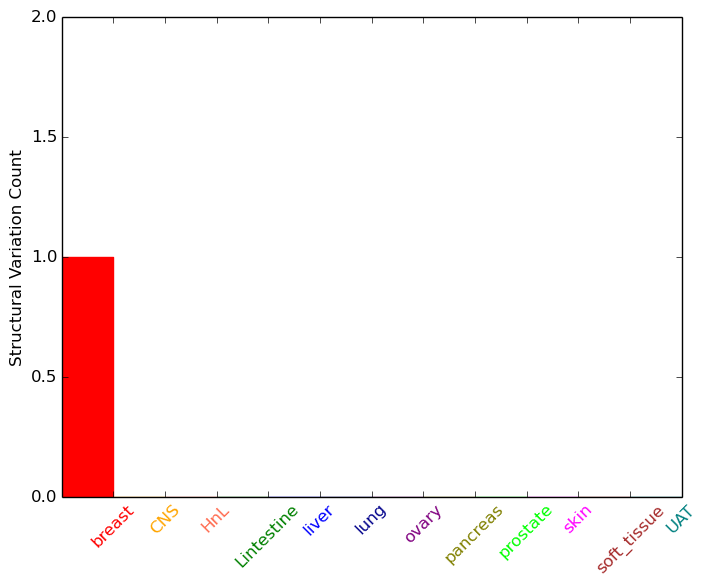
| - For Inter-chromosomal Variations |
| There's no inter-chromosomal structural variation. |
| - For Intra-chromosomal Variations |
| * Intra-chromosomal variantions includes 'intrachromosomal amplicon to amplicon', 'intrachromosomal amplicon to non-amplified dna', 'intrachromosomal deletion', 'intrachromosomal fold-back inversion', 'intrachromosomal inversion', 'intrachromosomal tandem duplication', 'Intrachromosomal unknown type', 'intrachromosomal with inverted orientation', 'intrachromosomal with non-inverted orientation'. |
 |
| Sample | Symbol_a | Chr_a | Start_a | End_a | Symbol_b | Chr_b | Start_b | End_b |
| breast | ACAN | chr15 | 89362953 | 89362953 | FANCI | chr15 | 89825886 | 89825886 |
| NS | ACAN | chr15 | 89416605 | 89416605 | CRTC3 | chr15 | 91127851 | 91127851 |
| cf) Tissue number; Tissue name (1;Breast, 2;Central_nervous_system, 3;Haematopoietic_and_lymphoid_tissue, 4;Large_intestine, 5;Liver, 6;Lung, 7;Ovary, 8;Pancreas, 9;Prostate, 10;Skin, 11;Soft_tissue, 12;Upper_aerodigestive_tract) |
| * From mRNA Sanger sequences, Chitars2.0 arranged chimeric transcripts. This table shows ACAN related fusion information. |
| ID | Head Gene | Tail Gene | Accession | Gene_a | qStart_a | qEnd_a | Chromosome_a | tStart_a | tEnd_a | Gene_a | qStart_a | qEnd_a | Chromosome_a | tStart_a | tEnd_a |
| BG924790 | CCDC97 | 86 | 158 | 19 | 41826247 | 41826319 | ACAN | 157 | 603 | 15 | 89418009 | 89418455 | |
| BG900931 | ACAN | 85 | 191 | 15 | 89401562 | 89401668 | ACAN | 186 | 680 | 15 | 89401655 | 89402149 | |
| BF061357 | FBLN7 | 1 | 138 | 2 | 112945649 | 112945786 | ACAN | 133 | 407 | 15 | 89401685 | 89401959 | |
| Top |
| Mutation type/ Tissue ID | brca | cns | cerv | endome | haematopo | kidn | Lintest | liver | lung | ns | ovary | pancre | prost | skin | stoma | thyro | urina | |||
| Total # sample | 2 | 2 | 1 | 1 | 1 | |||||||||||||||
| GAIN (# sample) | 2 | 1 | 1 | |||||||||||||||||
| LOSS (# sample) | 2 | 1 |
| cf) Tissue ID; Tissue type (1; Breast, 2; Central_nervous_system, 3; Cervix, 4; Endometrium, 5; Haematopoietic_and_lymphoid_tissue, 6; Kidney, 7; Large_intestine, 8; Liver, 9; Lung, 10; NS, 11; Ovary, 12; Pancreas, 13; Prostate, 14; Skin, 15; Stomach, 16; Thyroid, 17; Urinary_tract) |
| Top |
|
 |
| Top |
| Stat. for Non-Synonymous SNVs (# total SNVs=233) | (# total SNVs=74) |
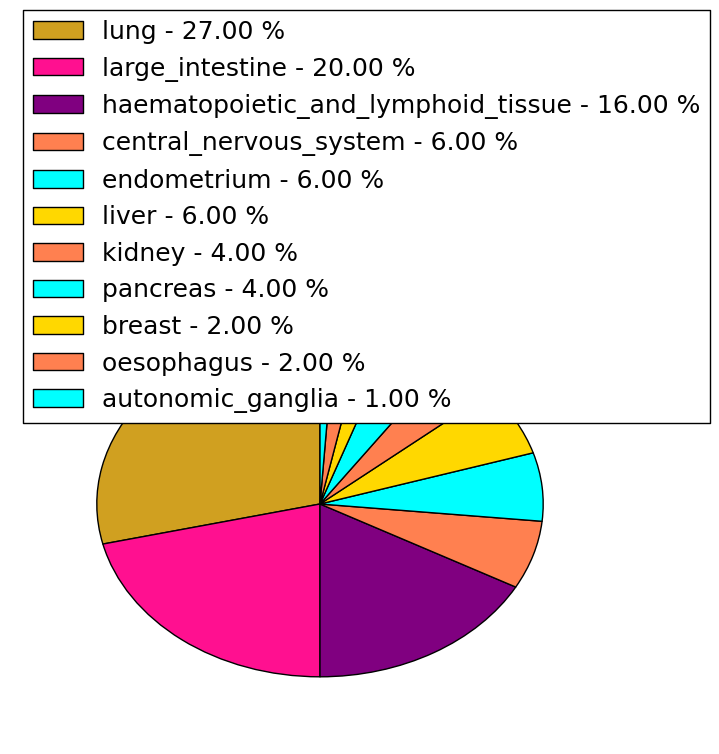 | 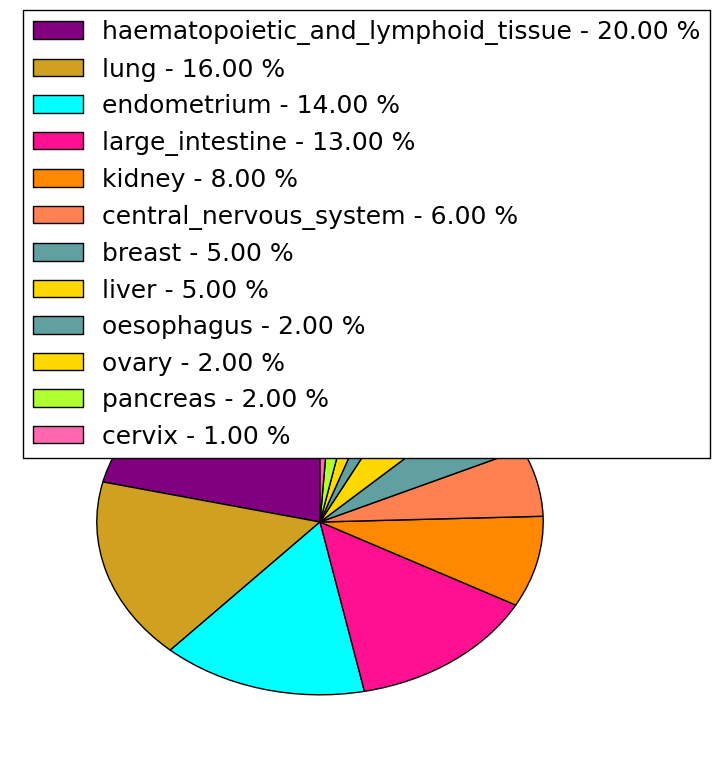 |
(# total SNVs=2) | (# total SNVs=2) |
 |  |
| Top |
| * When you move the cursor on each content, you can see more deailed mutation information on the Tooltip. Those are primary_site,primary_histology,mutation(aa),pubmedID. |
| GRCh37 position | Mutation(aa) | Unique sampleID count |
| chr15:89400023-89400023 | p.T1289A | 5 |
| chr15:89415247-89415247 | p.D2259E | 4 |
| chr15:89399111-89399111 | p.A1099T | 4 |
| chr15:89398605-89398605 | p.S930I | 4 |
| chr15:89402051-89402051 | p.I1965V | 4 |
| chr15:89382102-89382102 | p.R93R | 3 |
| chr15:89398825-89398825 | p.T1003T | 3 |
| chr15:89391161-89391161 | p.R542W | 3 |
| chr15:89402035-89402035 | p.V1959V | 3 |
| chr15:89386810-89386810 | p.V328I | 3 |
| Top |
|
 |
| Point Mutation/ Tissue ID | 1 | 2 | 3 | 4 | 5 | 6 | 7 | 8 | 9 | 10 | 11 | 12 | 13 | 14 | 15 | 16 | 17 | 18 | 19 | 20 |
| # sample | 10 | 4 | 1 | 26 | 7 | 11 | 10 | 1 | 1 | 45 | 13 | 2 | 2 | 3 | 49 | 21 | 1 | 15 | ||
| # mutation | 11 | 4 | 1 | 28 | 8 | 11 | 9 | 1 | 1 | 49 | 14 | 2 | 2 | 3 | 87 | 23 | 1 | 26 | ||
| nonsynonymous SNV | 6 | 3 | 24 | 5 | 10 | 4 | 39 | 12 | 1 | 1 | 3 | 54 | 19 | 1 | 15 | |||||
| synonymous SNV | 5 | 1 | 1 | 4 | 3 | 1 | 5 | 1 | 1 | 10 | 2 | 1 | 1 | 33 | 4 | 11 |
| cf) Tissue ID; Tissue type (1; BLCA[Bladder Urothelial Carcinoma], 2; BRCA[Breast invasive carcinoma], 3; CESC[Cervical squamous cell carcinoma and endocervical adenocarcinoma], 4; COAD[Colon adenocarcinoma], 5; GBM[Glioblastoma multiforme], 6; Glioma Low Grade, 7; HNSC[Head and Neck squamous cell carcinoma], 8; KICH[Kidney Chromophobe], 9; KIRC[Kidney renal clear cell carcinoma], 10; KIRP[Kidney renal papillary cell carcinoma], 11; LAML[Acute Myeloid Leukemia], 12; LUAD[Lung adenocarcinoma], 13; LUSC[Lung squamous cell carcinoma], 14; OV[Ovarian serous cystadenocarcinoma ], 15; PAAD[Pancreatic adenocarcinoma], 16; PRAD[Prostate adenocarcinoma], 17; SKCM[Skin Cutaneous Melanoma], 18:STAD[Stomach adenocarcinoma], 19:THCA[Thyroid carcinoma], 20:UCEC[Uterine Corpus Endometrial Carcinoma]) |
| Top |
| * We represented just top 10 SNVs. When you move the cursor on each content, you can see more deailed mutation information on the Tooltip. Those are primary_site, primary_histology, mutation(aa), pubmedID. |
| Genomic Position | Mutation(aa) | Unique sampleID count |
| chr15:89386810 | p.L1964L,ACAN | 2 |
| chr15:89382102 | p.S1703T,ACAN | 2 |
| chr15:89386832 | p.G952E,ACAN | 2 |
| chr15:89398671 | p.I139I,ACAN | 2 |
| chr15:89382240 | p.V328I,ACAN | 2 |
| chr15:89392845 | p.R93R,ACAN | 2 |
| chr15:89401084 | p.T335M,ACAN | 2 |
| chr15:89401708 | p.S1756S,ACAN | 2 |
| chr15:89401133 | p.F2041F,ACAN | 2 |
| chr15:89401939 | p.R542W,ACAN | 2 |
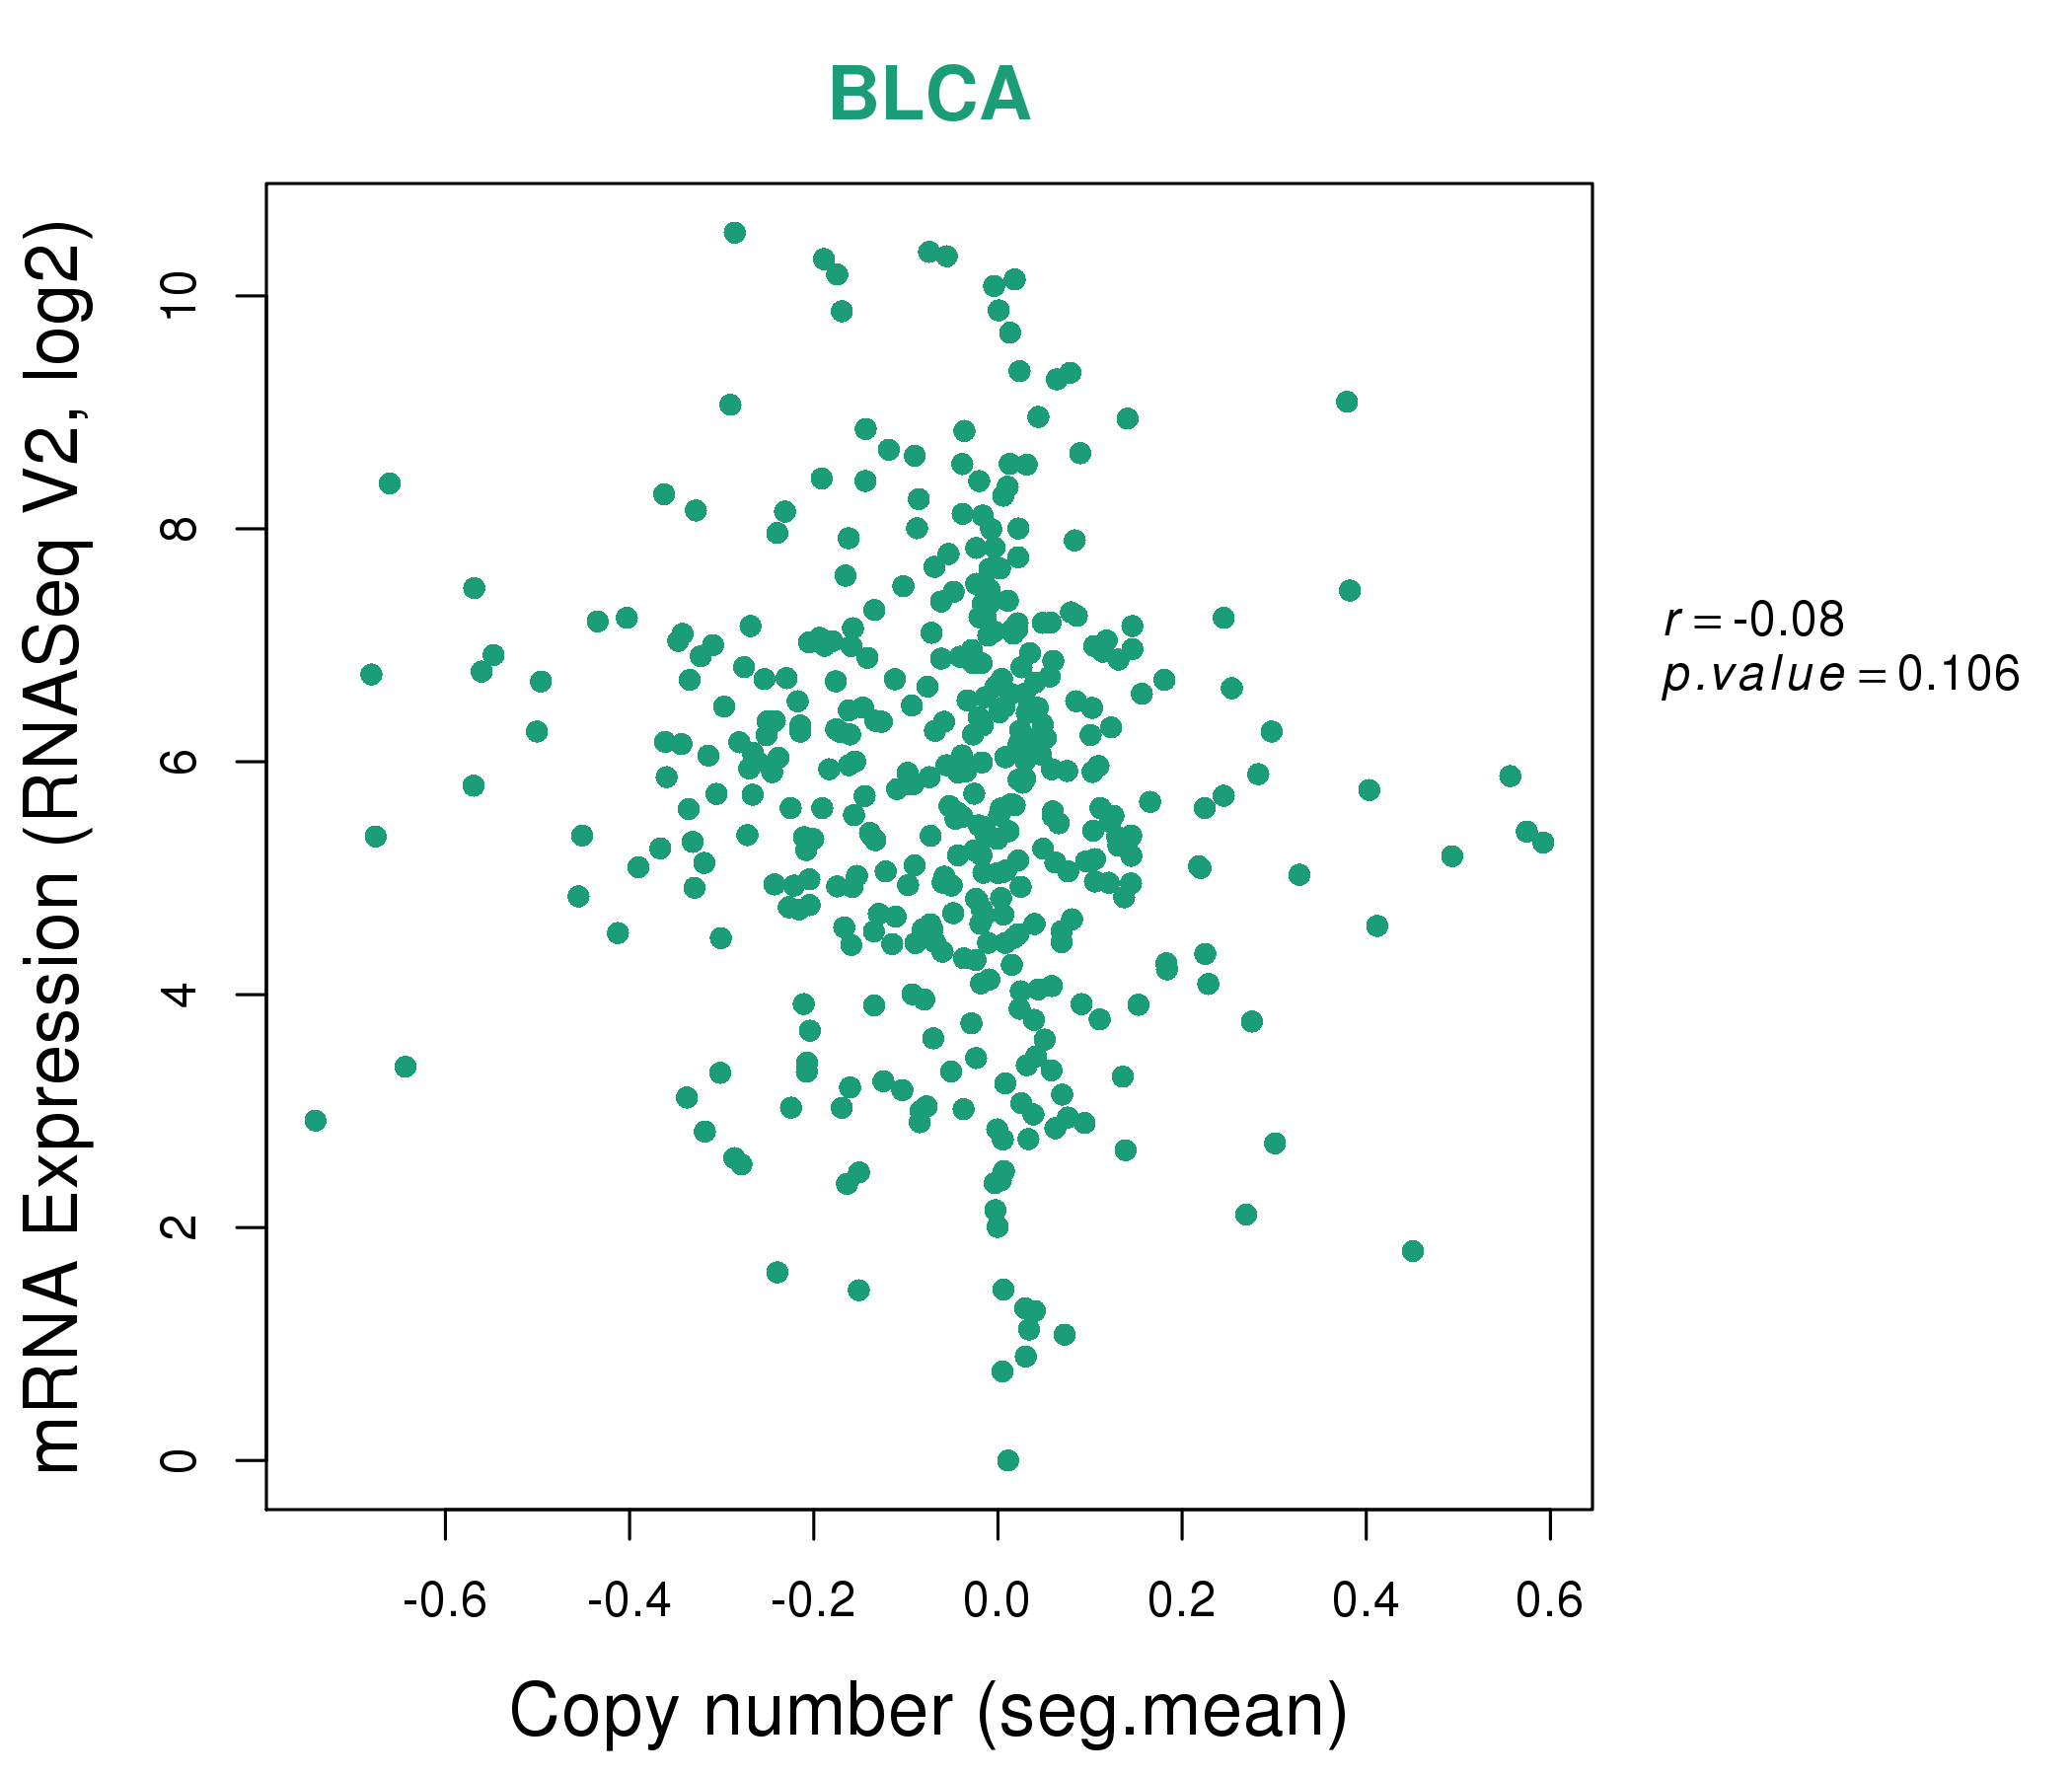
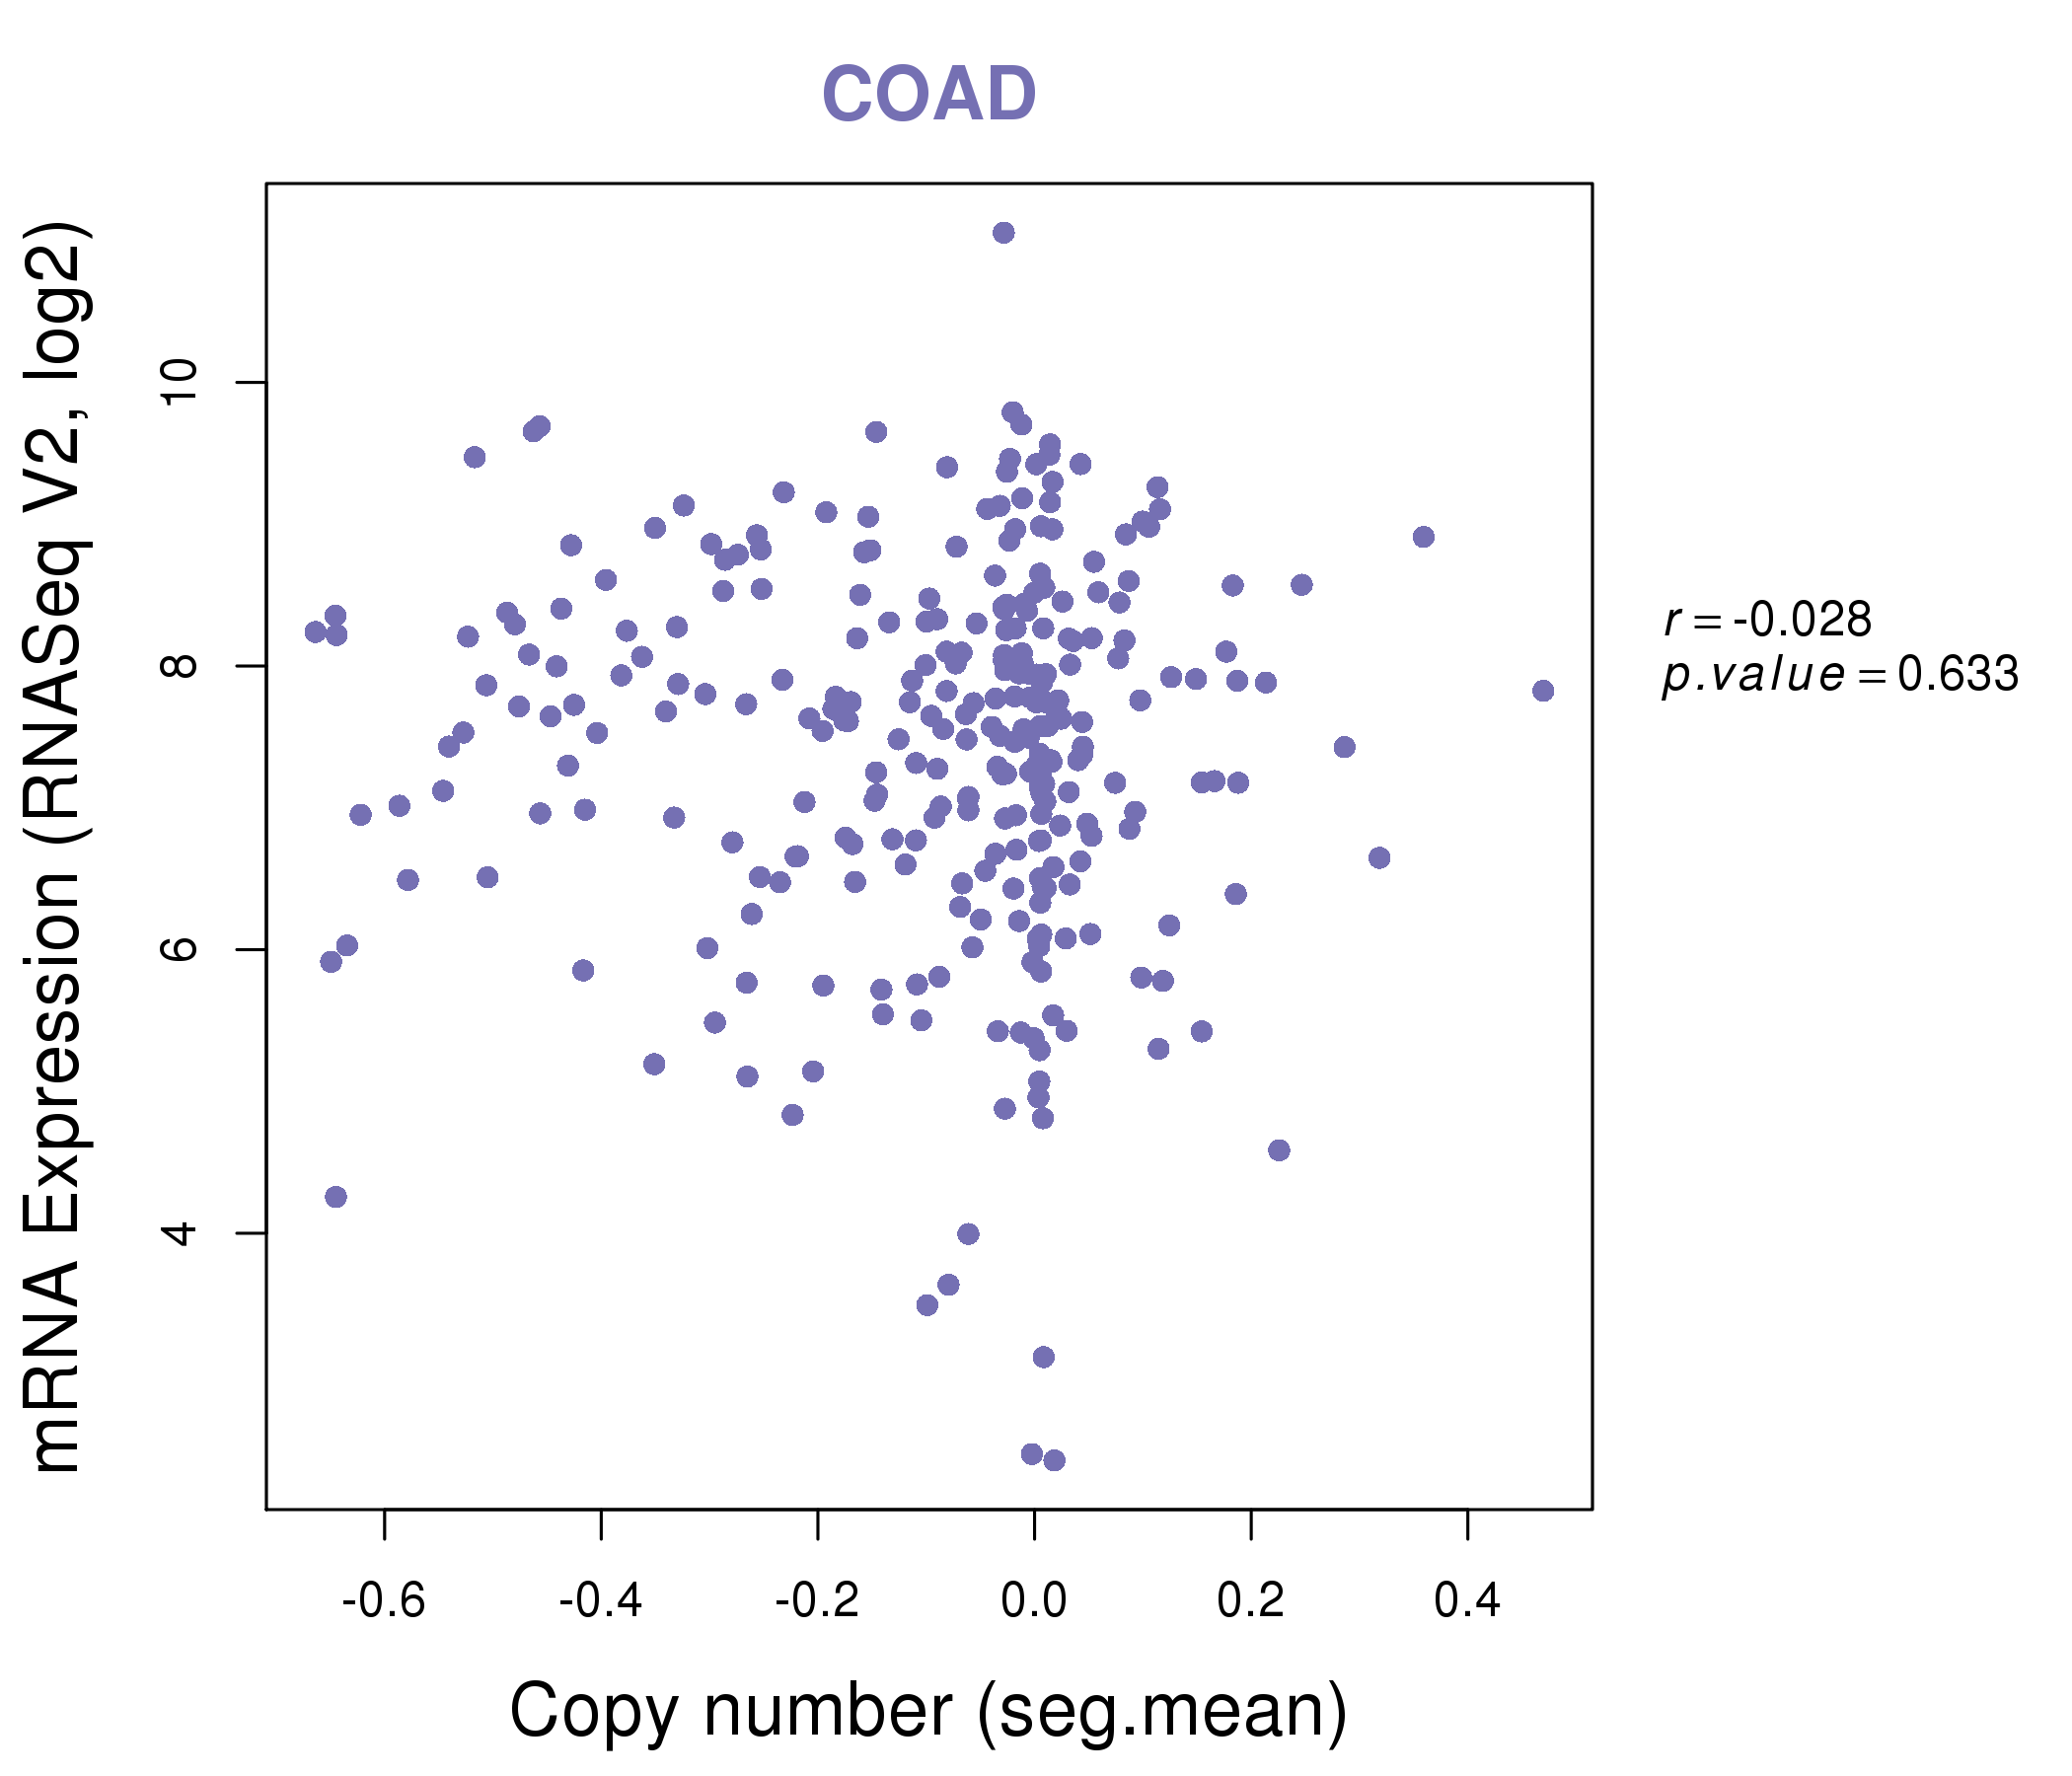
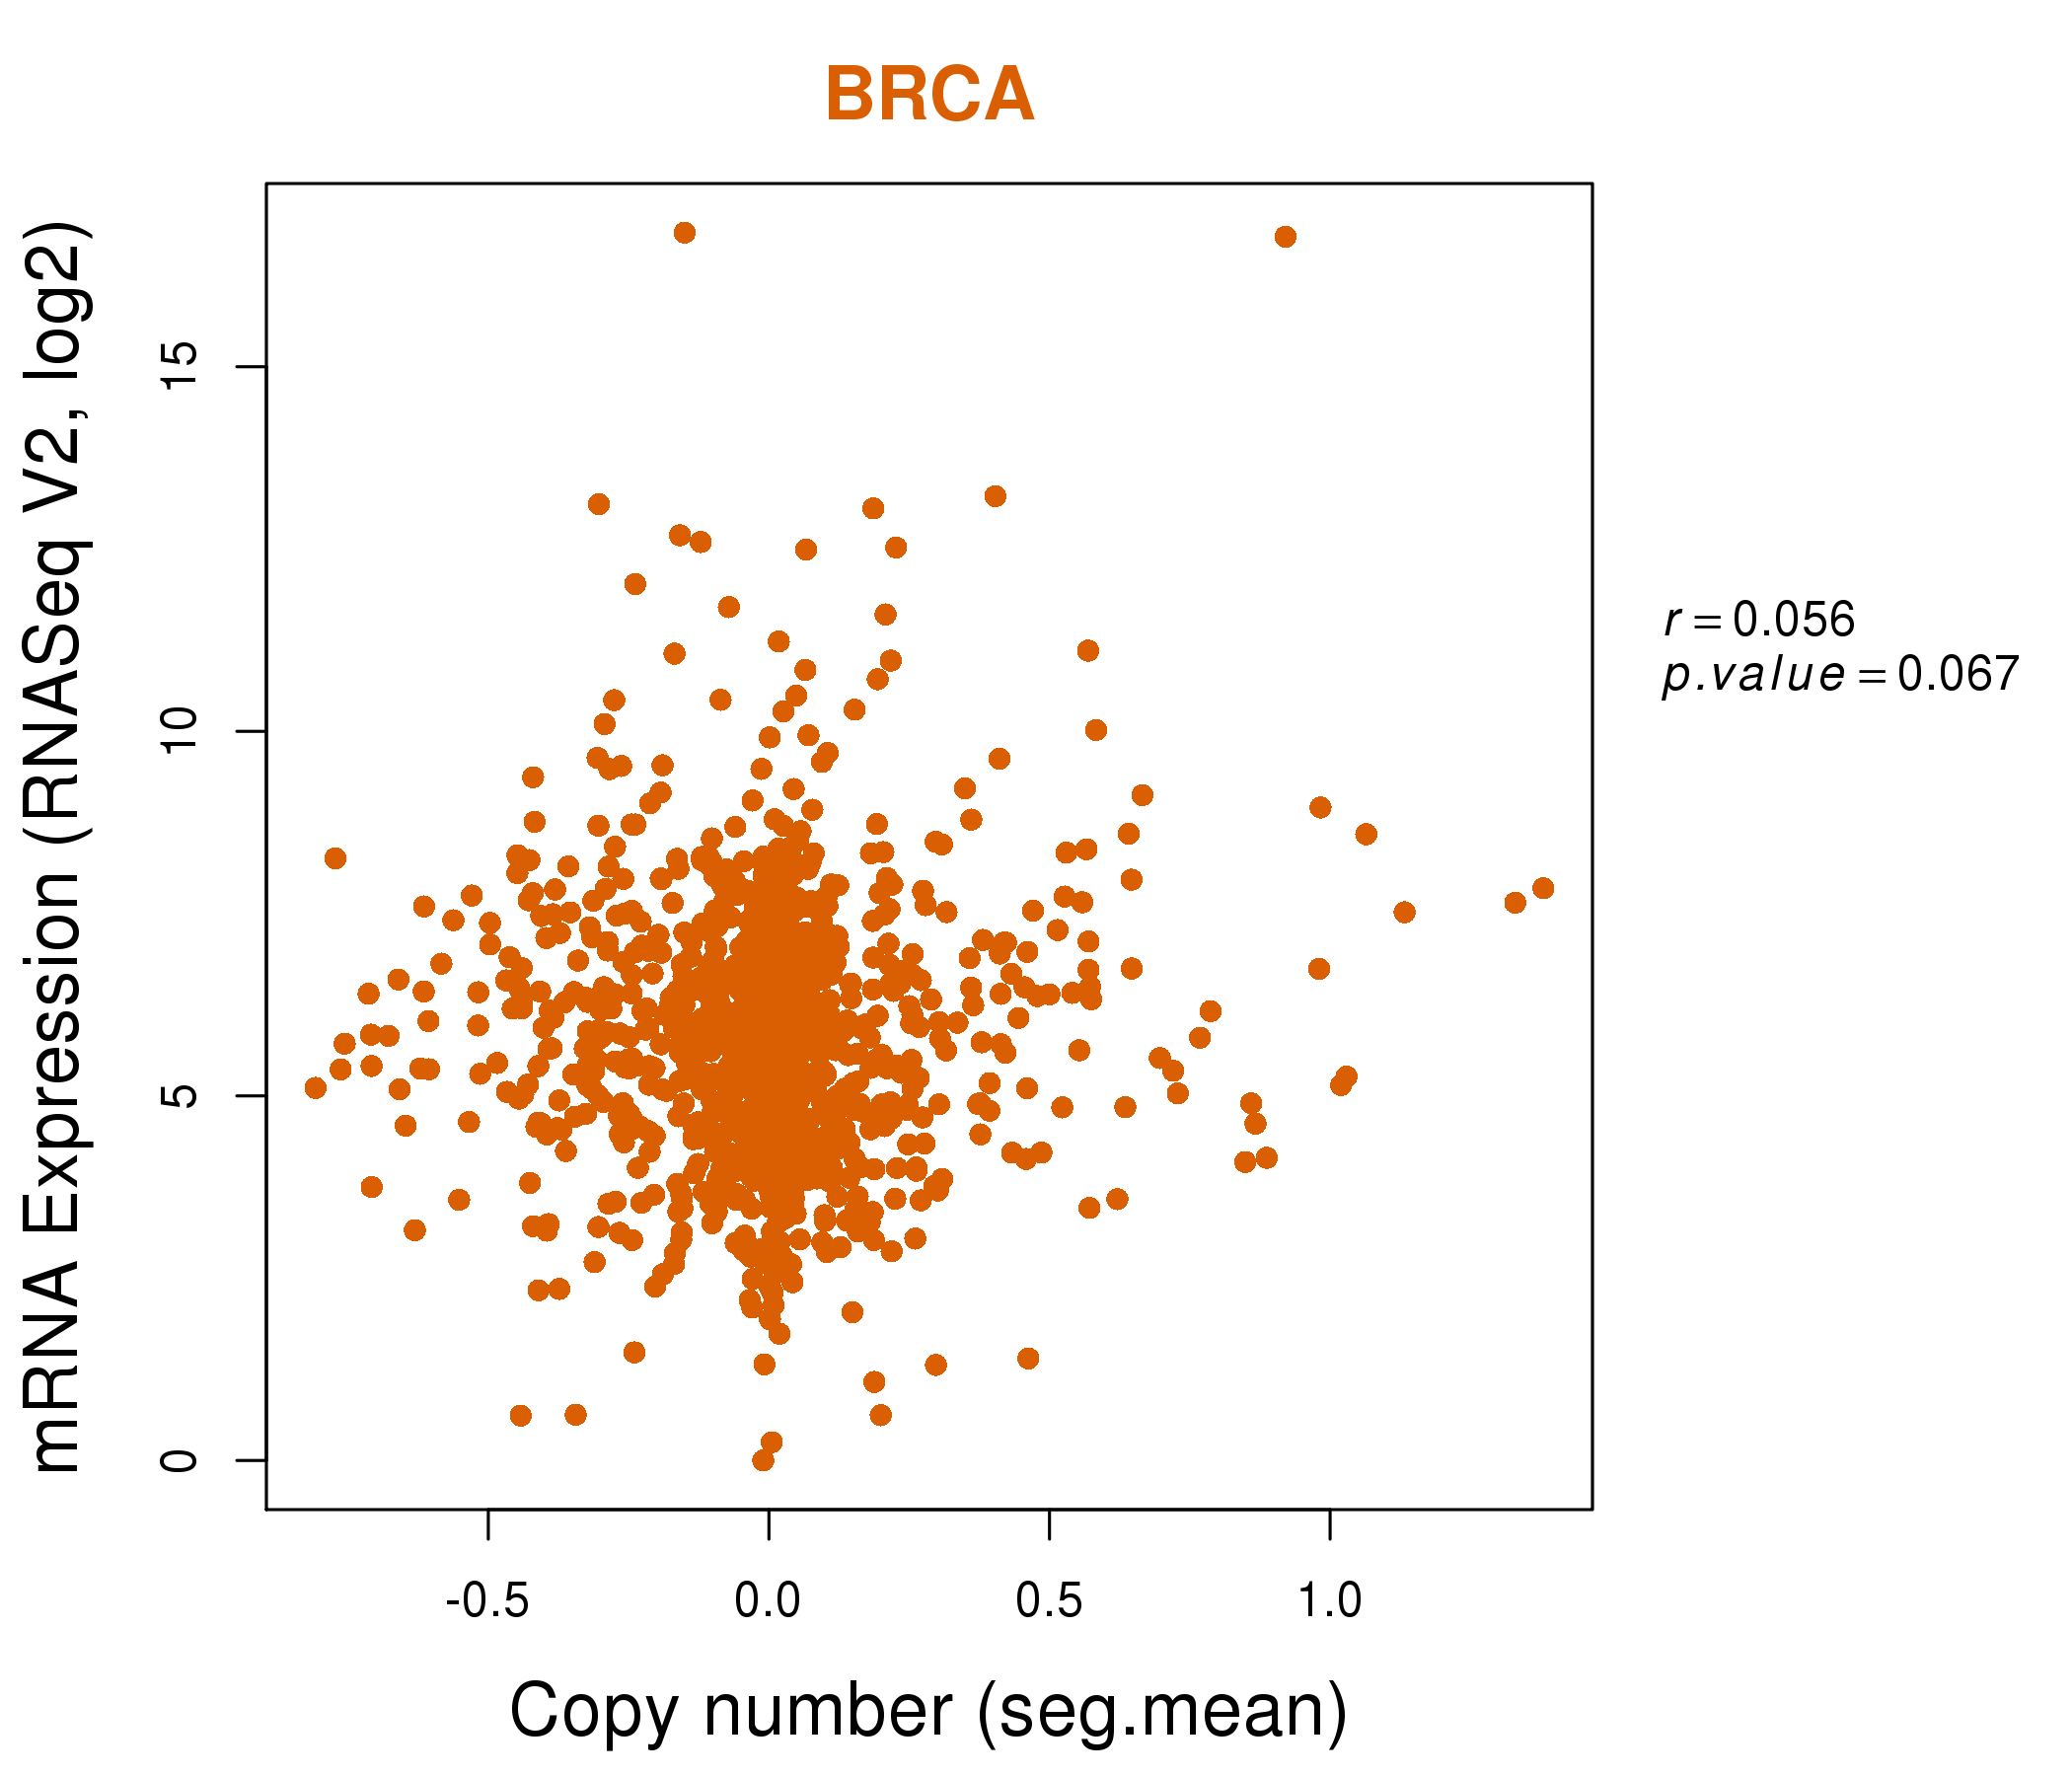
| * Copy number data were extracted from TCGA using R package TCGA-Assembler. The URLs of all public data files on TCGA DCC data server were gathered on Jan-05-2015. Function ProcessCNAData in TCGA-Assembler package was used to obtain gene-level copy number value which is calculated as the average copy number of the genomic region of a gene. |
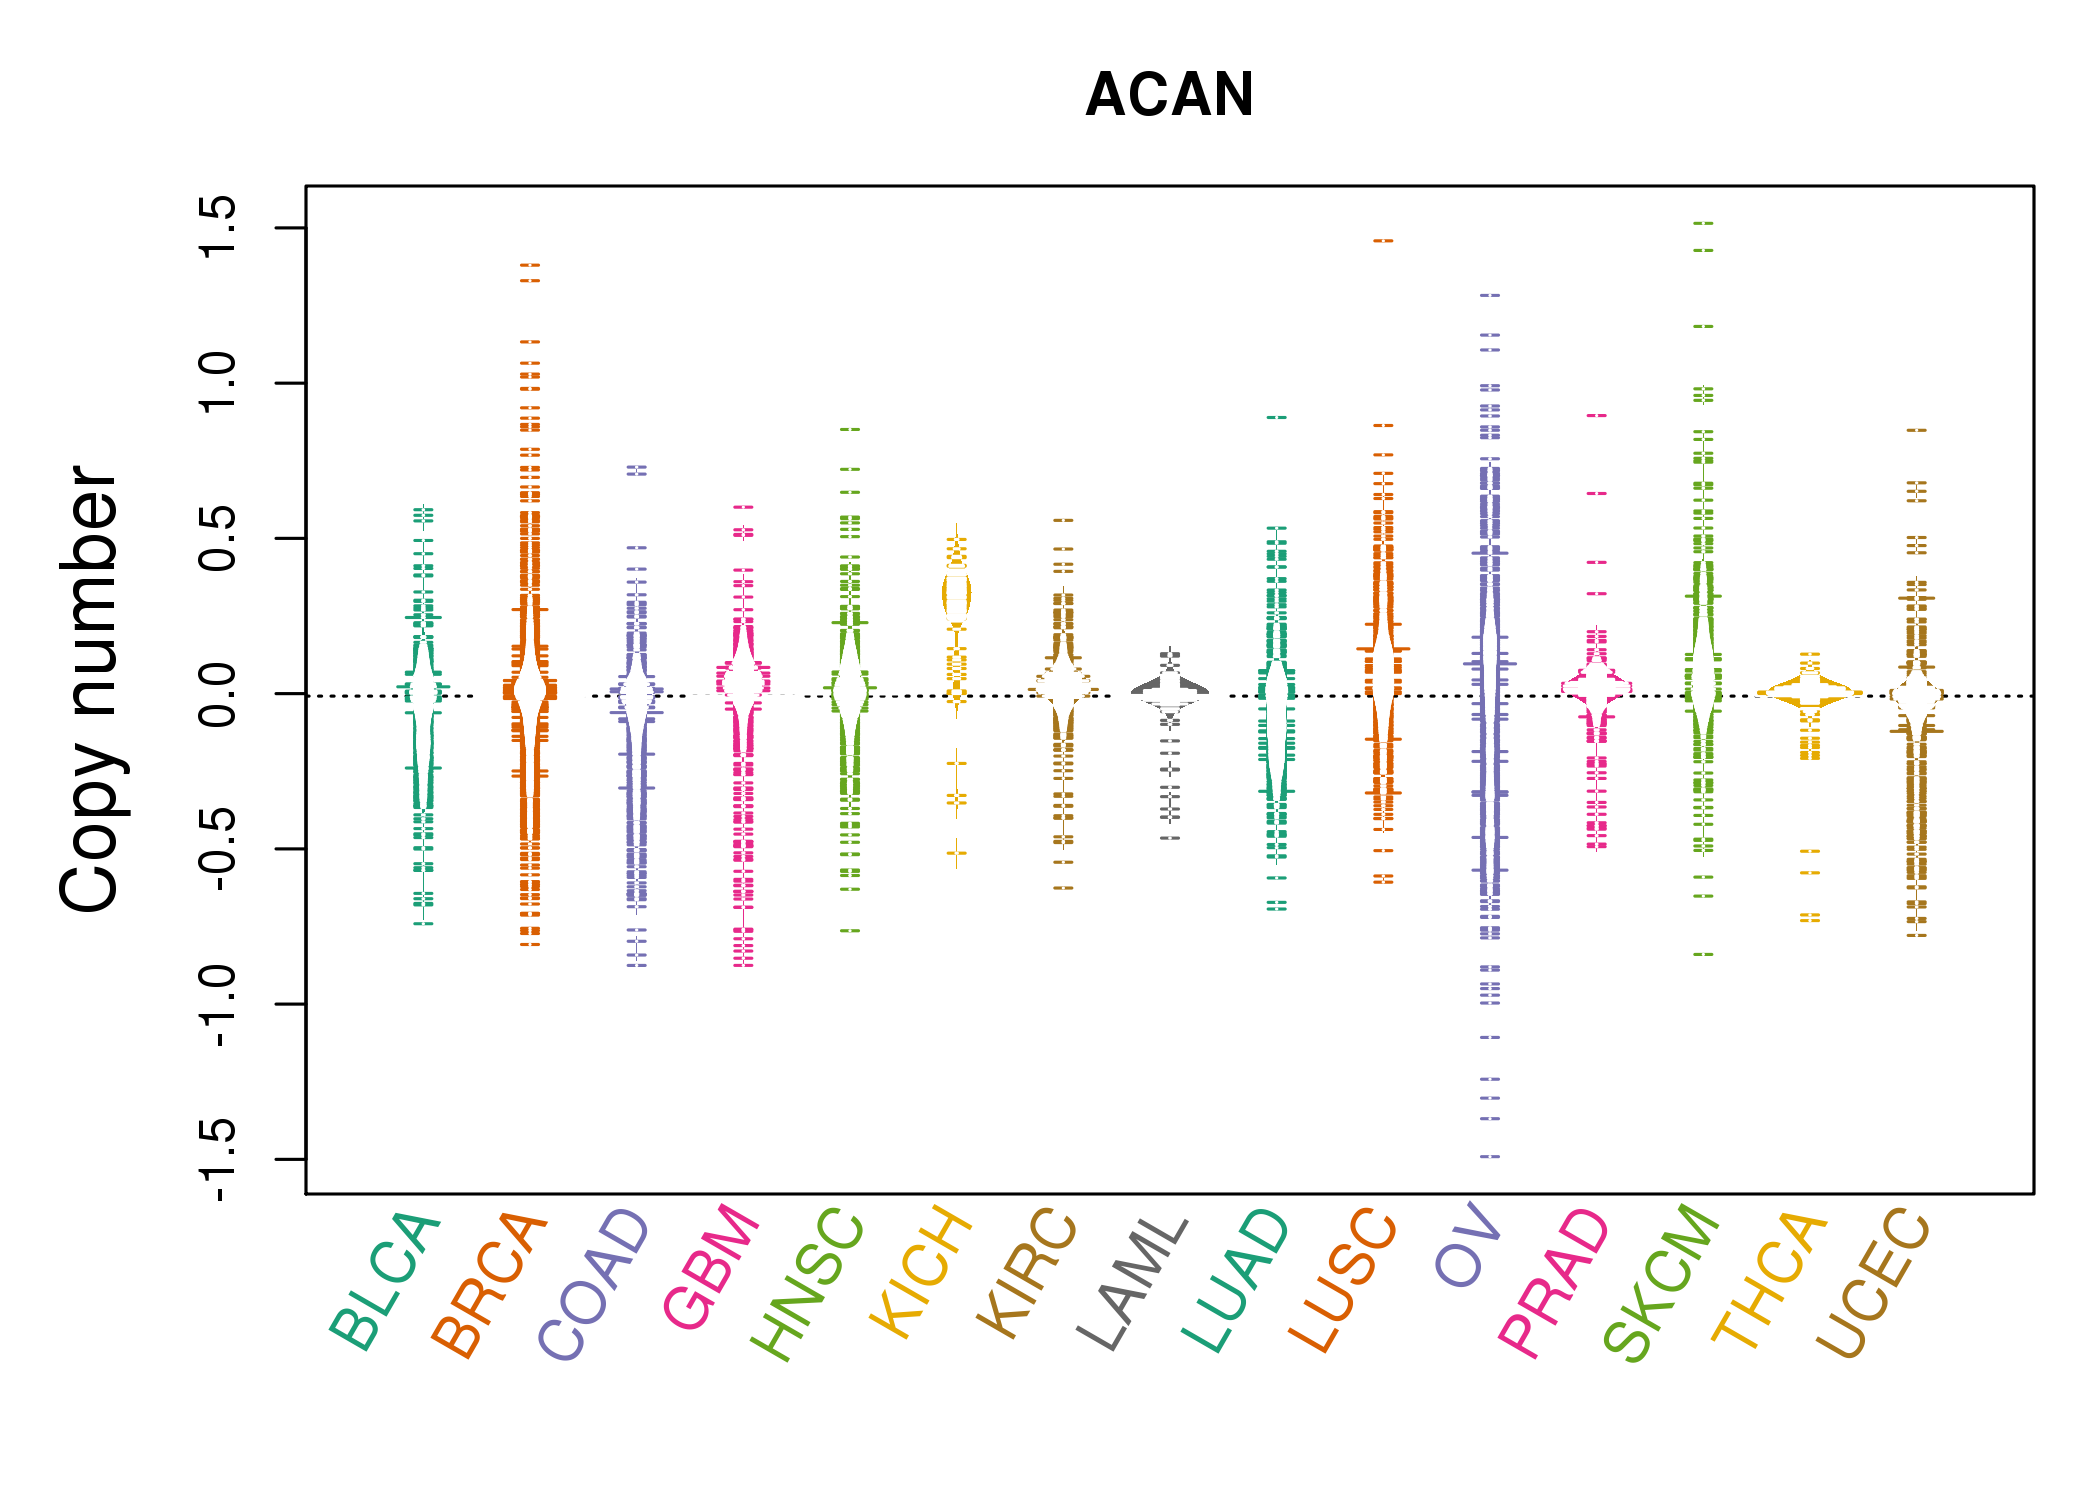 |
| cf) Tissue ID[Tissue type]: BLCA[Bladder Urothelial Carcinoma], BRCA[Breast invasive carcinoma], CESC[Cervical squamous cell carcinoma and endocervical adenocarcinoma], COAD[Colon adenocarcinoma], GBM[Glioblastoma multiforme], Glioma Low Grade, HNSC[Head and Neck squamous cell carcinoma], KICH[Kidney Chromophobe], KIRC[Kidney renal clear cell carcinoma], KIRP[Kidney renal papillary cell carcinoma], LAML[Acute Myeloid Leukemia], LUAD[Lung adenocarcinoma], LUSC[Lung squamous cell carcinoma], OV[Ovarian serous cystadenocarcinoma ], PAAD[Pancreatic adenocarcinoma], PRAD[Prostate adenocarcinoma], SKCM[Skin Cutaneous Melanoma], STAD[Stomach adenocarcinoma], THCA[Thyroid carcinoma], UCEC[Uterine Corpus Endometrial Carcinoma] |
| Top |
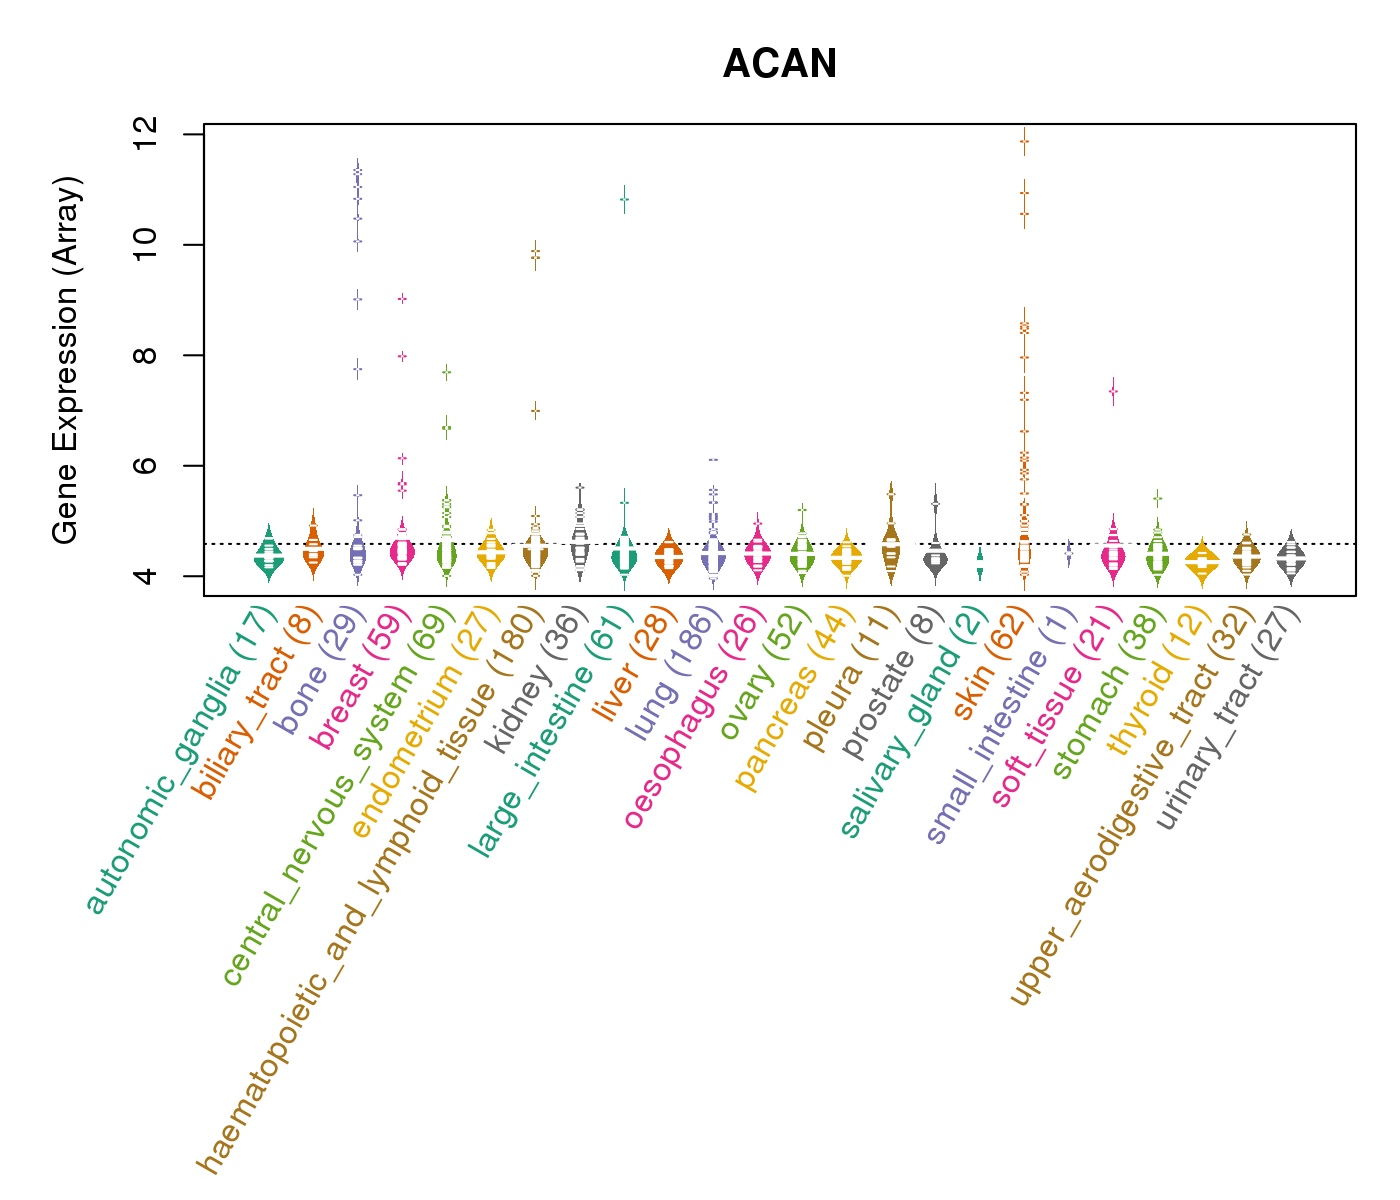
| Gene Expression for ACAN |
| * CCLE gene expression data were extracted from CCLE_Expression_Entrez_2012-10-18.res: Gene-centric RMA-normalized mRNA expression data. |
 |
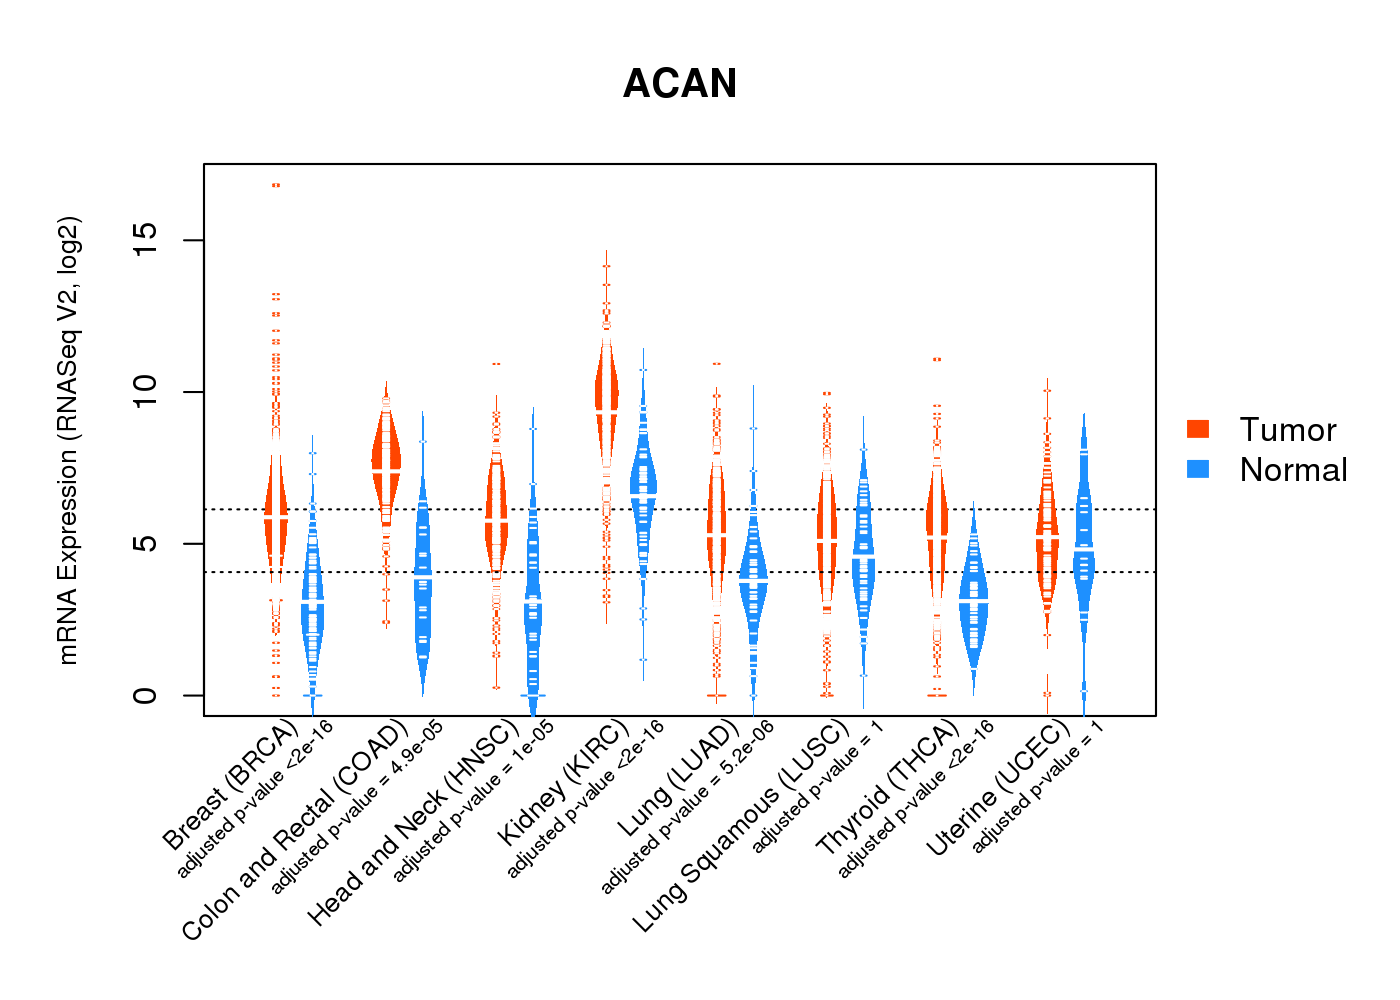
| * Normalized gene expression data of RNASeqV2 was extracted from TCGA using R package TCGA-Assembler. The URLs of all public data files on TCGA DCC data server were gathered at Jan-05-2015. Only eight cancer types have enough normal control samples for differential expression analysis. (t test, adjusted p<0.05 (using Benjamini-Hochberg FDR)) |
 |
| Top |
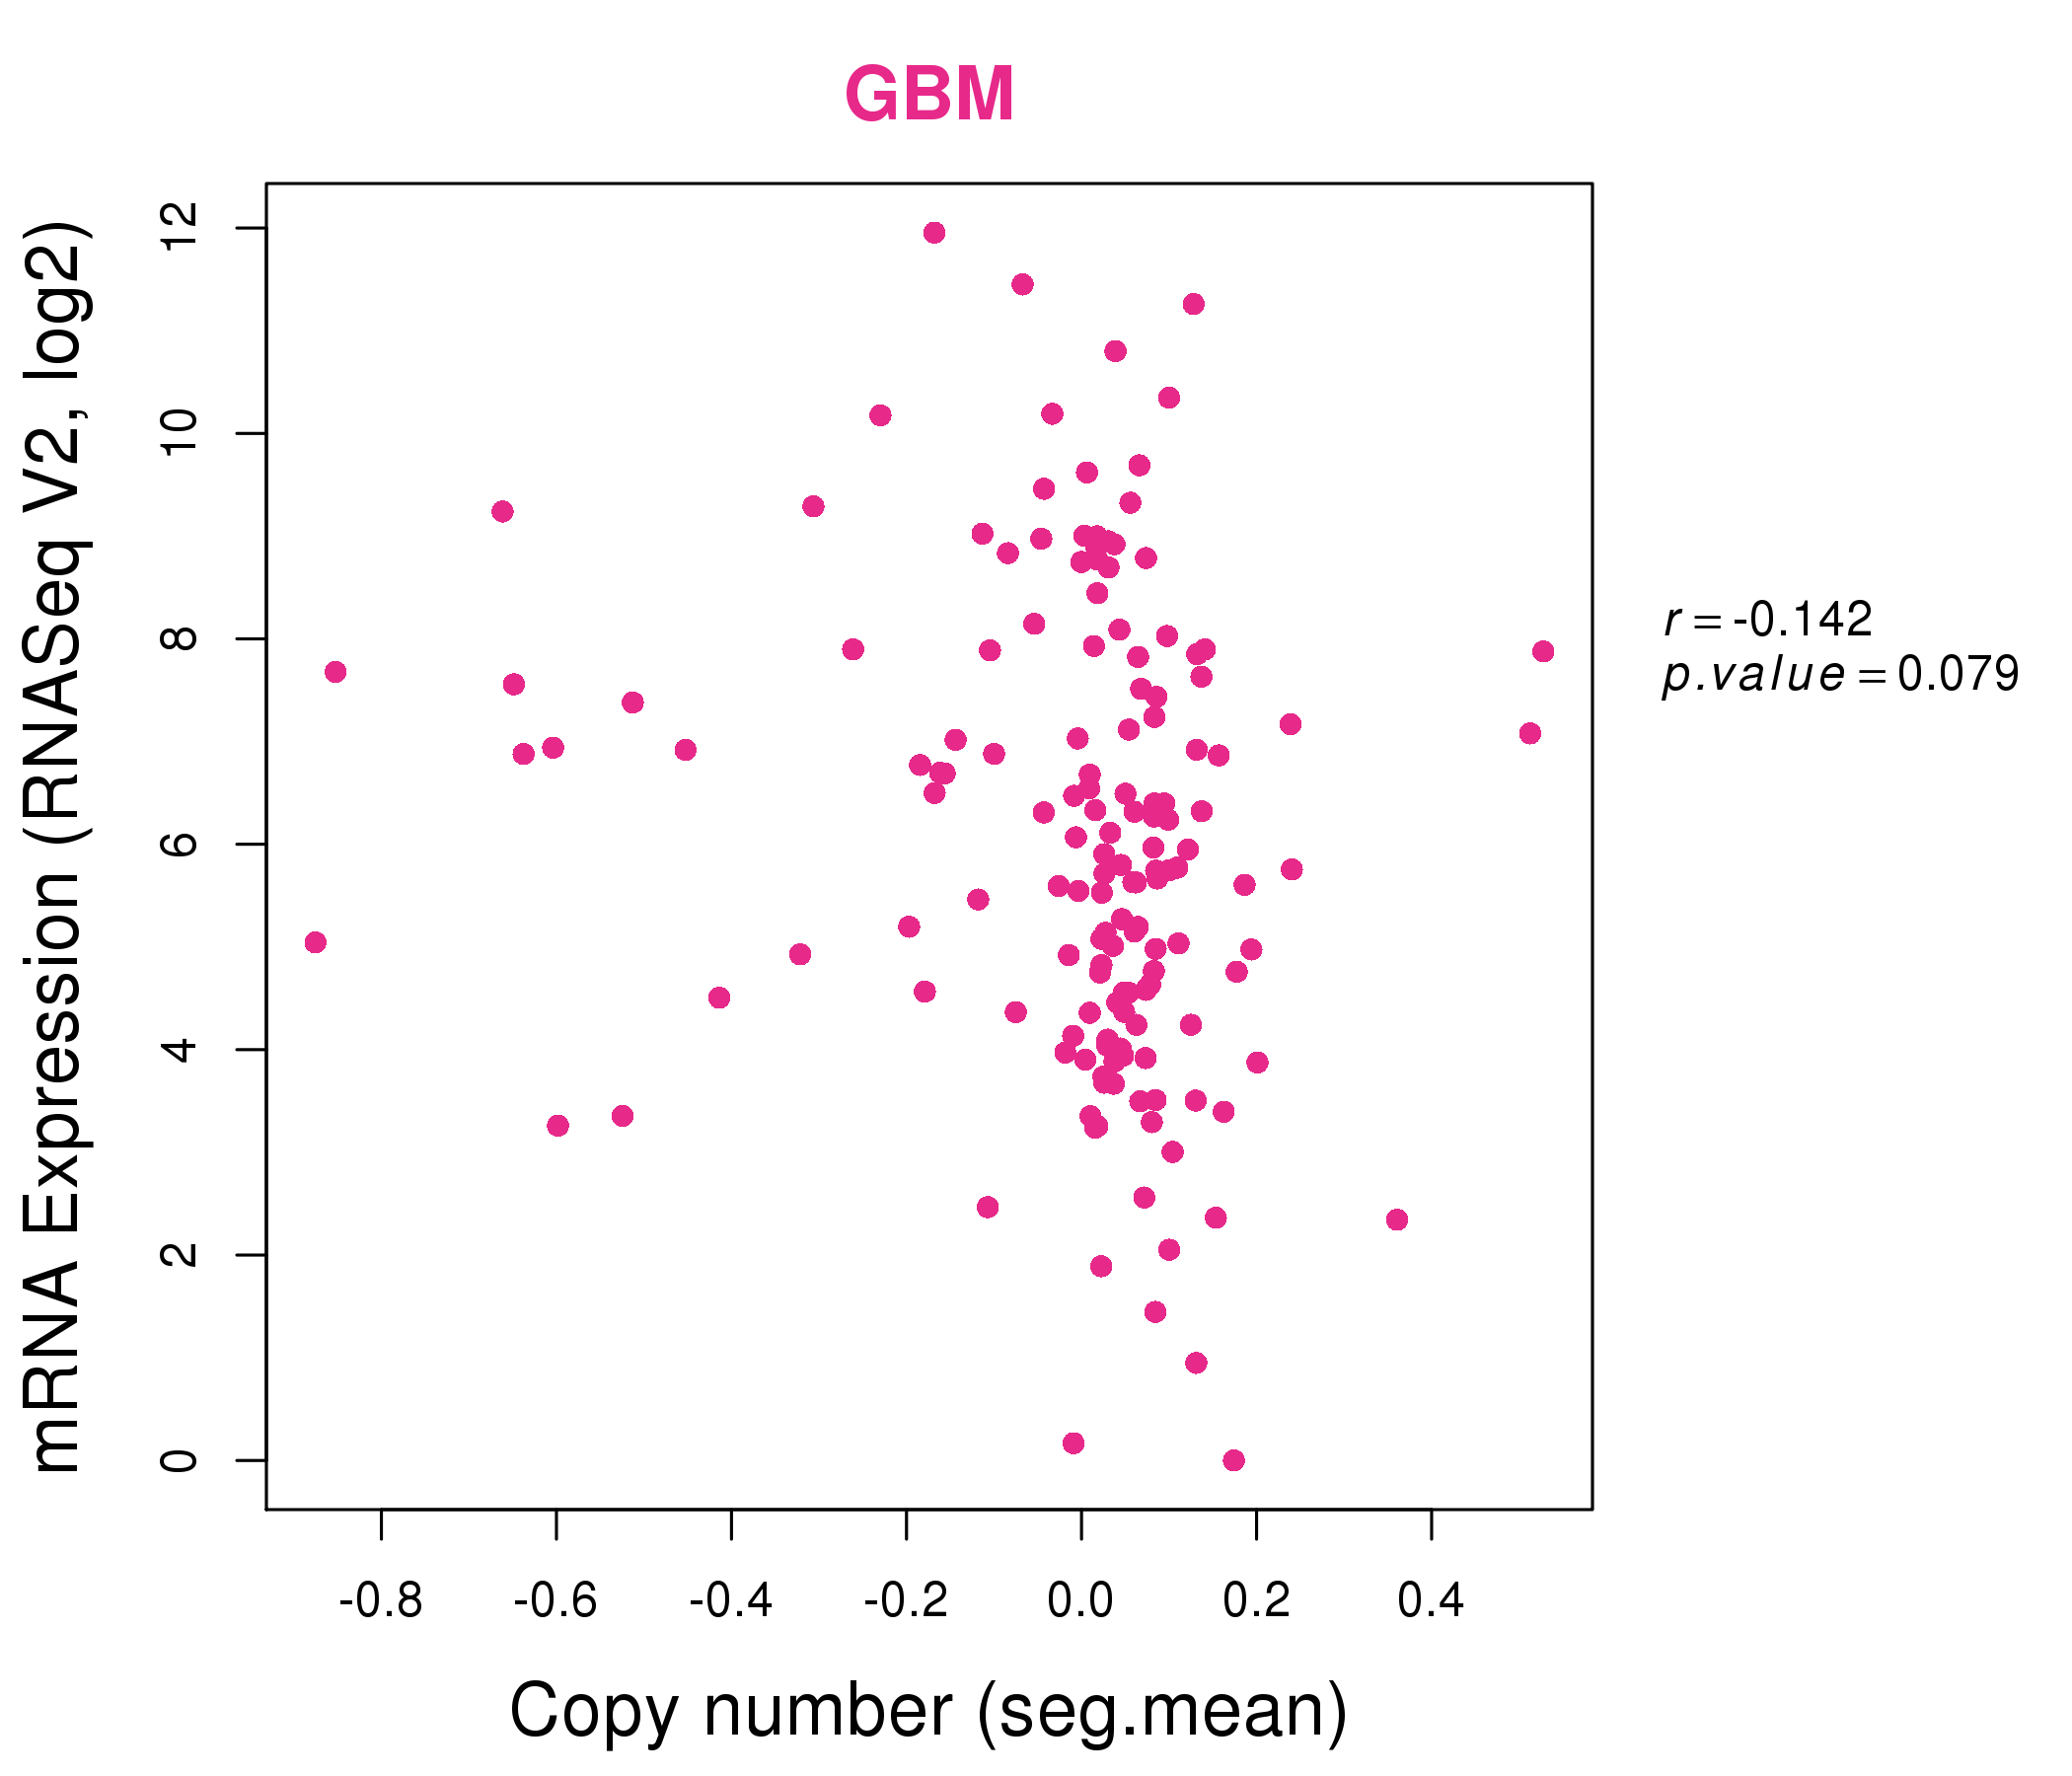
| * This plots show the correlation between CNV and gene expression. |
: Open all plots for all cancer types
 |
|
 |
|
| Top |
| Gene-Gene Network Information |
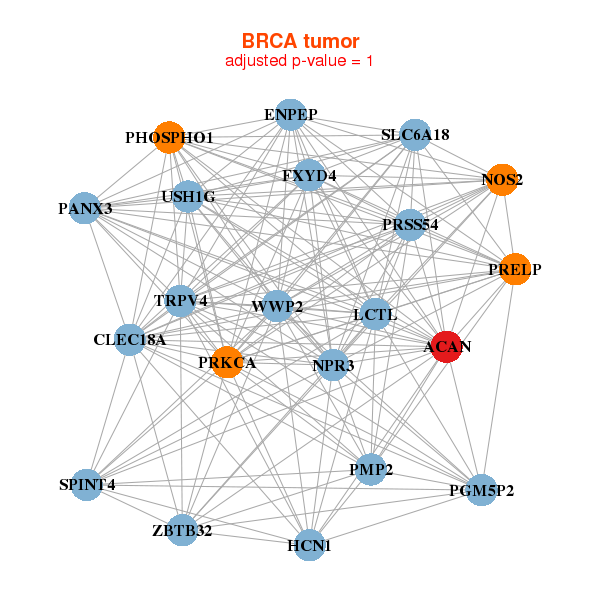
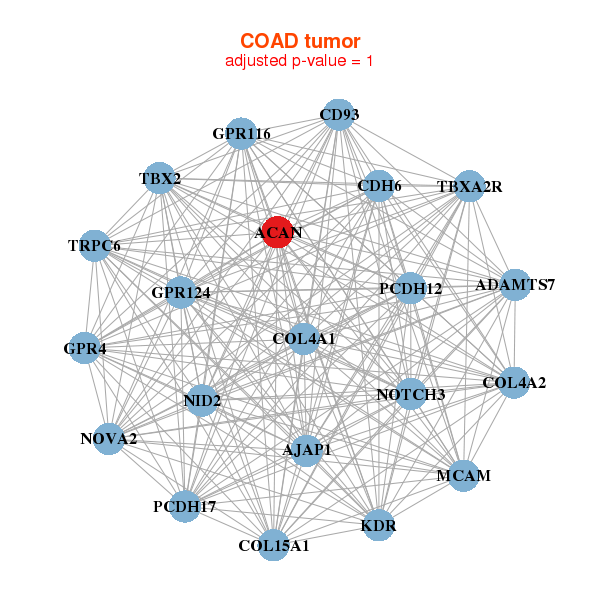
| * Co-Expression network figures were drawn using R package igraph. Only the top 20 genes with the highest correlations were shown. Red circle: input gene, orange circle: cell metabolism gene, sky circle: other gene |
: Open all plots for all cancer types
 |
| ||||
| ACAN,NPR3,CLEC18A,ENPEP,FXYD4,HCN1,LCTL, NOS2,PANX3,PGM5P2,PHOSPHO1,PMP2,PRELP,PRKCA, PRSS54,SLC6A18,SPINT4,TRPV4,USH1G,WWP2,ZBTB32 | ACAN,ADARB1,ANKRD34C,CACNA1H,DGKG,FHL5,GPR20, GPR21,HTR1B,ITGA8,ITIH3,KCNA5,MRVI1,MYH11, MYOCD,OR51E2,P2RX1,SCUBE3,SUSD5,TGM2,WFDC1 | ||||
 |
| ||||
| ACAN,ADAMTS7,AJAP1,CD93,CDH6,COL15A1,COL4A1, COL4A2,GPR116,GPR124,GPR4,KDR,MCAM,NID2, NOTCH3,NOVA2,PCDH12,PCDH17,TBX2,TBXA2R,TRPC6 | ACAN,AWAT2,ADM5,C20orf141,NCOR1P1,BPIFA2,CLEC4G, GPX5,ITIH3,KPRP,LCE2C,MEPE,CHODL-AS1,NOTCH3, OBP2A,OR2D2,PGLYRP3,SNORA79,STEAP4,TRIM6-TRIM34,ZSWIM2 |
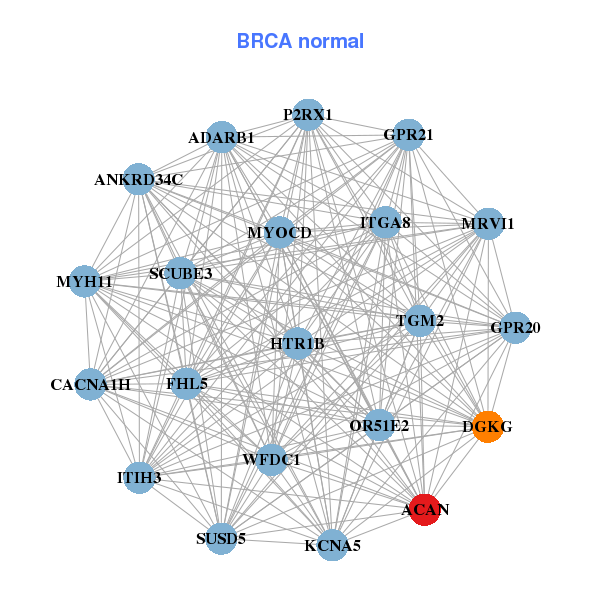
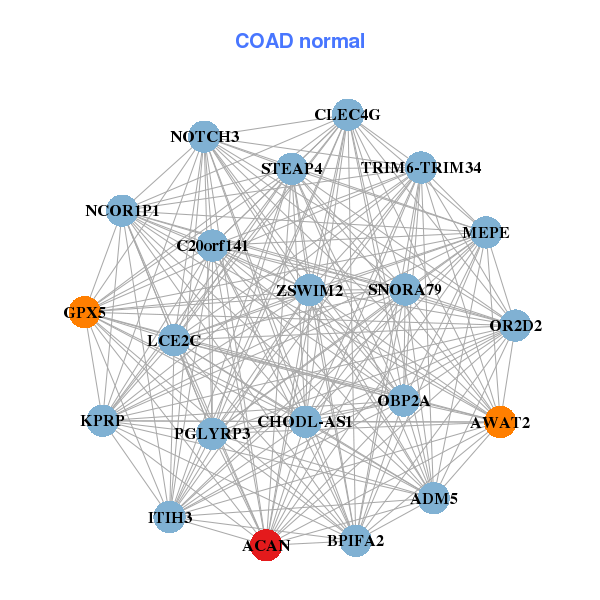
| * Co-Expression network figures were drawn using R package igraph. Only the top 20 genes with the highest correlations were shown. Red circle: input gene, orange circle: cell metabolism gene, sky circle: other gene |
: Open all plots for all cancer types
| Top |
: Open all interacting genes' information including KEGG pathway for all interacting genes from DAVID
| Top |
| Pharmacological Information for ACAN |
| DB Category | DB Name | DB's ID and Url link |
| * Gene Centered Interaction Network. |
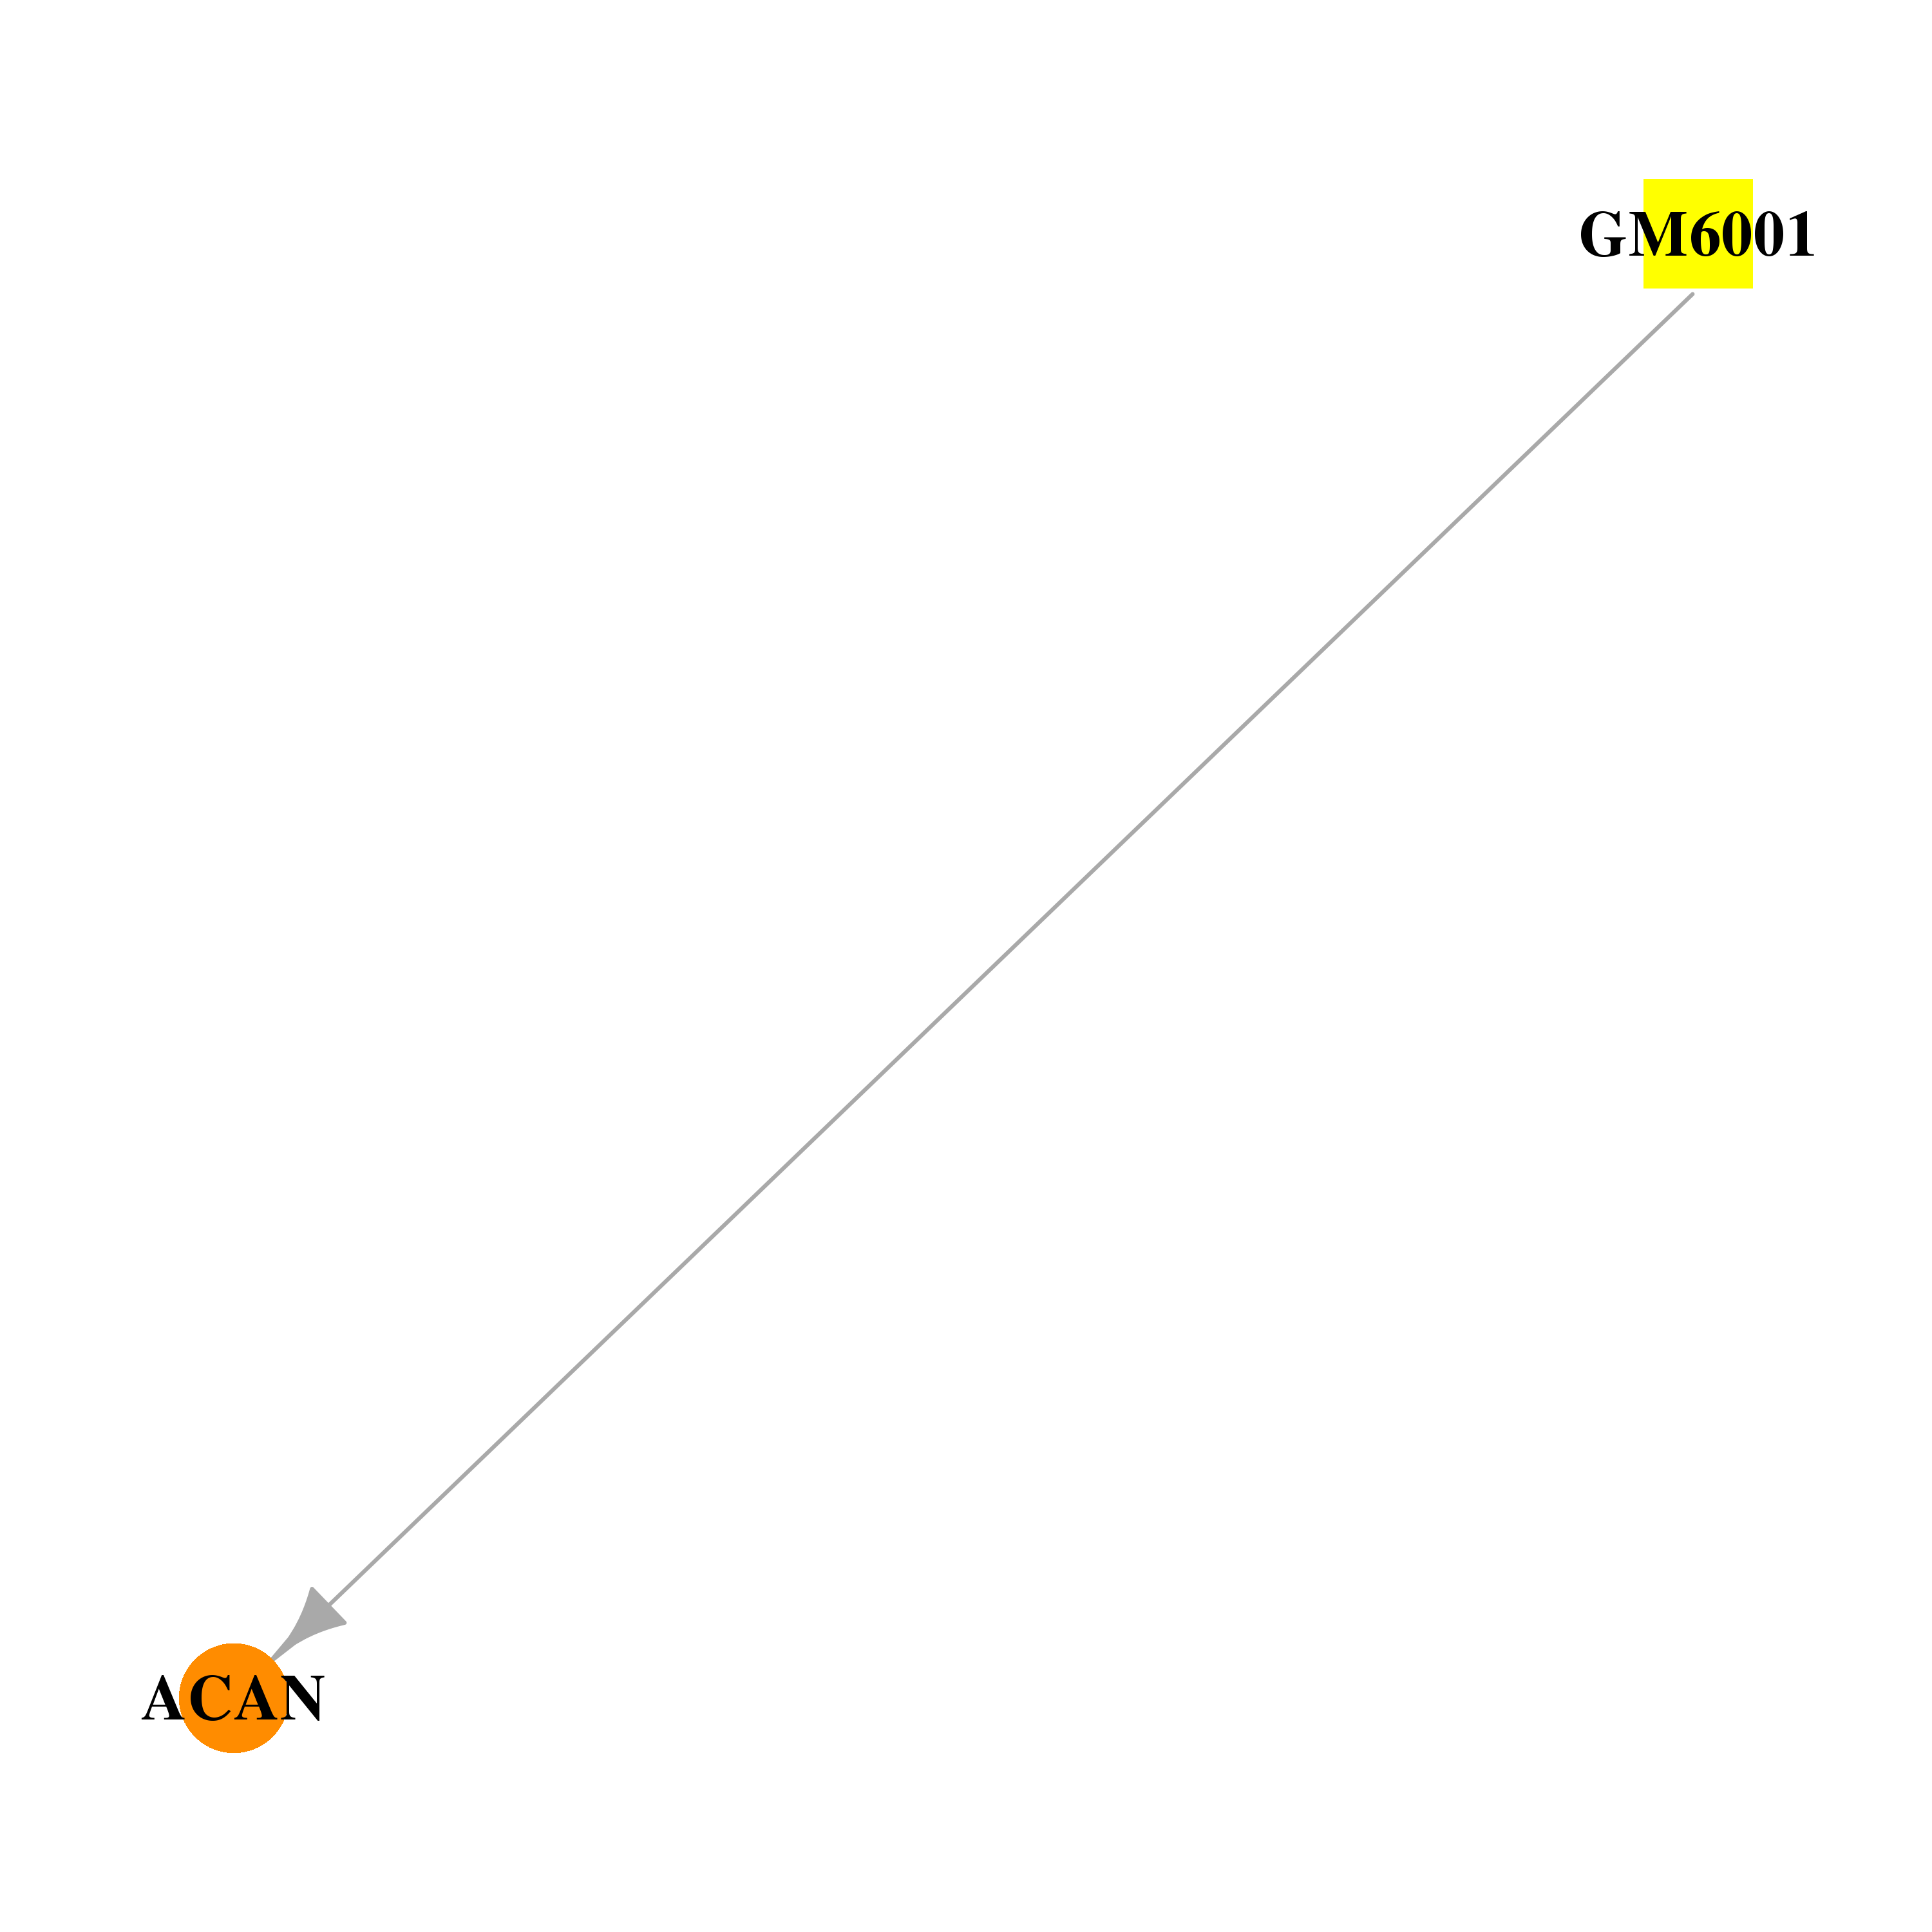 |
| * Drug Centered Interaction Network. |
| DrugBank ID | Target Name | Drug Groups | Generic Name | Drug Centered Network | Drug Structure |
| DB02255 | aggrecan | experimental | GM6001 | 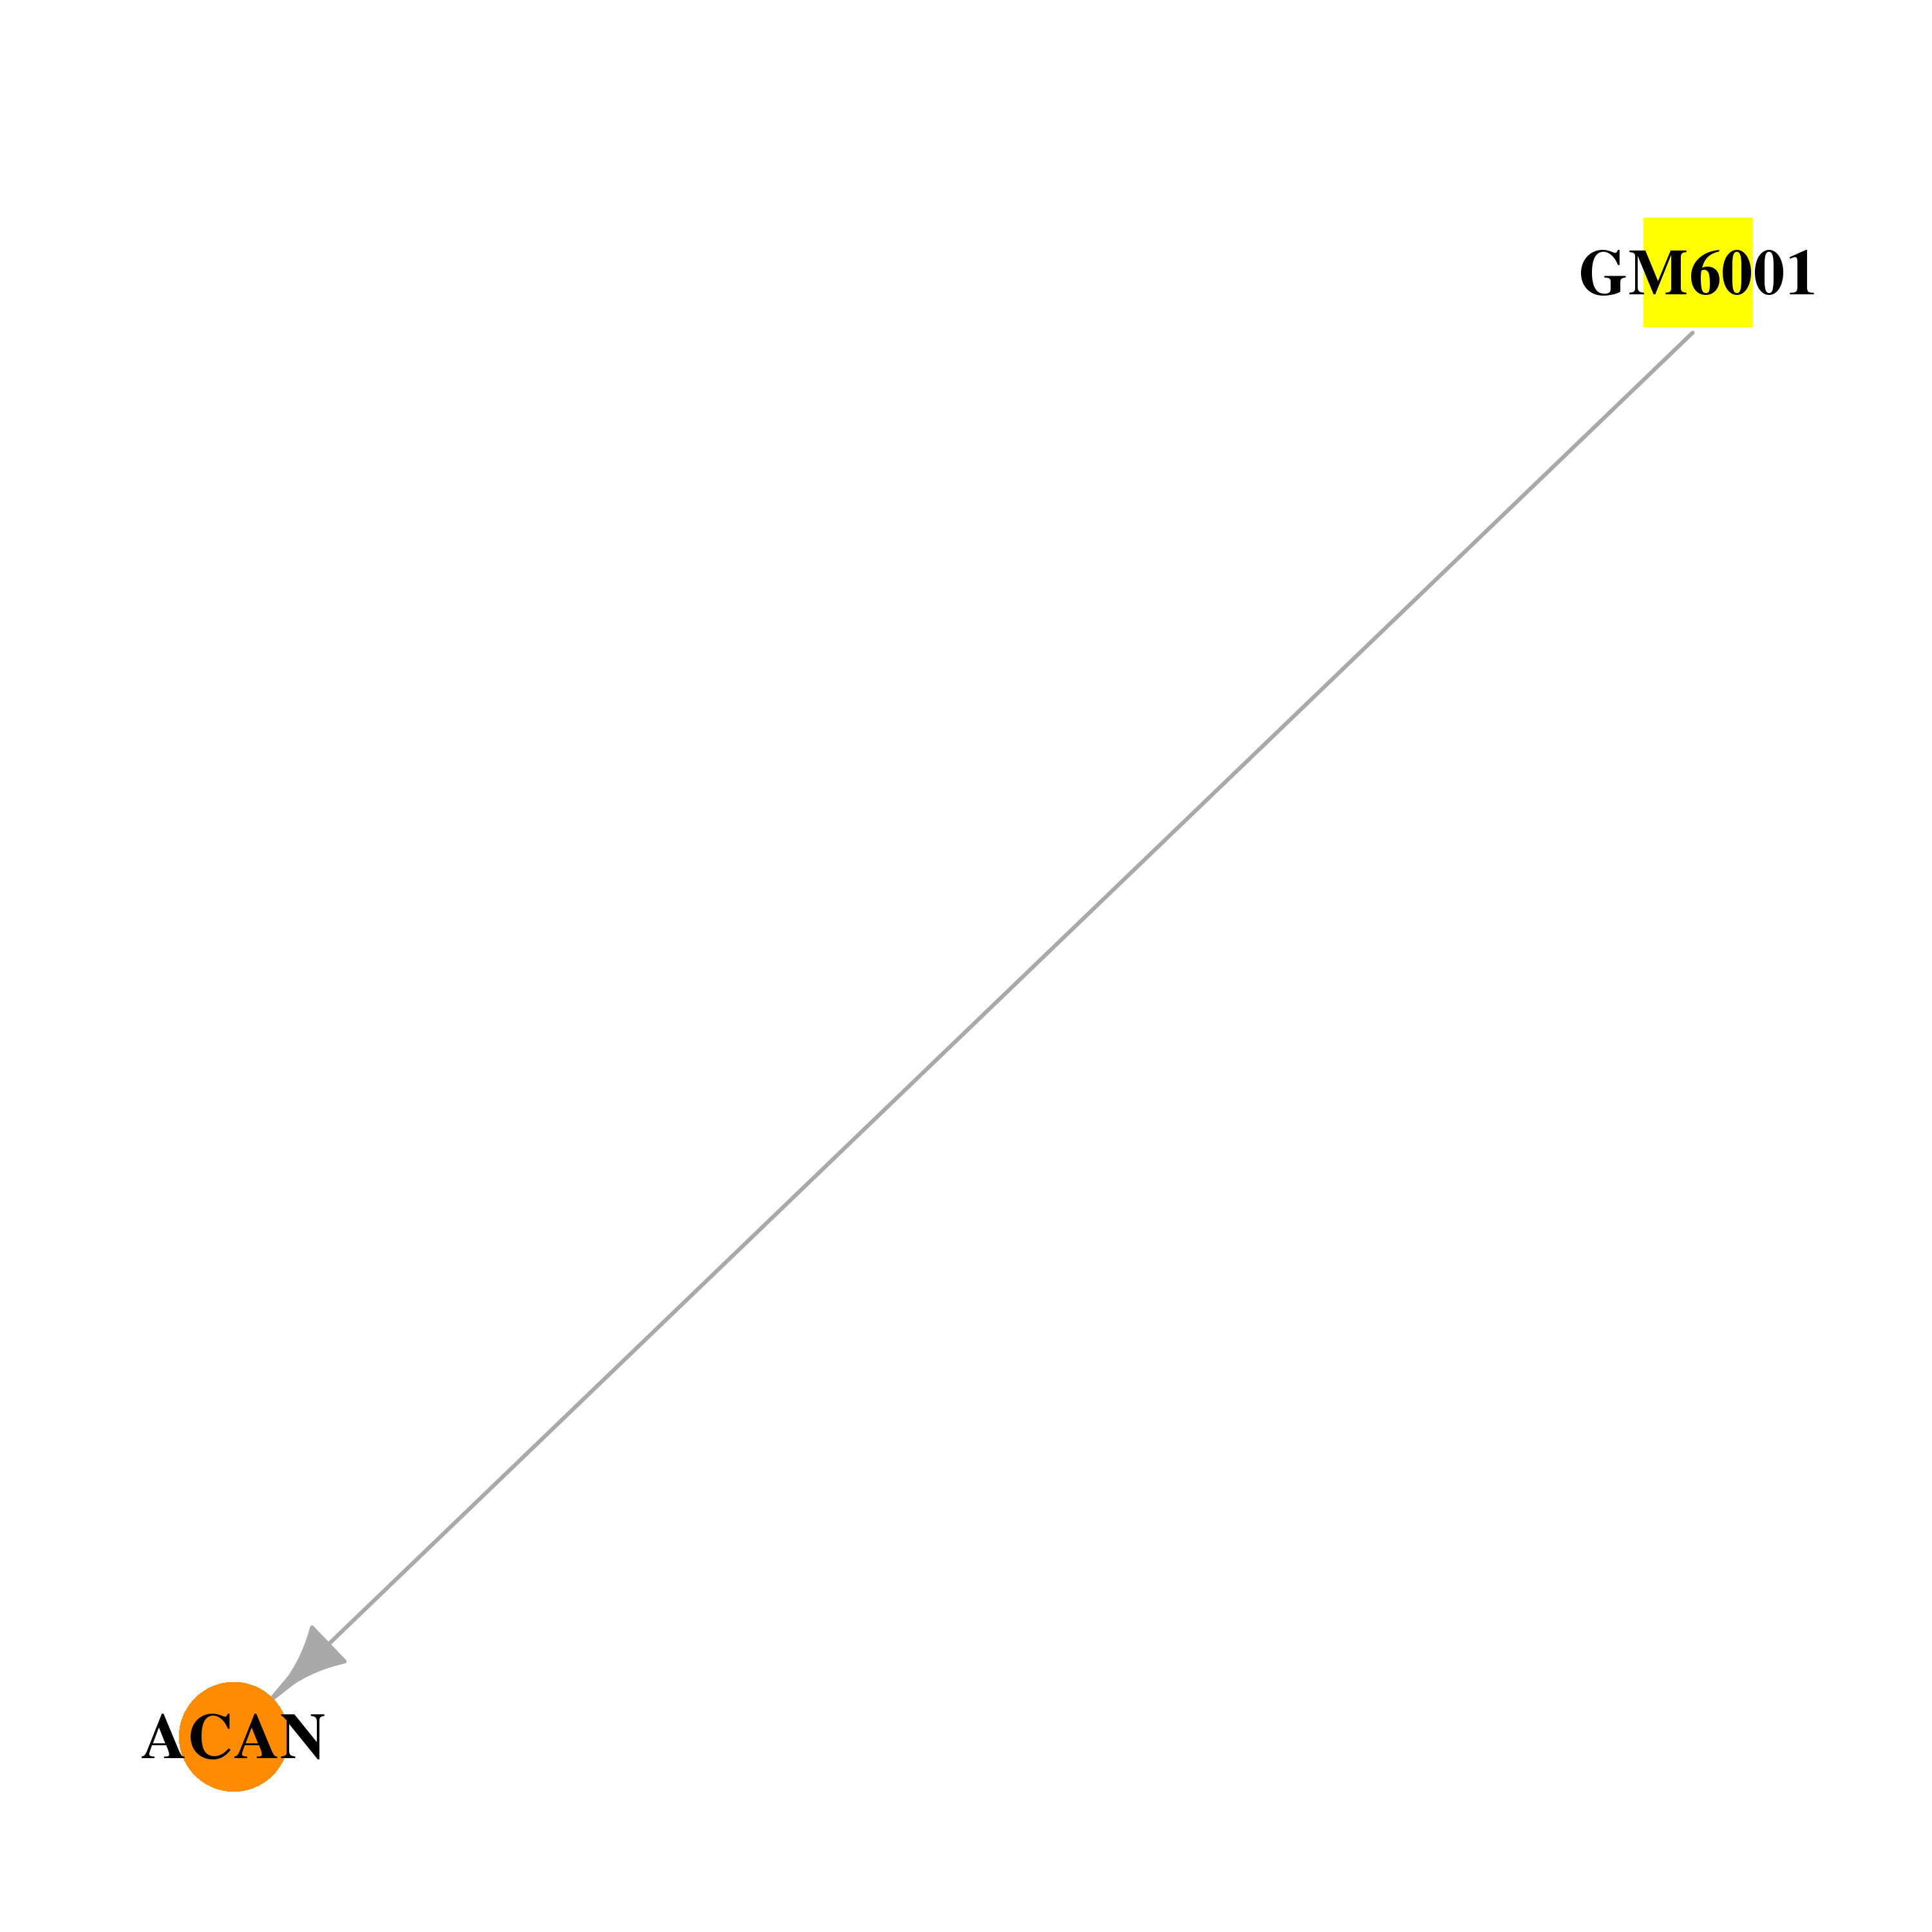 | 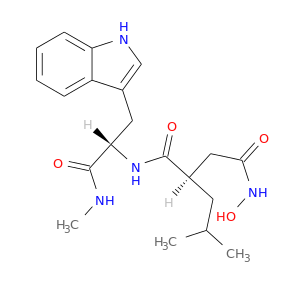 |
| Top |
| Cross referenced IDs for ACAN |
| * We obtained these cross-references from Uniprot database. It covers 150 different DBs, 18 categories. http://www.uniprot.org/help/cross_references_section |
: Open all cross reference information
|
Copyright © 2016-Present - The Univsersity of Texas Health Science Center at Houston @ |