|
||||||||||||||||||||||||||||||||||||||||||||||||||||||||||||||||||||||||||||||||||||||||||||||||||||||||||||||||||||||||||||||||||||||||||||||||||||||||||||||||||||||||||||||||||||||||||||||||||||||||||||||||||||||||||||||||||||||||||||||||||||||||||||||||||||||||||||||||||||||||||||||||||||||||||||||||||||||||||
| |
| Phenotypic Information (metabolism pathway, cancer, disease, phenome) |
| |
| |
| Gene-Gene Network Information: Co-Expression Network, Interacting Genes & KEGG |
| |
|


| Gene Summary for AGL |
| Basic gene info. | Gene symbol | AGL |
| Gene name | amylo-alpha-1, 6-glucosidase, 4-alpha-glucanotransferase | |
| Synonyms | GDE | |
| Cytomap | UCSC genome browser: 1p21 | |
| Genomic location | chr1 :100316044-100389579 | |
| Type of gene | protein-coding | |
| RefGenes | NM_000028.2, NM_000642.2,NM_000643.2,NM_000644.2,NM_000645.2, NM_000646.2, | |
| Ensembl id | ENSG00000162688 | |
| Description | amylo-1, 6-glucosidase, 4-alpha-glucanotransferaseglycogen debrancherglycogen debranching enzyme | |
| Modification date | 20141219 | |
| dbXrefs | MIM : 610860 | |
| HGNC : HGNC | ||
| Ensembl : ENSG00000162688 | ||
| HPRD : 01984 | ||
| Vega : OTTHUMG00000010803 | ||
| Protein | UniProt: P35573 go to UniProt's Cross Reference DB Table | |
| Expression | CleanEX: HS_AGL | |
| BioGPS: 178 | ||
| Gene Expression Atlas: ENSG00000162688 | ||
| The Human Protein Atlas: ENSG00000162688 | ||
| Pathway | NCI Pathway Interaction Database: AGL | |
| KEGG: AGL | ||
| REACTOME: AGL | ||
| ConsensusPathDB | ||
| Pathway Commons: AGL | ||
| Metabolism | MetaCyc: AGL | |
| HUMANCyc: AGL | ||
| Regulation | Ensembl's Regulation: ENSG00000162688 | |
| miRBase: chr1 :100,316,044-100,389,579 | ||
| TargetScan: NM_000028 | ||
| cisRED: ENSG00000162688 | ||
| Context | iHOP: AGL | |
| cancer metabolism search in PubMed: AGL | ||
| UCL Cancer Institute: AGL | ||
| Assigned class in ccmGDB | A - This gene has a literature evidence and it belongs to cancer gene. | |
| References showing role of AGL in cancer cell metabolism | 1. Guin S, Pollard C, Ru Y, Ritterson Lew C, Duex JE, et al. (2014) Role in tumor growth of a glycogen debranching enzyme lost in glycogen storage disease. J Natl Cancer Inst 106. doi: 10.1093/jnci/dju062. go to article | |
| Top |
| Phenotypic Information for AGL(metabolism pathway, cancer, disease, phenome) |
| Cancer | CGAP: AGL |
| Familial Cancer Database: AGL | |
| * This gene is included in those cancer gene databases. |
|
|
|
|
|
| . | ||||||||||||||||||||||||||||||||||||||||||||||||||||||||||||||||||||||||||||||||||||||||||||||||||||||||||||||||||||||||||||||||||||||||||||||||||||||||||||||||||||||||||||||||||||||||||||||||||||||||||||||||||||||||||||||||||||||||||||||||||||||||||||||||||||||||||||||||||||||||||||||||||||||||||||||||||||
Oncogene 1 | Significant driver gene in | |||||||||||||||||||||||||||||||||||||||||||||||||||||||||||||||||||||||||||||||||||||||||||||||||||||||||||||||||||||||||||||||||||||||||||||||||||||||||||||||||||||||||||||||||||||||||||||||||||||||||||||||||||||||||||||||||||||||||||||||||||||||||||||||||||||||||||||||||||||||||||||||||||||||||||||||||||||||||
| cf) number; DB name 1 Oncogene; http://nar.oxfordjournals.org/content/35/suppl_1/D721.long, 2 Tumor Suppressor gene; https://bioinfo.uth.edu/TSGene/, 3 Cancer Gene Census; http://www.nature.com/nrc/journal/v4/n3/abs/nrc1299.html, 4 CancerGenes; http://nar.oxfordjournals.org/content/35/suppl_1/D721.long, 5 Network of Cancer Gene; http://ncg.kcl.ac.uk/index.php, 1Therapeutic Vulnerabilities in Cancer; http://cbio.mskcc.org/cancergenomics/statius/ |
| KEGG_STARCH_AND_SUCROSE_METABOLISM REACTOME_METABOLISM_OF_CARBOHYDRATES REACTOME_GLUCOSE_METABOLISM | |
| OMIM | 232400; phenotype. 232400; phenotype. 610860; gene. 610860; gene. |
| Orphanet | 366; Glycogen storage disease due to glycogen debranching enzyme deficiency. 366; Glycogen storage disease due to glycogen debranching enzyme deficiency. |
| Disease | KEGG Disease: AGL |
| MedGen: AGL (Human Medical Genetics with Condition) | |
| ClinVar: AGL | |
| Phenotype | MGI: AGL (International Mouse Phenotyping Consortium) |
| PhenomicDB: AGL | |
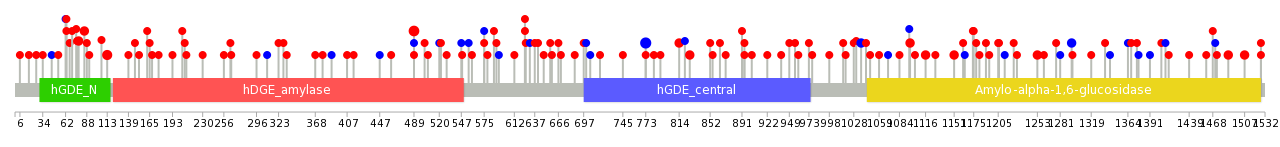
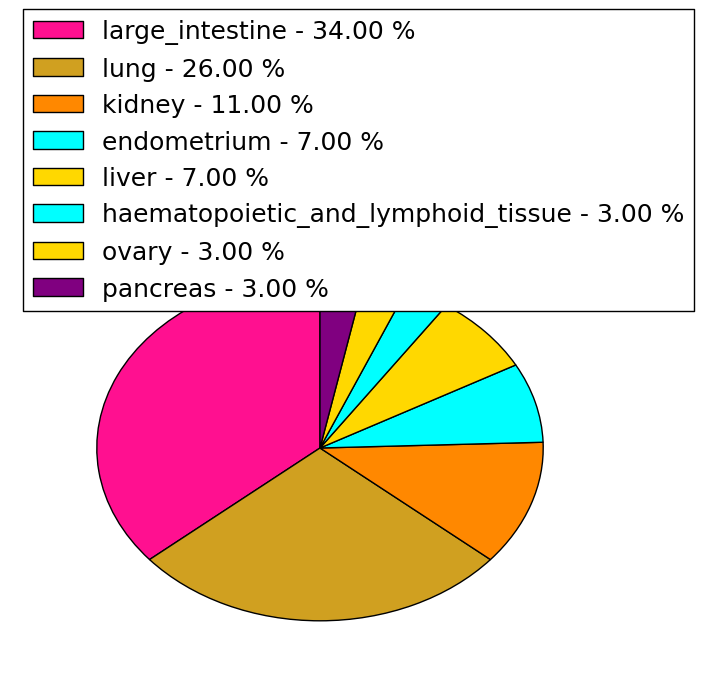
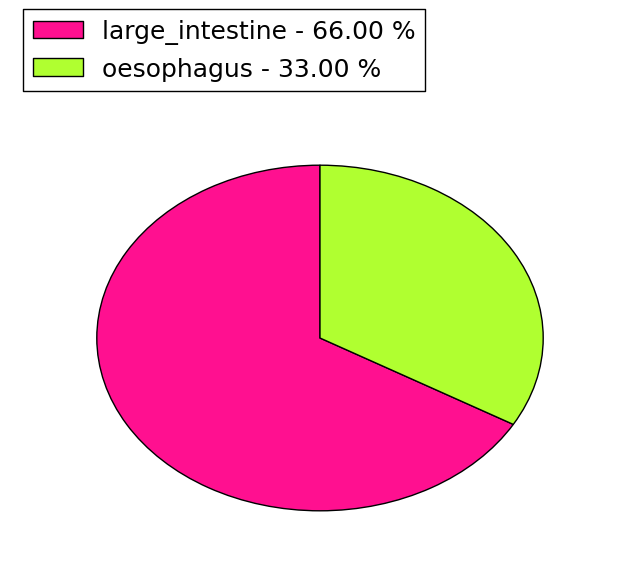
| Mutations for AGL |
| * Under tables are showing count per each tissue to give us broad intuition about tissue specific mutation patterns.You can go to the detailed page for each mutation database's web site. |
| - Statistics for Tissue and Mutation type | Top |
 |
| - For Inter-chromosomal Variations |
| * Inter-chromosomal variantions includes 'interchromosomal amplicon to amplicon', 'interchromosomal amplicon to non-amplified dna', 'interchromosomal insertion', 'Interchromosomal unknown type'. |
 |
| - For Intra-chromosomal Variations |
| There's no intra-chromosomal structural variation. |
| Sample | Symbol_a | Chr_a | Start_a | End_a | Symbol_b | Chr_b | Start_b | End_b |
| prostate | AGL | chr1 | 100361306 | 100361306 | chr21 | 20644212 | 20644212 |
| cf) Tissue number; Tissue name (1;Breast, 2;Central_nervous_system, 3;Haematopoietic_and_lymphoid_tissue, 4;Large_intestine, 5;Liver, 6;Lung, 7;Ovary, 8;Pancreas, 9;Prostate, 10;Skin, 11;Soft_tissue, 12;Upper_aerodigestive_tract) |
| * From mRNA Sanger sequences, Chitars2.0 arranged chimeric transcripts. This table shows AGL related fusion information. |
| ID | Head Gene | Tail Gene | Accession | Gene_a | qStart_a | qEnd_a | Chromosome_a | tStart_a | tEnd_a | Gene_a | qStart_a | qEnd_a | Chromosome_a | tStart_a | tEnd_a |
| Top |
| Mutation type/ Tissue ID | brca | cns | cerv | endome | haematopo | kidn | Lintest | liver | lung | ns | ovary | pancre | prost | skin | stoma | thyro | urina | |||
| Total # sample | 1 | 1 | 2 | 1 | ||||||||||||||||
| GAIN (# sample) | 2 | 1 | ||||||||||||||||||
| LOSS (# sample) | 1 | 1 |
| cf) Tissue ID; Tissue type (1; Breast, 2; Central_nervous_system, 3; Cervix, 4; Endometrium, 5; Haematopoietic_and_lymphoid_tissue, 6; Kidney, 7; Large_intestine, 8; Liver, 9; Lung, 10; NS, 11; Ovary, 12; Pancreas, 13; Prostate, 14; Skin, 15; Stomach, 16; Thyroid, 17; Urinary_tract) |
| Top |
|
 |
| Top |
| Stat. for Non-Synonymous SNVs (# total SNVs=108) | (# total SNVs=26) |
 |  |
(# total SNVs=2) | (# total SNVs=3) |
 |  |
| Top |
| * When you move the cursor on each content, you can see more deailed mutation information on the Tooltip. Those are primary_site,primary_histology,mutation(aa),pubmedID. |
| GRCh37 position | Mutation(aa) | Unique sampleID count |
| chr1:100349686-100349686 | p.E773E | 5 |
| chr1:100343239-100343239 | p.D489G | 4 |
| chr1:100378027-100378028 | p.N1304fs*7 | 3 |
| chr1:100327856-100327856 | p.L113V | 3 |
| chr1:100340251-100340251 | p.R323* | 3 |
| chr1:100382266-100382266 | p.R1487Q | 2 |
| chr1:100378009-100378009 | p.R1295R | 2 |
| chr1:100327229-100327229 | p.L85V | 2 |
| chr1:100366281-100366281 | p.R1151Q | 2 |
| chr1:100387127-100387127 | p.N1507Y | 2 |
| Top |
|
 |
| Point Mutation/ Tissue ID | 1 | 2 | 3 | 4 | 5 | 6 | 7 | 8 | 9 | 10 | 11 | 12 | 13 | 14 | 15 | 16 | 17 | 18 | 19 | 20 |
| # sample | 5 | 2 | 1 | 22 | 1 | 7 | 4 | 2 | 18 | 7 | 1 | 1 | 13 | 14 | 1 | 12 | ||||
| # mutation | 5 | 2 | 1 | 16 | 1 | 8 | 4 | 2 | 31 | 7 | 1 | 1 | 14 | 16 | 1 | 13 | ||||
| nonsynonymous SNV | 5 | 2 | 1 | 12 | 1 | 5 | 2 | 2 | 19 | 6 | 1 | 1 | 13 | 12 | 1 | 11 | ||||
| synonymous SNV | 4 | 3 | 2 | 12 | 1 | 1 | 4 | 2 |
| cf) Tissue ID; Tissue type (1; BLCA[Bladder Urothelial Carcinoma], 2; BRCA[Breast invasive carcinoma], 3; CESC[Cervical squamous cell carcinoma and endocervical adenocarcinoma], 4; COAD[Colon adenocarcinoma], 5; GBM[Glioblastoma multiforme], 6; Glioma Low Grade, 7; HNSC[Head and Neck squamous cell carcinoma], 8; KICH[Kidney Chromophobe], 9; KIRC[Kidney renal clear cell carcinoma], 10; KIRP[Kidney renal papillary cell carcinoma], 11; LAML[Acute Myeloid Leukemia], 12; LUAD[Lung adenocarcinoma], 13; LUSC[Lung squamous cell carcinoma], 14; OV[Ovarian serous cystadenocarcinoma ], 15; PAAD[Pancreatic adenocarcinoma], 16; PRAD[Prostate adenocarcinoma], 17; SKCM[Skin Cutaneous Melanoma], 18:STAD[Stomach adenocarcinoma], 19:THCA[Thyroid carcinoma], 20:UCEC[Uterine Corpus Endometrial Carcinoma]) |
| Top |
| * We represented just top 10 SNVs. When you move the cursor on each content, you can see more deailed mutation information on the Tooltip. Those are primary_site, primary_histology, mutation(aa), pubmedID. |
| Genomic Position | Mutation(aa) | Unique sampleID count |
| chr1:100349686 | p.E756E,AGL | 5 |
| chr1:100343239 | p.D472G,AGL | 4 |
| chr1:100358154 | p.R1099C,AGL | 2 |
| chr1:100327208 | p.D61N,AGL | 2 |
| chr1:100361928 | p.L1067V,AGL | 2 |
| chr1:100387120 | p.T28T,AGL | 1 |
| chr1:100340791 | p.Q1208K,AGL | 1 |
| chr1:100347238 | p.A230V,AGL | 1 |
| chr1:100366244 | p.L1451F,AGL | 1 |
| chr1:100327061 | p.S558S,AGL | 1 |
| * Copy number data were extracted from TCGA using R package TCGA-Assembler. The URLs of all public data files on TCGA DCC data server were gathered on Jan-05-2015. Function ProcessCNAData in TCGA-Assembler package was used to obtain gene-level copy number value which is calculated as the average copy number of the genomic region of a gene. |
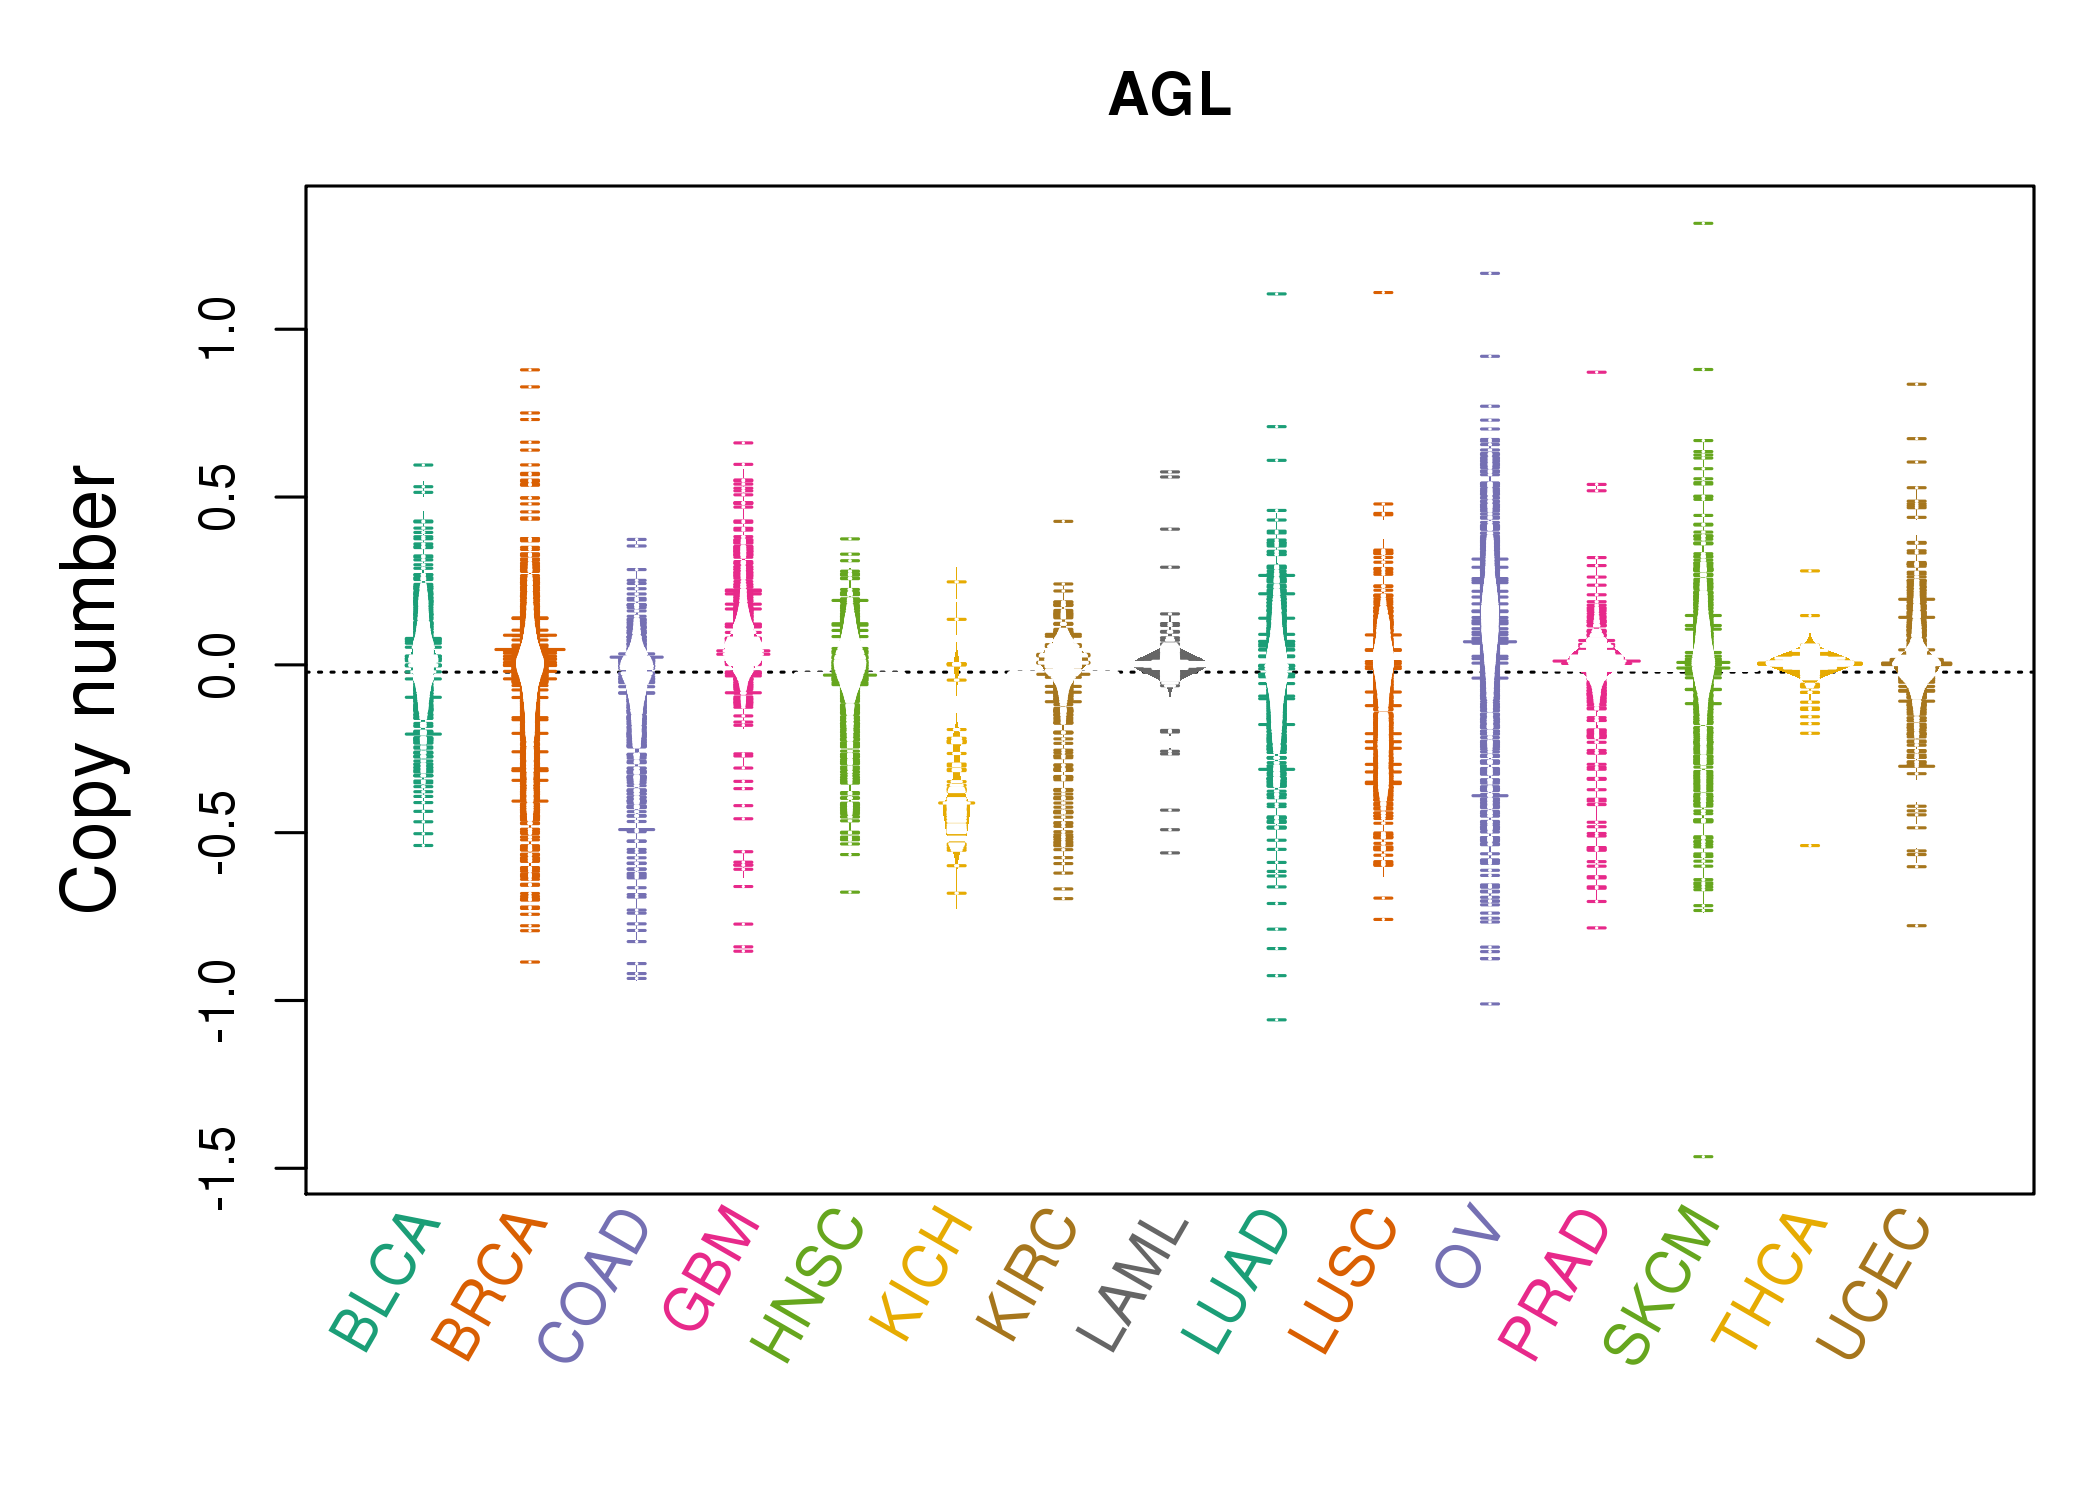 |
| cf) Tissue ID[Tissue type]: BLCA[Bladder Urothelial Carcinoma], BRCA[Breast invasive carcinoma], CESC[Cervical squamous cell carcinoma and endocervical adenocarcinoma], COAD[Colon adenocarcinoma], GBM[Glioblastoma multiforme], Glioma Low Grade, HNSC[Head and Neck squamous cell carcinoma], KICH[Kidney Chromophobe], KIRC[Kidney renal clear cell carcinoma], KIRP[Kidney renal papillary cell carcinoma], LAML[Acute Myeloid Leukemia], LUAD[Lung adenocarcinoma], LUSC[Lung squamous cell carcinoma], OV[Ovarian serous cystadenocarcinoma ], PAAD[Pancreatic adenocarcinoma], PRAD[Prostate adenocarcinoma], SKCM[Skin Cutaneous Melanoma], STAD[Stomach adenocarcinoma], THCA[Thyroid carcinoma], UCEC[Uterine Corpus Endometrial Carcinoma] |
| Top |
| Gene Expression for AGL |
| * CCLE gene expression data were extracted from CCLE_Expression_Entrez_2012-10-18.res: Gene-centric RMA-normalized mRNA expression data. |
 |
| * Normalized gene expression data of RNASeqV2 was extracted from TCGA using R package TCGA-Assembler. The URLs of all public data files on TCGA DCC data server were gathered at Jan-05-2015. Only eight cancer types have enough normal control samples for differential expression analysis. (t test, adjusted p<0.05 (using Benjamini-Hochberg FDR)) |
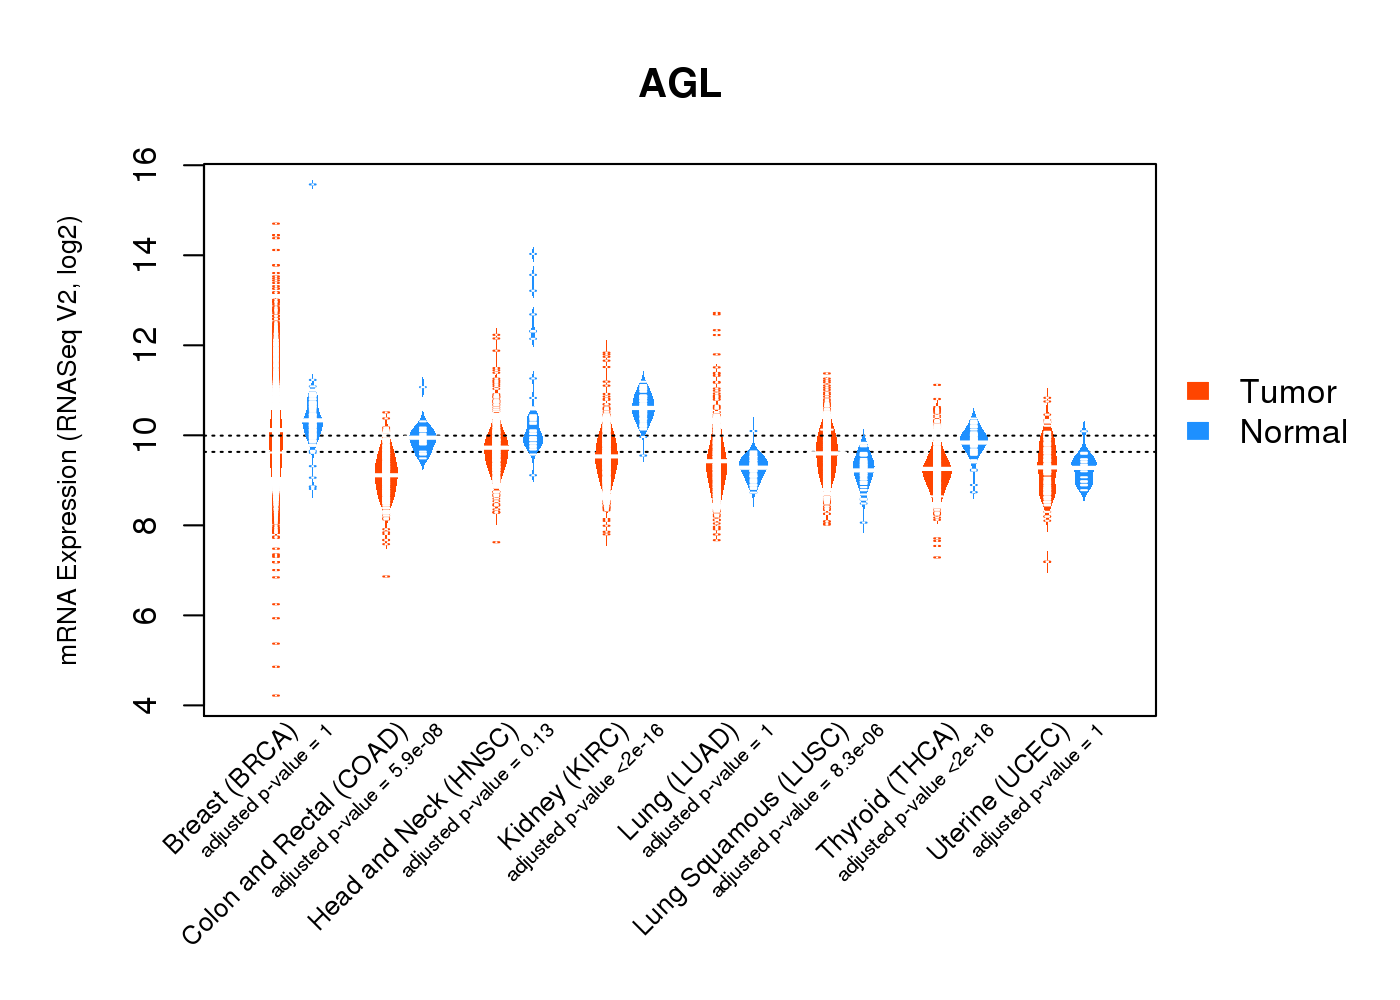 |
| Top |
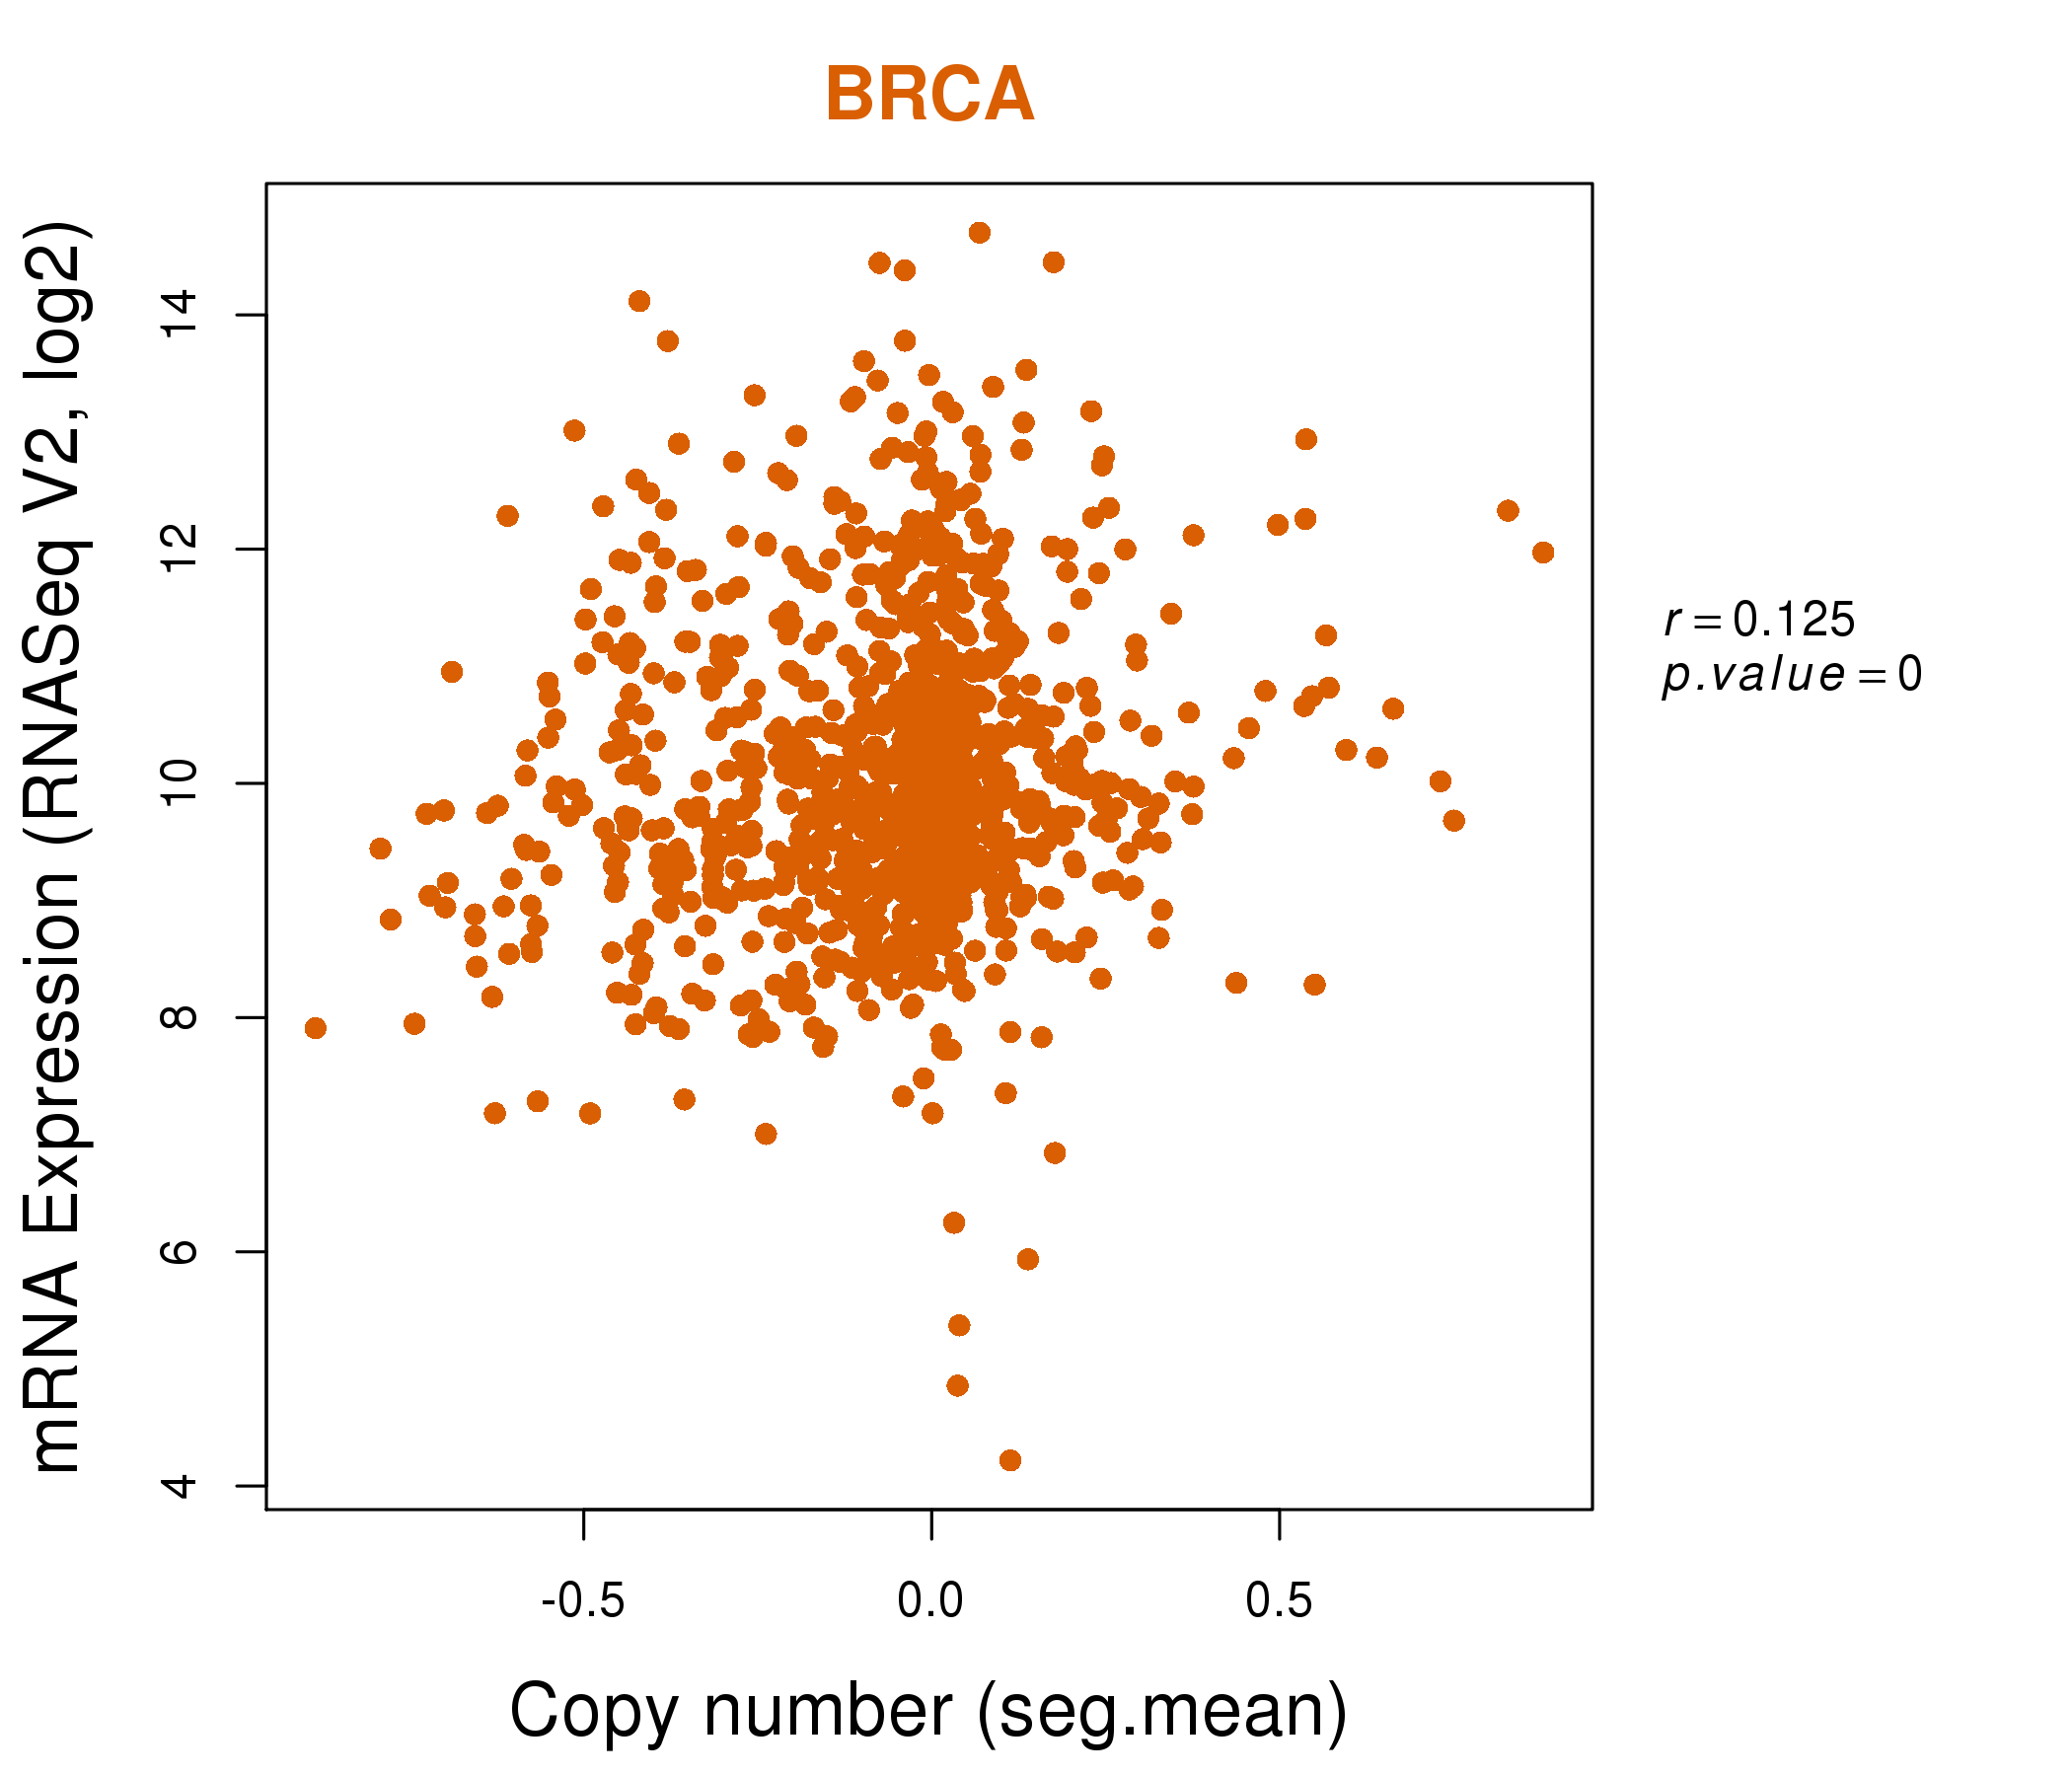
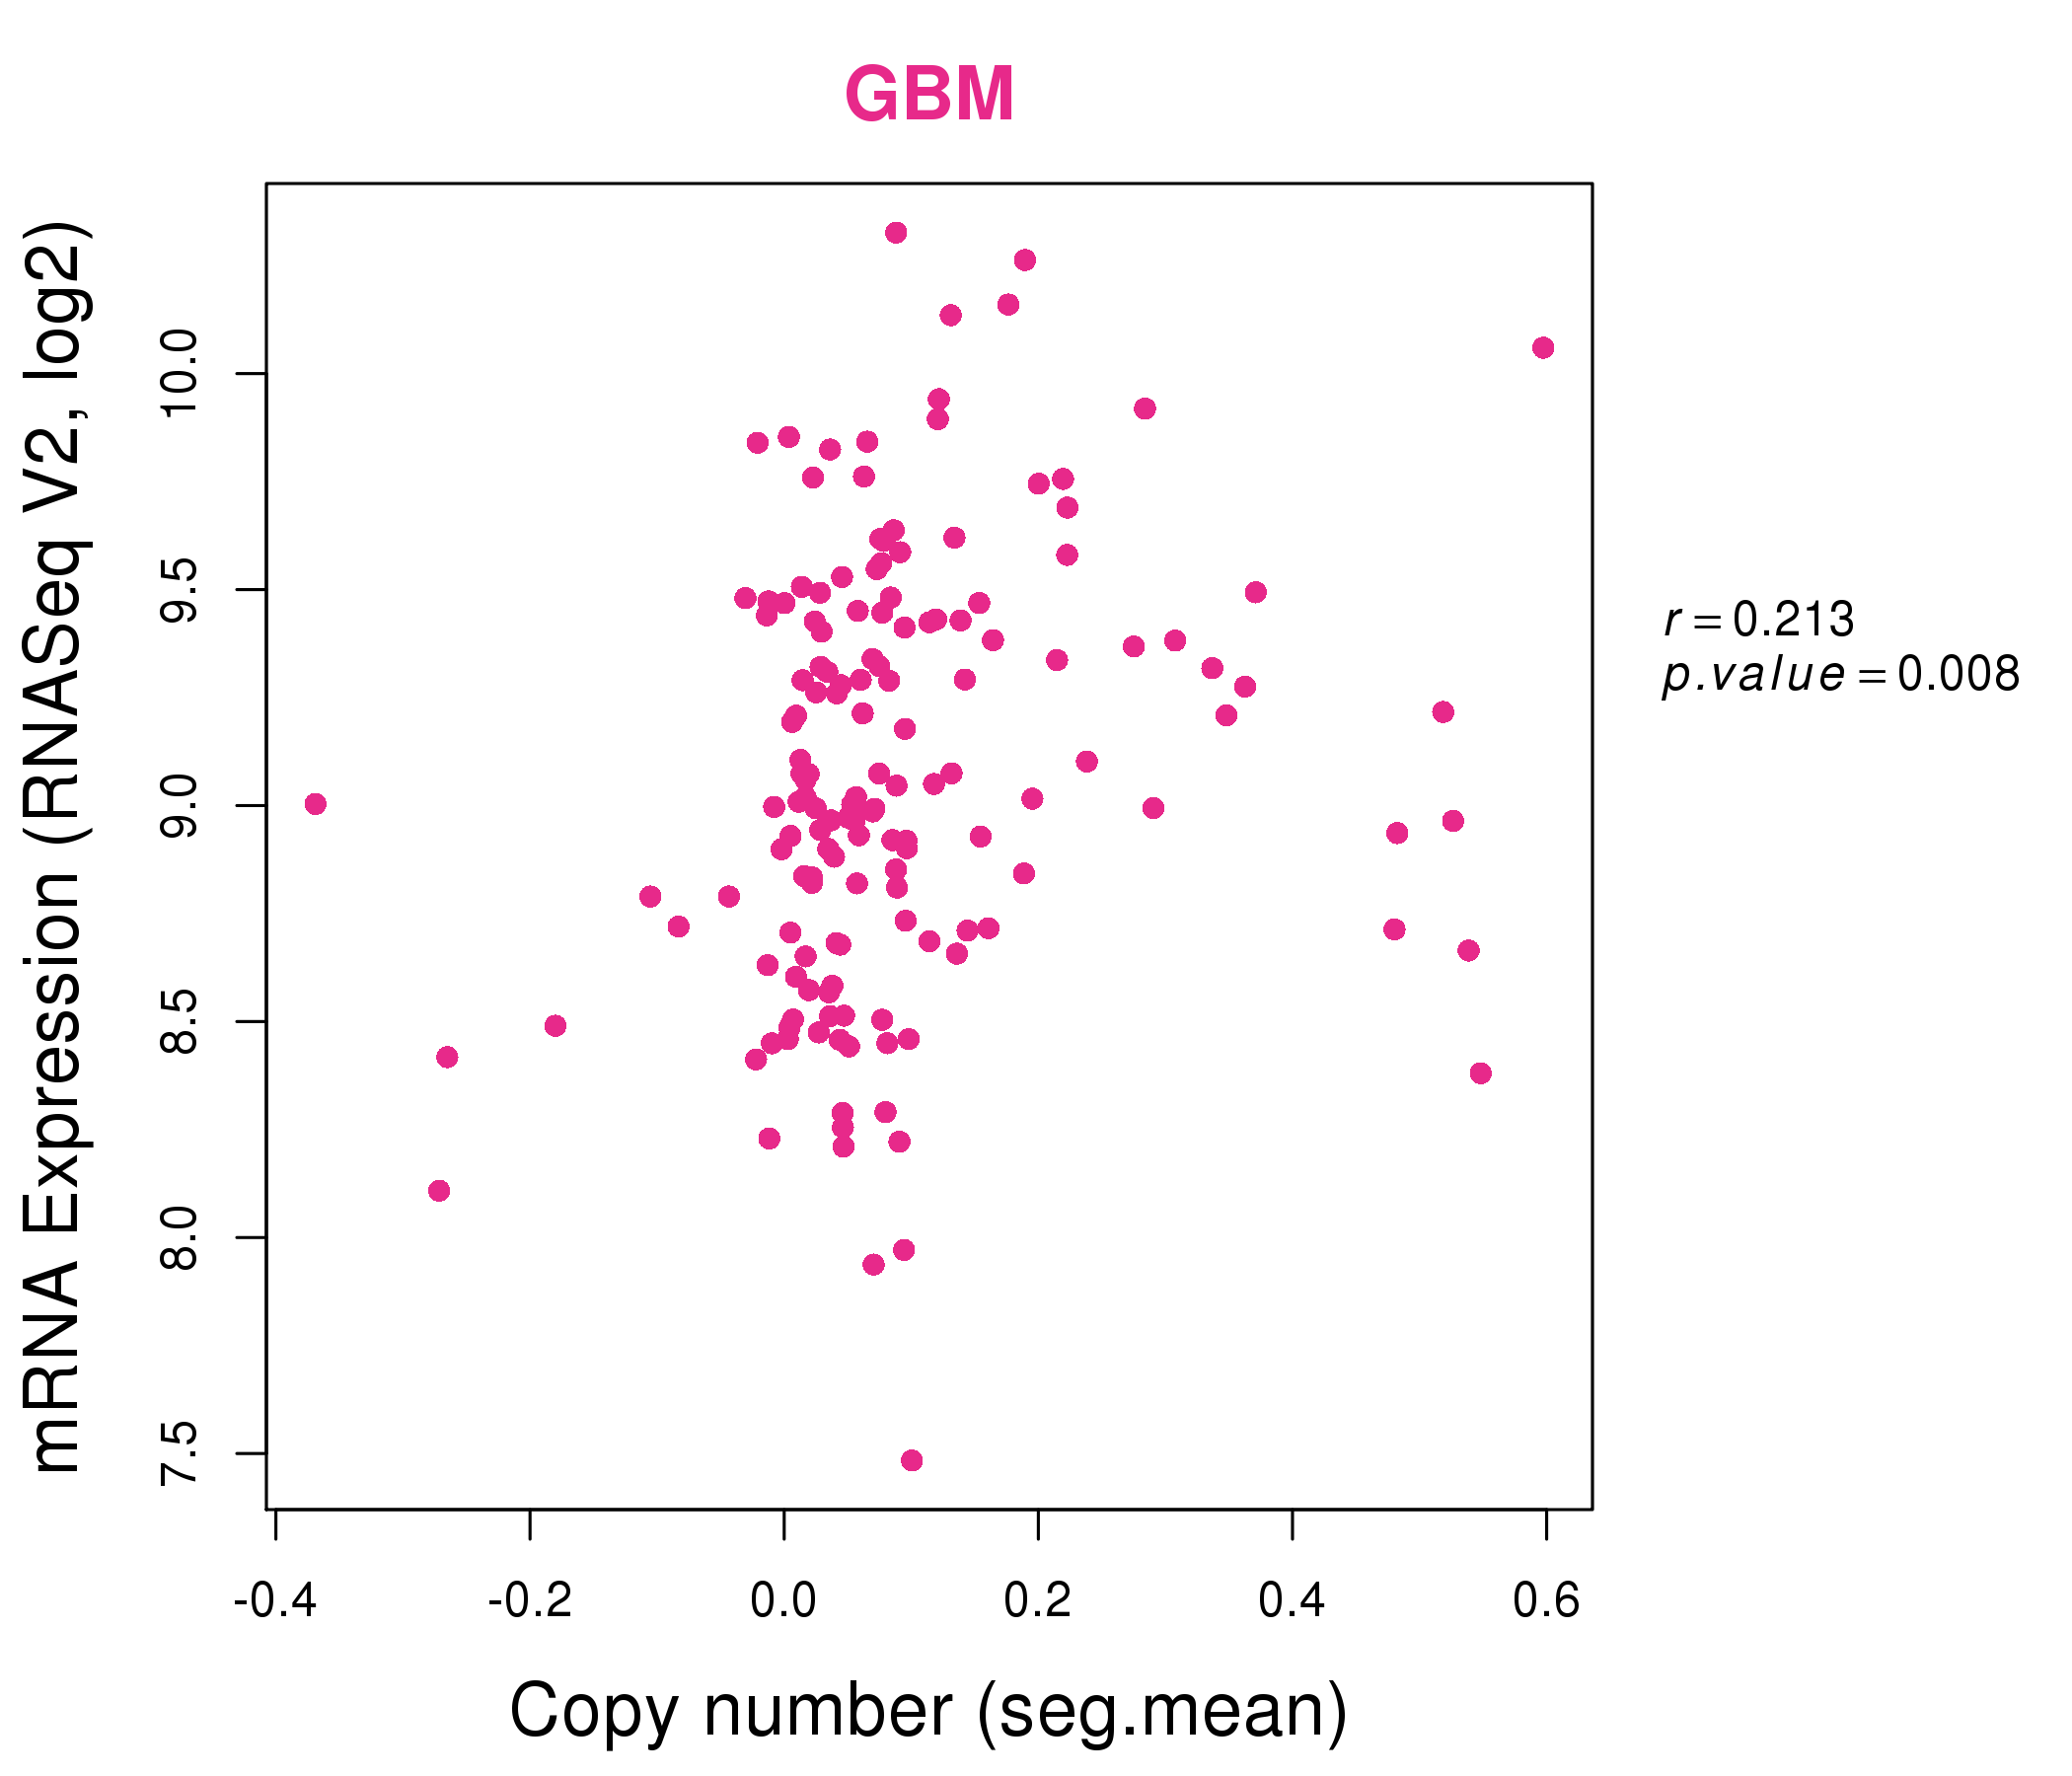
| * This plots show the correlation between CNV and gene expression. |
: Open all plots for all cancer types
 |
|
 |
|
| Top |
| Gene-Gene Network Information |
| * Co-Expression network figures were drawn using R package igraph. Only the top 20 genes with the highest correlations were shown. Red circle: input gene, orange circle: cell metabolism gene, sky circle: other gene |
: Open all plots for all cancer types
 |
|
| AGL,APC,LDLRAD4,DBT,DHX40,DTWD2,FAR1, FRRS1,HIAT1,HLTF,MAGI3,MAP9,NF1,PANK3, PRKG1,SLC35A3,TAAR1,TMTC3,TNKS2,UBR1,ZBTB11 | AGL,ARPP21,ASB14,BOLL,MLIP,CA3,CTNNA3, ENAM,FBXO40,LDB3,MYH1,MYLK3,MYOM1,NT5C1A, PGAM2,PYGM,SLC36A2,SYPL2,TMEM182,TRDN,USP13 |
 |
|
| ABCD3,AGL,AHCYL1,ANKRD13C,CSDE1,DBT,FAM73A, GNAI3,LRRC8B,MAN1A2,PIGK,PKN2,RSBN1,SLC25A24, SLC35A3,STXBP3,TMED5,TRIM33,USP33,ZNF644,ZZZ3 | AFAP1,AGL,CRYBG3,DCAF10,DCHS2,FBXO21,HSPG2, ITGA1,ITGA5,ITGB1,KIAA2022,KITLG,KLF12,MEF2A, RNF38,SCUBE3,SEMA3C,TAS1R1,TET1,TTC23,VCL |
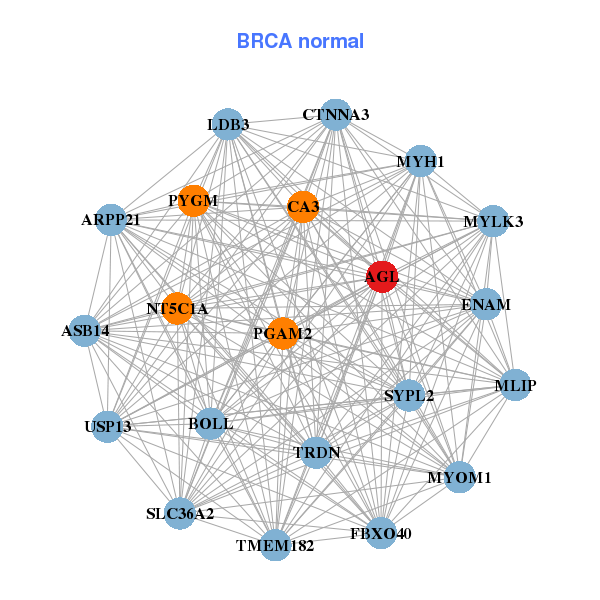

| * Co-Expression network figures were drawn using R package igraph. Only the top 20 genes with the highest correlations were shown. Red circle: input gene, orange circle: cell metabolism gene, sky circle: other gene |
: Open all plots for all cancer types
| Top |
: Open all interacting genes' information including KEGG pathway for all interacting genes from DAVID
| Top |
| Pharmacological Information for AGL |
| There's no related Drug. |
| Top |
| Cross referenced IDs for AGL |
| * We obtained these cross-references from Uniprot database. It covers 150 different DBs, 18 categories. http://www.uniprot.org/help/cross_references_section |
: Open all cross reference information
|
Copyright © 2016-Present - The Univsersity of Texas Health Science Center at Houston @ |