|
|||||||||||||||||||||||||||||||||||||||||||||||||||||||||||||||||||||||||||||||||||||||||||||||||||||||||||||||||||||||||||||||||||||||||||||||||||||||||||||||||||||||||||||||||||||||||||||||||||||||||||||||||||||||||||||||||||||||||||||||||||||||||||||||||||||||||||||||||||||||||||||||||||||||||||||||||||||||||||||||||||||||||||||||||||||||||||||||||||||||||||
| |
| Phenotypic Information (metabolism pathway, cancer, disease, phenome) |
| |
| |
| Gene-Gene Network Information: Co-Expression Network, Interacting Genes & KEGG |
| |
|


| Gene Summary for DNMT1 |
| Basic gene info. | Gene symbol | DNMT1 |
| Gene name | DNA (cytosine-5-)-methyltransferase 1 | |
| Synonyms | ADCADN|AIM|CXXC9|DNMT|HSN1E|MCMT | |
| Cytomap | UCSC genome browser: 19p13.2 | |
| Genomic location | chr19 :10244021-10305755 | |
| Type of gene | protein-coding | |
| RefGenes | NM_001130823.1, NM_001379.2, | |
| Ensembl id | ENSG00000130816 | |
| Description | CXXC-type zinc finger protein 9DNA (cytosine-5)-methyltransferase 1DNA MTase HsaIDNA methyltransferase HsaIm.HsaI | |
| Modification date | 20141222 | |
| dbXrefs | MIM : 126375 | |
| HGNC : HGNC | ||
| Ensembl : ENSG00000130816 | ||
| HPRD : 00532 | ||
| Vega : OTTHUMG00000180397 | ||
| Protein | UniProt: P26358 go to UniProt's Cross Reference DB Table | |
| Expression | CleanEX: HS_DNMT1 | |
| BioGPS: 1786 | ||
| Gene Expression Atlas: ENSG00000130816 | ||
| The Human Protein Atlas: ENSG00000130816 | ||
| Pathway | NCI Pathway Interaction Database: DNMT1 | |
| KEGG: DNMT1 | ||
| REACTOME: DNMT1 | ||
| ConsensusPathDB | ||
| Pathway Commons: DNMT1 | ||
| Metabolism | MetaCyc: DNMT1 | |
| HUMANCyc: DNMT1 | ||
| Regulation | Ensembl's Regulation: ENSG00000130816 | |
| miRBase: chr19 :10,244,021-10,305,755 | ||
| TargetScan: NM_001130823 | ||
| cisRED: ENSG00000130816 | ||
| Context | iHOP: DNMT1 | |
| cancer metabolism search in PubMed: DNMT1 | ||
| UCL Cancer Institute: DNMT1 | ||
| Assigned class in ccmGDB | A - This gene has a literature evidence and it belongs to cancer gene. | |
| References showing role of DNMT1 in cancer cell metabolism | 1. Oh HR, An CH, Yoo NJ, Lee SH (2014) Somatic mutations of amino acid metabolism-related genes in gastric and colorectal cancers and their regional heterogeneity--a short report. Cell Oncol (Dordr) 37: 455-461. doi: 10.1007/s13402-014-0209-1. go to article 2. Cheng TD, Makar KW, Neuhouser ML, Miller JW, Song X, et al. (2015) Folate-mediated one-carbon metabolism genes and interactions with nutritional factors on colorectal cancer risk: Women's Health Initiative Observational Study. Cancer. doi: 10.1002/cncr.29465. go to article 3. Fang YY, Bi FF, Zhou YM, Sun WP, Li CY, et al. (2015) Nicotinamide adenine dinucleotide (NAD) may affect DNA methyltransferase 1 through regulation of BRCA1 in ovarian cancer. Am J Cancer Res 5: 1199-1206. pmid: 4449447. go to article 4. Karlic H, Thaler R, Gerner C, Grunt T, Proestling K, et al. (2015) Inhibition of the mevalonate pathway affects epigenetic regulation in cancer cells. Cancer Genet 208: 241-252. doi: 10.1016/j.cancergen.2015.03.008. go to article | |
| Top |
| Phenotypic Information for DNMT1(metabolism pathway, cancer, disease, phenome) |
| Cancer | CGAP: DNMT1 |
| Familial Cancer Database: DNMT1 | |
| * This gene is included in those cancer gene databases. |
|
|
|
|
|
|
| |||||||||||||||||||||||||||||||||||||||||||||||||||||||||||||||||||||||||||||||||||||||||||||||||||||||||||||||||||||||||||||||||||||||||||||||||||||||||||||||||||||||||||||||||||||||||||||||||||||||||||||||||||||||||||||||||||||||||||||||||||||||||||||||||||||||||||||||||||||||||||||||||||||||||||||||||||||||||||||||||||||||||||||||||||||||||||||||||||||
Oncogene 1 | Significant driver gene in | ||||||||||||||||||||||||||||||||||||||||||||||||||||||||||||||||||||||||||||||||||||||||||||||||||||||||||||||||||||||||||||||||||||||||||||||||||||||||||||||||||||||||||||||||||||||||||||||||||||||||||||||||||||||||||||||||||||||||||||||||||||||||||||||||||||||||||||||||||||||||||||||||||||||||||||||||||||||||||||||||||||||||||||||||||||||||||||||||||||||||||
| cf) number; DB name 1 Oncogene; http://nar.oxfordjournals.org/content/35/suppl_1/D721.long, 2 Tumor Suppressor gene; https://bioinfo.uth.edu/TSGene/, 3 Cancer Gene Census; http://www.nature.com/nrc/journal/v4/n3/abs/nrc1299.html, 4 CancerGenes; http://nar.oxfordjournals.org/content/35/suppl_1/D721.long, 5 Network of Cancer Gene; http://ncg.kcl.ac.uk/index.php, 1Therapeutic Vulnerabilities in Cancer; http://cbio.mskcc.org/cancergenomics/statius/ |
| KEGG_CYSTEINE_AND_METHIONINE_METABOLISM | |
| OMIM | 126375; gene. 604121; phenotype. 614116; phenotype. |
| Orphanet | 314404; Autosomal dominant cerebellar ataxia, deafness and narcolepsy. |
| Disease | KEGG Disease: DNMT1 |
| MedGen: DNMT1 (Human Medical Genetics with Condition) | |
| ClinVar: DNMT1 | |
| Phenotype | MGI: DNMT1 (International Mouse Phenotyping Consortium) |
| PhenomicDB: DNMT1 | |
| Mutations for DNMT1 |
| * Under tables are showing count per each tissue to give us broad intuition about tissue specific mutation patterns.You can go to the detailed page for each mutation database's web site. |
| - Statistics for Tissue and Mutation type | Top |
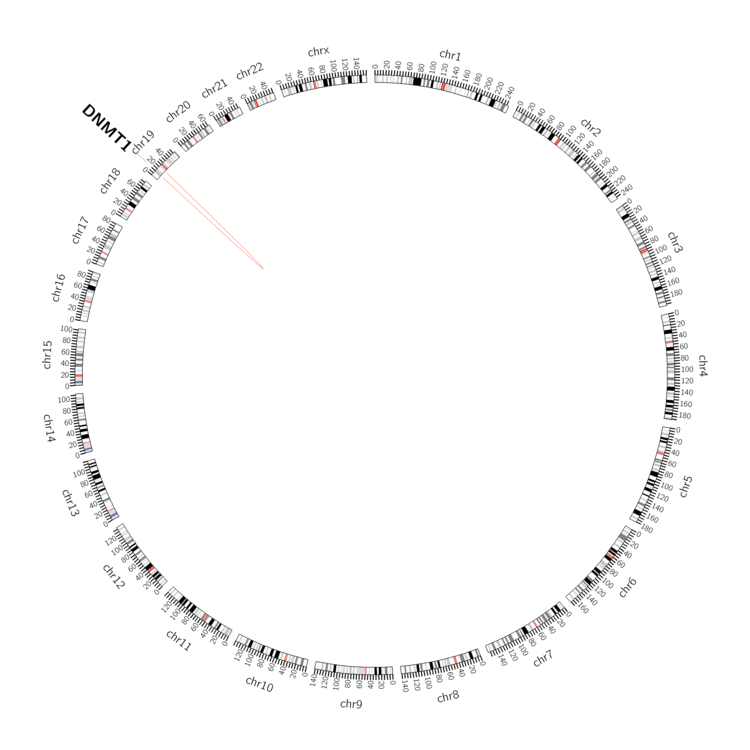 |
| - For Inter-chromosomal Variations |
| There's no inter-chromosomal structural variation. |
| - For Intra-chromosomal Variations |
| * Intra-chromosomal variantions includes 'intrachromosomal amplicon to amplicon', 'intrachromosomal amplicon to non-amplified dna', 'intrachromosomal deletion', 'intrachromosomal fold-back inversion', 'intrachromosomal inversion', 'intrachromosomal tandem duplication', 'Intrachromosomal unknown type', 'intrachromosomal with inverted orientation', 'intrachromosomal with non-inverted orientation'. |
 |
| Sample | Symbol_a | Chr_a | Start_a | End_a | Symbol_b | Chr_b | Start_b | End_b |
| pancreas | DNMT1 | chr19 | 10291529 | 10291549 | chr19 | 21523865 | 21523885 |
| cf) Tissue number; Tissue name (1;Breast, 2;Central_nervous_system, 3;Haematopoietic_and_lymphoid_tissue, 4;Large_intestine, 5;Liver, 6;Lung, 7;Ovary, 8;Pancreas, 9;Prostate, 10;Skin, 11;Soft_tissue, 12;Upper_aerodigestive_tract) |
| * From mRNA Sanger sequences, Chitars2.0 arranged chimeric transcripts. This table shows DNMT1 related fusion information. |
| ID | Head Gene | Tail Gene | Accession | Gene_a | qStart_a | qEnd_a | Chromosome_a | tStart_a | tEnd_a | Gene_a | qStart_a | qEnd_a | Chromosome_a | tStart_a | tEnd_a |
| AI810847 | DNMT1 | 12 | 213 | 19 | 10244022 | 10244223 | MALAT1 | 212 | 287 | 11 | 65268124 | 65268199 | |
| Top |
| Mutation type/ Tissue ID | brca | cns | cerv | endome | haematopo | kidn | Lintest | liver | lung | ns | ovary | pancre | prost | skin | stoma | thyro | urina | |||
| Total # sample | 1 | 2 | ||||||||||||||||||
| GAIN (# sample) | 1 | 2 | ||||||||||||||||||
| LOSS (# sample) |
| cf) Tissue ID; Tissue type (1; Breast, 2; Central_nervous_system, 3; Cervix, 4; Endometrium, 5; Haematopoietic_and_lymphoid_tissue, 6; Kidney, 7; Large_intestine, 8; Liver, 9; Lung, 10; NS, 11; Ovary, 12; Pancreas, 13; Prostate, 14; Skin, 15; Stomach, 16; Thyroid, 17; Urinary_tract) |
| Top |
|
 |
| Top |
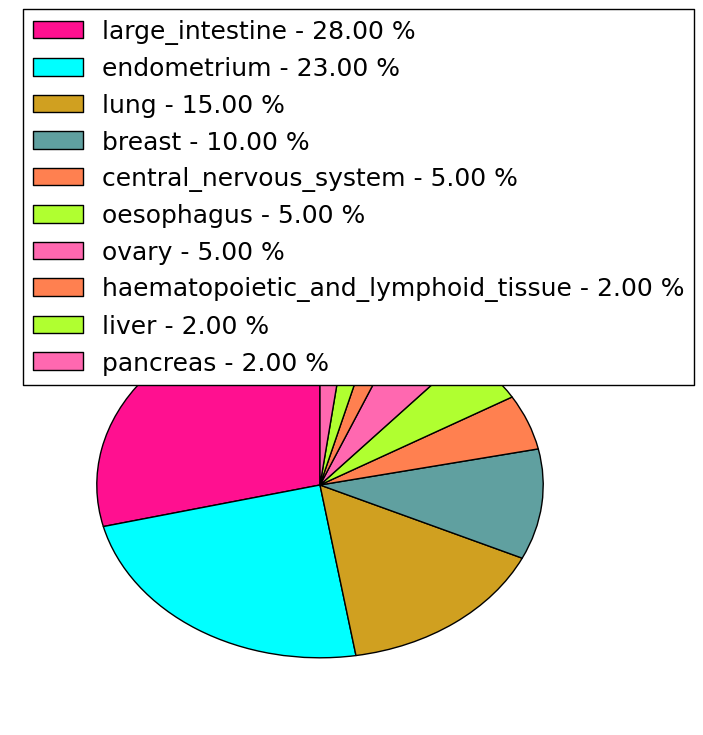
| Stat. for Non-Synonymous SNVs (# total SNVs=107) | (# total SNVs=39) |
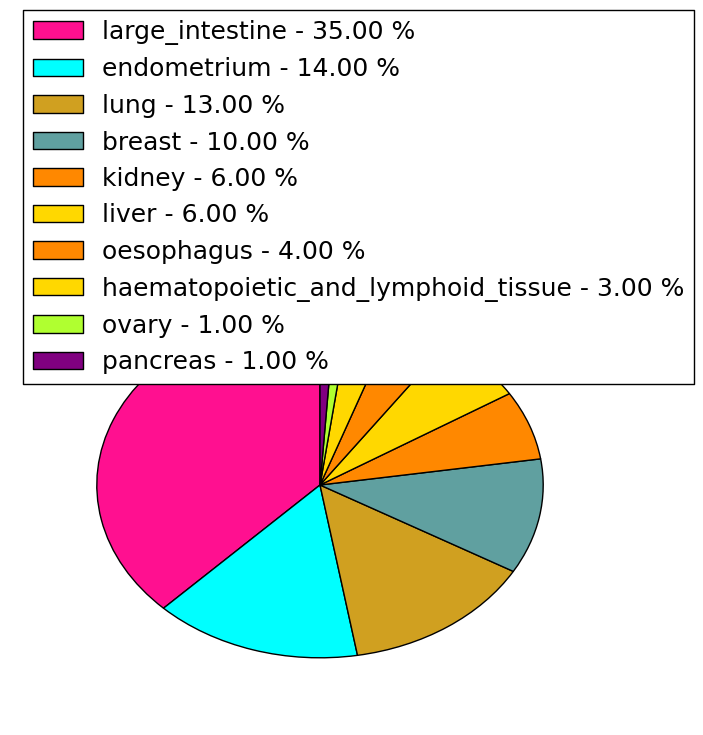 |  |
(# total SNVs=3) | (# total SNVs=1) |
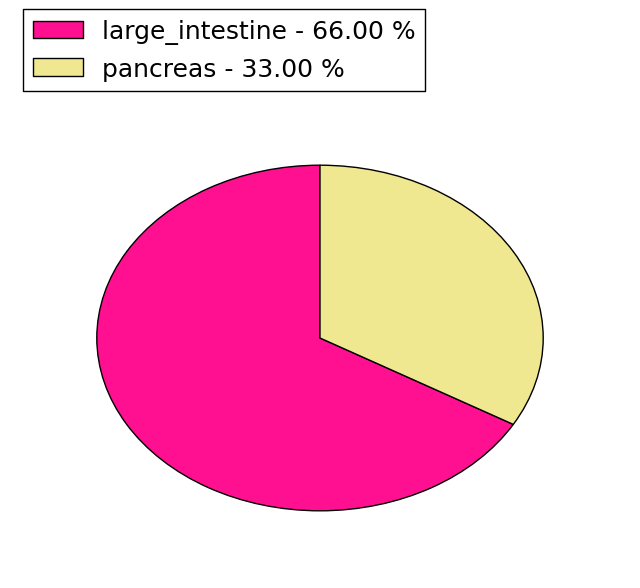 |  |
| Top |
| * When you move the cursor on each content, you can see more deailed mutation information on the Tooltip. Those are primary_site,primary_histology,mutation(aa),pubmedID. |
| GRCh37 position | Mutation(aa) | Unique sampleID count |
| chr19:10267124-10267124 | p.E432K | 5 |
| chr19:10254637-10254637 | p.R958H | 4 |
| chr19:10262139-10262139 | p.M718fs*59 | 3 |
| chr19:10249138-10249138 | p.K1348K | 3 |
| chr19:10249143-10249143 | p.D1347N | 3 |
| chr19:10291528-10291528 | p.E51K | 3 |
| chr19:10248608-10248608 | p.S1382L | 3 |
| chr19:10246816-10246816 | p.P1530L | 2 |
| chr19:10265724-10265724 | p.E485K | 2 |
| chr19:10287985-10287985 | p.T168T | 2 |
| Top |
|
 |
| Point Mutation/ Tissue ID | 1 | 2 | 3 | 4 | 5 | 6 | 7 | 8 | 9 | 10 | 11 | 12 | 13 | 14 | 15 | 16 | 17 | 18 | 19 | 20 |
| # sample | 5 | 6 | 1 | 30 | 2 | 6 | 7 | 1 | 7 | 4 | 2 | 3 | 15 | 16 | 1 | 17 | ||||
| # mutation | 6 | 6 | 1 | 30 | 2 | 6 | 7 | 1 | 7 | 4 | 2 | 3 | 21 | 18 | 1 | 20 | ||||
| nonsynonymous SNV | 4 | 3 | 1 | 21 | 4 | 7 | 1 | 5 | 4 | 2 | 3 | 15 | 14 | 1 | 13 | |||||
| synonymous SNV | 2 | 3 | 9 | 2 | 2 | 2 | 6 | 4 | 7 |
| cf) Tissue ID; Tissue type (1; BLCA[Bladder Urothelial Carcinoma], 2; BRCA[Breast invasive carcinoma], 3; CESC[Cervical squamous cell carcinoma and endocervical adenocarcinoma], 4; COAD[Colon adenocarcinoma], 5; GBM[Glioblastoma multiforme], 6; Glioma Low Grade, 7; HNSC[Head and Neck squamous cell carcinoma], 8; KICH[Kidney Chromophobe], 9; KIRC[Kidney renal clear cell carcinoma], 10; KIRP[Kidney renal papillary cell carcinoma], 11; LAML[Acute Myeloid Leukemia], 12; LUAD[Lung adenocarcinoma], 13; LUSC[Lung squamous cell carcinoma], 14; OV[Ovarian serous cystadenocarcinoma ], 15; PAAD[Pancreatic adenocarcinoma], 16; PRAD[Prostate adenocarcinoma], 17; SKCM[Skin Cutaneous Melanoma], 18:STAD[Stomach adenocarcinoma], 19:THCA[Thyroid carcinoma], 20:UCEC[Uterine Corpus Endometrial Carcinoma]) |
| Top |
| * We represented just top 10 SNVs. When you move the cursor on each content, you can see more deailed mutation information on the Tooltip. Those are primary_site, primary_histology, mutation(aa), pubmedID. |
| Genomic Position | Mutation(aa) | Unique sampleID count |
| chr19:10267124 | p.E51K,DNMT1 | 3 |
| chr19:10291528 | p.E432K,DNMT1 | 3 |
| chr19:10277310 | p.G269G,DNMT1 | 3 |
| chr19:10250386 | p.P1325S,DNMT1 | 2 |
| chr19:10257086 | p.A554P,DNMT1 | 2 |
| chr19:10265724 | p.R1289H,DNMT1 | 2 |
| chr19:10246814 | p.N929N,DNMT1 | 2 |
| chr19:10249209 | p.E485K,DNMT1 | 2 |
| chr19:10265386 | p.E1531Q,DNMT1 | 2 |
| chr19:10246815 | p.T382R,DNMT1 | 1 |
| * Copy number data were extracted from TCGA using R package TCGA-Assembler. The URLs of all public data files on TCGA DCC data server were gathered on Jan-05-2015. Function ProcessCNAData in TCGA-Assembler package was used to obtain gene-level copy number value which is calculated as the average copy number of the genomic region of a gene. |
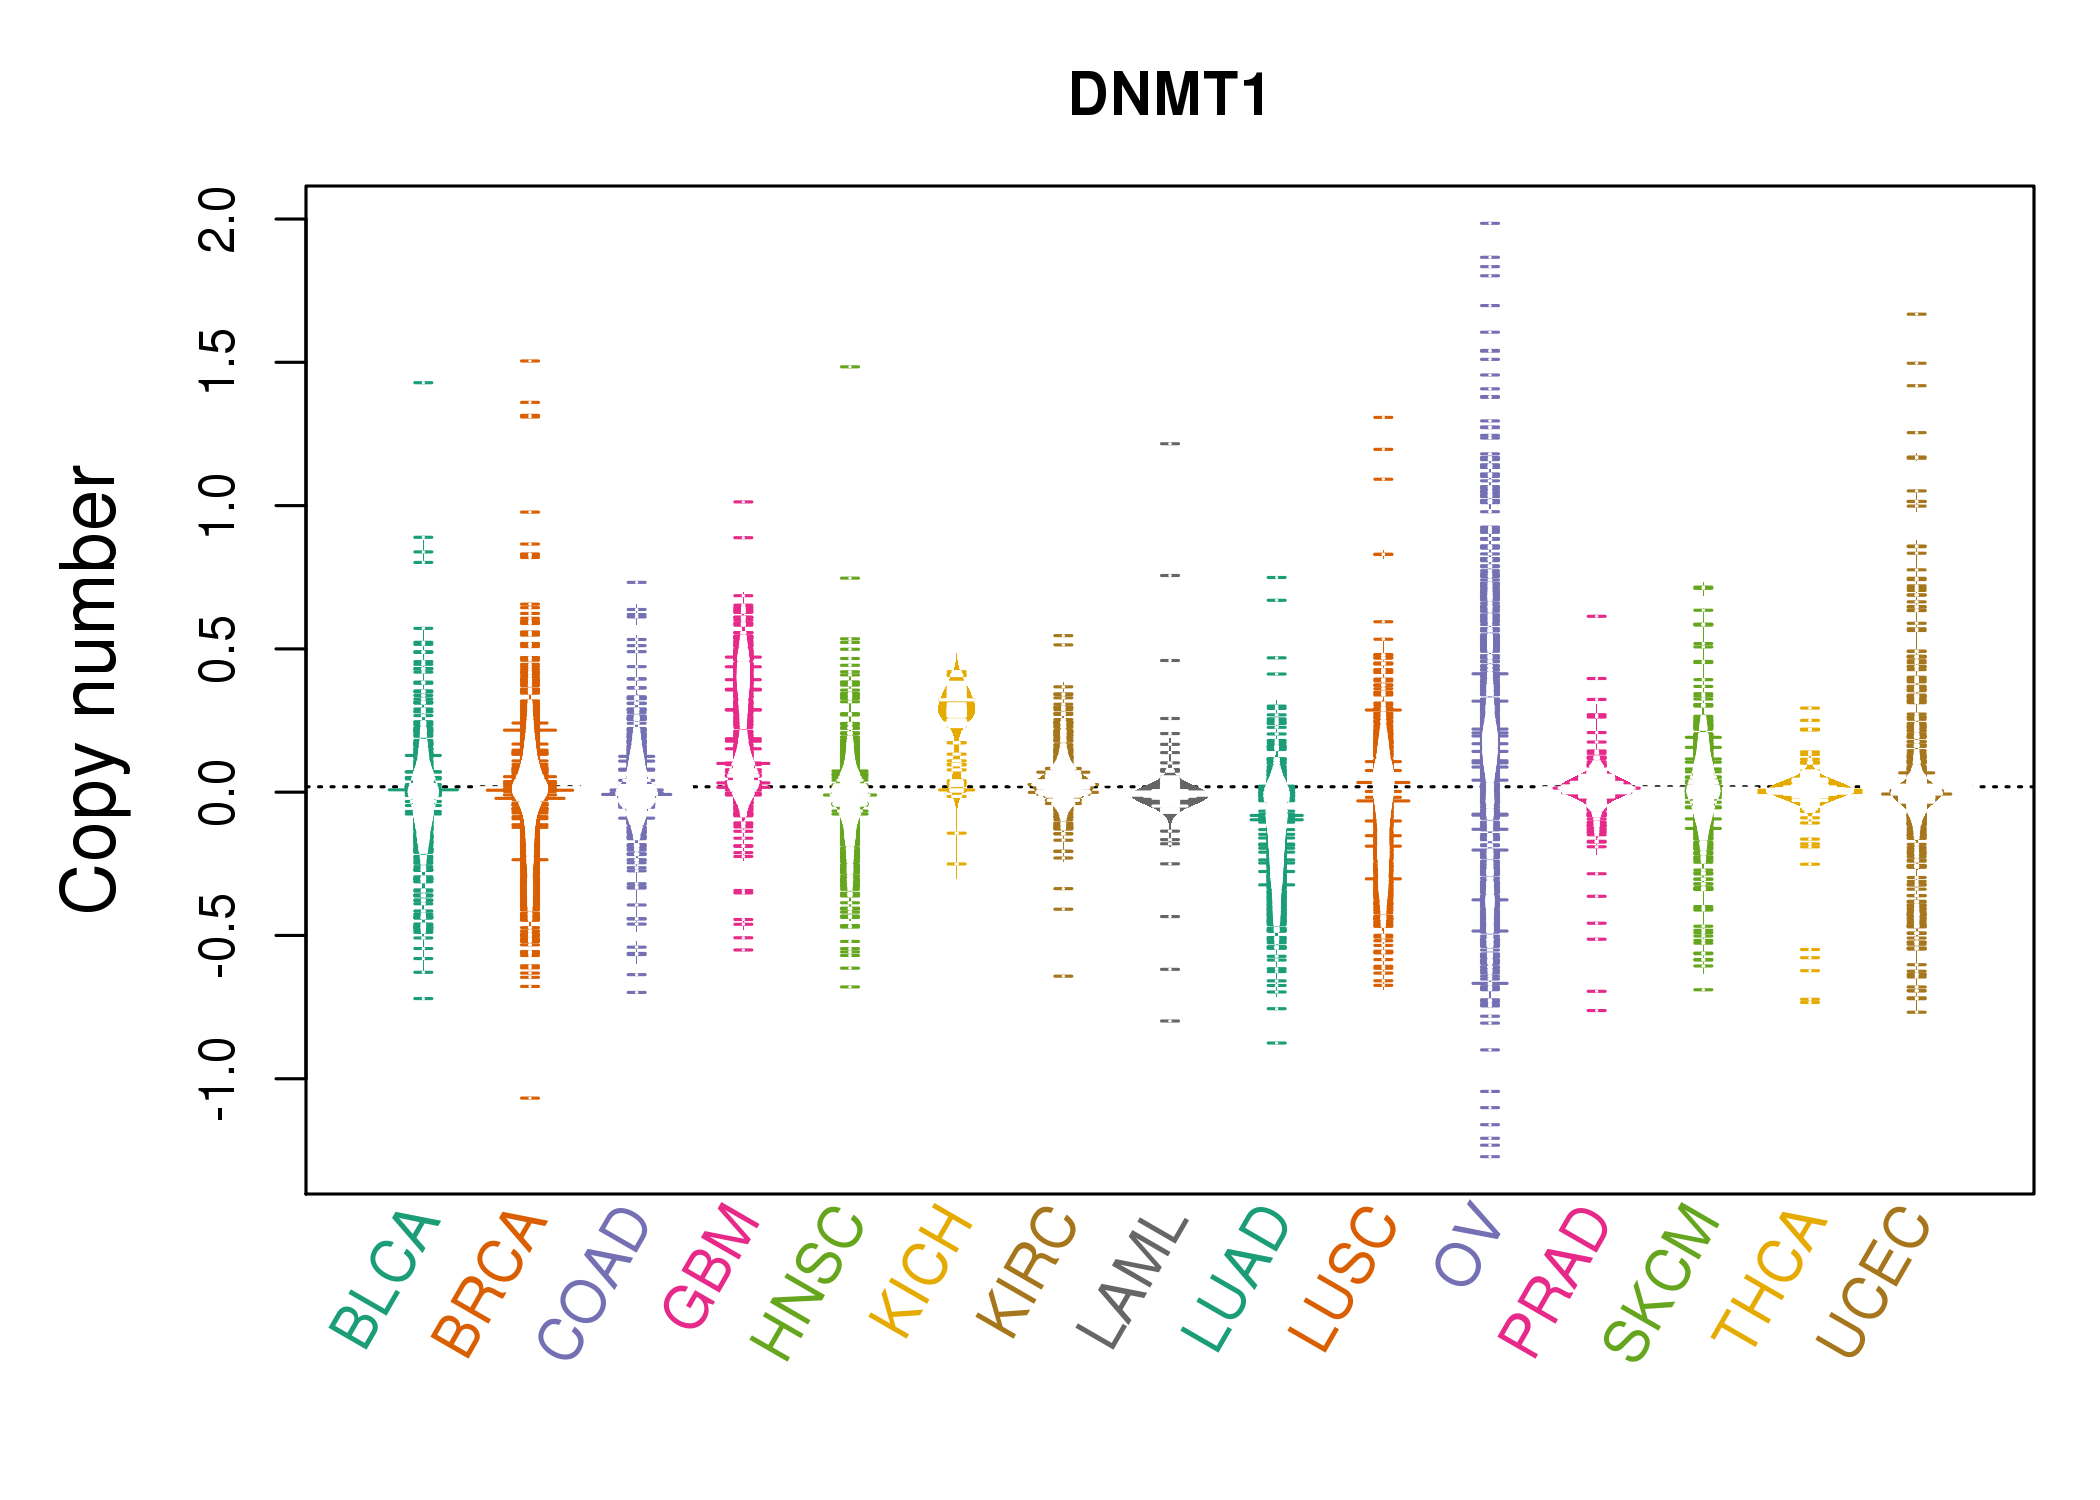 |
| cf) Tissue ID[Tissue type]: BLCA[Bladder Urothelial Carcinoma], BRCA[Breast invasive carcinoma], CESC[Cervical squamous cell carcinoma and endocervical adenocarcinoma], COAD[Colon adenocarcinoma], GBM[Glioblastoma multiforme], Glioma Low Grade, HNSC[Head and Neck squamous cell carcinoma], KICH[Kidney Chromophobe], KIRC[Kidney renal clear cell carcinoma], KIRP[Kidney renal papillary cell carcinoma], LAML[Acute Myeloid Leukemia], LUAD[Lung adenocarcinoma], LUSC[Lung squamous cell carcinoma], OV[Ovarian serous cystadenocarcinoma ], PAAD[Pancreatic adenocarcinoma], PRAD[Prostate adenocarcinoma], SKCM[Skin Cutaneous Melanoma], STAD[Stomach adenocarcinoma], THCA[Thyroid carcinoma], UCEC[Uterine Corpus Endometrial Carcinoma] |
| Top |
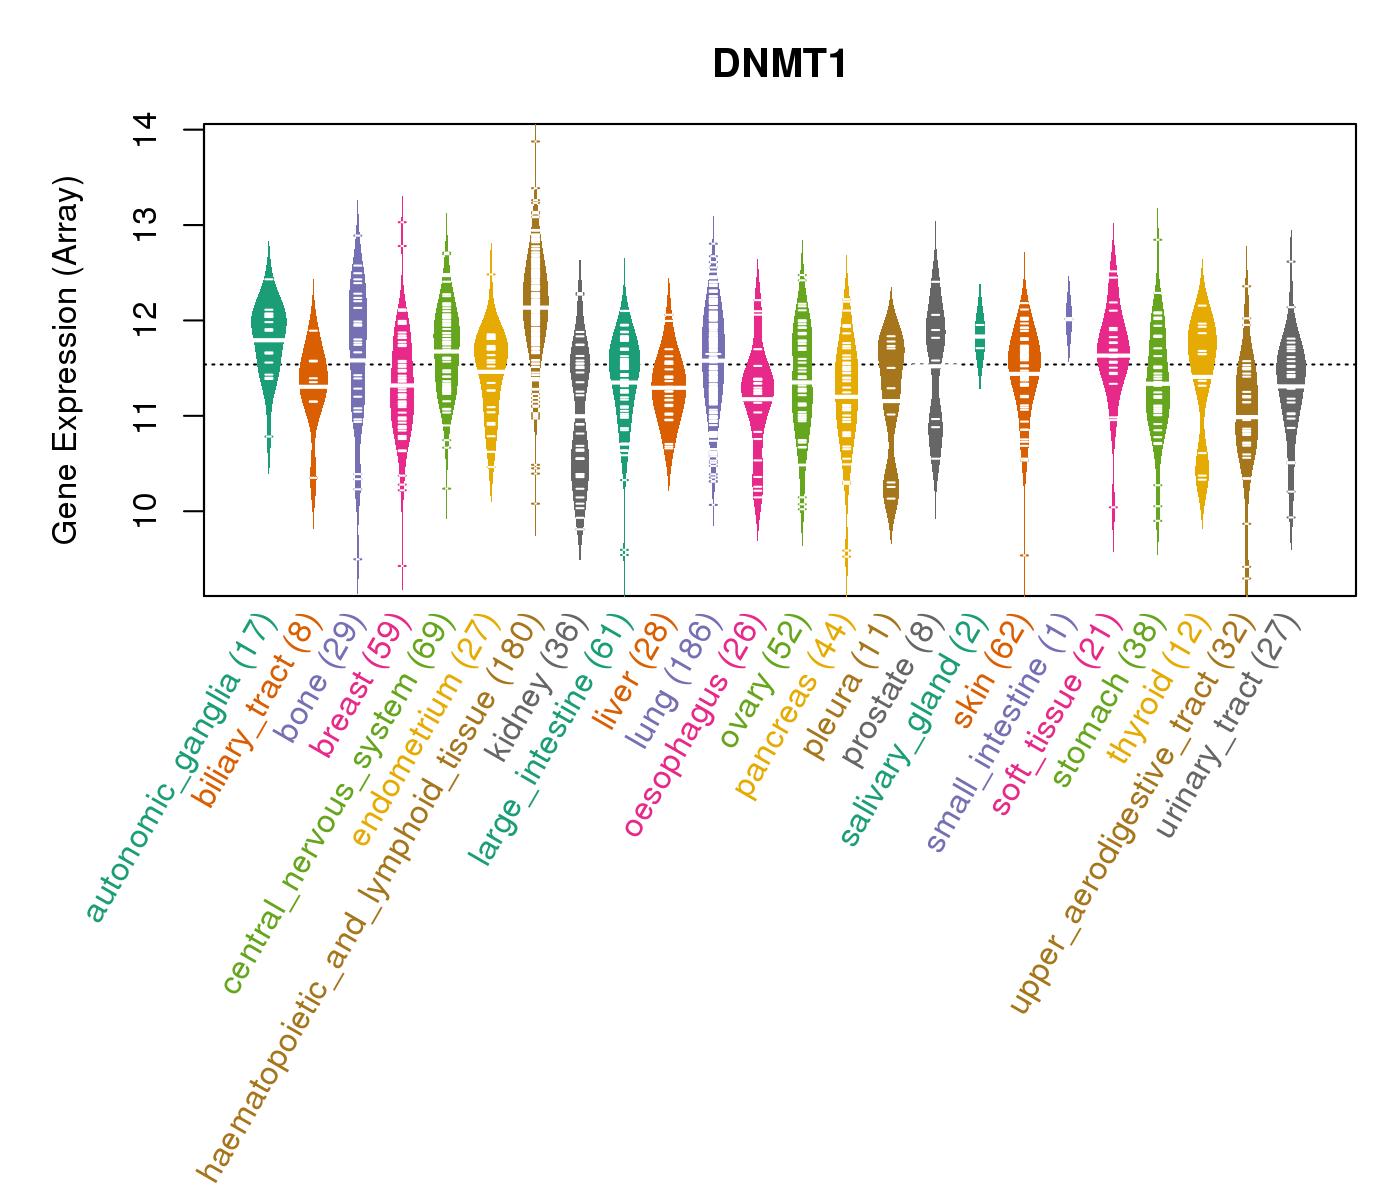
| Gene Expression for DNMT1 |
| * CCLE gene expression data were extracted from CCLE_Expression_Entrez_2012-10-18.res: Gene-centric RMA-normalized mRNA expression data. |
 |
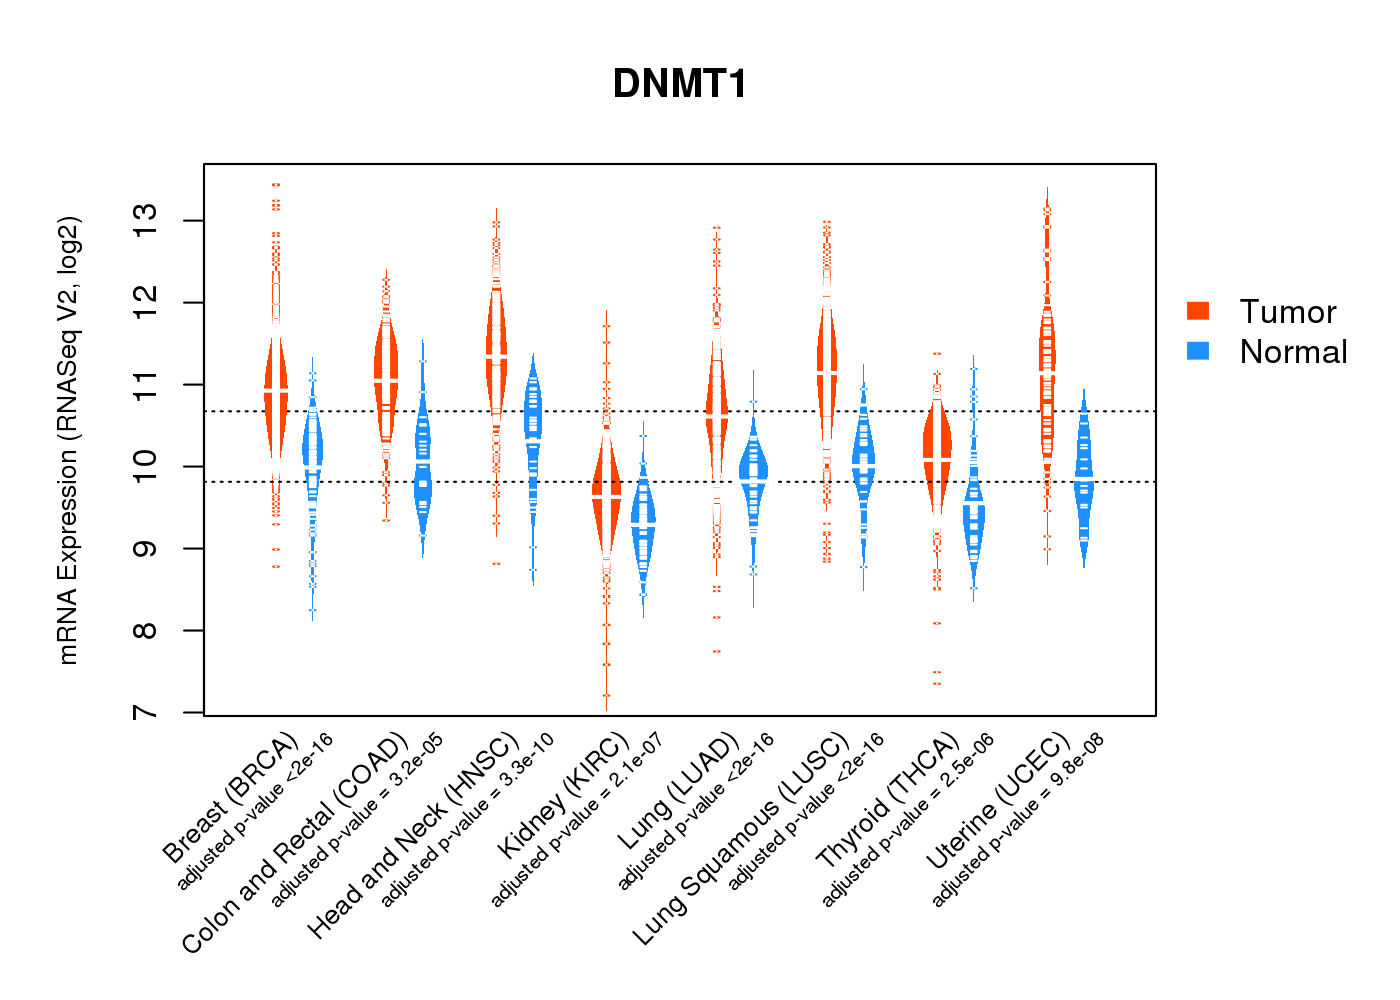
| * Normalized gene expression data of RNASeqV2 was extracted from TCGA using R package TCGA-Assembler. The URLs of all public data files on TCGA DCC data server were gathered at Jan-05-2015. Only eight cancer types have enough normal control samples for differential expression analysis. (t test, adjusted p<0.05 (using Benjamini-Hochberg FDR)) |
 |
| Top |
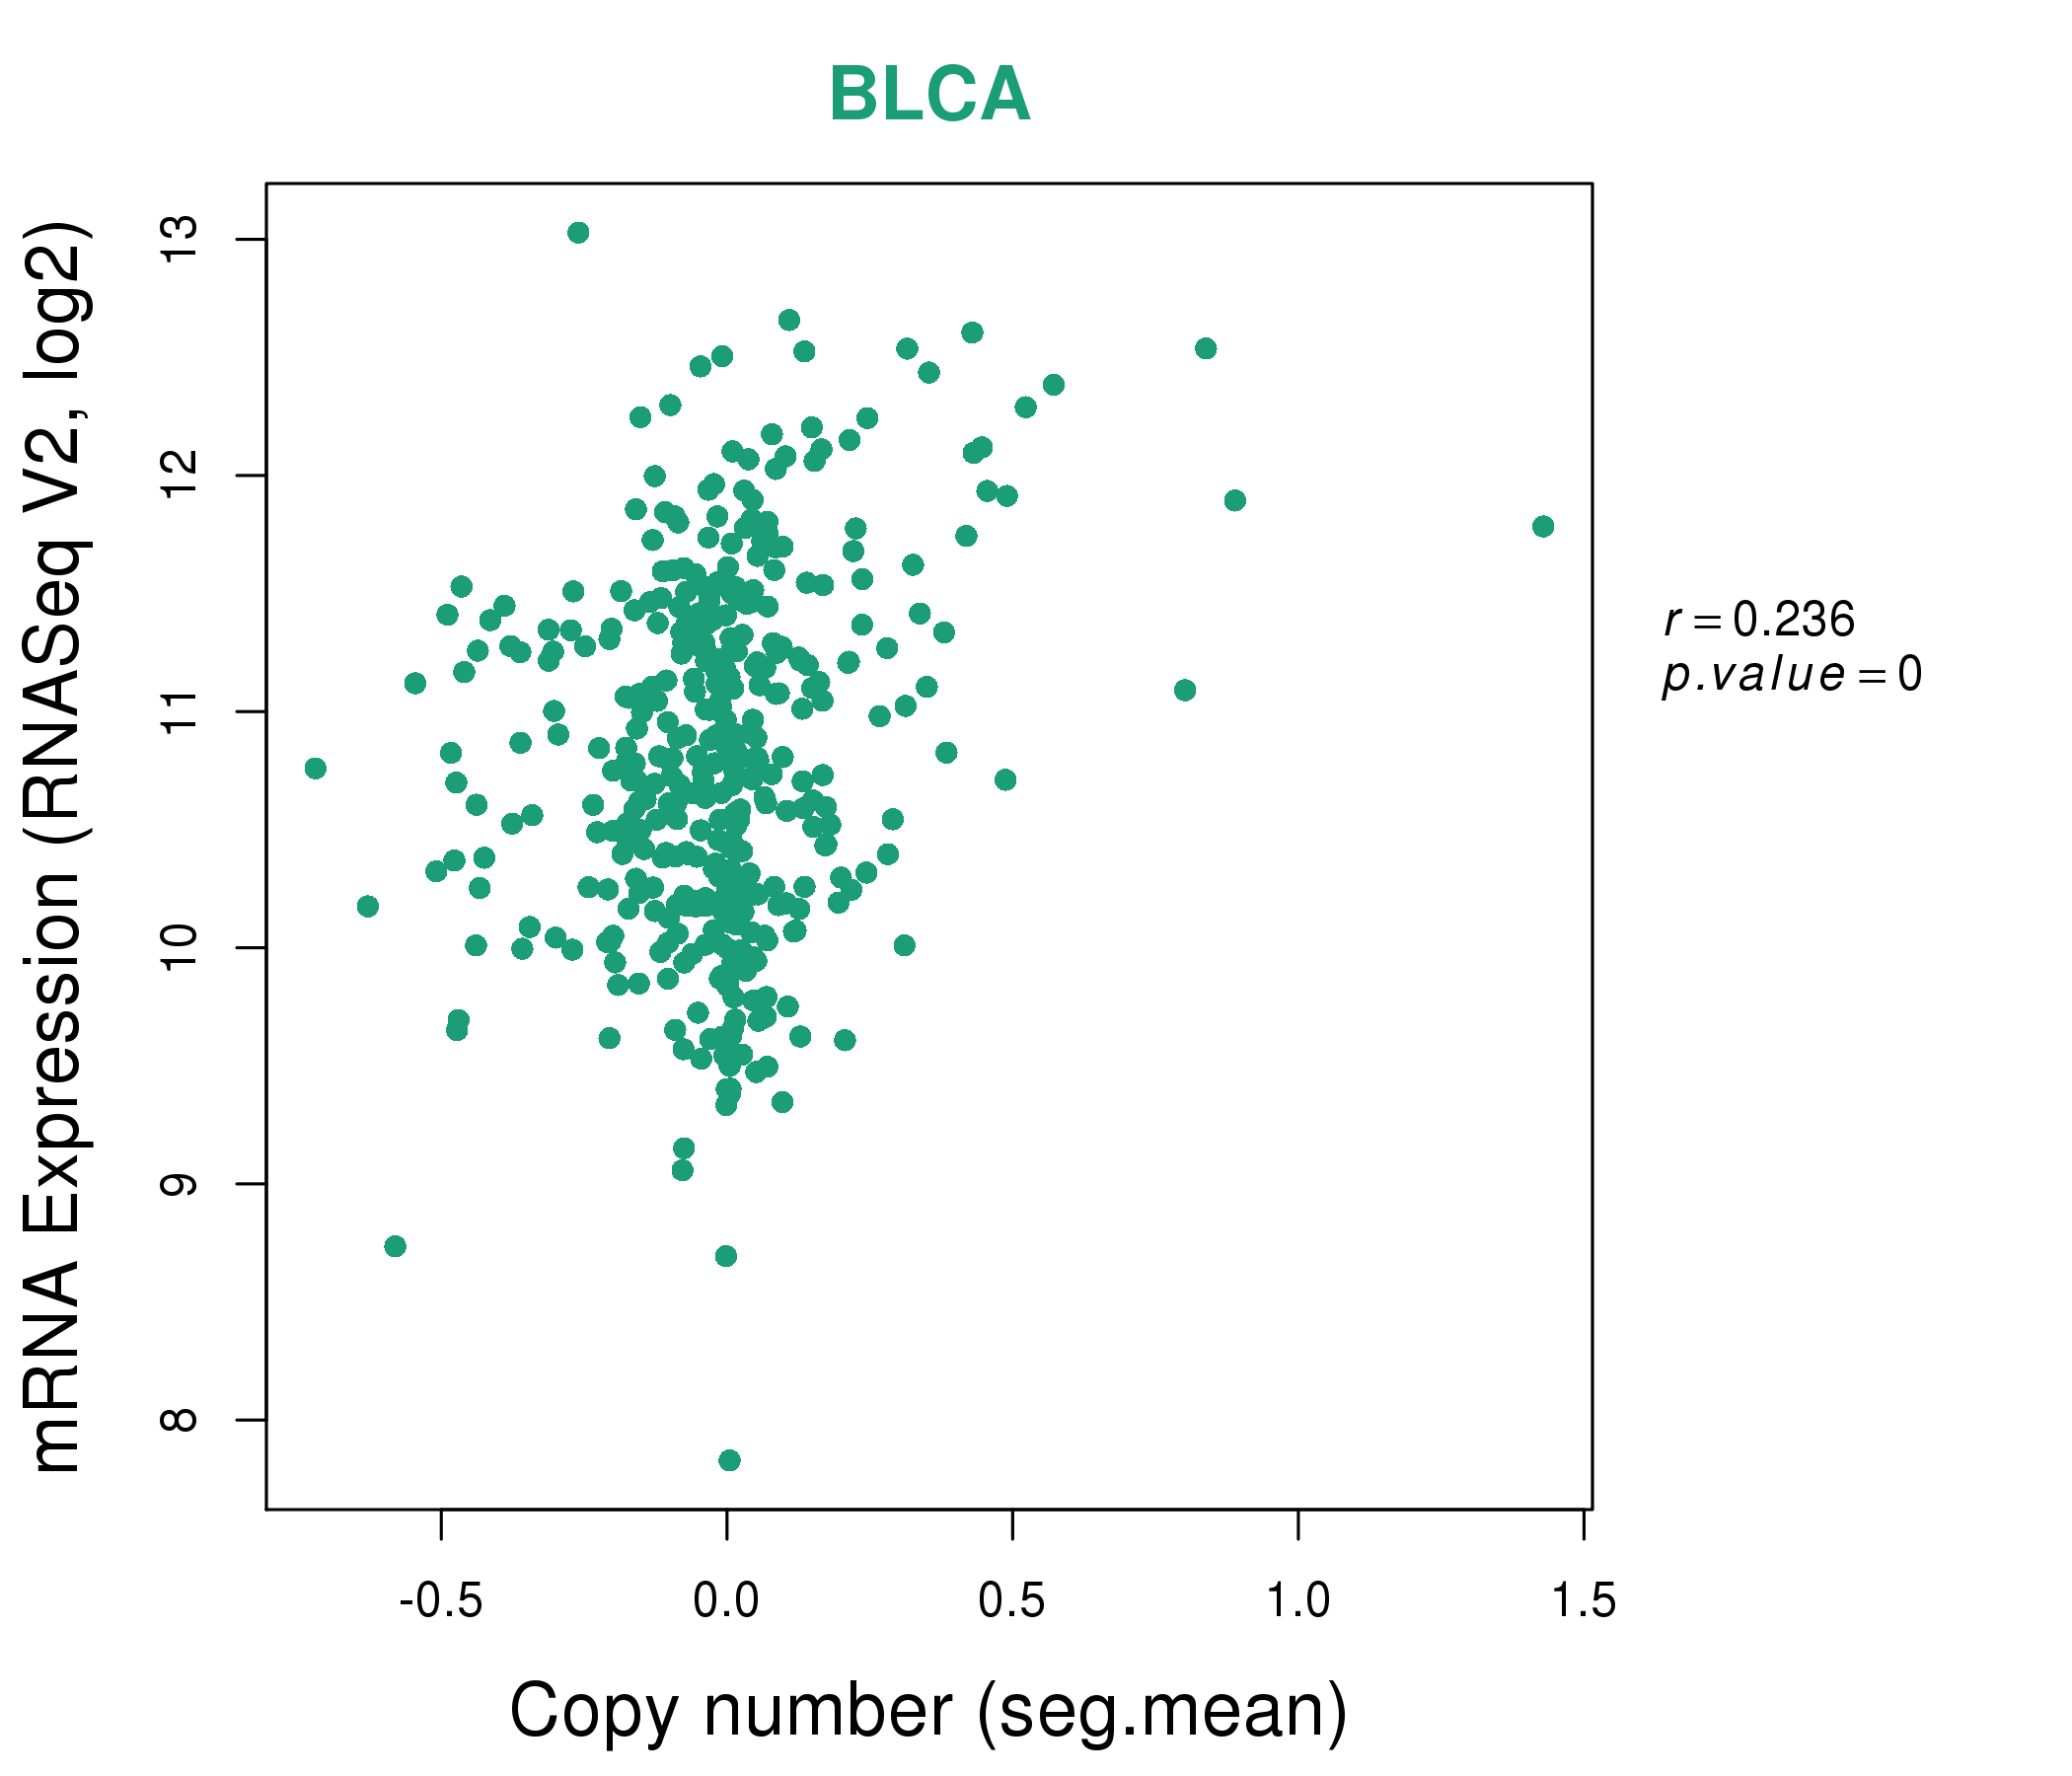
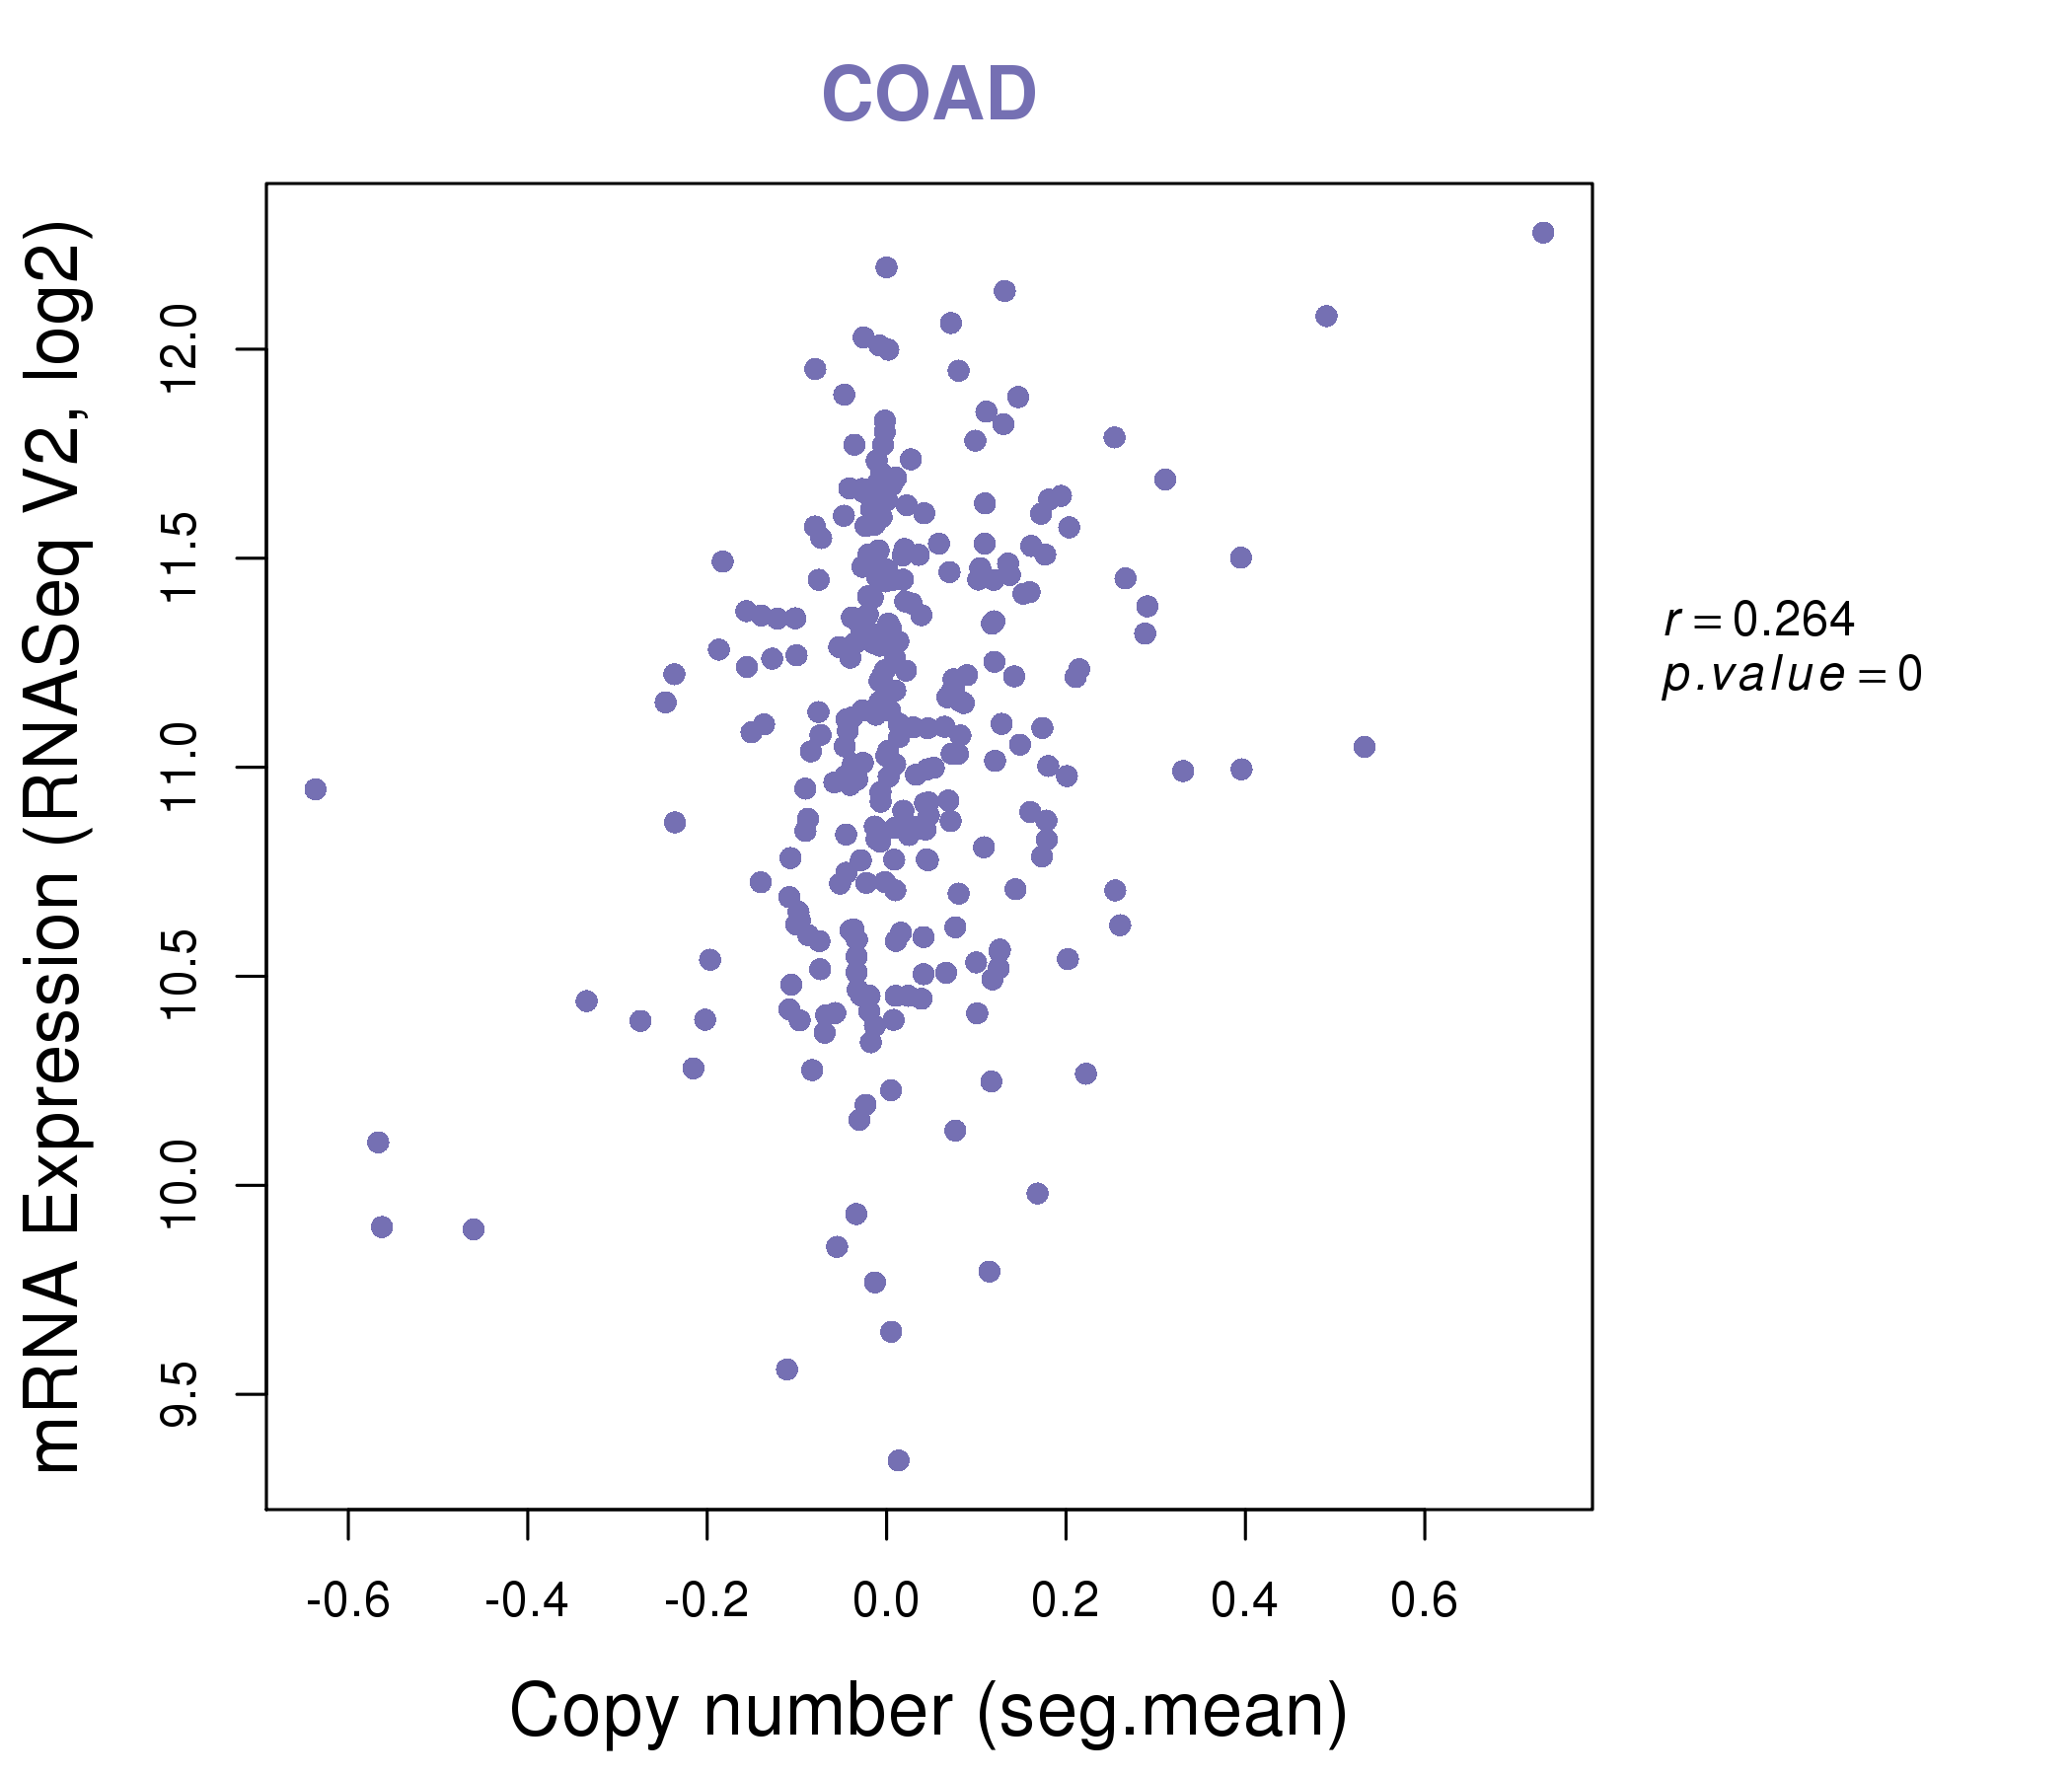
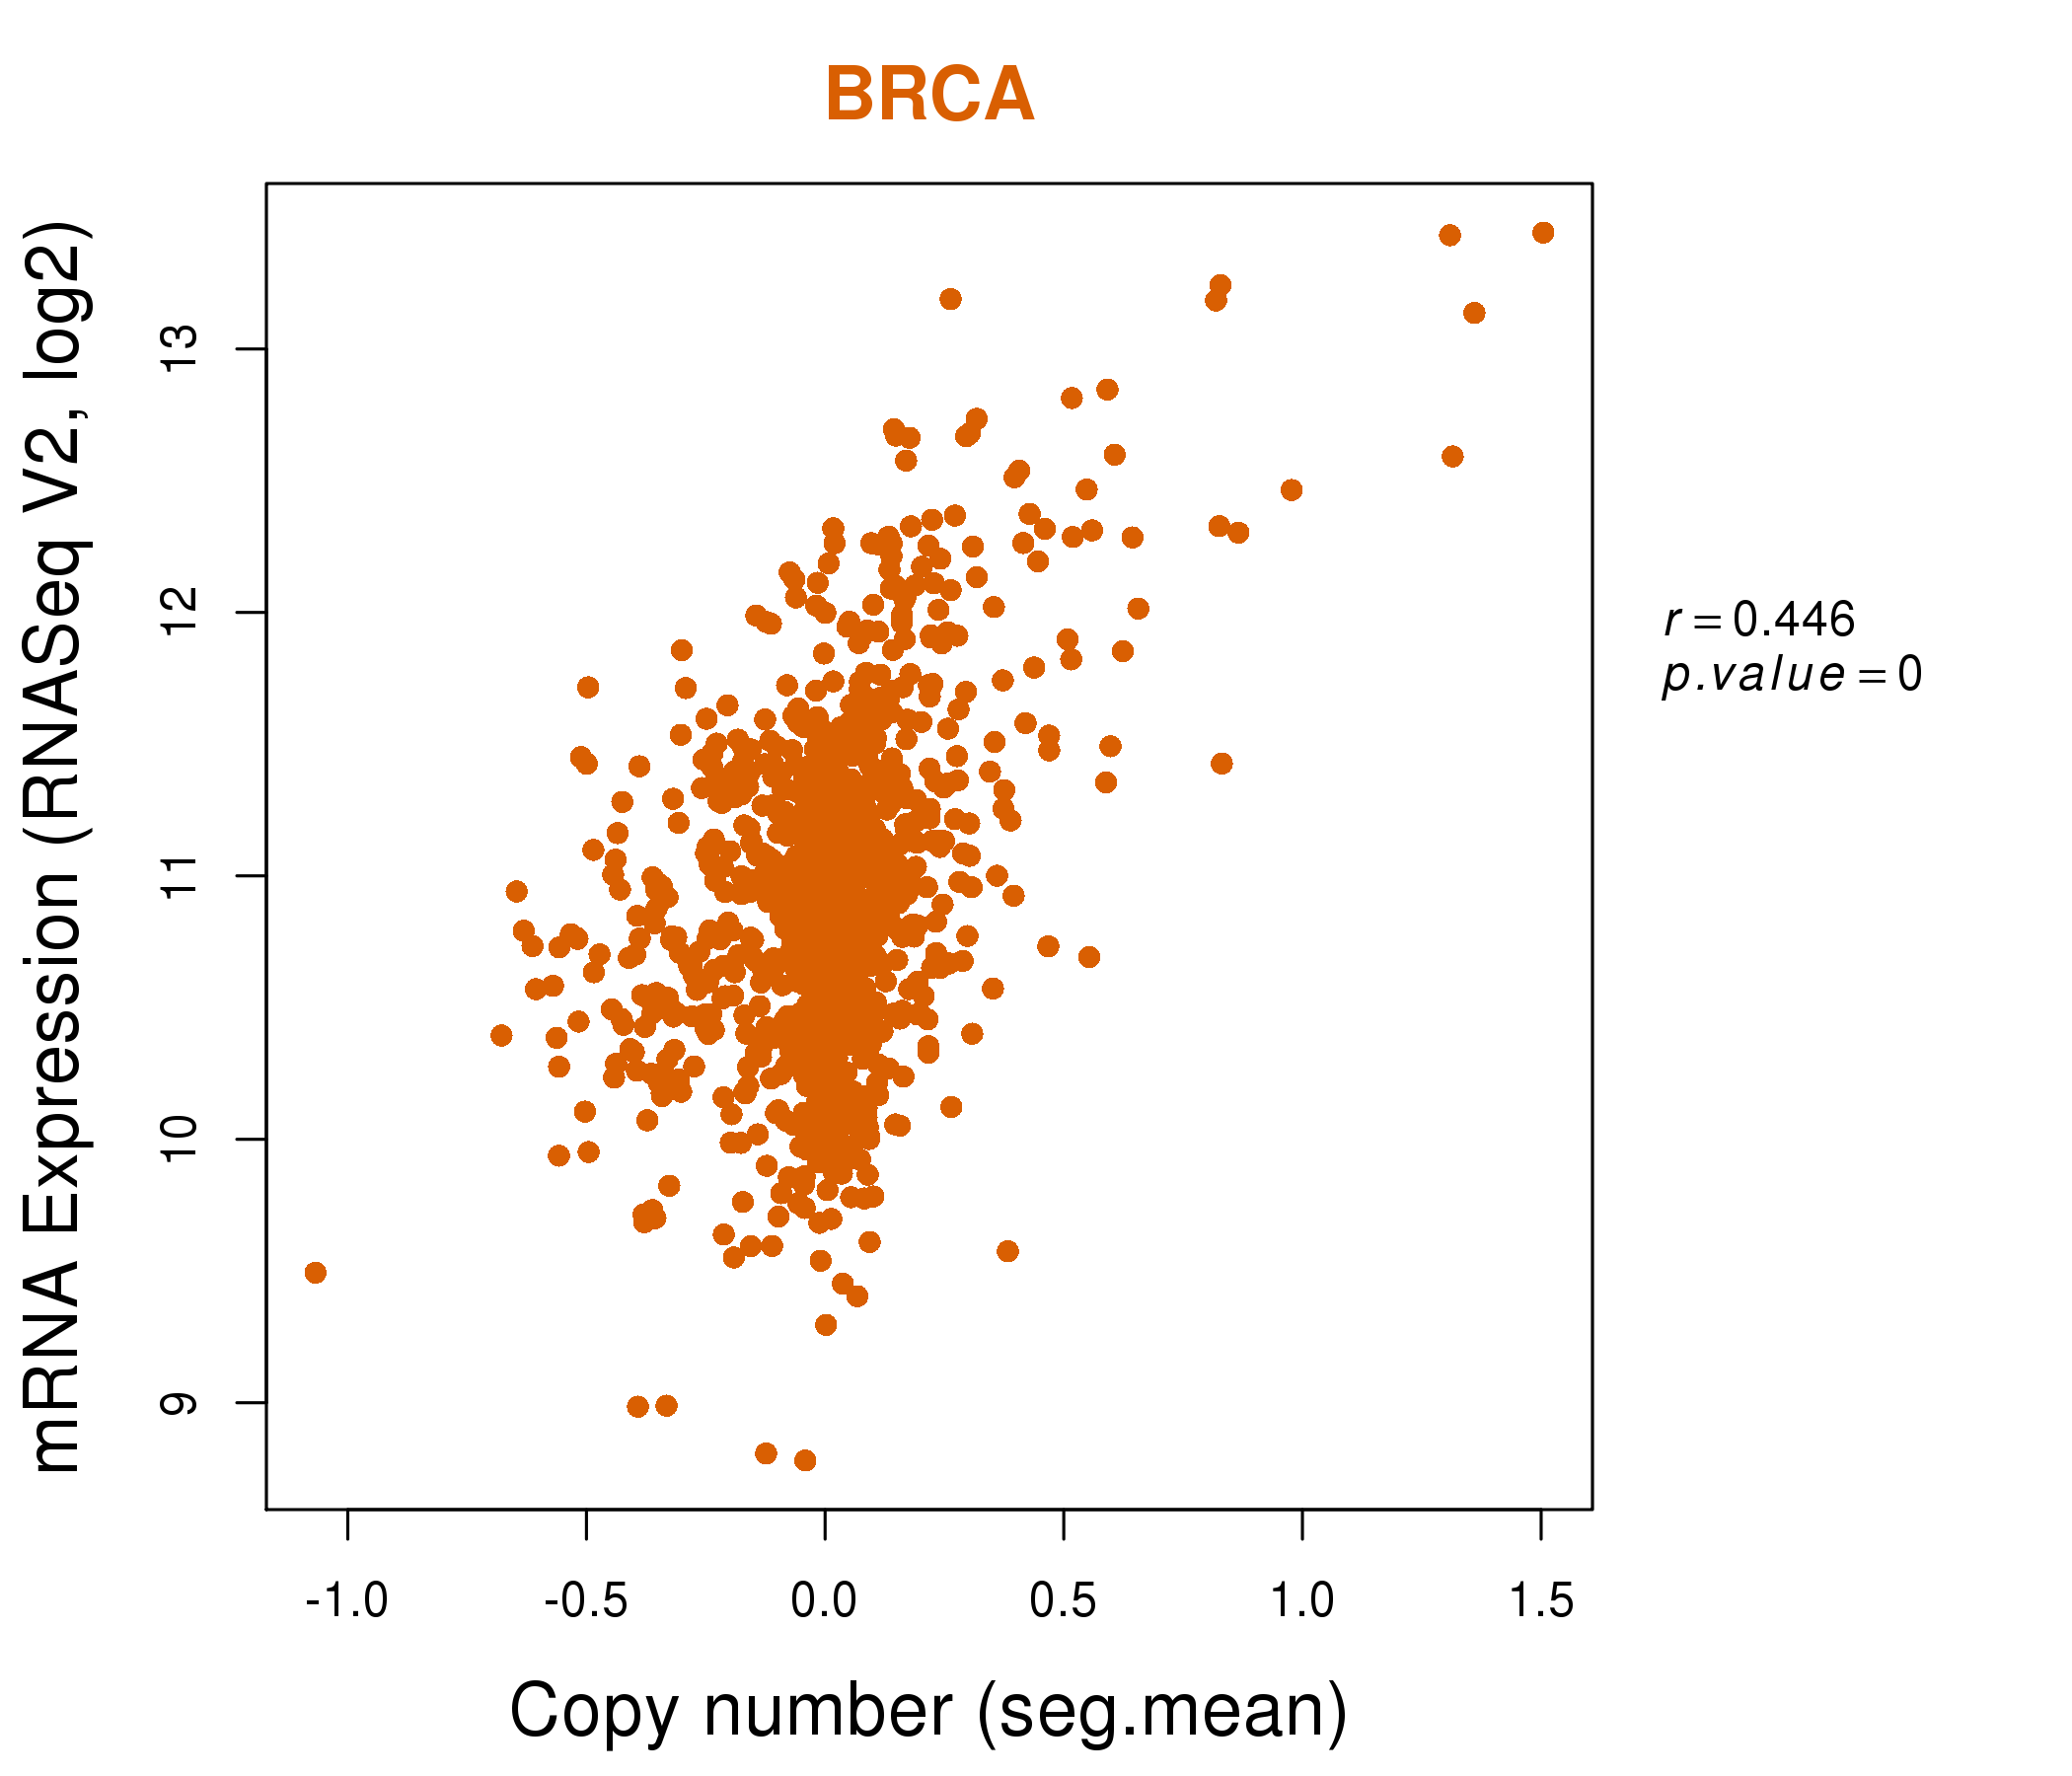
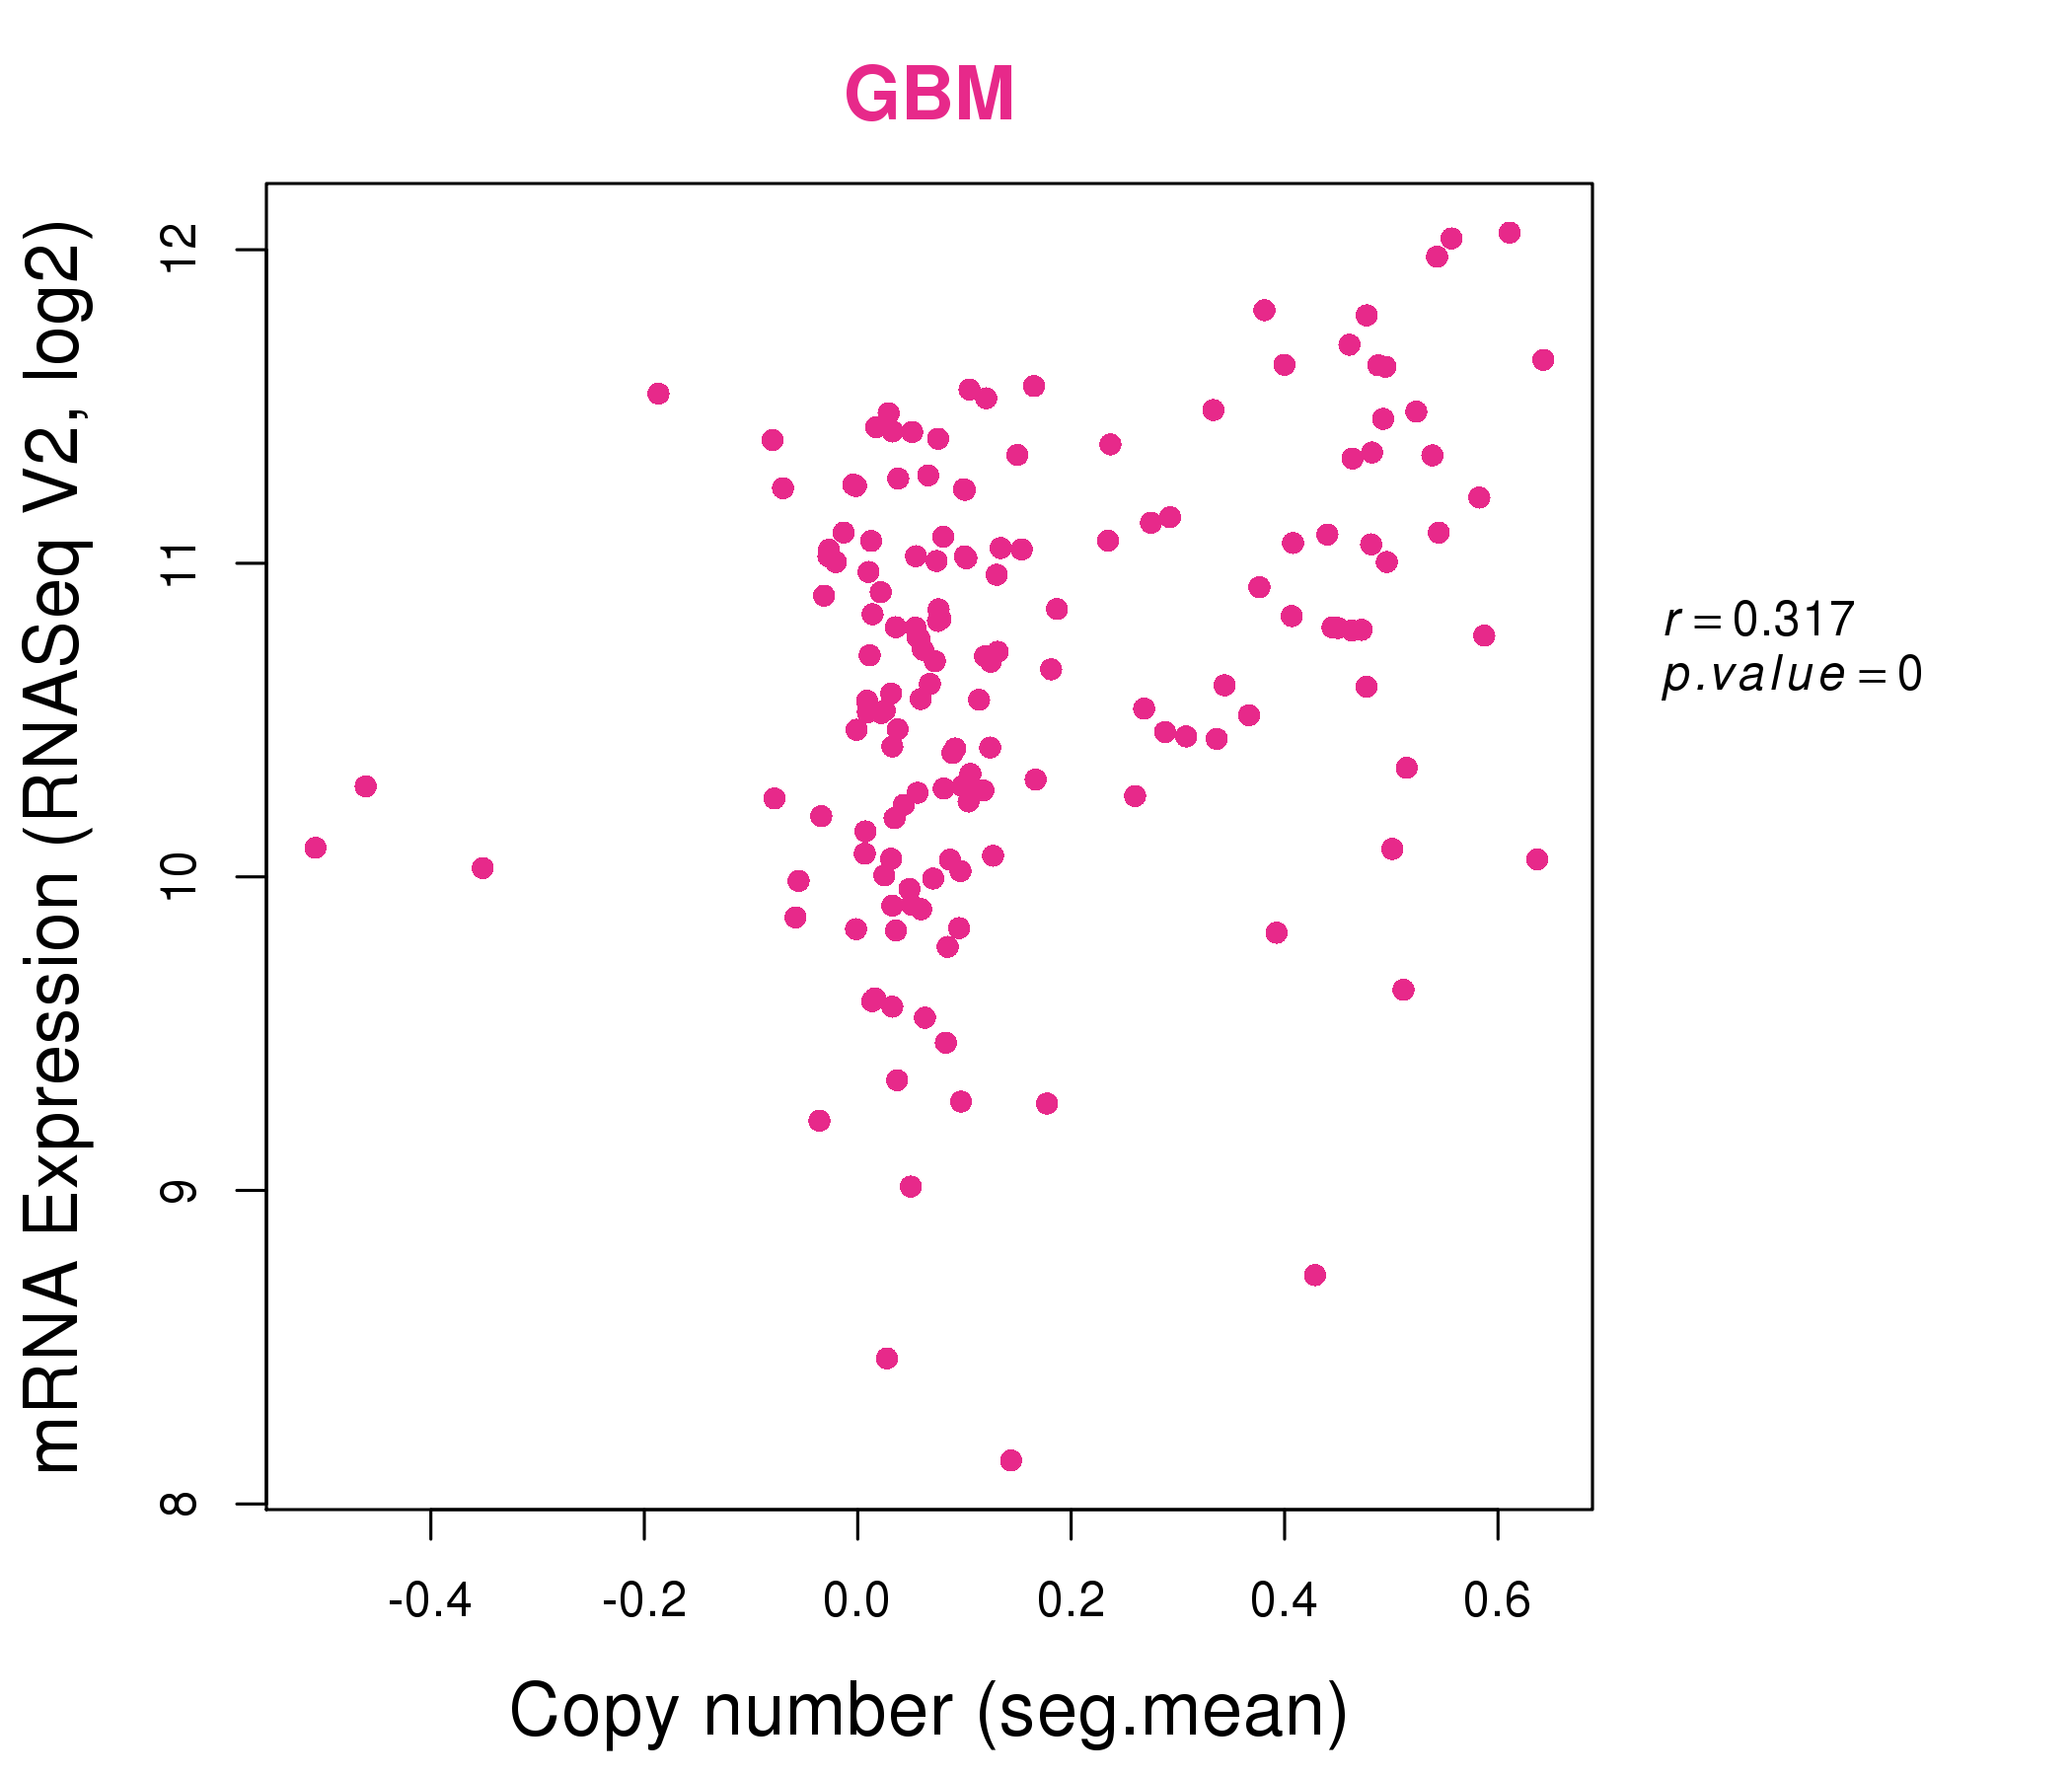
| * This plots show the correlation between CNV and gene expression. |
: Open all plots for all cancer types
 |
|
 |
|
| Top |
| Gene-Gene Network Information |
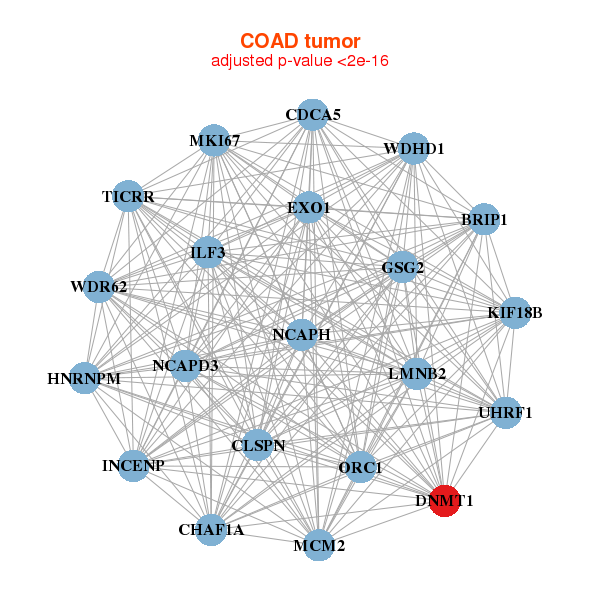
| * Co-Expression network figures were drawn using R package igraph. Only the top 20 genes with the highest correlations were shown. Red circle: input gene, orange circle: cell metabolism gene, sky circle: other gene |
: Open all plots for all cancer types
 |
| ||||
| CDCA7,CDK2,CHAF1A,CHEK1,CLSPN,DNMT1,ILF3, INCENP,KHSRP,KIF18B,KIF4A,MCM2,MCM3,MCM6, MSH2,MSH6,NCAPH,ORC1,SMARCA4,SPC24,UHRF1 | CABIN1,CAD,CHD3,CHD4,DNMT1,HYOU1,ILF3, KDM5C,MARK2,MOV10,MYO19,NBEAL2,NUP210,PCNXL3, PDCD11,PLXNB2,RAI1,SIPA1L3,SMARCA4,TCF3,VAV2 | ||||
 |
| ||||
| BRIP1,TICRR,CDCA5,CHAF1A,CLSPN,DNMT1,EXO1, GSG2,HNRNPM,ILF3,INCENP,KIF18B,LMNB2,MCM2, MKI67,NCAPD3,NCAPH,ORC1,UHRF1,WDHD1,WDR62 | ATAD2,BLM,BRCA1,CLSPN,DNMT1,FANCA,LMNB2, MCM2,MCM3,MCM5,NCAPD3,NCAPG2,NUP188,ODF2, PFAS,RBM14,TACC3,TIMELESS,UHRF1,WDHD1,WDR62 |


| * Co-Expression network figures were drawn using R package igraph. Only the top 20 genes with the highest correlations were shown. Red circle: input gene, orange circle: cell metabolism gene, sky circle: other gene |
: Open all plots for all cancer types
| Top |
: Open all interacting genes' information including KEGG pathway for all interacting genes from DAVID
| Top |
| Pharmacological Information for DNMT1 |
| DB Category | DB Name | DB's ID and Url link |
| Chemistry | BindingDB | P26358; -. |
| Chemistry | ChEMBL | CHEMBL1993; -. |
| Organism-specific databases | PharmGKB | PA27443; -. |
| Organism-specific databases | CTD | 1786; -. |
| * Gene Centered Interaction Network. |
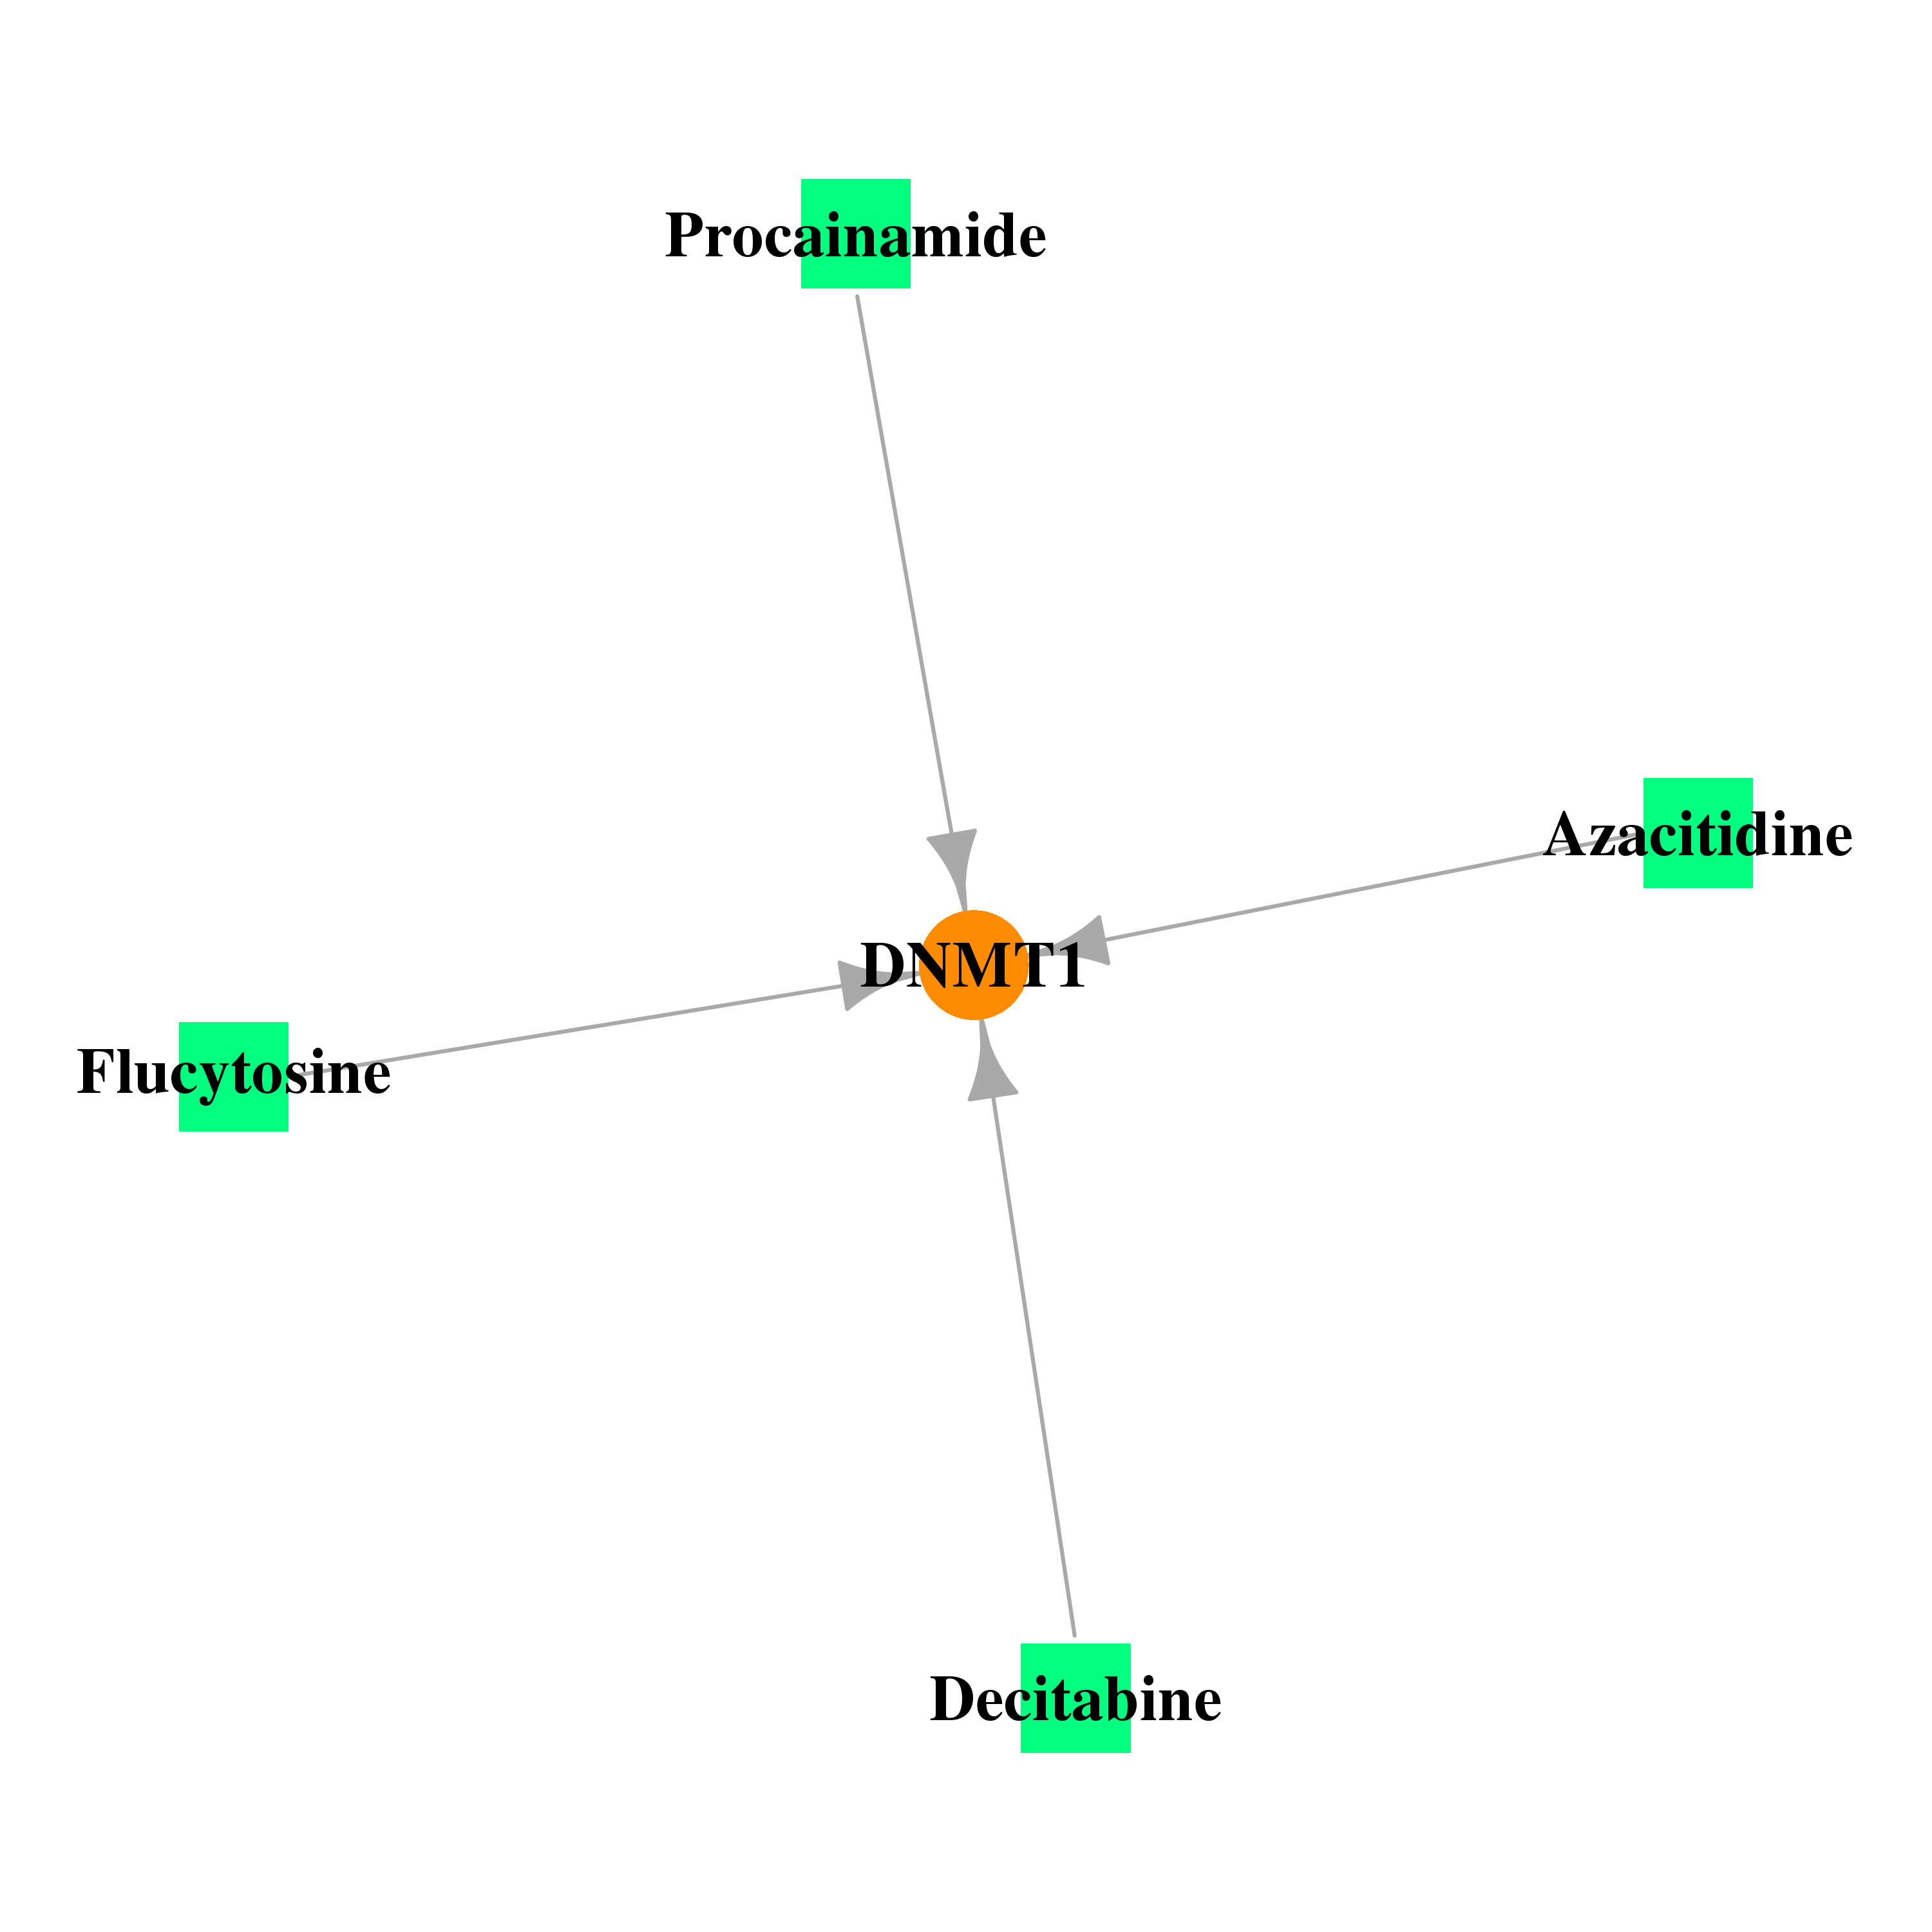 |
| * Drug Centered Interaction Network. |
| DrugBank ID | Target Name | Drug Groups | Generic Name | Drug Centered Network | Drug Structure |
| DB00928 | DNA (cytosine-5-)-methyltransferase 1 | approved; investigational | Azacitidine |  | 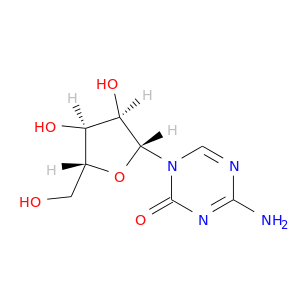 |
| DB01035 | DNA (cytosine-5-)-methyltransferase 1 | approved | Procainamide | 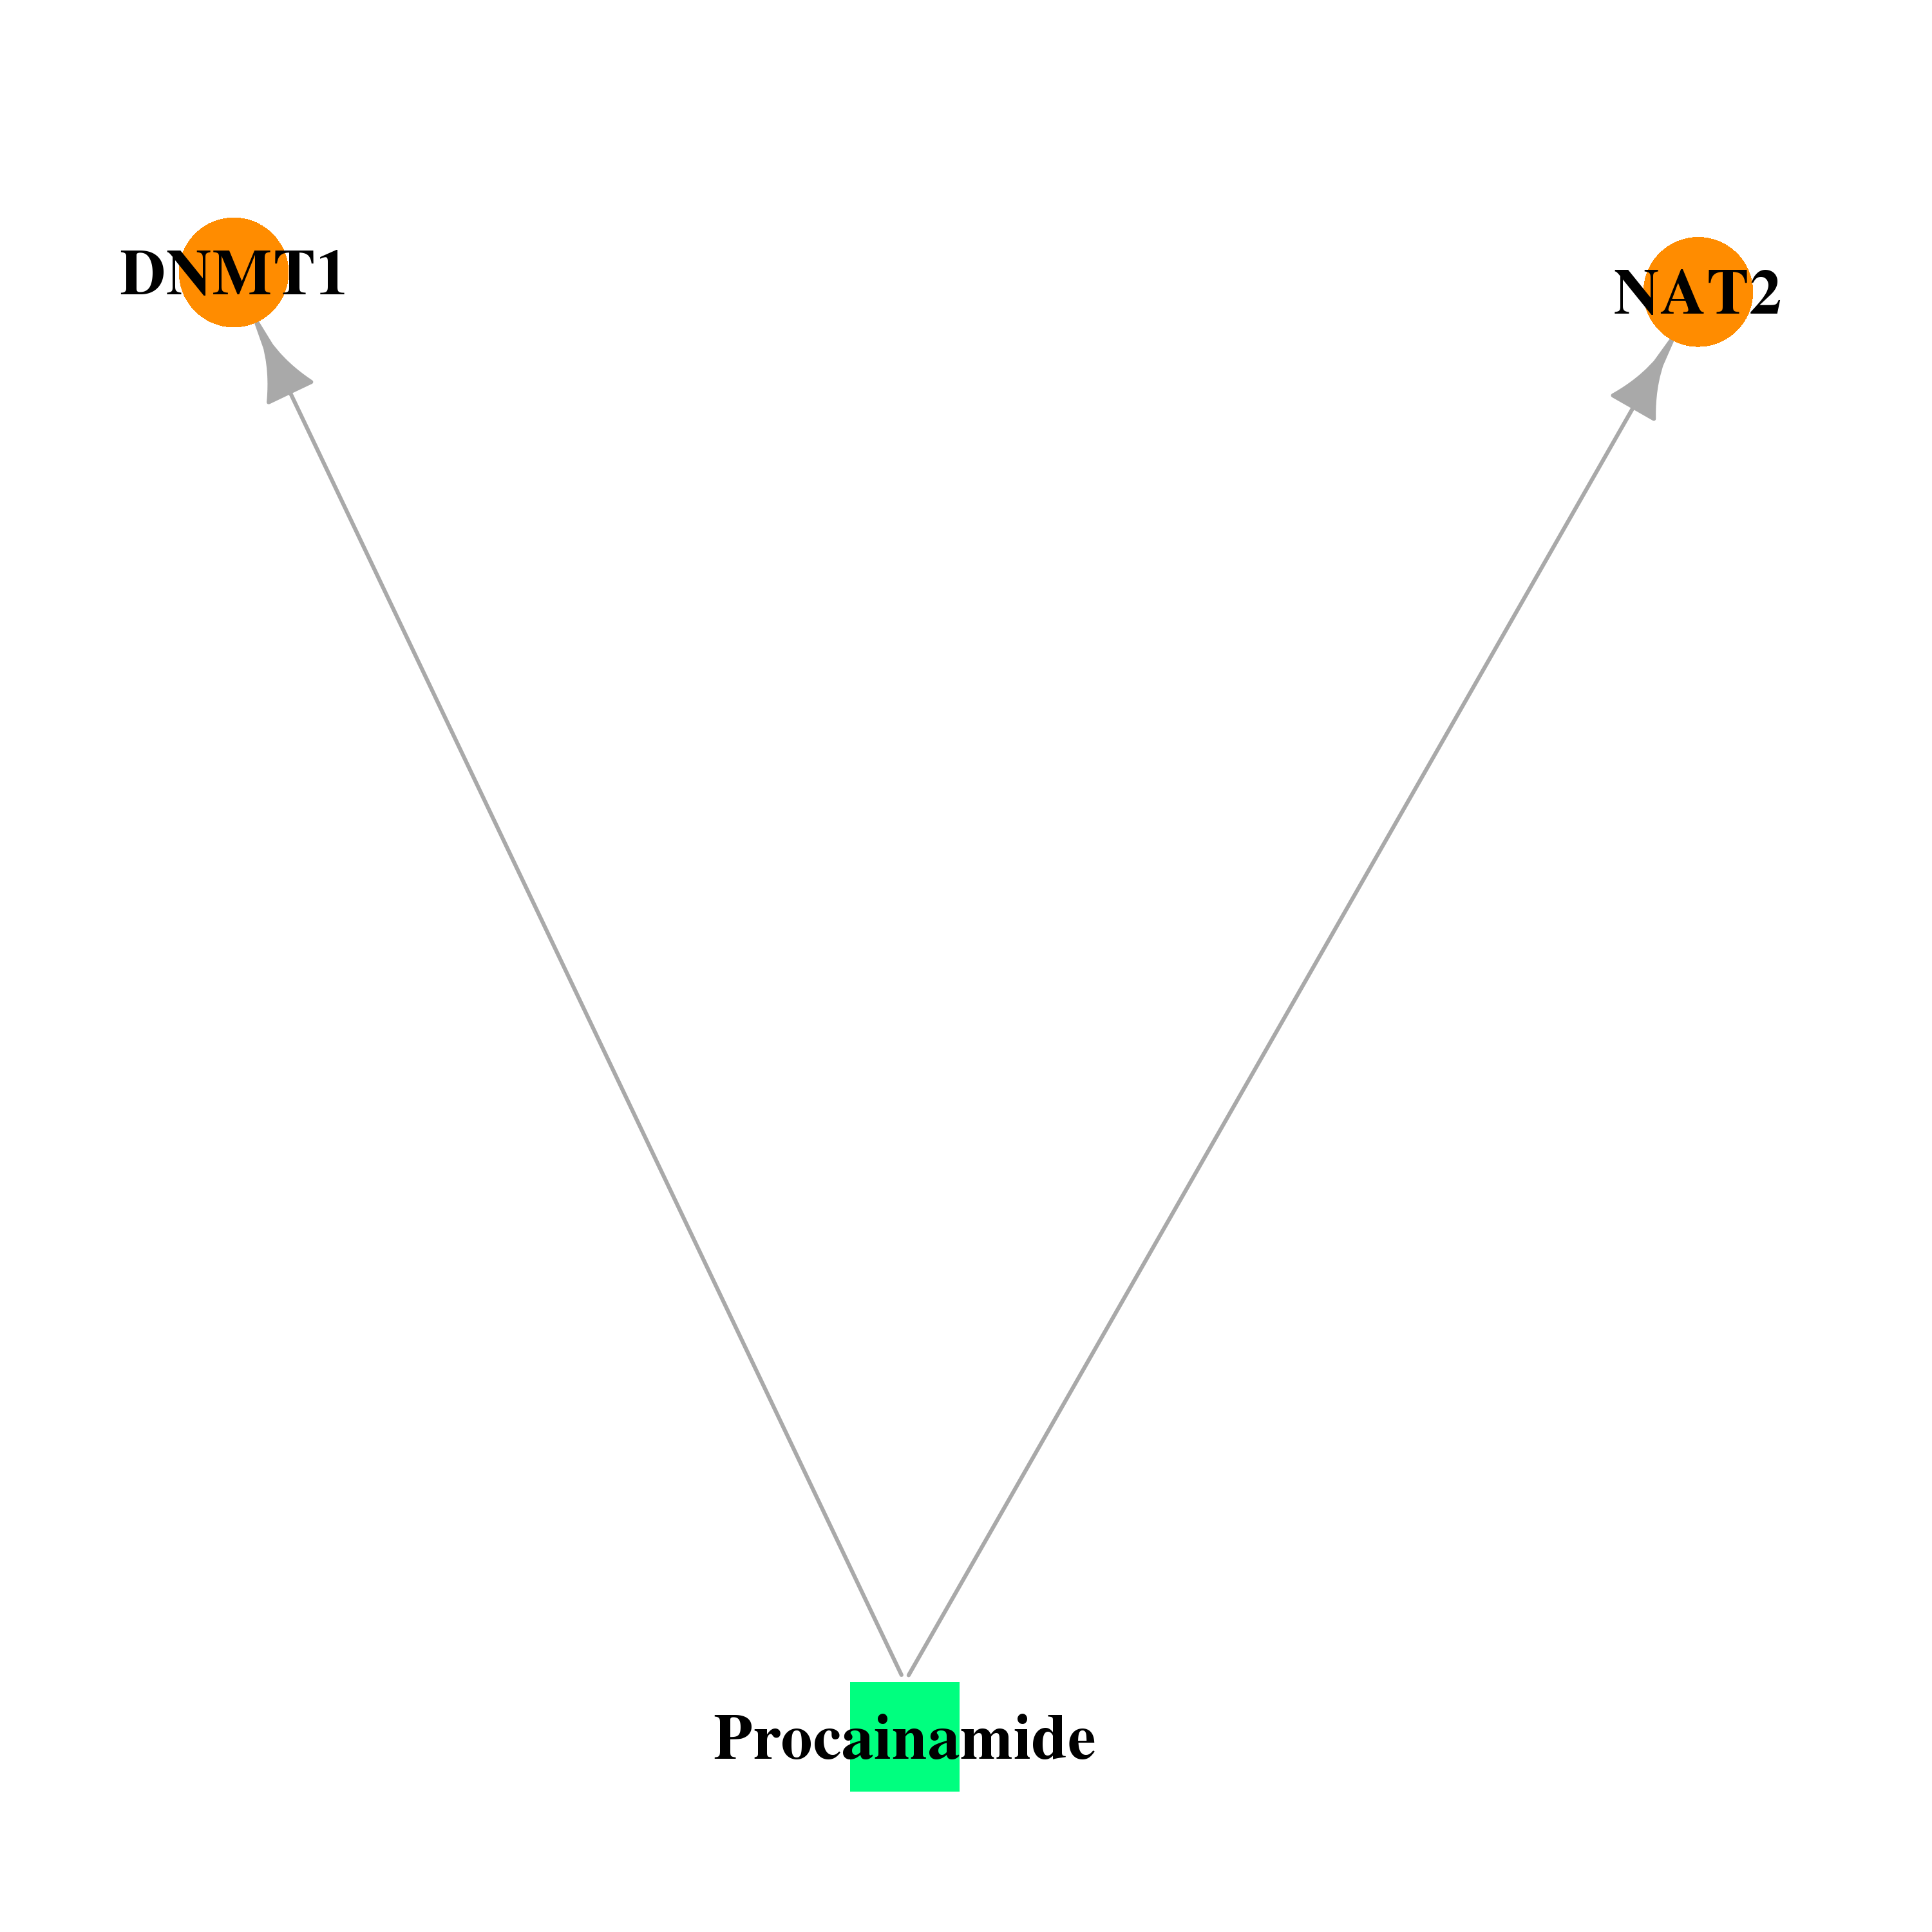 |  |
| DB01099 | DNA (cytosine-5-)-methyltransferase 1 | approved | Flucytosine |  |  |
| DB01262 | DNA (cytosine-5-)-methyltransferase 1 | approved; investigational | Decitabine | 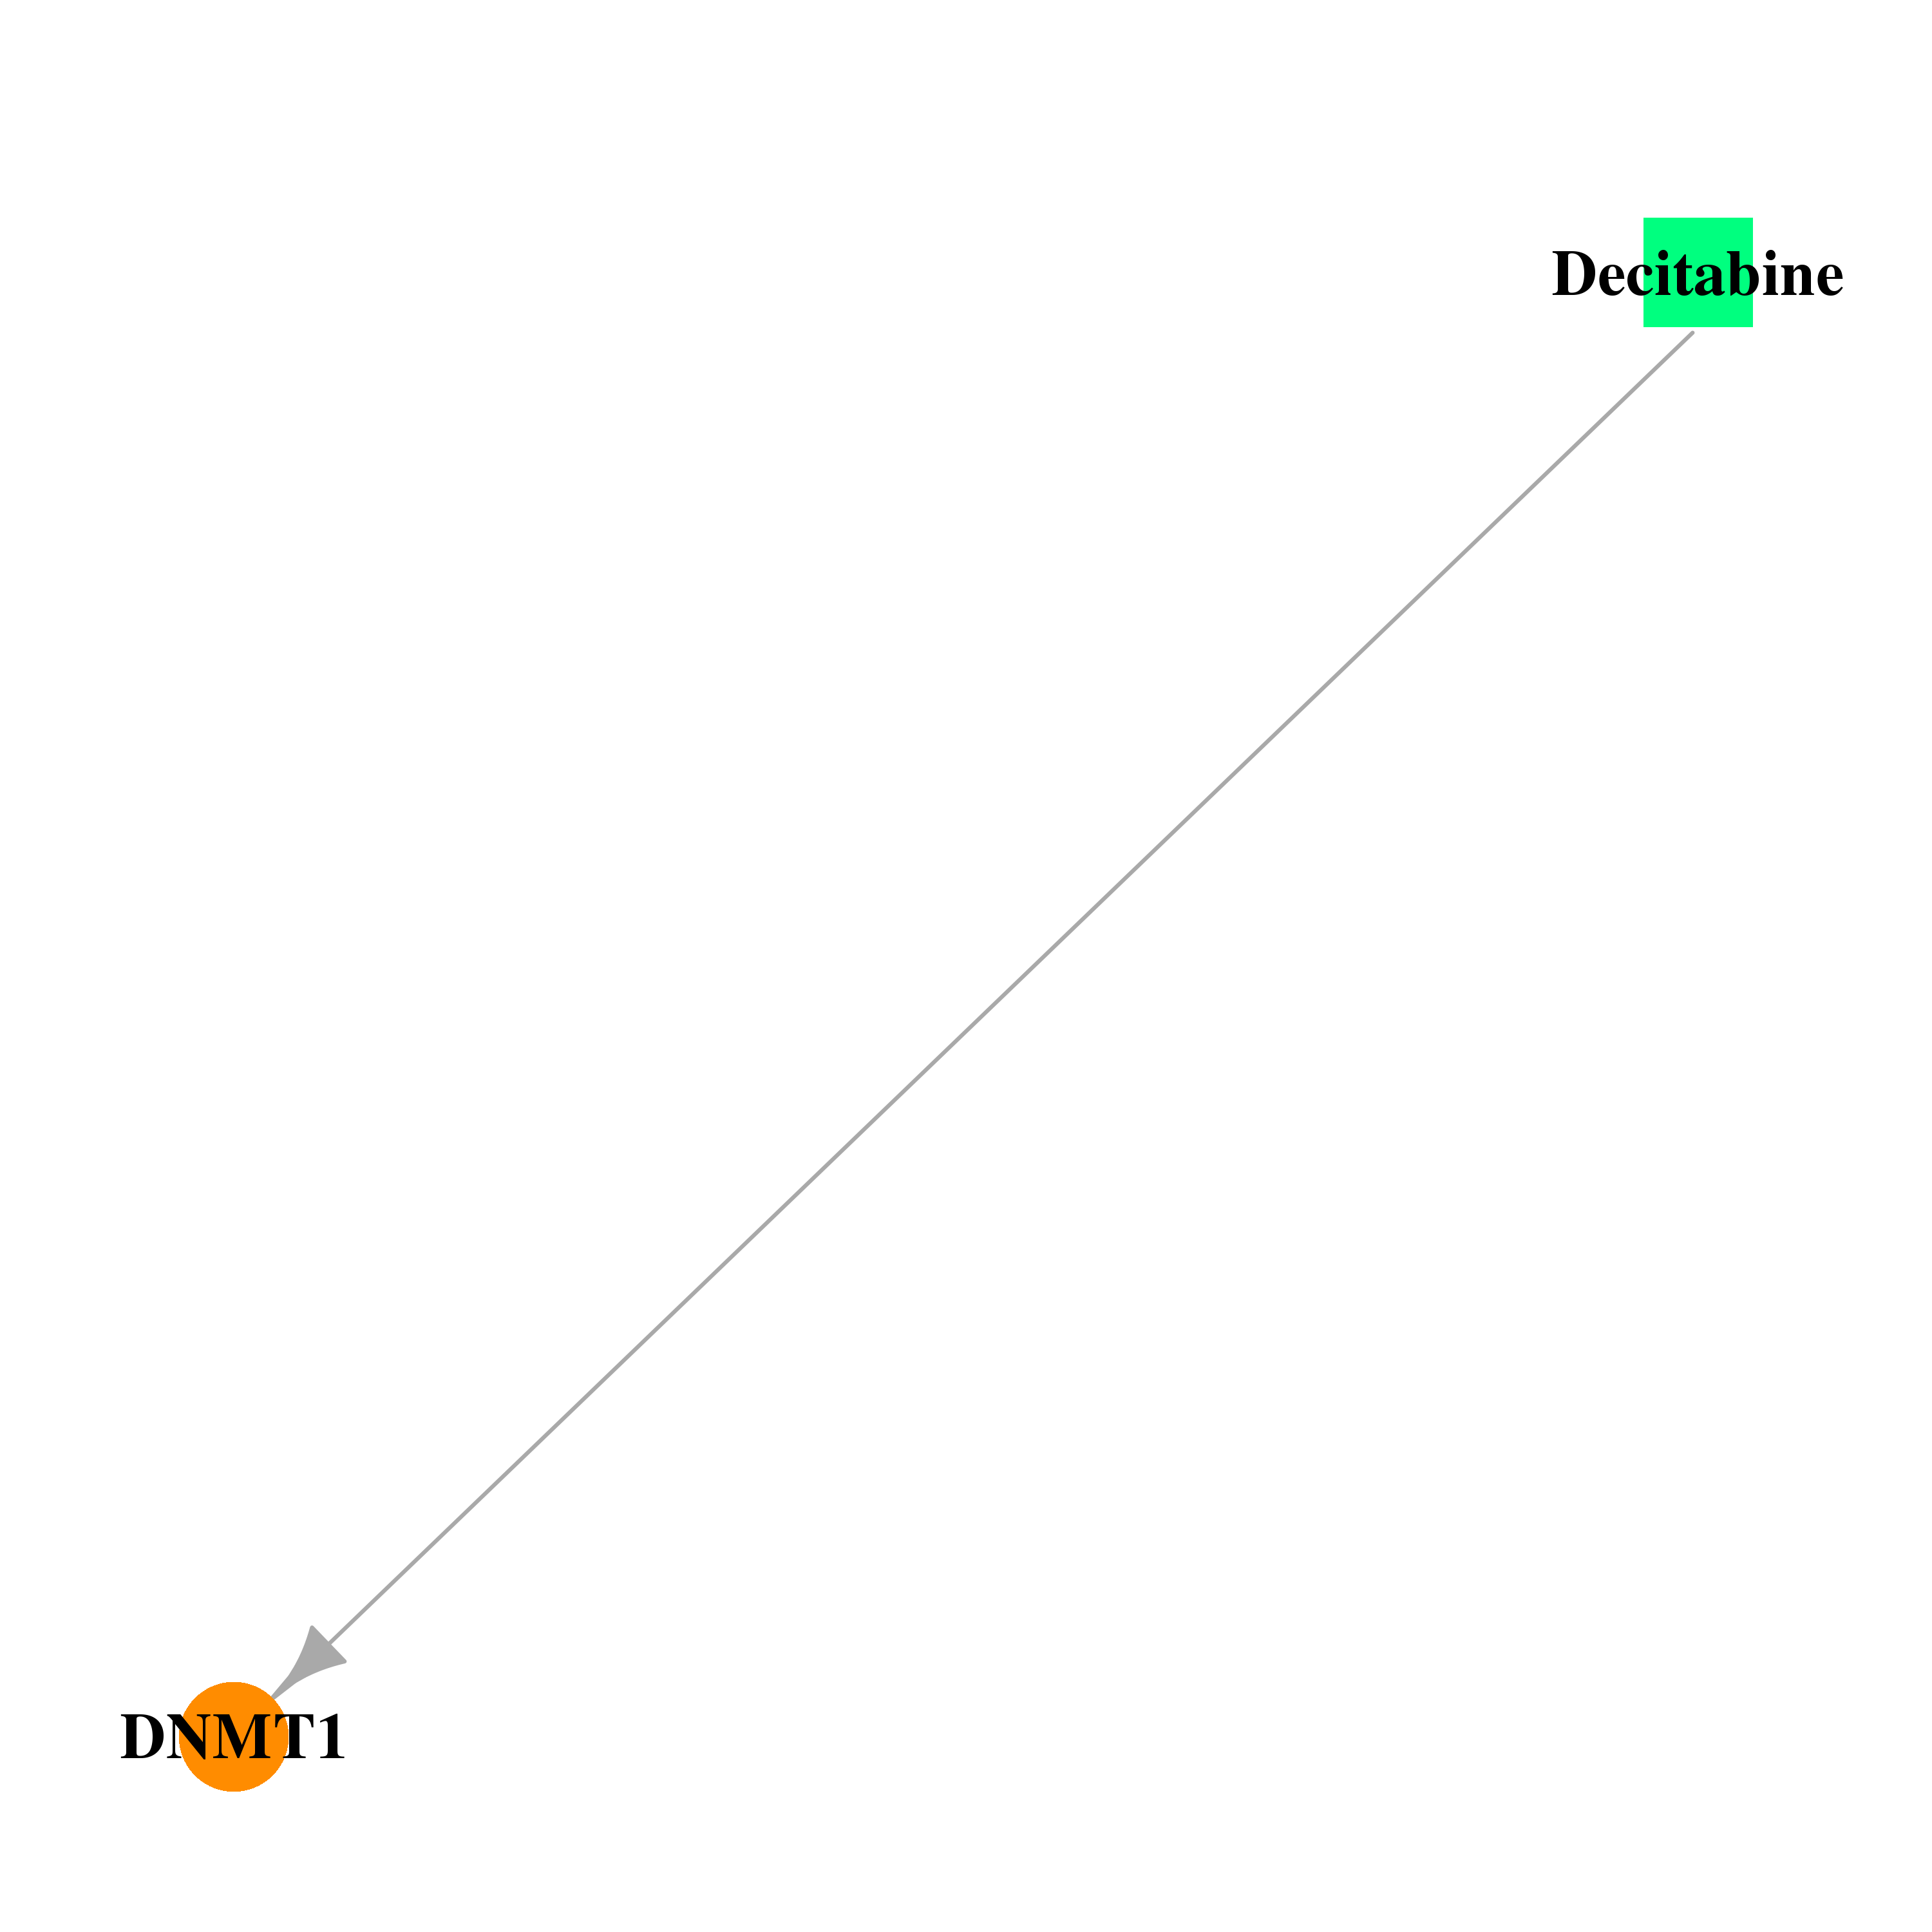 |  |
| Top |
| Cross referenced IDs for DNMT1 |
| * We obtained these cross-references from Uniprot database. It covers 150 different DBs, 18 categories. http://www.uniprot.org/help/cross_references_section |
: Open all cross reference information
|
Copyright © 2016-Present - The Univsersity of Texas Health Science Center at Houston @ |