|
||||||||||||||||||||
| |
| Phenotypic Information (metabolism pathway, cancer, disease, phenome) |
| |
| |
| Gene-Gene Network Information: Co-Expression Network, Interacting Genes & KEGG |
| |
|


| Gene Summary for DPAGT1 |
| Basic gene info. | Gene symbol | DPAGT1 |
| Gene name | dolichyl-phosphate (UDP-N-acetylglucosamine) N-acetylglucosaminephosphotransferase 1 (GlcNAc-1-P transferase) | |
| Synonyms | ALG7|CDG-Ij|CDG1J|CMSTA2|D11S366|DGPT|DPAGT|DPAGT2|G1PT|GPT|UAGT|UGAT | |
| Cytomap | UCSC genome browser: 11q23.3 | |
| Genomic location | chr11 :118967212-118972785 | |
| Type of gene | protein-coding | |
| RefGenes | NM_001382.3, NM_203316.1, | |
| Ensembl id | ENSG00000172269 | |
| Description | GlcNAc-1-P transferaseN-acetylglucosamine-1-phosphate transferaseUDP-GlcNAc:dolichyl-phosphate N-acetylglucosaminephosphotransferaseUDP-N-acetylglucosamine--dolichyl-phosphate N-acetylglucosaminephosphotransferasedolichyl-phosphate (UDP-N-acetylglucos | |
| Modification date | 20141219 | |
| dbXrefs | MIM : 191350 | |
| HGNC : HGNC | ||
| Ensembl : ENSG00000172269 | ||
| HPRD : 01879 | ||
| Vega : OTTHUMG00000153533 | ||
| Protein | UniProt: Q9H3H5 go to UniProt's Cross Reference DB Table | |
| Expression | CleanEX: HS_DPAGT1 | |
| BioGPS: 1798 | ||
| Gene Expression Atlas: ENSG00000172269 | ||
| The Human Protein Atlas: ENSG00000172269 | ||
| Pathway | NCI Pathway Interaction Database: DPAGT1 | |
| KEGG: DPAGT1 | ||
| REACTOME: DPAGT1 | ||
| ConsensusPathDB | ||
| Pathway Commons: DPAGT1 | ||
| Metabolism | MetaCyc: DPAGT1 | |
| HUMANCyc: DPAGT1 | ||
| Regulation | Ensembl's Regulation: ENSG00000172269 | |
| miRBase: chr11 :118,967,212-118,972,785 | ||
| TargetScan: NM_001382 | ||
| cisRED: ENSG00000172269 | ||
| Context | iHOP: DPAGT1 | |
| cancer metabolism search in PubMed: DPAGT1 | ||
| UCL Cancer Institute: DPAGT1 | ||
| Assigned class in ccmGDB | A - This gene has a literature evidence and it belongs to cancer gene. | |
| References showing role of DPAGT1 in cancer cell metabolism | 1. Hou H, Sun H, Lu P, Ge C, Zhang L, et al. (2013) Tunicamycin potentiates cisplatin anticancer efficacy through the DPAGT1/Akt/ABCG2 pathway in mouse Xenograft models of human hepatocellular carcinoma. Mol Cancer Ther 12: 2874-2884. doi: 10.1158/1535-7163.MCT-13-0201. go to article 2. Sengupta PK, Bouchie MP, Kukuruzinska MA (2010) N-glycosylation gene DPAGT1 is a target of the Wnt/beta-catenin signaling pathway. J Biol Chem 285: 31164-31173. doi: 10.1074/jbc.M110.149195. pmid: 2951190. go to article 3. Jamal B, Sengupta PK, Gao ZN, Nita-Lazar M, Amin B, et al. (2012) Aberrant amplification of the crosstalk between canonical Wnt signaling and N-glycosylation gene DPAGT1 promotes oral cancer. Oral Oncol 48: 523-529. doi: 10.1016/j.oraloncology.2012.01.010. pmid: 3362683. go to article | |
| Top |
| Phenotypic Information for DPAGT1(metabolism pathway, cancer, disease, phenome) |
| Cancer | CGAP: DPAGT1 |
| Familial Cancer Database: DPAGT1 | |
| * This gene is included in those cancer gene databases. |
|
|
|
|
|
| . | ||||||||||||||
Oncogene 1 | Significant driver gene in | |||||||||||||||||||
| cf) number; DB name 1 Oncogene; http://nar.oxfordjournals.org/content/35/suppl_1/D721.long, 2 Tumor Suppressor gene; https://bioinfo.uth.edu/TSGene/, 3 Cancer Gene Census; http://www.nature.com/nrc/journal/v4/n3/abs/nrc1299.html, 4 CancerGenes; http://nar.oxfordjournals.org/content/35/suppl_1/D721.long, 5 Network of Cancer Gene; http://ncg.kcl.ac.uk/index.php, 1Therapeutic Vulnerabilities in Cancer; http://cbio.mskcc.org/cancergenomics/statius/ |
| REACTOME_METABOLISM_OF_PROTEINS | |
| OMIM | 191350; gene. 608093; phenotype. 614750; phenotype. |
| Orphanet | 353327; Congenital myasthenic syndromes with glycosylation defect. 86309; DPAGT1-CDG. |
| Disease | KEGG Disease: DPAGT1 |
| MedGen: DPAGT1 (Human Medical Genetics with Condition) | |
| ClinVar: DPAGT1 | |
| Phenotype | MGI: DPAGT1 (International Mouse Phenotyping Consortium) |
| PhenomicDB: DPAGT1 | |
| Mutations for DPAGT1 |
| * Under tables are showing count per each tissue to give us broad intuition about tissue specific mutation patterns.You can go to the detailed page for each mutation database's web site. |
| There's no structural variation information in COSMIC data for this gene. |
| * From mRNA Sanger sequences, Chitars2.0 arranged chimeric transcripts. This table shows DPAGT1 related fusion information. |
| ID | Head Gene | Tail Gene | Accession | Gene_a | qStart_a | qEnd_a | Chromosome_a | tStart_a | tEnd_a | Gene_a | qStart_a | qEnd_a | Chromosome_a | tStart_a | tEnd_a |
| Top |
| There's no copy number variation information in COSMIC data for this gene. |
| Top |
|
 |
| Top |
| Stat. for Non-Synonymous SNVs (# total SNVs=34) | (# total SNVs=6) |
 |  |
(# total SNVs=8) | (# total SNVs=0) |
 |
| Top |
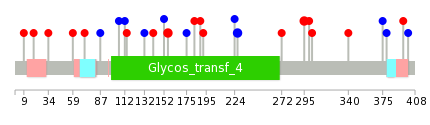
| * When you move the cursor on each content, you can see more deailed mutation information on the Tooltip. Those are primary_site,primary_histology,mutation(aa),pubmedID. |
| GRCh37 position | Mutation(aa) | Unique sampleID count |
| chr11:118969143-118969143 | p.F233fs*28 | 8 |
| chr11:118971369-118971369 | p.R156H | 3 |
| chr11:118971534-118971534 | p.A101V | 2 |
| chr11:118969112-118969112 | p.? | 2 |
| chr11:118972339-118972339 | p.M9I | 2 |
| chr11:118971782-118971782 | p.F76L | 2 |
| chr11:118969160-118969160 | p.F227F | 2 |
| chr11:118968574-118968574 | p.R303H | 2 |
| chr11:118971414-118971414 | p.F141S | 2 |
| chr11:118969169-118969169 | p.S224S | 1 |
| Top |
|
 |
| Point Mutation/ Tissue ID | 1 | 2 | 3 | 4 | 5 | 6 | 7 | 8 | 9 | 10 | 11 | 12 | 13 | 14 | 15 | 16 | 17 | 18 | 19 | 20 |
| # sample | 1 | 7 | 2 | 1 | 5 | 1 | 1 | 4 | 3 | 4 | ||||||||||
| # mutation | 1 | 5 | 2 | 1 | 5 | 1 | 1 | 4 | 3 | 4 | ||||||||||
| nonsynonymous SNV | 1 | 4 | 2 | 1 | 2 | 1 | 1 | 1 | 3 | |||||||||||
| synonymous SNV | 1 | 3 | 1 | 3 | 2 | 1 |
| cf) Tissue ID; Tissue type (1; BLCA[Bladder Urothelial Carcinoma], 2; BRCA[Breast invasive carcinoma], 3; CESC[Cervical squamous cell carcinoma and endocervical adenocarcinoma], 4; COAD[Colon adenocarcinoma], 5; GBM[Glioblastoma multiforme], 6; Glioma Low Grade, 7; HNSC[Head and Neck squamous cell carcinoma], 8; KICH[Kidney Chromophobe], 9; KIRC[Kidney renal clear cell carcinoma], 10; KIRP[Kidney renal papillary cell carcinoma], 11; LAML[Acute Myeloid Leukemia], 12; LUAD[Lung adenocarcinoma], 13; LUSC[Lung squamous cell carcinoma], 14; OV[Ovarian serous cystadenocarcinoma ], 15; PAAD[Pancreatic adenocarcinoma], 16; PRAD[Prostate adenocarcinoma], 17; SKCM[Skin Cutaneous Melanoma], 18:STAD[Stomach adenocarcinoma], 19:THCA[Thyroid carcinoma], 20:UCEC[Uterine Corpus Endometrial Carcinoma]) |
| Top |
| * We represented just top 10 SNVs. When you move the cursor on each content, you can see more deailed mutation information on the Tooltip. Those are primary_site, primary_histology, mutation(aa), pubmedID. |
| Genomic Position | Mutation(aa) | Unique sampleID count |
| chr11:118971369 | p.H295Y | 2 |
| chr11:118968599 | p.F227F | 2 |
| chr11:118969160 | p.R156H | 2 |
| chr11:118971749 | p.S396T | 1 |
| chr11:118967749 | p.F141L | 1 |
| chr11:118971049 | p.L379L | 1 |
| chr11:118971797 | p.A132A | 1 |
| chr11:118967876 | p.H375H | 1 |
| chr11:118971067 | p.A114V | 1 |
| chr11:118971834 | p.L340F | 1 |
| * Copy number data were extracted from TCGA using R package TCGA-Assembler. The URLs of all public data files on TCGA DCC data server were gathered on Jan-05-2015. Function ProcessCNAData in TCGA-Assembler package was used to obtain gene-level copy number value which is calculated as the average copy number of the genomic region of a gene. |
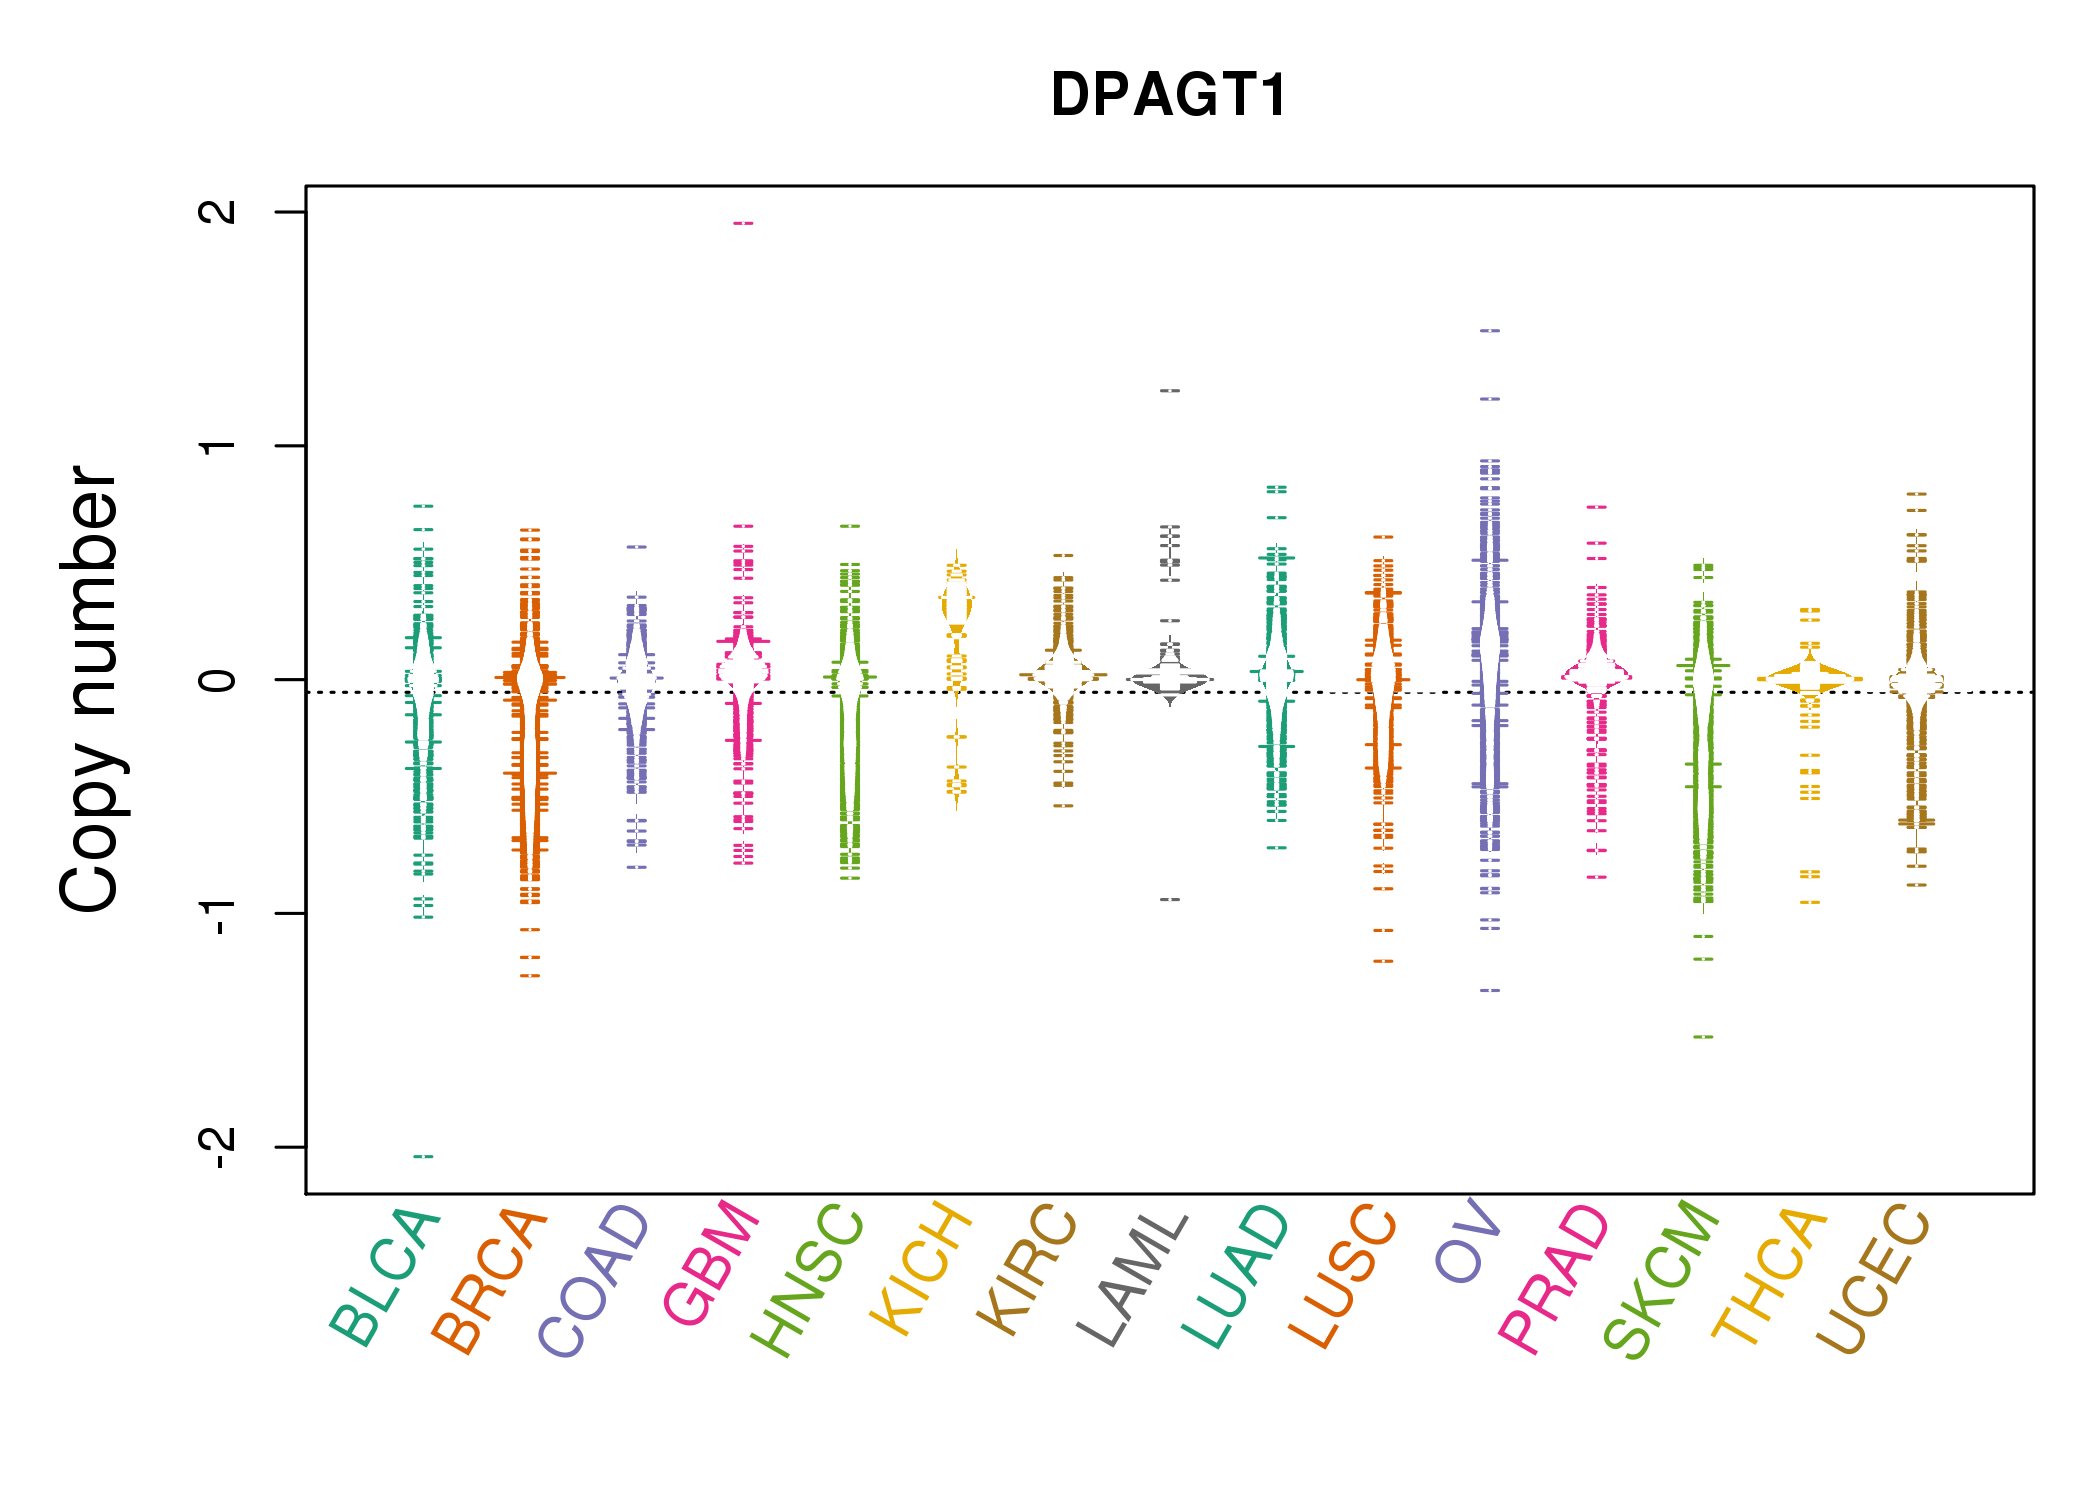 |
| cf) Tissue ID[Tissue type]: BLCA[Bladder Urothelial Carcinoma], BRCA[Breast invasive carcinoma], CESC[Cervical squamous cell carcinoma and endocervical adenocarcinoma], COAD[Colon adenocarcinoma], GBM[Glioblastoma multiforme], Glioma Low Grade, HNSC[Head and Neck squamous cell carcinoma], KICH[Kidney Chromophobe], KIRC[Kidney renal clear cell carcinoma], KIRP[Kidney renal papillary cell carcinoma], LAML[Acute Myeloid Leukemia], LUAD[Lung adenocarcinoma], LUSC[Lung squamous cell carcinoma], OV[Ovarian serous cystadenocarcinoma ], PAAD[Pancreatic adenocarcinoma], PRAD[Prostate adenocarcinoma], SKCM[Skin Cutaneous Melanoma], STAD[Stomach adenocarcinoma], THCA[Thyroid carcinoma], UCEC[Uterine Corpus Endometrial Carcinoma] |
| Top |
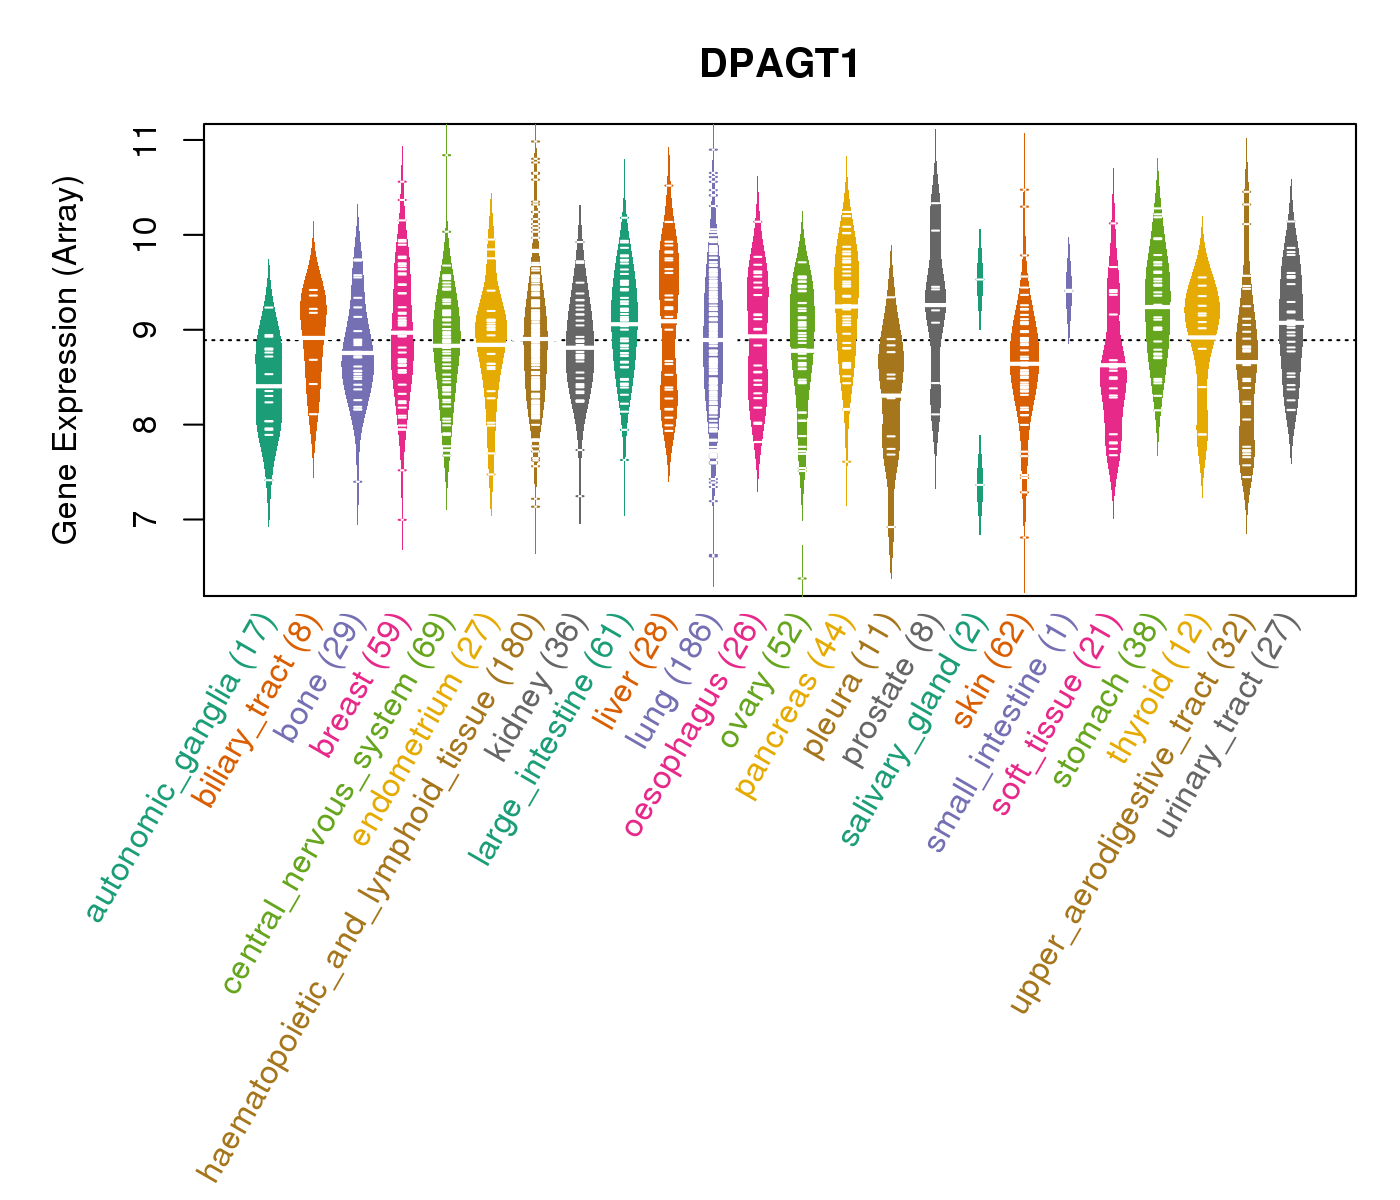
| Gene Expression for DPAGT1 |
| * CCLE gene expression data were extracted from CCLE_Expression_Entrez_2012-10-18.res: Gene-centric RMA-normalized mRNA expression data. |
 |
| * Normalized gene expression data of RNASeqV2 was extracted from TCGA using R package TCGA-Assembler. The URLs of all public data files on TCGA DCC data server were gathered at Jan-05-2015. Only eight cancer types have enough normal control samples for differential expression analysis. (t test, adjusted p<0.05 (using Benjamini-Hochberg FDR)) |
 |
| Top |
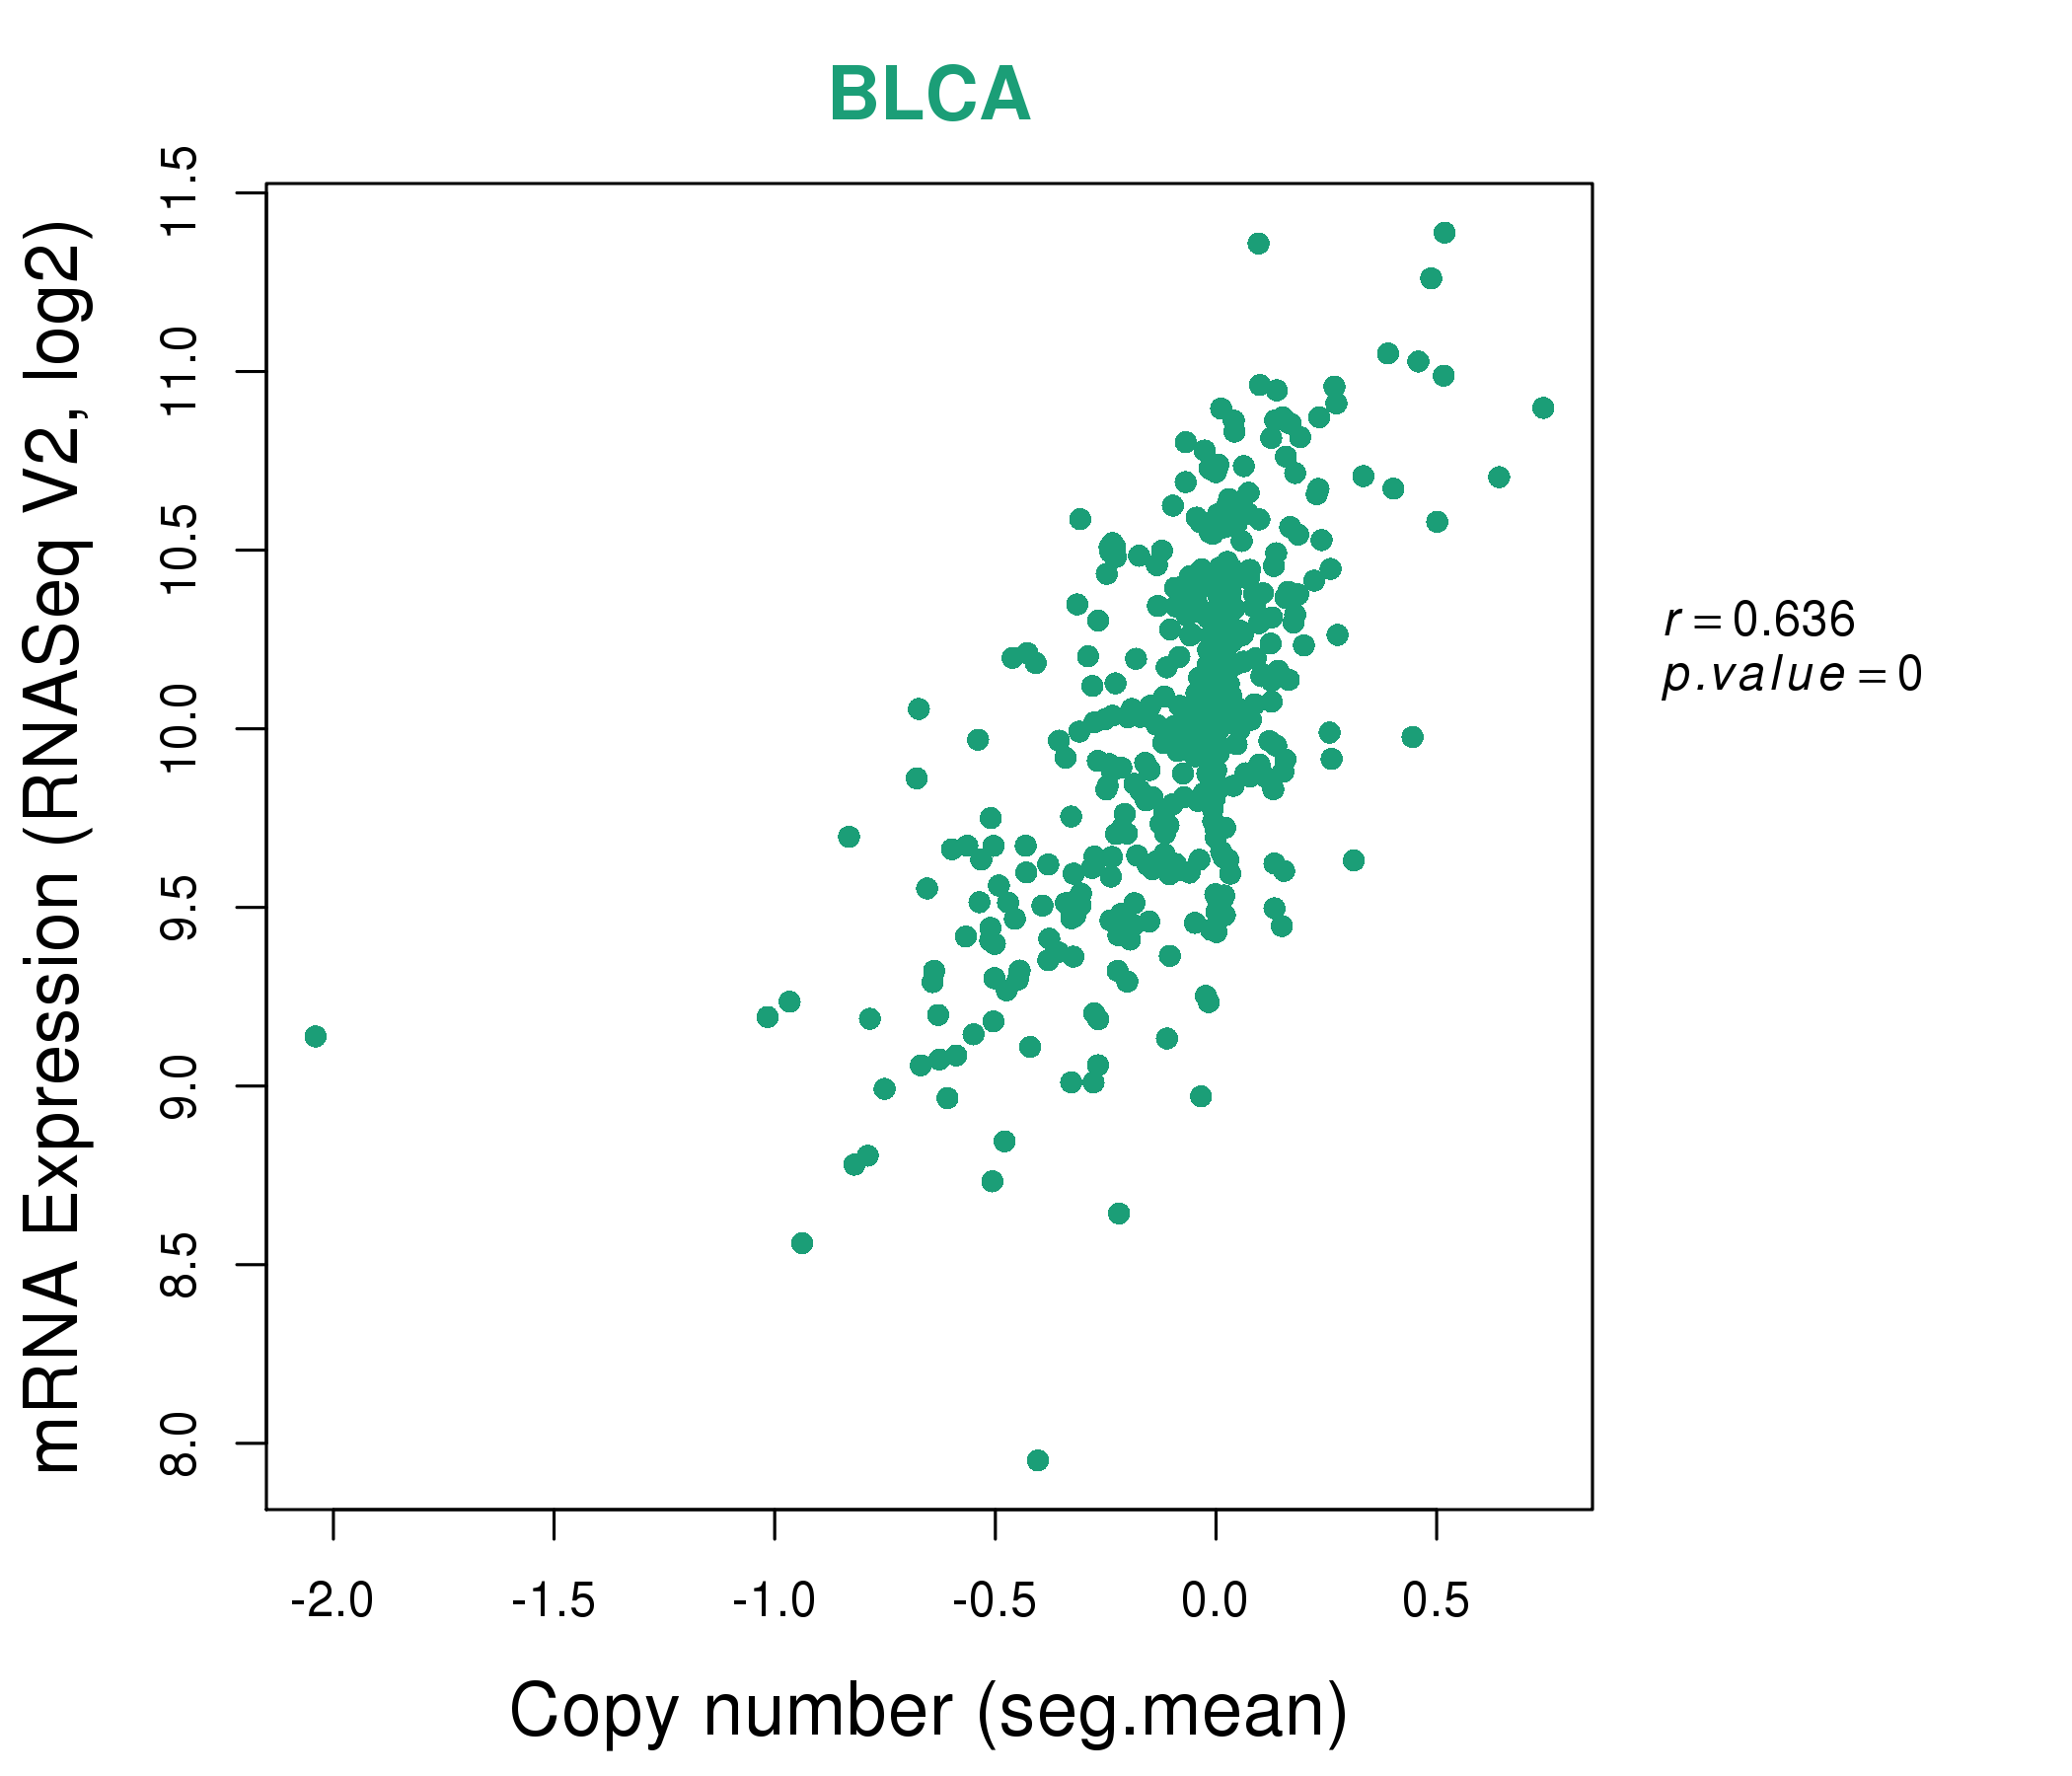
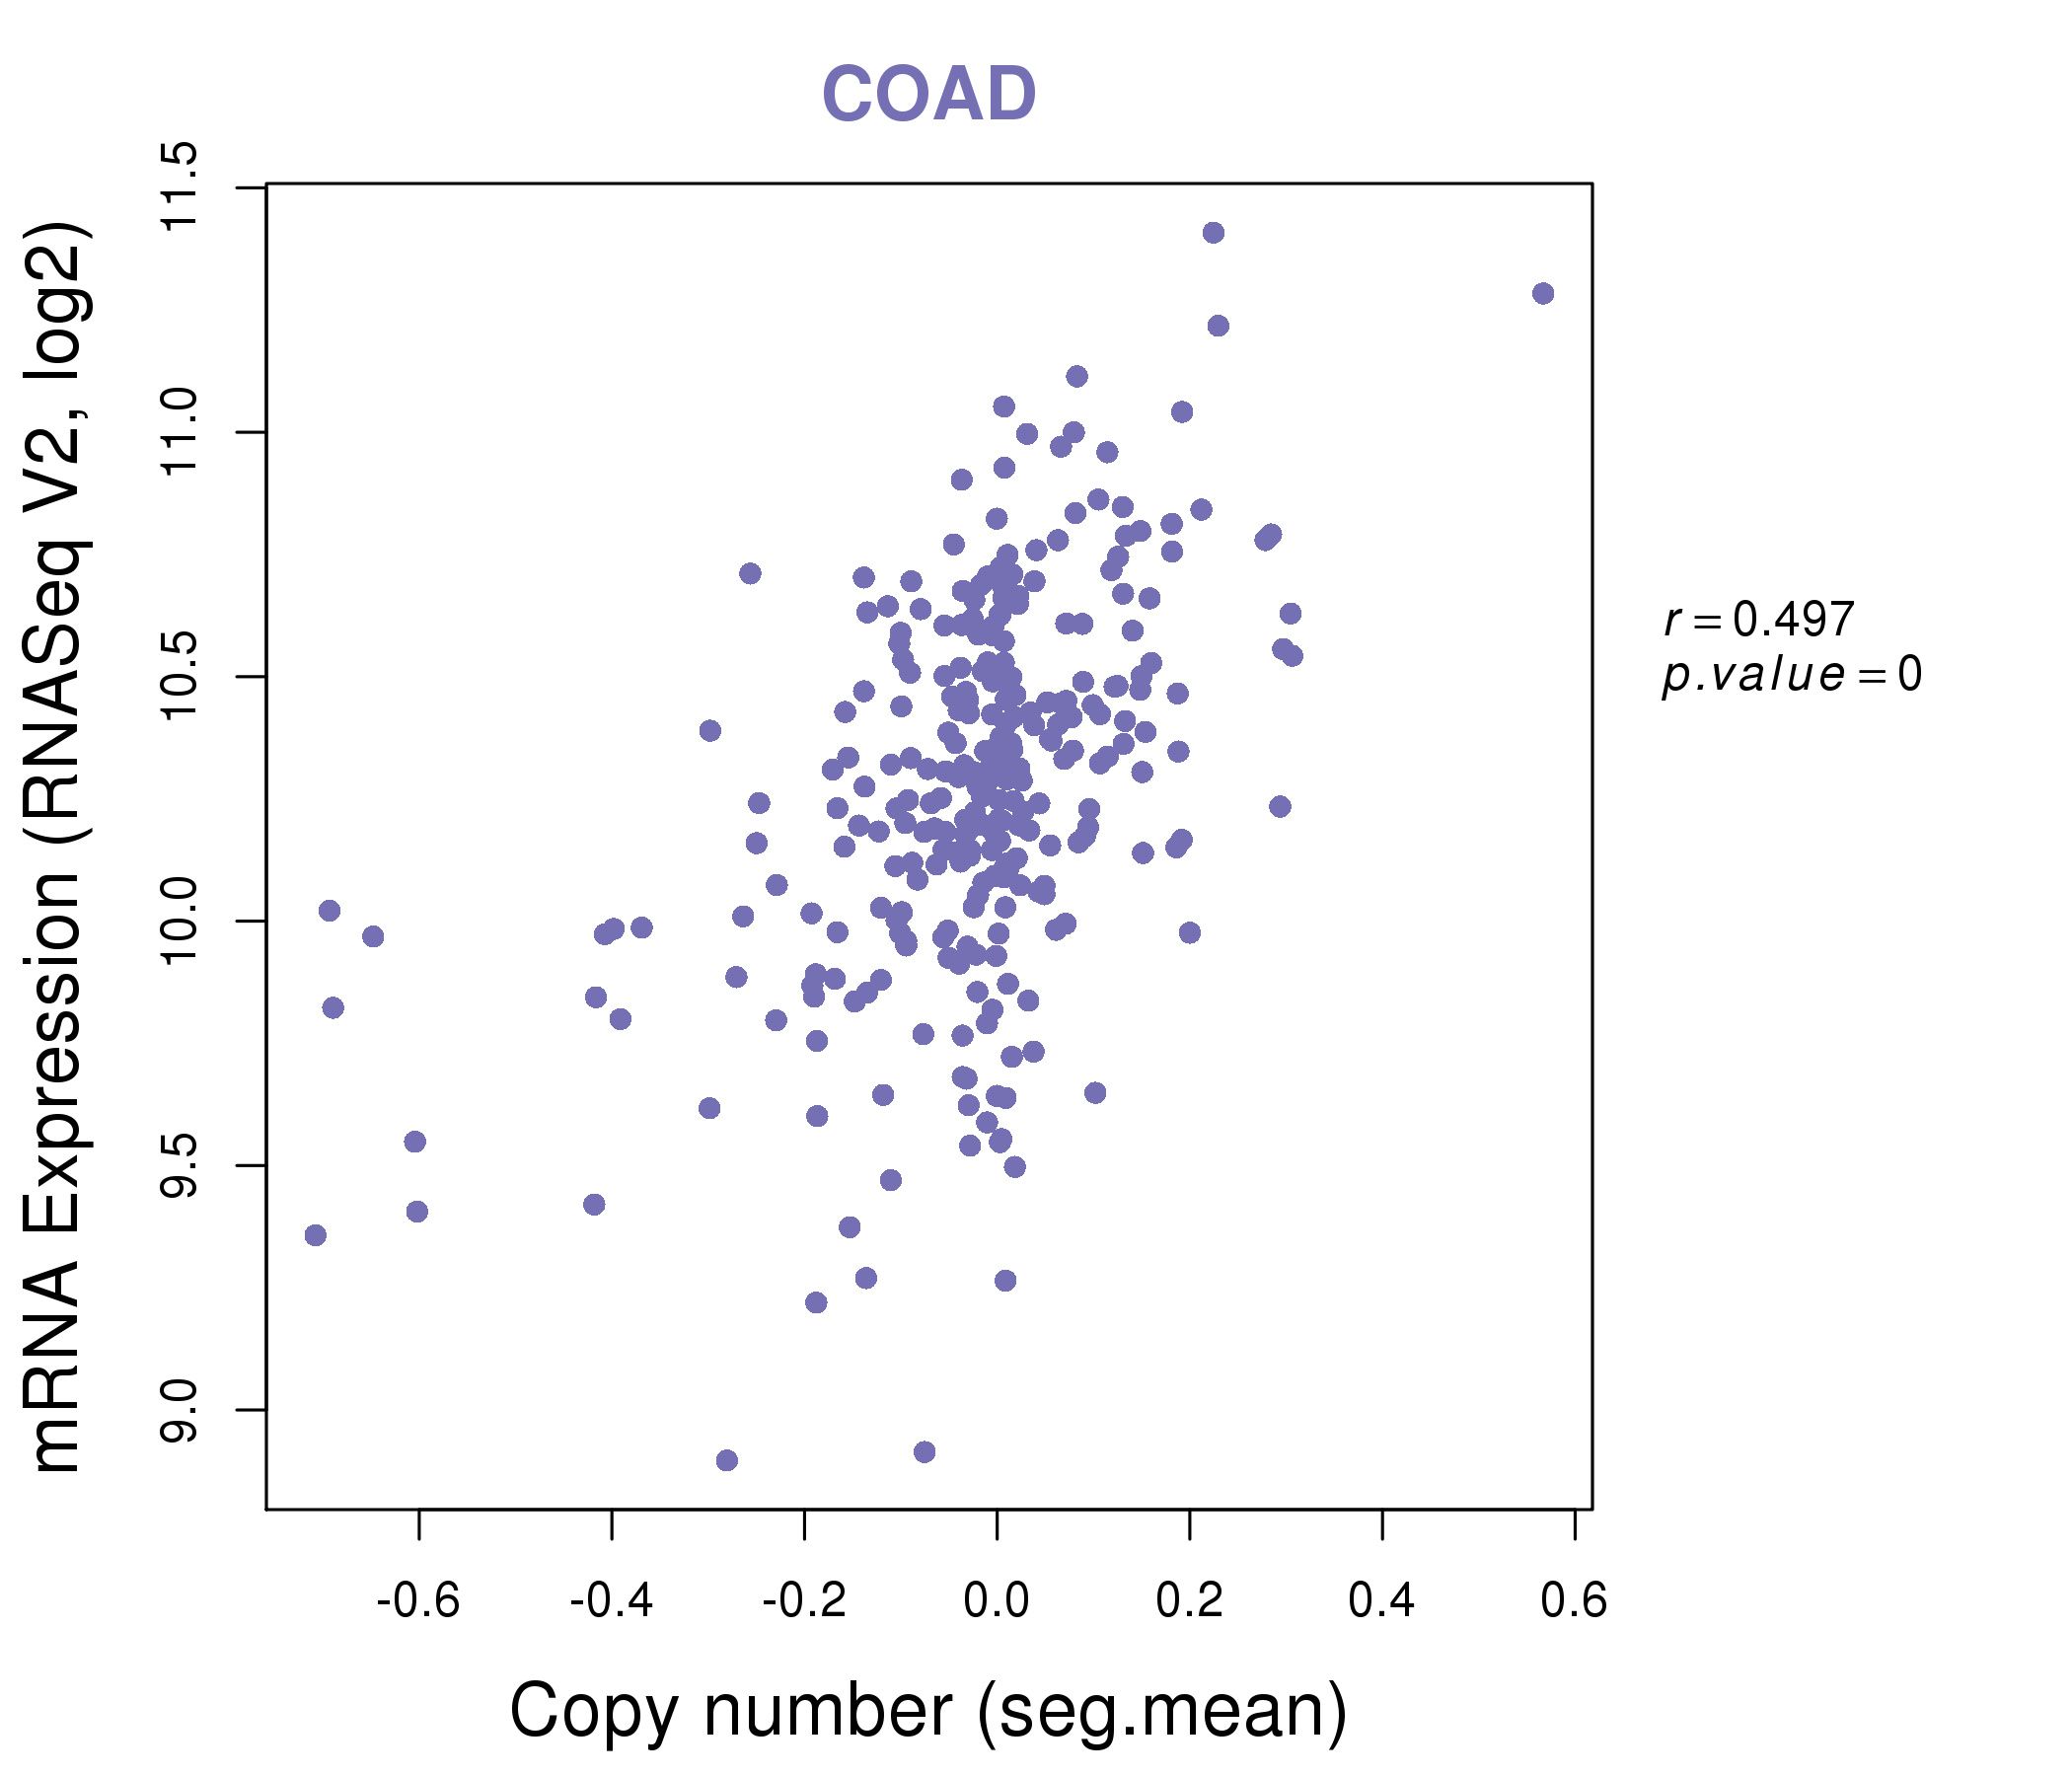
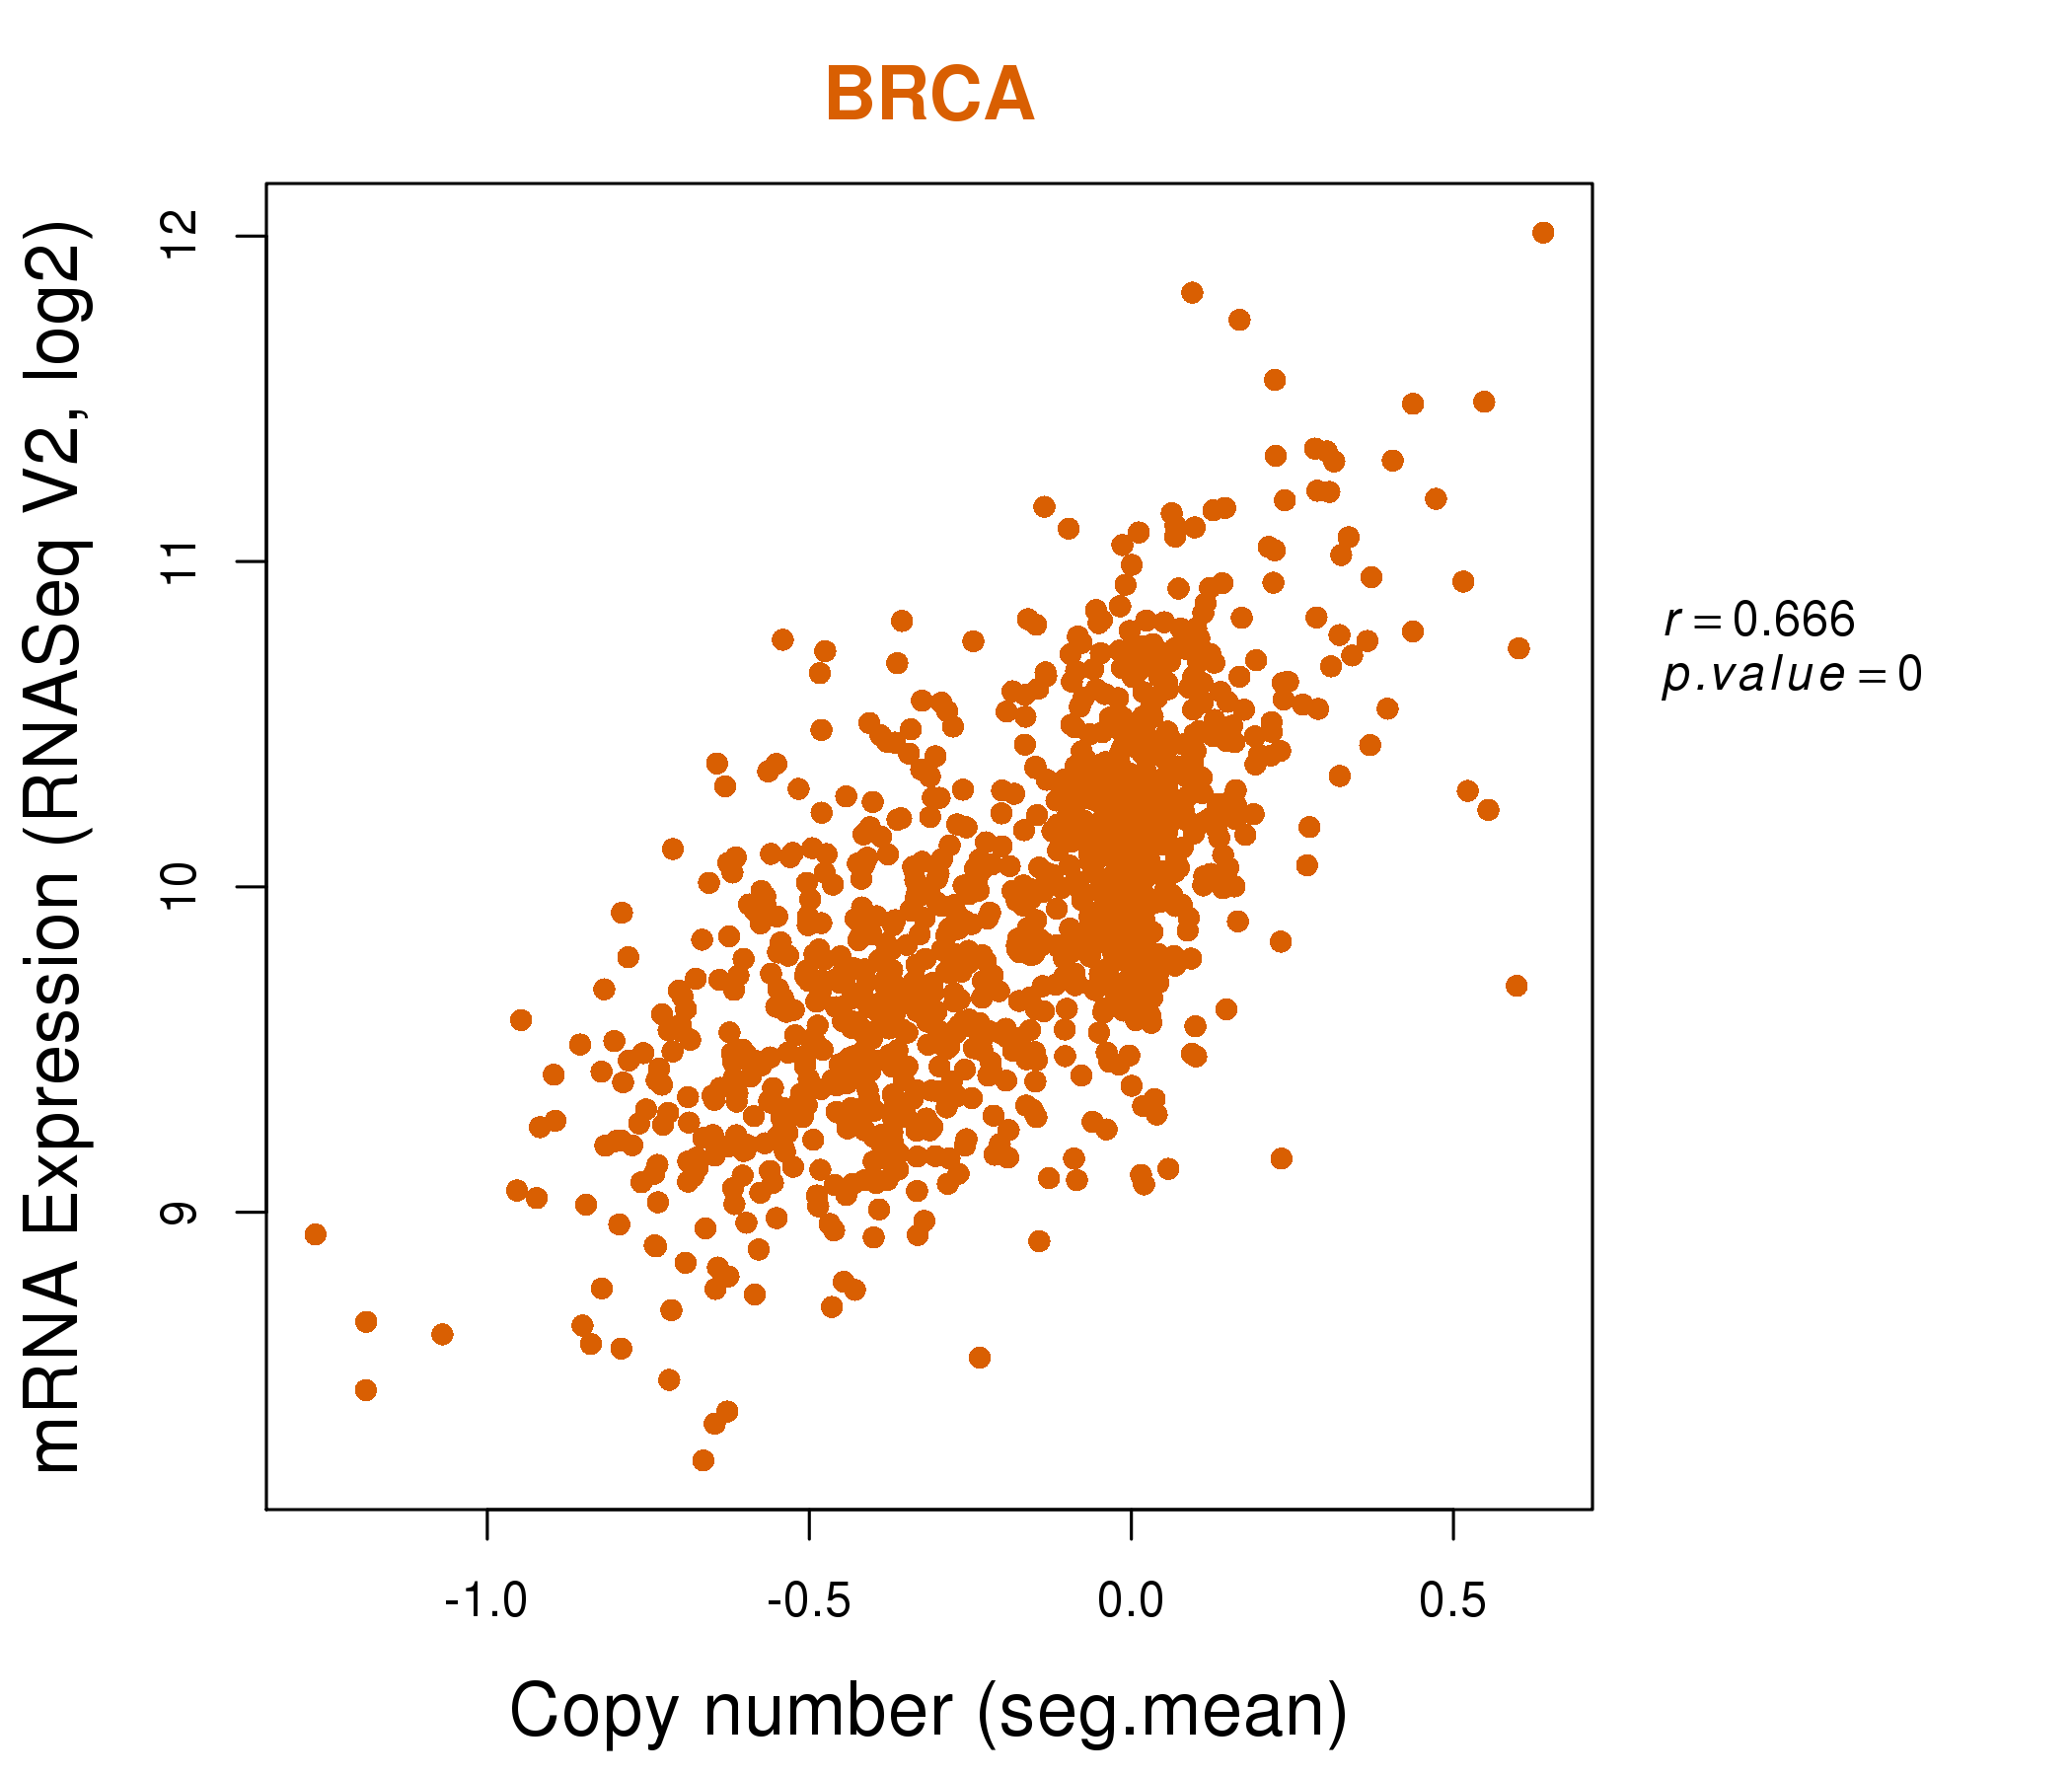
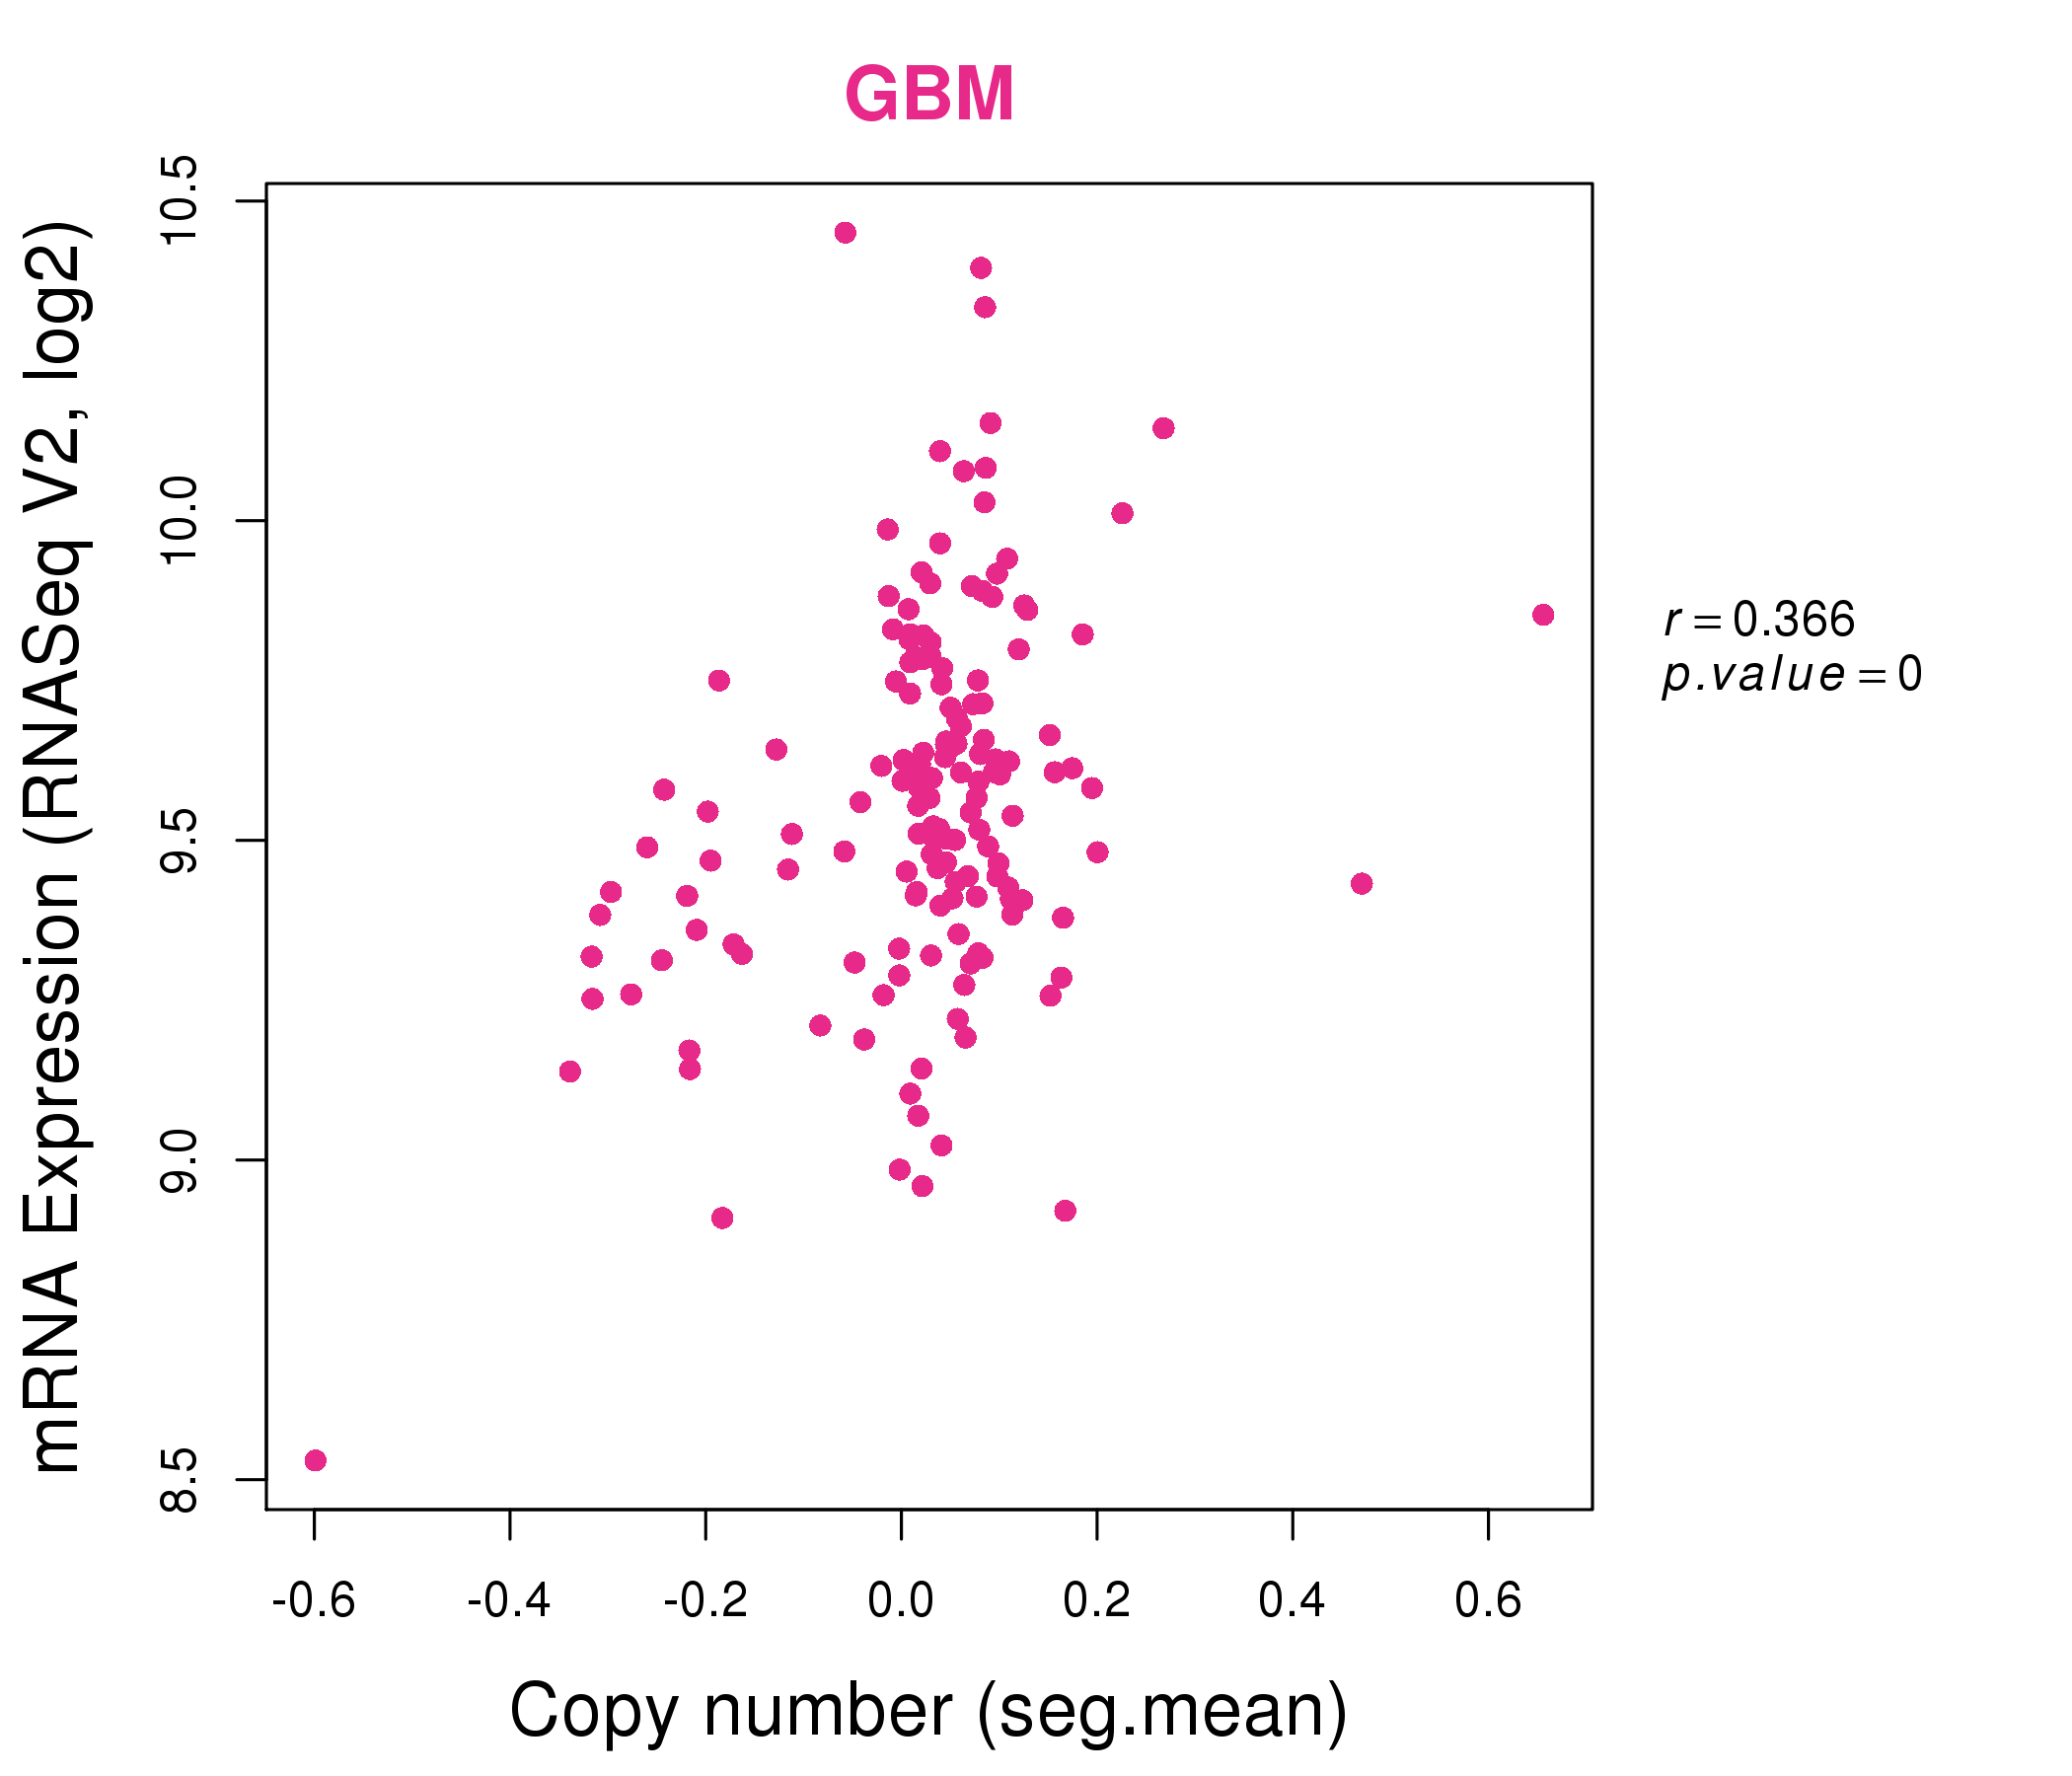
| * This plots show the correlation between CNV and gene expression. |
: Open all plots for all cancer types
 |
|
 |
|
| Top |
| Gene-Gene Network Information |
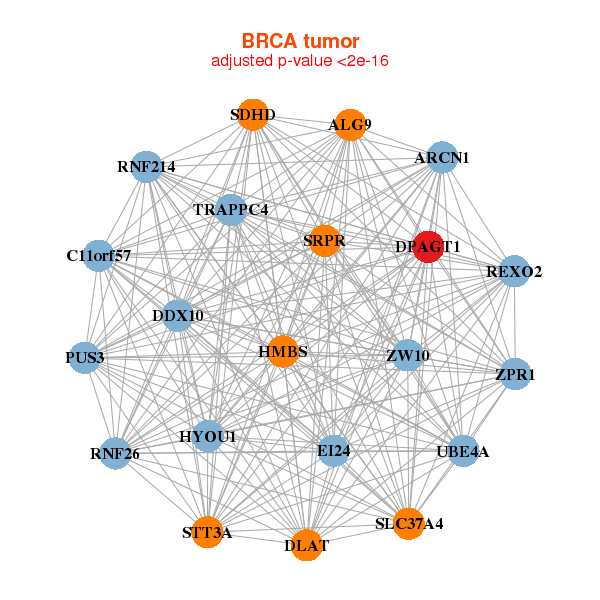
| * Co-Expression network figures were drawn using R package igraph. Only the top 20 genes with the highest correlations were shown. Red circle: input gene, orange circle: cell metabolism gene, sky circle: other gene |
: Open all plots for all cancer types
 |
|
| ALG9,ARCN1,C11orf57,DDX10,DLAT,DPAGT1,EI24, HMBS,HYOU1,PUS3,REXO2,RNF214,RNF26,SDHD, SLC37A4,SRPR,STT3A,TRAPPC4,UBE4A,ZPR1,ZW10 | AGA,ALG3,TMEM254,C14orf1,ABRACL,COPZ1,DPAGT1, DYNLT1,MYCBP,ORMDL2,SLC50A1,RPN2,RPP40,SRD5A3, SRPRB,TM9SF1,TMBIM6,TMEM179B,TMEM99,VAMP8,YIPF1 |
 |
|
| ALG9,CCDC86,DDX10,DLAT,DPAGT1,EI24,FAM86C1, FOXRED1,HMBS,LOC653566,MEN1,PPME1,RNF26,RPUSD4, SLC29A2,SLC37A4,SPCS2,STIP1,STT3A,TMEM138,TMX2 | ANLN,BUB1B,C17orf53,CEP55,DPAGT1,FOXM1,HYOU1, LARS2,LMNB1,PDIA4,PKMYT1,RAD54L,RPN2,RRM2, SCFD2,SEC61A1,SLC38A5,SLCO4A1,SSRP1,STT3A,TYMS |

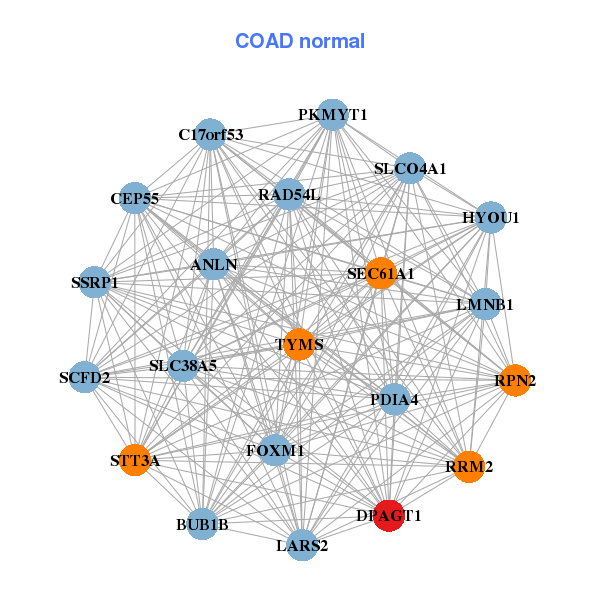
| * Co-Expression network figures were drawn using R package igraph. Only the top 20 genes with the highest correlations were shown. Red circle: input gene, orange circle: cell metabolism gene, sky circle: other gene |
: Open all plots for all cancer types
| Top |
: Open all interacting genes' information including KEGG pathway for all interacting genes from DAVID
| Top |
| Pharmacological Information for DPAGT1 |
| There's no related Drug. |
| Top |
| Cross referenced IDs for DPAGT1 |
| * We obtained these cross-references from Uniprot database. It covers 150 different DBs, 18 categories. http://www.uniprot.org/help/cross_references_section |
: Open all cross reference information
|
Copyright © 2016-Present - The Univsersity of Texas Health Science Center at Houston @ |