|
|||||||||||||||||||||||||||||||||||||||||||||||||||||||||||||||||||||||||||||||||||||||||||||||||||||||||||||||||||||||||||||||||||||||||||||||||||||||||||||||||||||||||||||||||||||||||||||||||||||||||||||||||||||||||||||||||||||||||||||||||||||||||||||||||||||||||||||||||||||||||||||||||||||||||||||||||||||||||||||||||||||||||||||||||||||||||||||||||||||||||||||||||||||||||||||
| |
| Phenotypic Information (metabolism pathway, cancer, disease, phenome) |
| |
| |
| Gene-Gene Network Information: Co-Expression Network, Interacting Genes & KEGG |
| |
|


| Gene Summary for ABAT |
| Basic gene info. | Gene symbol | ABAT |
| Gene name | 4-aminobutyrate aminotransferase | |
| Synonyms | GABA-AT|GABAT|NPD009 | |
| Cytomap | UCSC genome browser: 16p13.2 | |
| Genomic location | chr16 :8768443-8878432 | |
| Type of gene | protein-coding | |
| RefGenes | NM_000663.4, NM_001127448.1,NM_020686.5, | |
| Ensembl id | ENSG00000183044 | |
| Description | (S)-3-amino-2-methylpropionate transaminase4-aminobutyrate aminotransferase, mitochondrial4-aminobutyrate transaminaseGABA aminotransferaseGABA transaminaseGABA transferasegamma-amino-N-butyrate transaminase | |
| Modification date | 20141207 | |
| dbXrefs | MIM : 137150 | |
| HGNC : HGNC | ||
| Ensembl : ENSG00000183044 | ||
| HPRD : 00661 | ||
| Vega : OTTHUMG00000048201 | ||
| Protein | UniProt: go to UniProt's Cross Reference DB Table | |
| Expression | CleanEX: HS_ABAT | |
| BioGPS: 18 | ||
| Gene Expression Atlas: ENSG00000183044 | ||
| The Human Protein Atlas: ENSG00000183044 | ||
| Pathway | NCI Pathway Interaction Database: ABAT | |
| KEGG: ABAT | ||
| REACTOME: ABAT | ||
| ConsensusPathDB | ||
| Pathway Commons: ABAT | ||
| Metabolism | MetaCyc: ABAT | |
| HUMANCyc: ABAT | ||
| Regulation | Ensembl's Regulation: ENSG00000183044 | |
| miRBase: chr16 :8,768,443-8,878,432 | ||
| TargetScan: NM_000663 | ||
| cisRED: ENSG00000183044 | ||
| Context | iHOP: ABAT | |
| cancer metabolism search in PubMed: ABAT | ||
| UCL Cancer Institute: ABAT | ||
| Assigned class in ccmGDB | C | |
| Top |
| Phenotypic Information for ABAT(metabolism pathway, cancer, disease, phenome) |
| Cancer | CGAP: ABAT |
| Familial Cancer Database: ABAT | |
| * This gene is included in those cancer gene databases. |
|
|
|
|
|
| . | |||||||||||||||||||||||||||||||||||||||||||||||||||||||||||||||||||||||||||||||||||||||||||||||||||||||||||||||||||||||||||||||||||||||||||||||||||||||||||||||||||||||||||||||||||||||||||||||||||||||||||||||||||||||||||||||||||||||||||||||||||||||||||||||||||||||||||||||||||||||||||||||||||||||||||||||||||||||||||||||||||||||||||||||||||||||||||||||||||||||||||||||||||||||
Oncogene 1 | Significant driver gene in | ||||||||||||||||||||||||||||||||||||||||||||||||||||||||||||||||||||||||||||||||||||||||||||||||||||||||||||||||||||||||||||||||||||||||||||||||||||||||||||||||||||||||||||||||||||||||||||||||||||||||||||||||||||||||||||||||||||||||||||||||||||||||||||||||||||||||||||||||||||||||||||||||||||||||||||||||||||||||||||||||||||||||||||||||||||||||||||||||||||||||||||||||||||||||||||
| cf) number; DB name 1 Oncogene; http://nar.oxfordjournals.org/content/35/suppl_1/D721.long, 2 Tumor Suppressor gene; https://bioinfo.uth.edu/TSGene/, 3 Cancer Gene Census; http://www.nature.com/nrc/journal/v4/n3/abs/nrc1299.html, 4 CancerGenes; http://nar.oxfordjournals.org/content/35/suppl_1/D721.long, 5 Network of Cancer Gene; http://ncg.kcl.ac.uk/index.php, 1Therapeutic Vulnerabilities in Cancer; http://cbio.mskcc.org/cancergenomics/statius/ |
| KEGG_ALANINE_ASPARTATE_AND_GLUTAMATE_METABOLISM KEGG_BETA_ALANINE_METABOLISM KEGG_PROPANOATE_METABOLISM KEGG_BUTANOATE_METABOLISM | |
| OMIM | |
| Orphanet | |
| Disease | KEGG Disease: ABAT |
| MedGen: ABAT (Human Medical Genetics with Condition) | |
| ClinVar: ABAT | |
| Phenotype | MGI: ABAT (International Mouse Phenotyping Consortium) |
| PhenomicDB: ABAT | |
| Mutations for ABAT |
| * Under tables are showing count per each tissue to give us broad intuition about tissue specific mutation patterns.You can go to the detailed page for each mutation database's web site. |
| - Statistics for Tissue and Mutation type | Top |
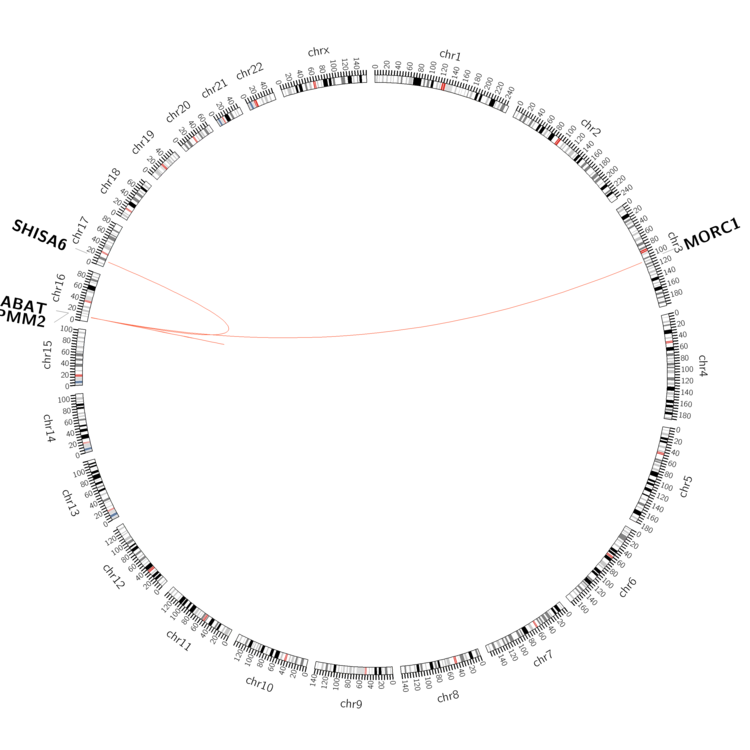 |
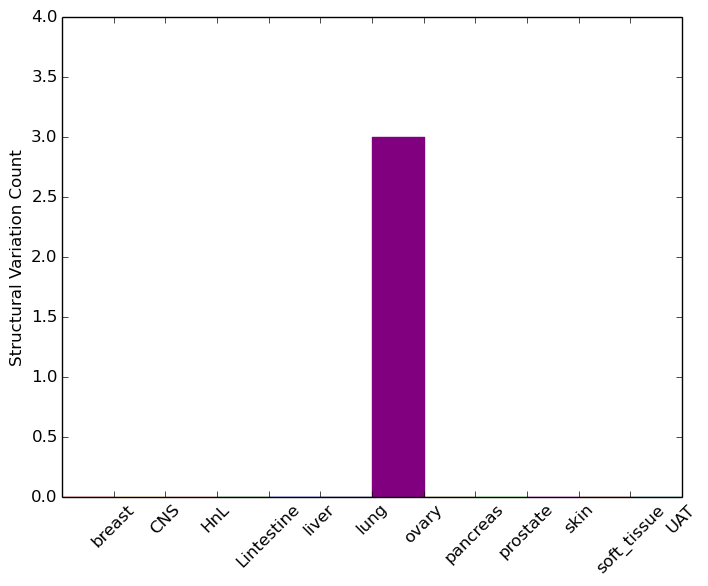
| - For Inter-chromosomal Variations |
| * Inter-chromosomal variantions includes 'interchromosomal amplicon to amplicon', 'interchromosomal amplicon to non-amplified dna', 'interchromosomal insertion', 'Interchromosomal unknown type'. |
 |
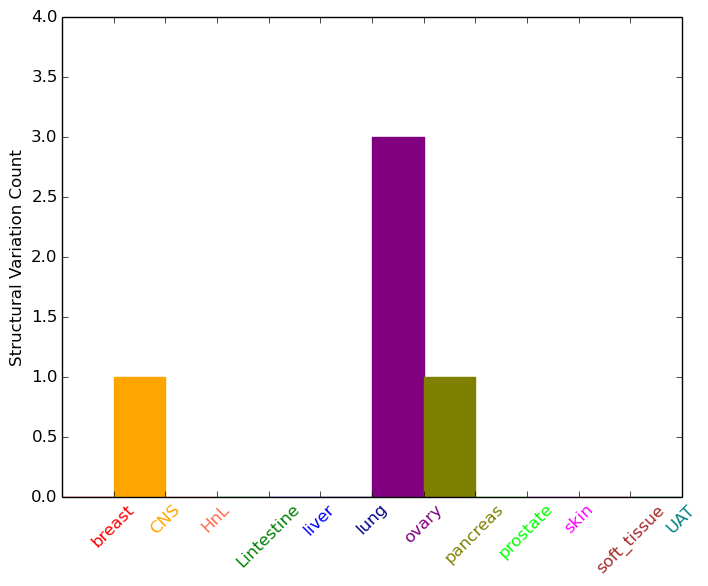
| - For Intra-chromosomal Variations |
| * Intra-chromosomal variantions includes 'intrachromosomal amplicon to amplicon', 'intrachromosomal amplicon to non-amplified dna', 'intrachromosomal deletion', 'intrachromosomal fold-back inversion', 'intrachromosomal inversion', 'intrachromosomal tandem duplication', 'Intrachromosomal unknown type', 'intrachromosomal with inverted orientation', 'intrachromosomal with non-inverted orientation'. |
 |
| Sample | Symbol_a | Chr_a | Start_a | End_a | Symbol_b | Chr_b | Start_b | End_b |
| central_nervous_system | ABAT | chr16 | 8795428 | 8795428 | PMM2 | chr16 | 8897815 | 8897815 |
| ovary | ABAT | chr16 | 8784446 | 8784466 | ABAT | chr16 | 8785182 | 8785202 |
| ovary | ABAT | chr16 | 8790456 | 8790476 | ABAT | chr16 | 8790882 | 8790902 |
| ovary | ABAT | chr16 | 8790787 | 8790987 | SHISA6 | chr17 | 11438065 | 11438265 |
| ovary | ABAT | chr16 | 8847344 | 8847364 | ABAT | chr16 | 8823754 | 8823774 |
| pancreas | ABAT | chr16 | 8789135 | 8789155 | ABAT | chr16 | 8789228 | 8789248 |
| cf) Tissue number; Tissue name (1;Breast, 2;Central_nervous_system, 3;Haematopoietic_and_lymphoid_tissue, 4;Large_intestine, 5;Liver, 6;Lung, 7;Ovary, 8;Pancreas, 9;Prostate, 10;Skin, 11;Soft_tissue, 12;Upper_aerodigestive_tract) |
| * From mRNA Sanger sequences, Chitars2.0 arranged chimeric transcripts. This table shows ABAT related fusion information. |
| ID | Head Gene | Tail Gene | Accession | Gene_a | qStart_a | qEnd_a | Chromosome_a | tStart_a | tEnd_a | Gene_a | qStart_a | qEnd_a | Chromosome_a | tStart_a | tEnd_a |
| AA002171 | LDLR | 1 | 183 | 19 | 11244309 | 11244491 | ABAT | 184 | 493 | 16 | 8877665 | 8877972 | |
| BF923967 | AKNAD1 | 62 | 147 | 1 | 109465085 | 109465171 | ABAT | 142 | 444 | 16 | 8839711 | 8840013 | |
| BF064196 | ABAT | 354 | 392 | 16 | 8865884 | 8865922 | PSMD12 | 389 | 490 | 17 | 65351510 | 65351611 | |
| BF944944 | EDIL3 | 8 | 280 | 5 | 83448843 | 83449119 | ABAT | 262 | 439 | 16 | 8835173 | 8835350 | |
| Top |
| Mutation type/ Tissue ID | brca | cns | cerv | endome | haematopo | kidn | Lintest | liver | lung | ns | ovary | pancre | prost | skin | stoma | thyro | urina | |||
| Total # sample | 1 | 2 | 1 | |||||||||||||||||
| GAIN (# sample) | 1 | 1 | 1 | |||||||||||||||||
| LOSS (# sample) | 1 |
| cf) Tissue ID; Tissue type (1; Breast, 2; Central_nervous_system, 3; Cervix, 4; Endometrium, 5; Haematopoietic_and_lymphoid_tissue, 6; Kidney, 7; Large_intestine, 8; Liver, 9; Lung, 10; NS, 11; Ovary, 12; Pancreas, 13; Prostate, 14; Skin, 15; Stomach, 16; Thyroid, 17; Urinary_tract) |
| Top |
|
 |
| Top |
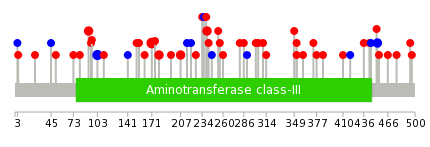
| Stat. for Non-Synonymous SNVs (# total SNVs=41) | (# total SNVs=8) |
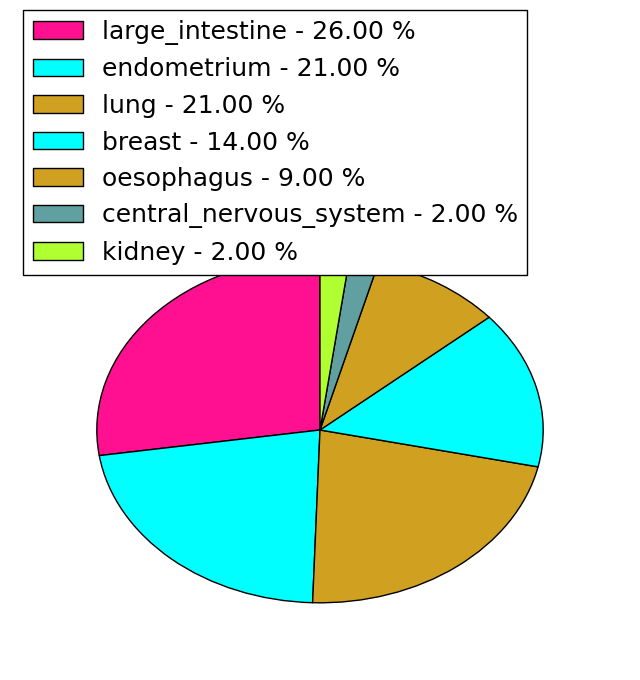 | 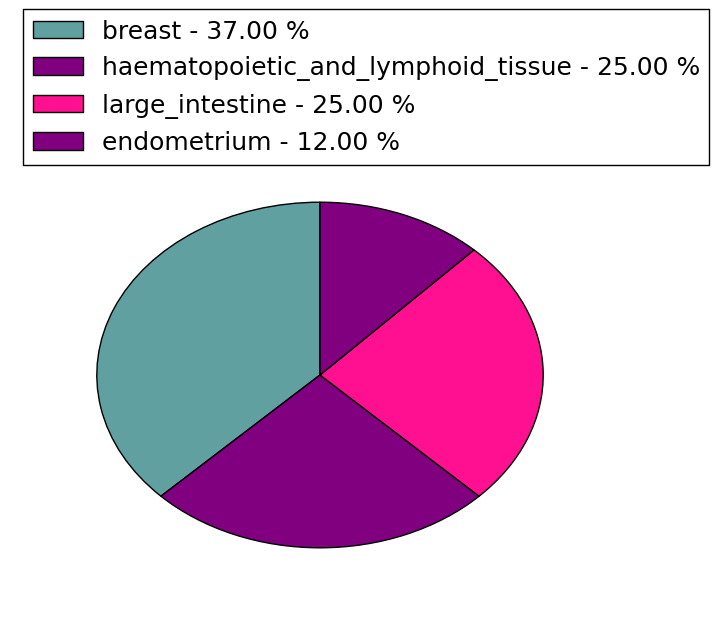 |
(# total SNVs=1) | (# total SNVs=0) |
 |
| Top |
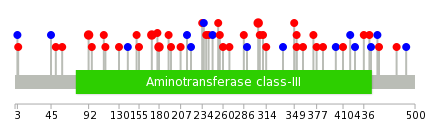
| * When you move the cursor on each content, you can see more deailed mutation information on the Tooltip. Those are primary_site,primary_histology,mutation(aa),pubmedID. |
| GRCh37 position | Mutation(aa) | Unique sampleID count |
| chr16:8858658-8858658 | p.A171T | 4 |
| chr16:8844389-8844389 | p.V103V | 3 |
| chr16:8868846-8868846 | p.V352M | 2 |
| chr16:8873425-8873425 | p.L453L | 2 |
| chr16:8844355-8844355 | p.R92Q | 2 |
| chr16:8862733-8862733 | p.S240F | 2 |
| chr16:8858686-8858686 | p.R180Q | 2 |
| chr16:8862065-8862065 | p.D207N | 2 |
| chr16:8873401-8873401 | p.P445P | 1 |
| chr16:8862091-8862091 | p.G215G | 1 |
| Top |
|
 |
| Point Mutation/ Tissue ID | 1 | 2 | 3 | 4 | 5 | 6 | 7 | 8 | 9 | 10 | 11 | 12 | 13 | 14 | 15 | 16 | 17 | 18 | 19 | 20 |
| # sample | 5 | 8 | 5 | 1 | 6 | 3 | 12 | 6 | 9 | |||||||||||
| # mutation | 5 | 8 | 6 | 1 | 7 | 3 | 12 | 6 | 9 | |||||||||||
| nonsynonymous SNV | 3 | 7 | 4 | 1 | 5 | 2 | 8 | 4 | 8 | |||||||||||
| synonymous SNV | 2 | 1 | 2 | 2 | 1 | 4 | 2 | 1 |
| cf) Tissue ID; Tissue type (1; BLCA[Bladder Urothelial Carcinoma], 2; BRCA[Breast invasive carcinoma], 3; CESC[Cervical squamous cell carcinoma and endocervical adenocarcinoma], 4; COAD[Colon adenocarcinoma], 5; GBM[Glioblastoma multiforme], 6; Glioma Low Grade, 7; HNSC[Head and Neck squamous cell carcinoma], 8; KICH[Kidney Chromophobe], 9; KIRC[Kidney renal clear cell carcinoma], 10; KIRP[Kidney renal papillary cell carcinoma], 11; LAML[Acute Myeloid Leukemia], 12; LUAD[Lung adenocarcinoma], 13; LUSC[Lung squamous cell carcinoma], 14; OV[Ovarian serous cystadenocarcinoma ], 15; PAAD[Pancreatic adenocarcinoma], 16; PRAD[Prostate adenocarcinoma], 17; SKCM[Skin Cutaneous Melanoma], 18:STAD[Stomach adenocarcinoma], 19:THCA[Thyroid carcinoma], 20:UCEC[Uterine Corpus Endometrial Carcinoma]) |
| Top |
| * We represented just top 10 SNVs. When you move the cursor on each content, you can see more deailed mutation information on the Tooltip. Those are primary_site, primary_histology, mutation(aa), pubmedID. |
| Genomic Position | Mutation(aa) | Unique sampleID count |
| chr16:8866730 | p.A171T,ABAT | 2 |
| chr16:8858658 | p.R180Q,ABAT | 2 |
| chr16:8858686 | p.A304T,ABAT | 2 |
| chr16:8844355 | p.R92Q,ABAT | 2 |
| chr16:8868846 | p.V352L,ABAT | 2 |
| chr16:8866677 | p.E256K,ABAT | 1 |
| chr16:8870208 | p.R401R,ABAT | 1 |
| chr16:8857947 | p.P152L,ABAT | 1 |
| chr16:8875213 | p.K260Q,ABAT | 1 |
| chr16:8862106 | p.H410L,ABAT | 1 |
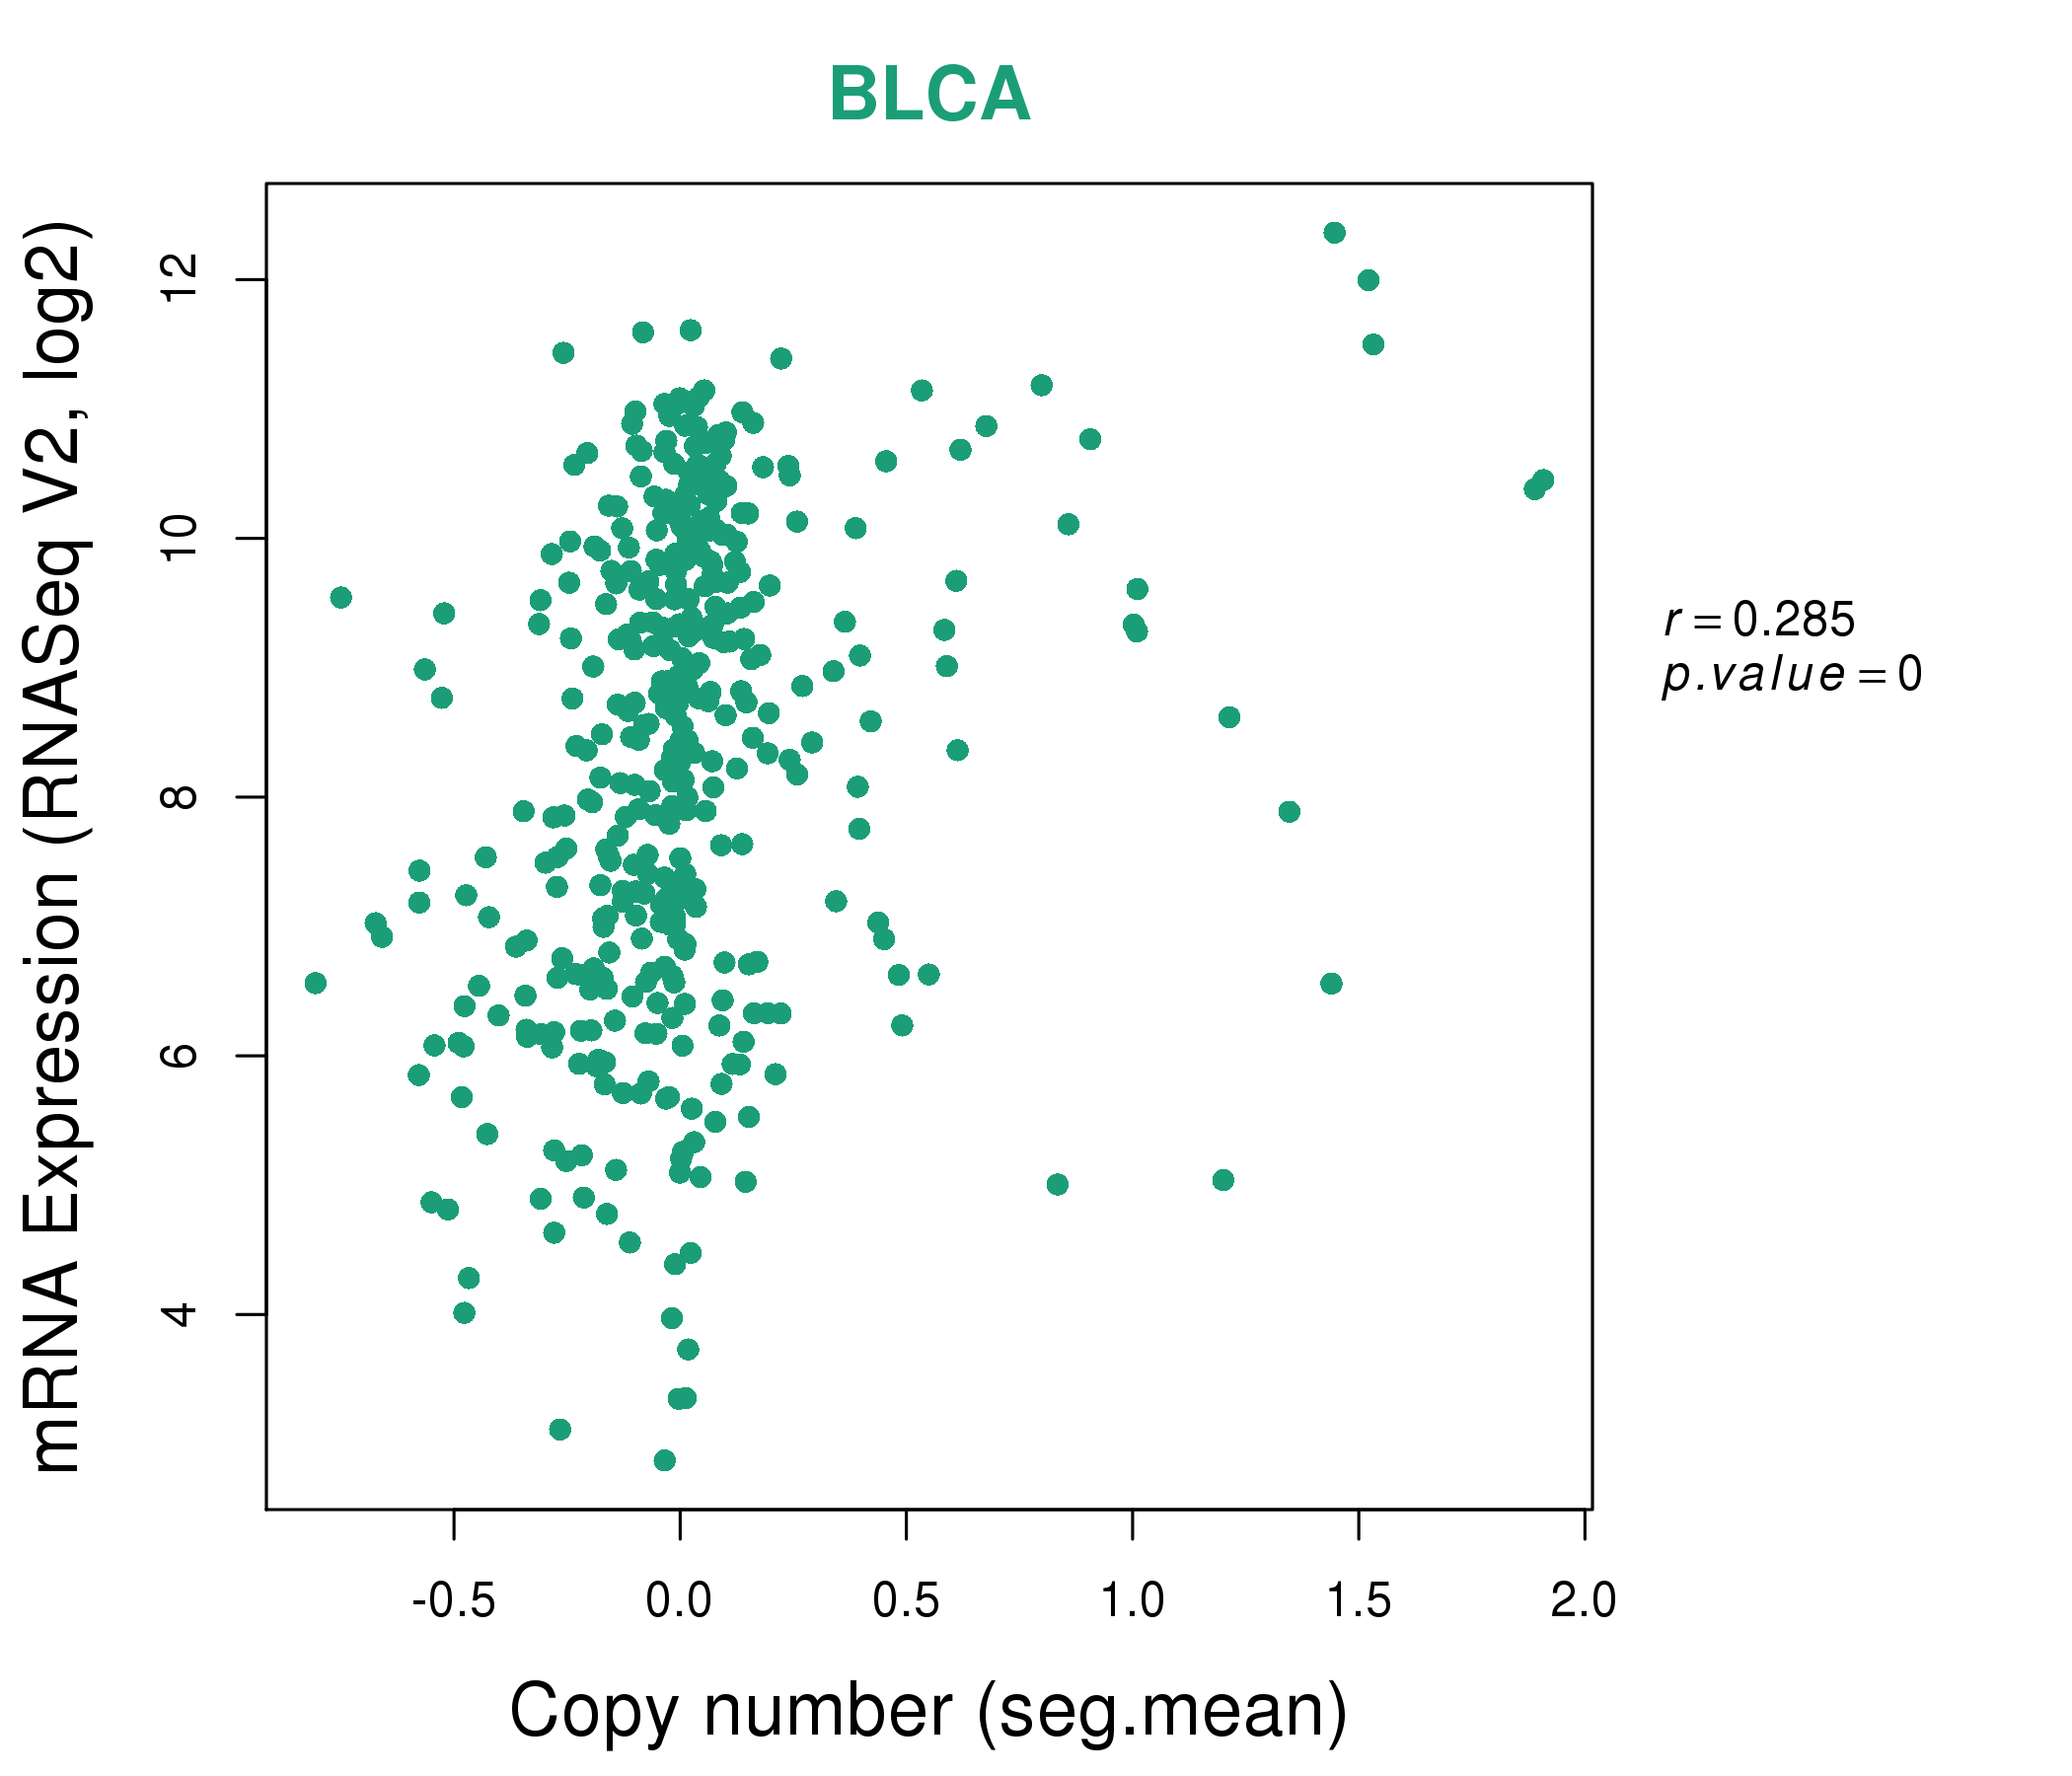
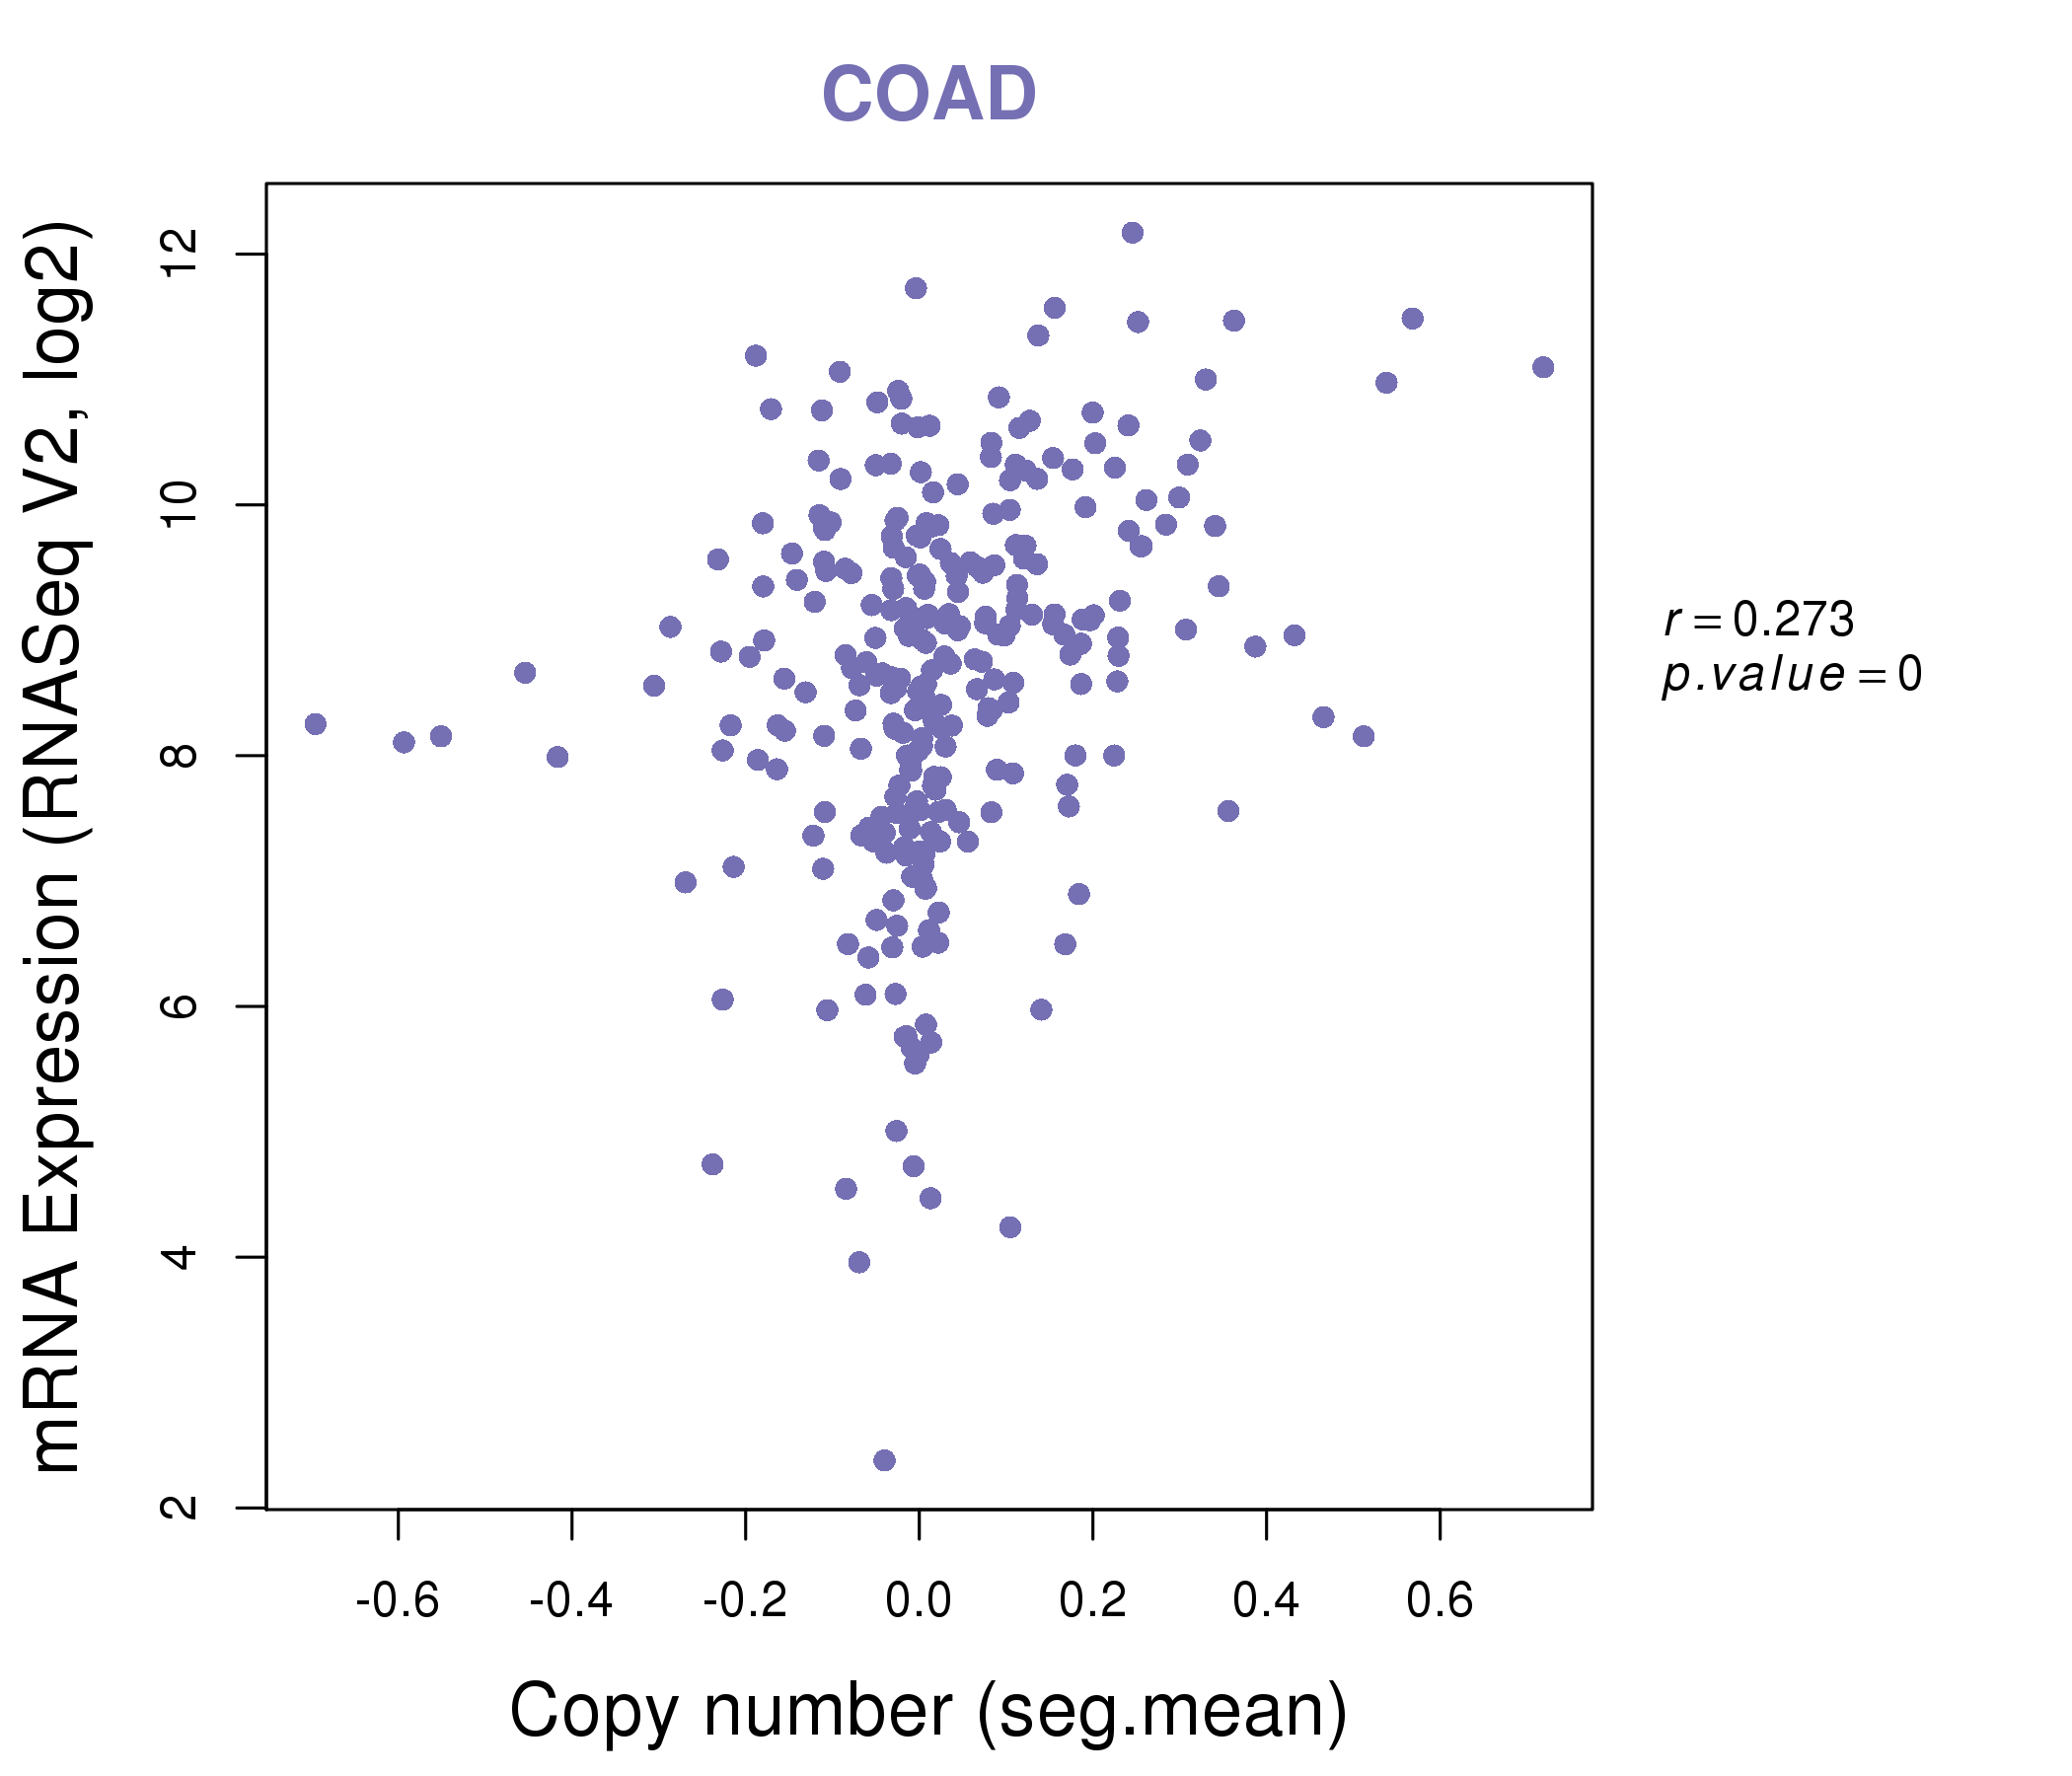
| * Copy number data were extracted from TCGA using R package TCGA-Assembler. The URLs of all public data files on TCGA DCC data server were gathered on Jan-05-2015. Function ProcessCNAData in TCGA-Assembler package was used to obtain gene-level copy number value which is calculated as the average copy number of the genomic region of a gene. |
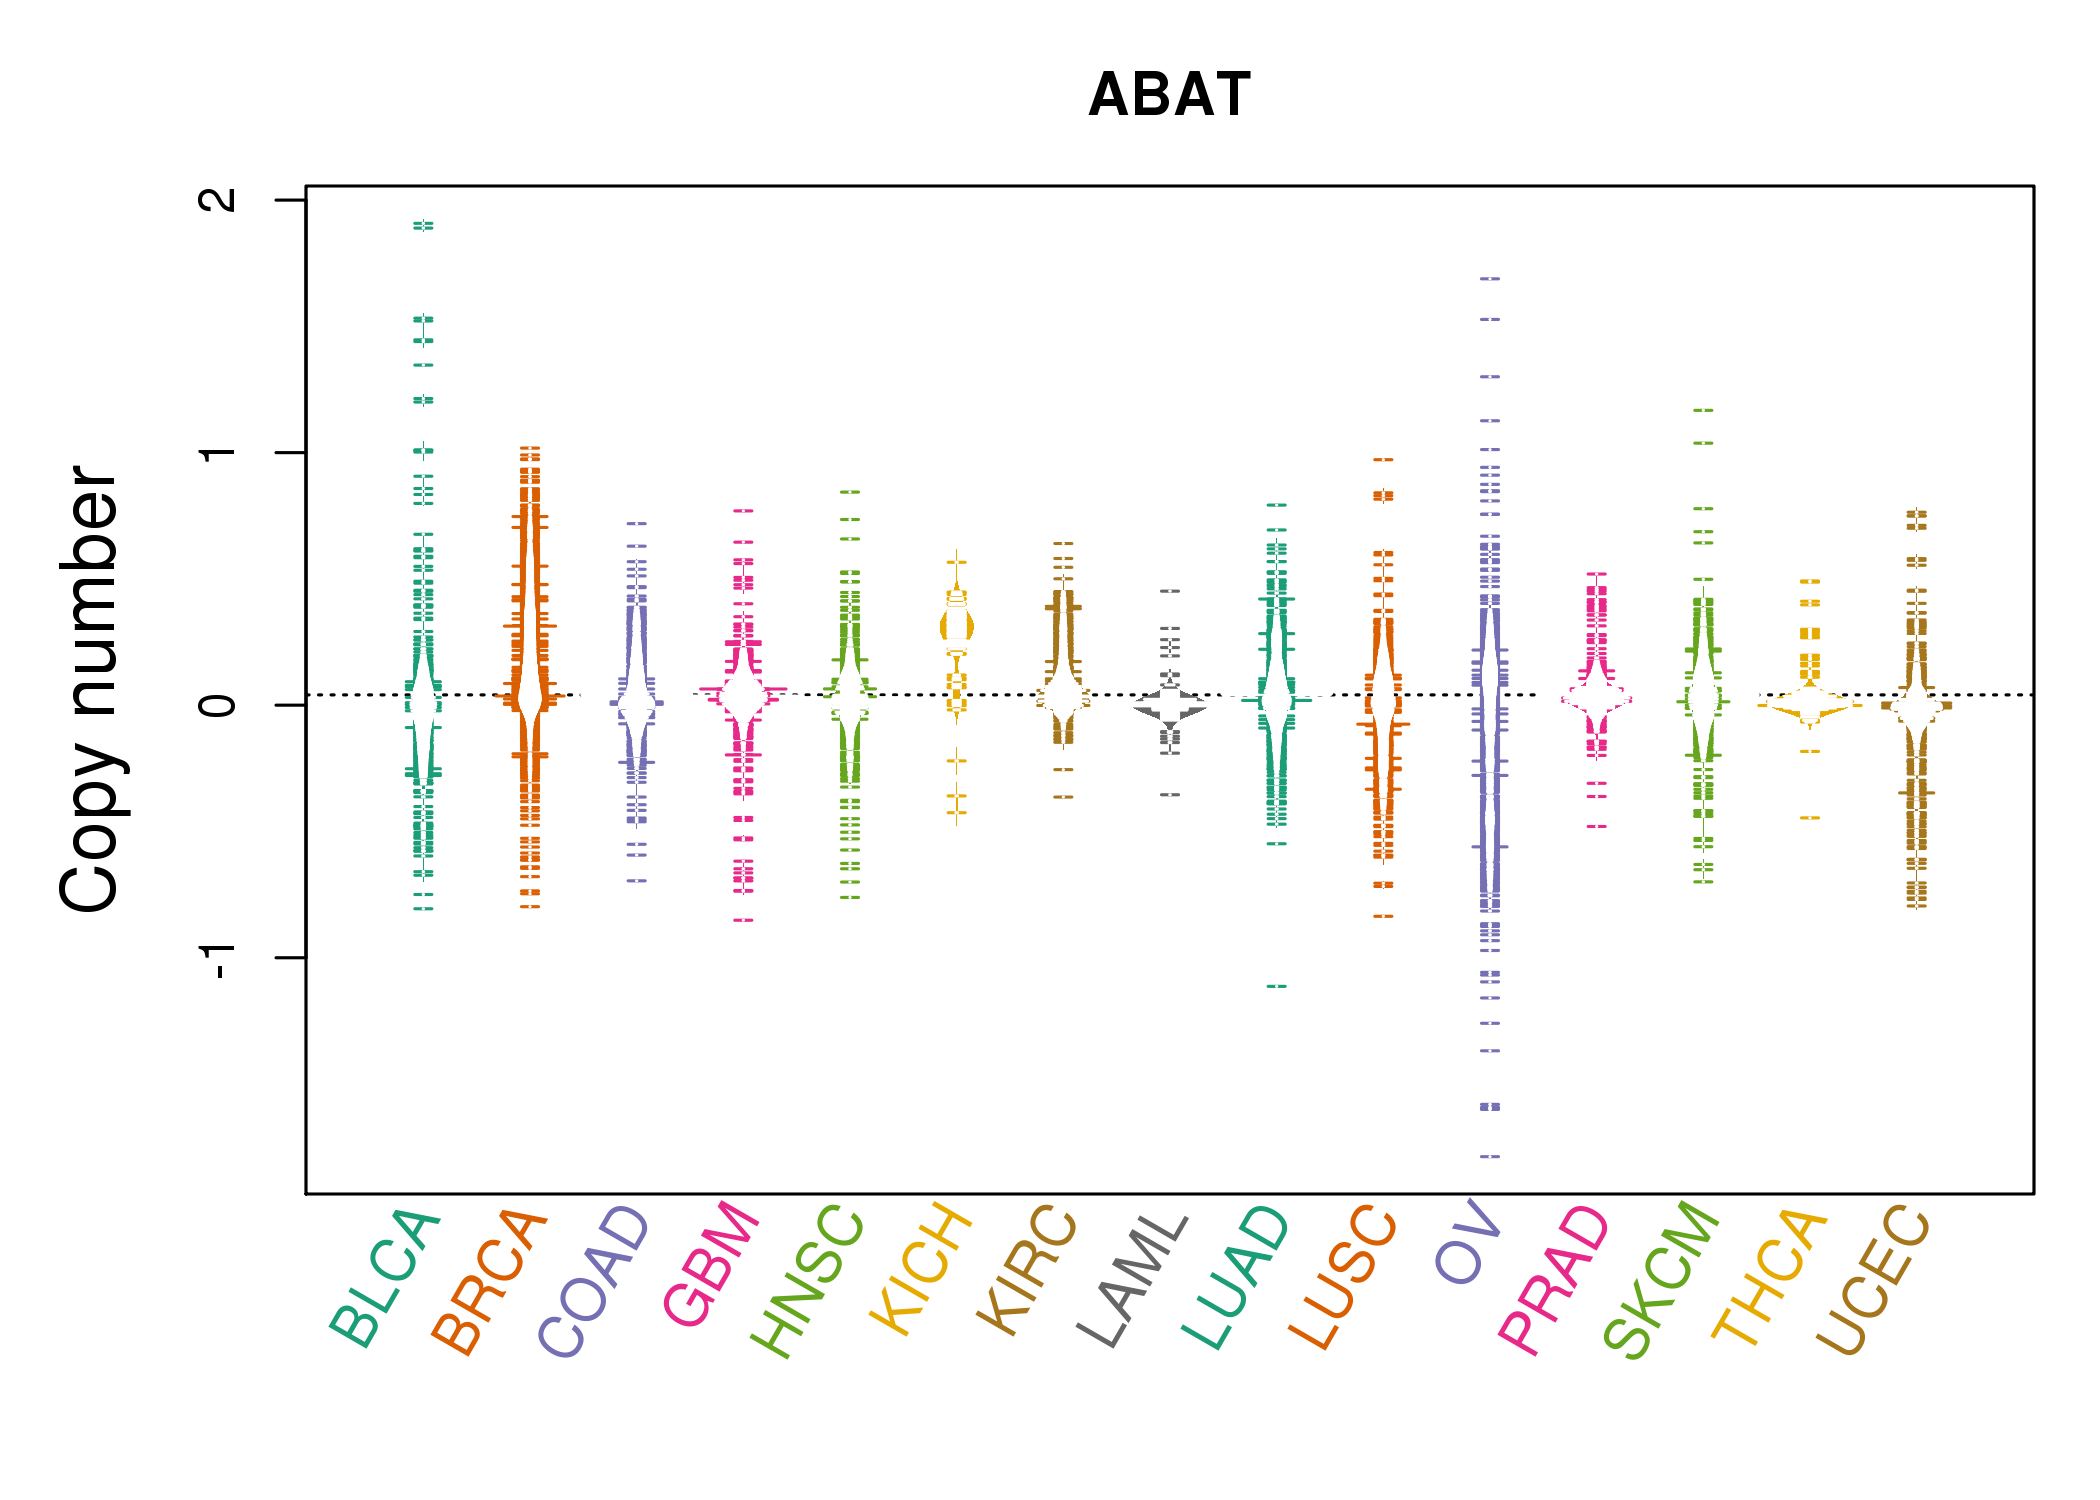 |
| cf) Tissue ID[Tissue type]: BLCA[Bladder Urothelial Carcinoma], BRCA[Breast invasive carcinoma], CESC[Cervical squamous cell carcinoma and endocervical adenocarcinoma], COAD[Colon adenocarcinoma], GBM[Glioblastoma multiforme], Glioma Low Grade, HNSC[Head and Neck squamous cell carcinoma], KICH[Kidney Chromophobe], KIRC[Kidney renal clear cell carcinoma], KIRP[Kidney renal papillary cell carcinoma], LAML[Acute Myeloid Leukemia], LUAD[Lung adenocarcinoma], LUSC[Lung squamous cell carcinoma], OV[Ovarian serous cystadenocarcinoma ], PAAD[Pancreatic adenocarcinoma], PRAD[Prostate adenocarcinoma], SKCM[Skin Cutaneous Melanoma], STAD[Stomach adenocarcinoma], THCA[Thyroid carcinoma], UCEC[Uterine Corpus Endometrial Carcinoma] |
| Top |
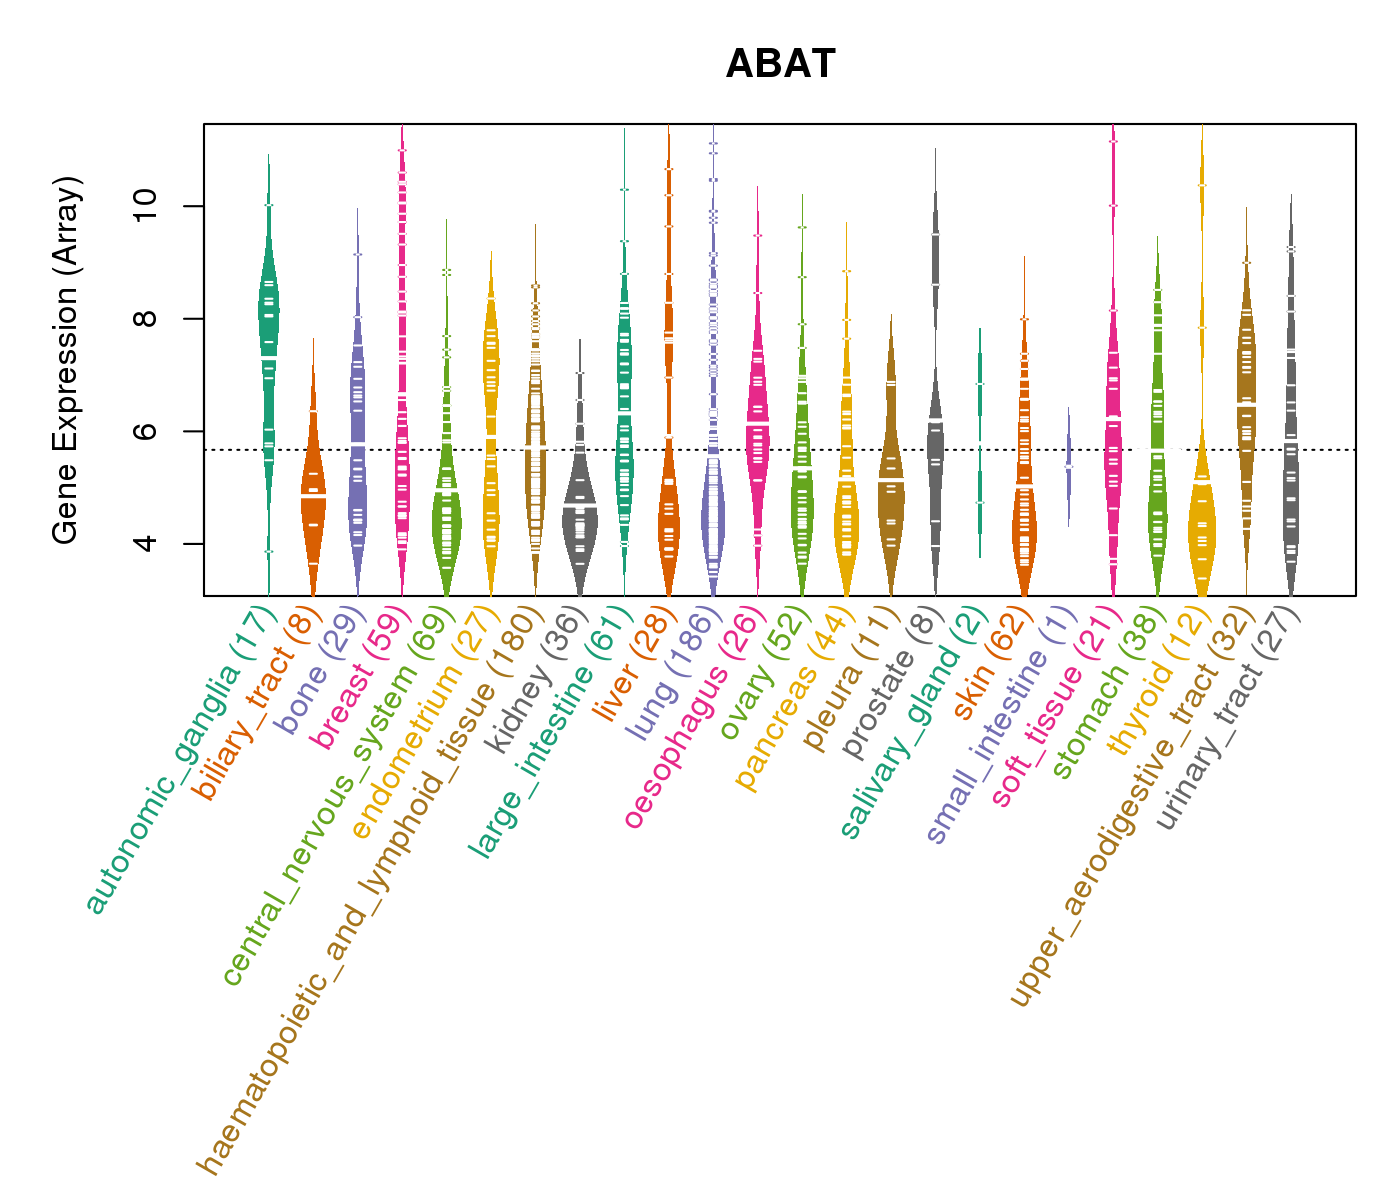
| Gene Expression for ABAT |
| * CCLE gene expression data were extracted from CCLE_Expression_Entrez_2012-10-18.res: Gene-centric RMA-normalized mRNA expression data. |
 |
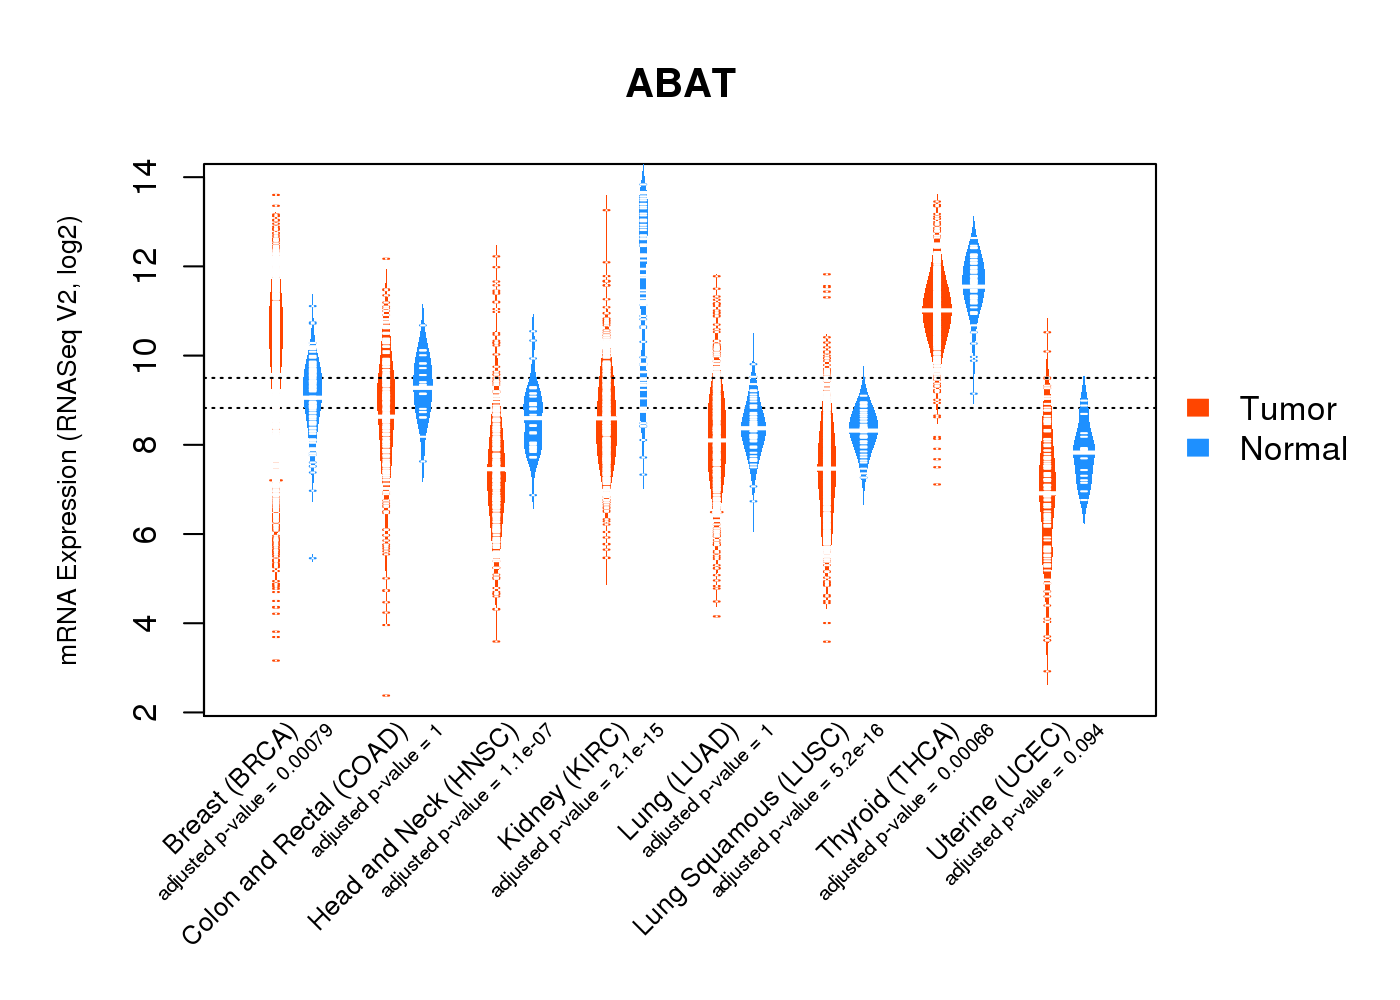
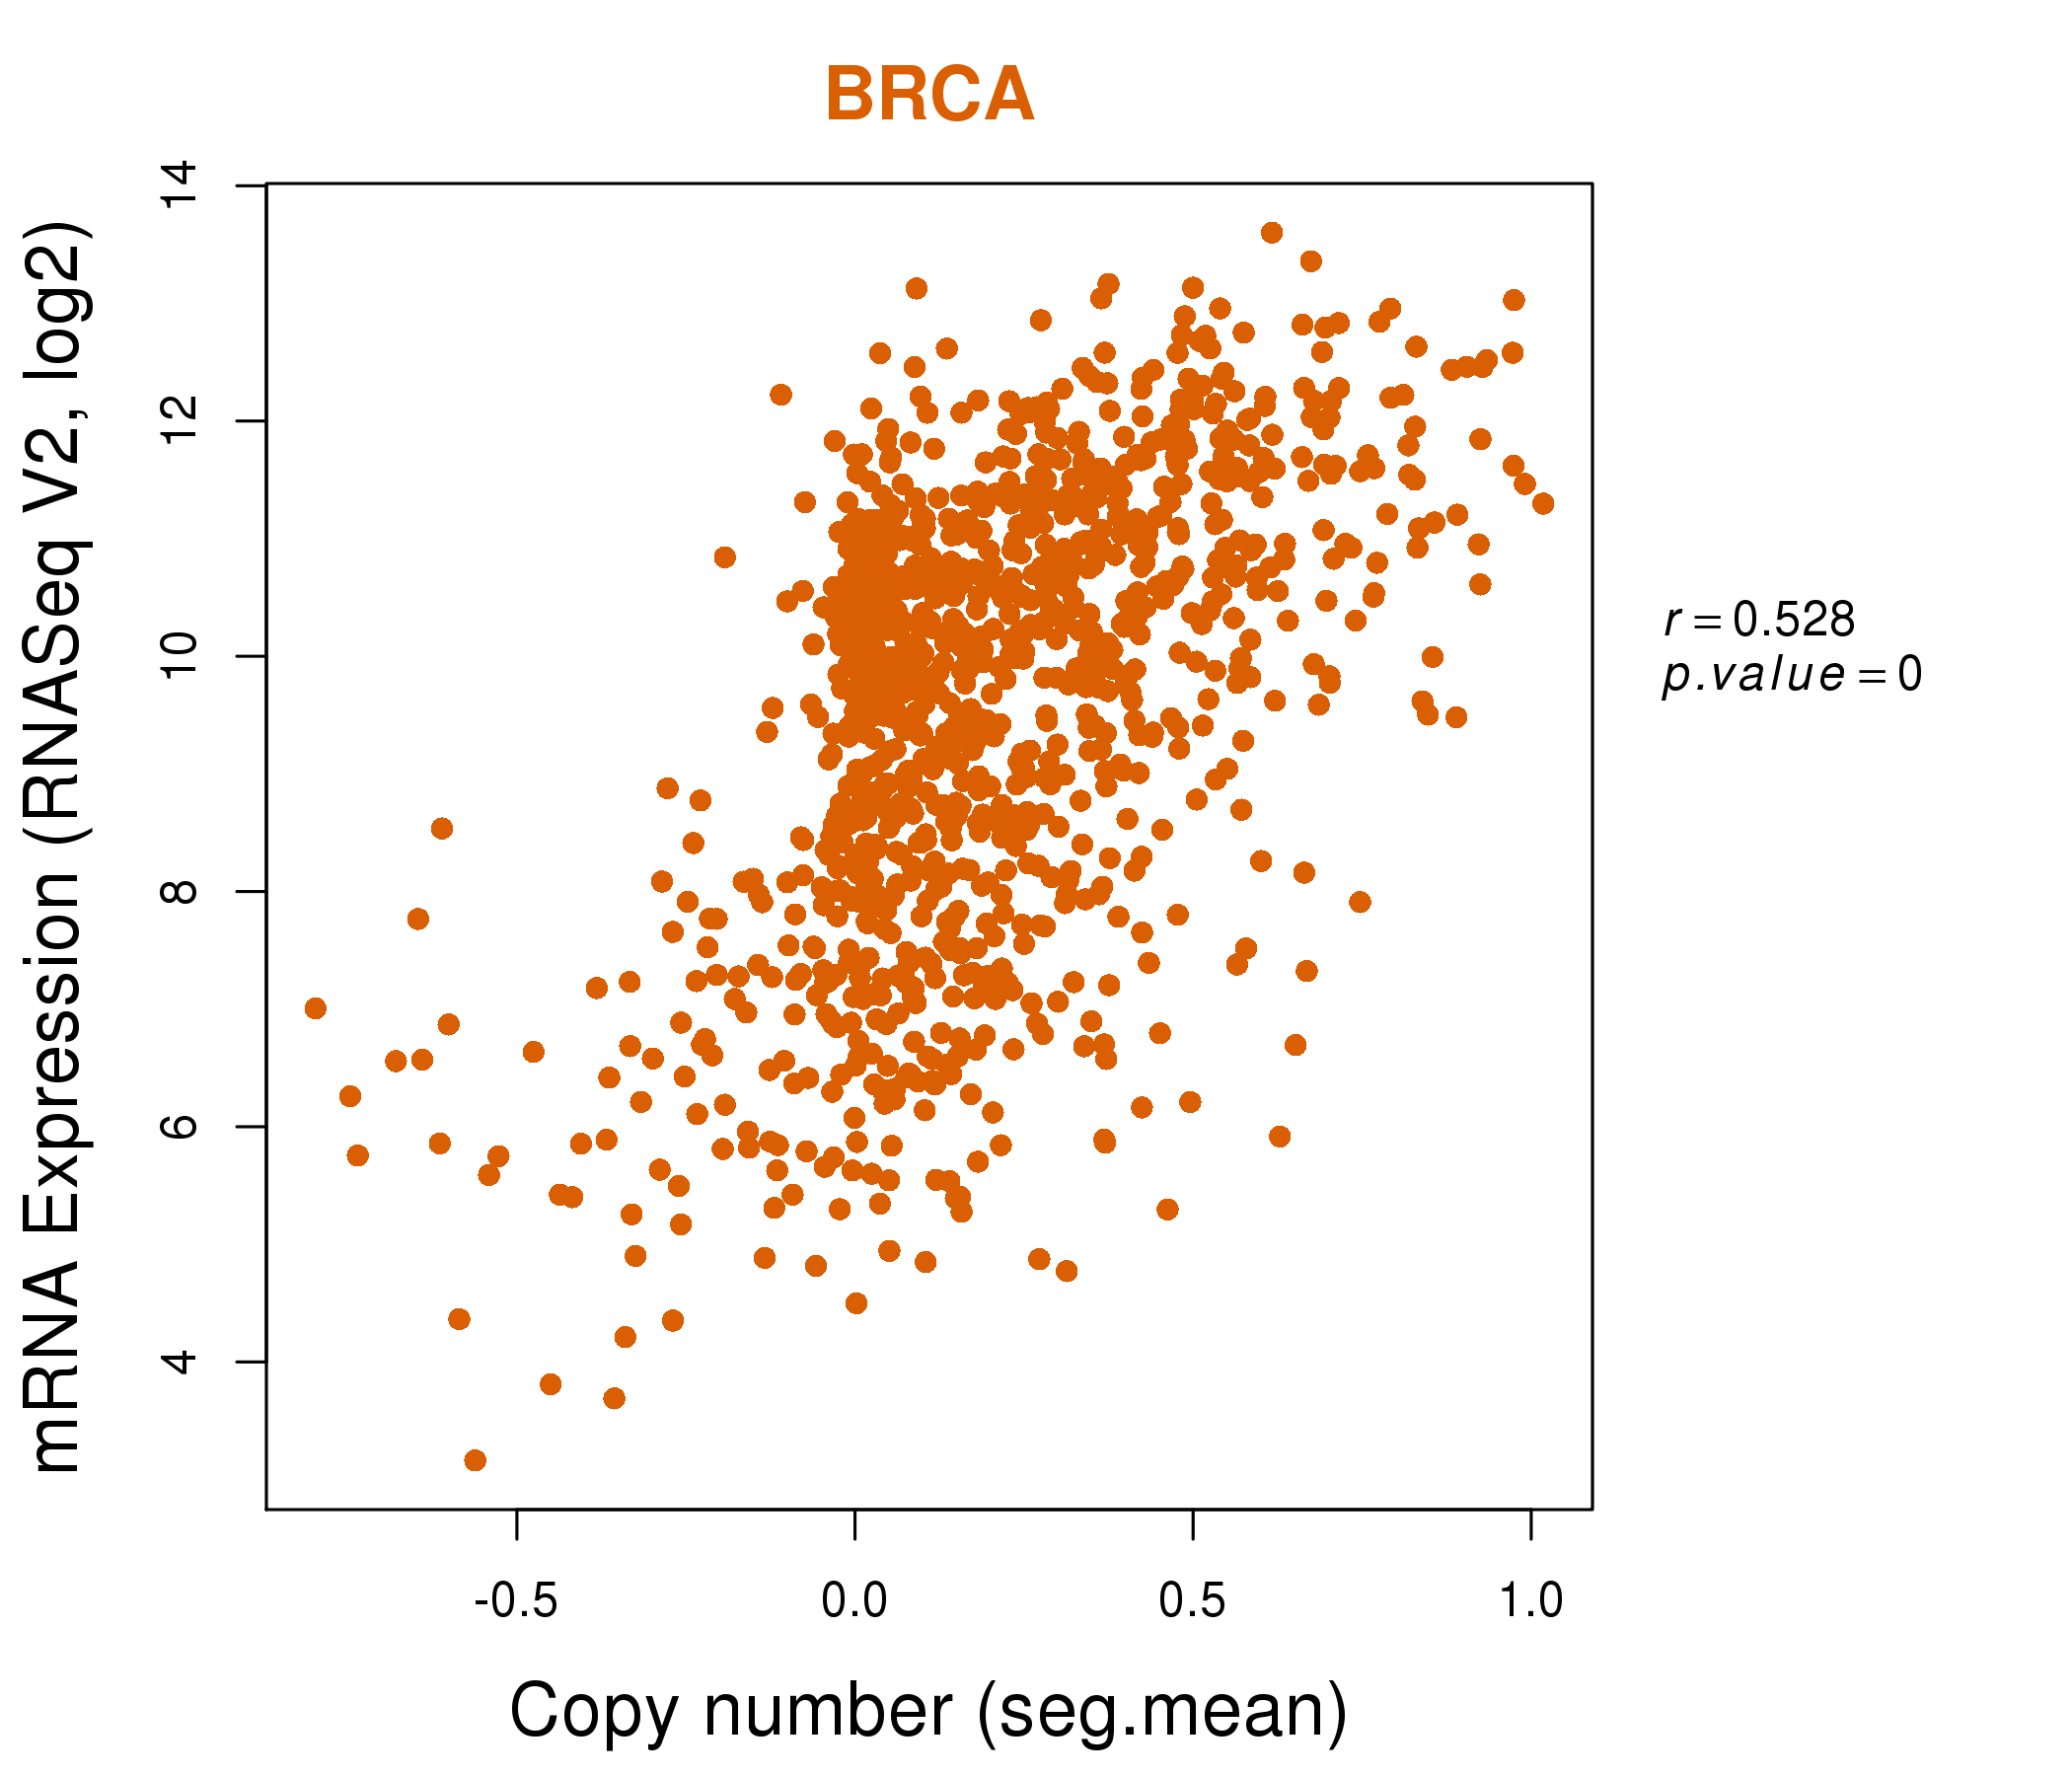
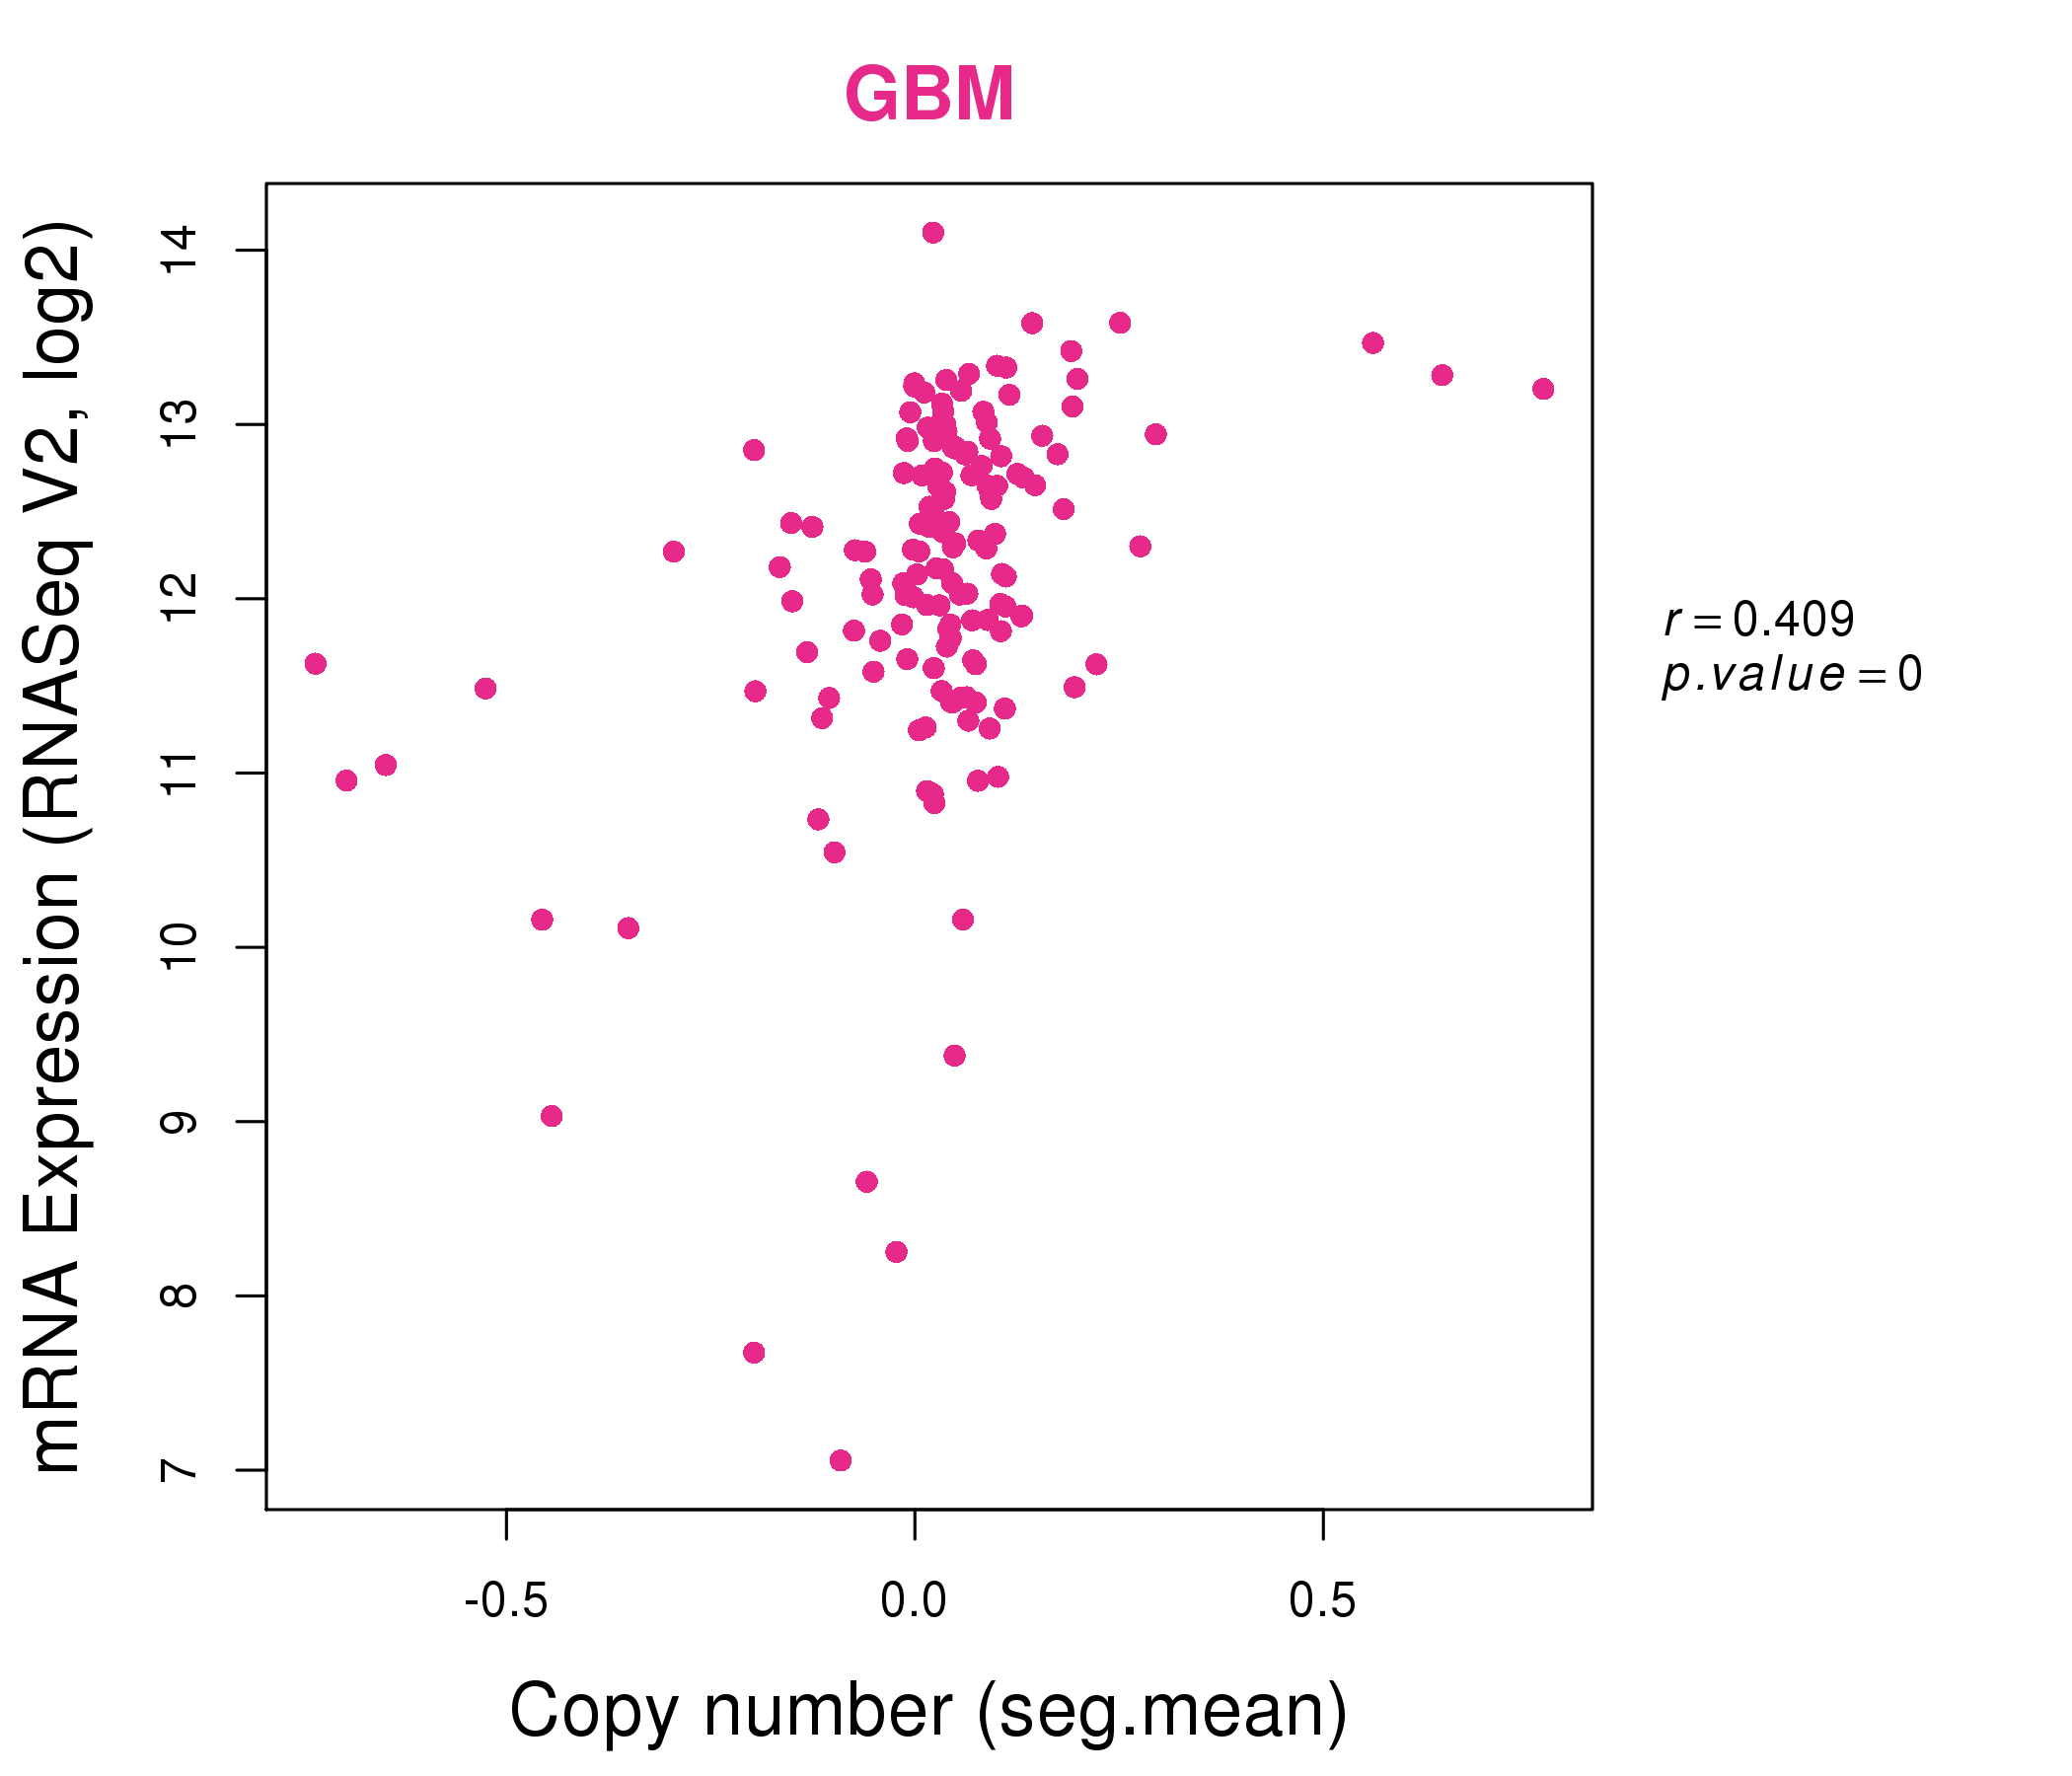
| * Normalized gene expression data of RNASeqV2 was extracted from TCGA using R package TCGA-Assembler. The URLs of all public data files on TCGA DCC data server were gathered at Jan-05-2015. Only eight cancer types have enough normal control samples for differential expression analysis. (t test, adjusted p<0.05 (using Benjamini-Hochberg FDR)) |
 |
| Top |
| * This plots show the correlation between CNV and gene expression. |
: Open all plots for all cancer types
 |
|
 |
|
| Top |
| Gene-Gene Network Information |
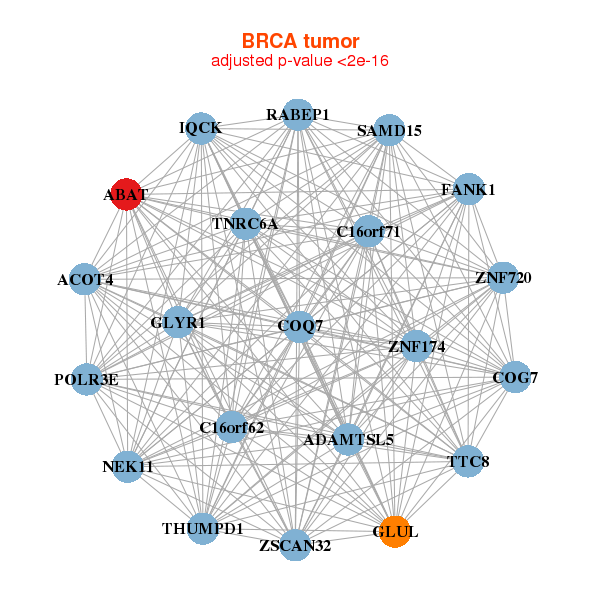
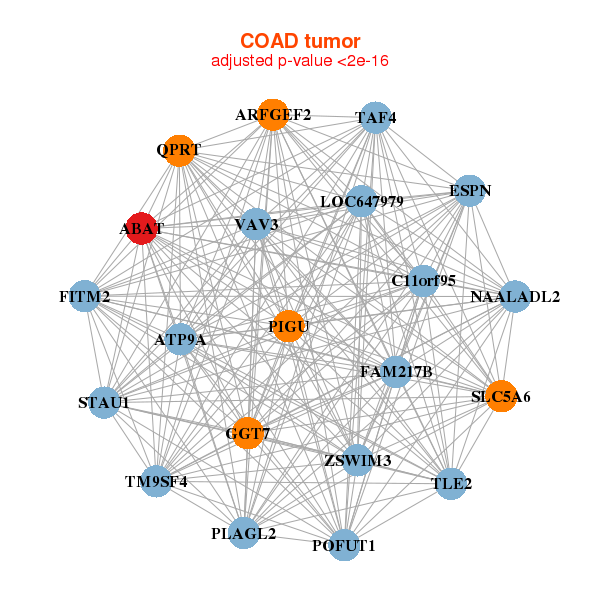
| * Co-Expression network figures were drawn using R package igraph. Only the top 20 genes with the highest correlations were shown. Red circle: input gene, orange circle: cell metabolism gene, sky circle: other gene |
: Open all plots for all cancer types
 |
| ||||
| ABAT,ACOT4,ADAMTSL5,SAMD15,C16orf62,C16orf71,COG7, COQ7,FANK1,GLUL,GLYR1,IQCK,NEK11,POLR3E, RABEP1,THUMPD1,TNRC6A,TTC8,ZNF174,ZSCAN32,ZNF720 | ABAT,ARSD,SAMD15,CELSR1,CELSR2,CORO2A,CT62, DNAJC22,FOXA1,GALNT7,GOLM1,C5AR2,GREB1,HN1L, ITIH6,MLPH,PKIB,SEC16A,SPATA17,TPBG,XBP1 | ||||
 |
| ||||
| ABAT,ARFGEF2,ATP9A,C11orf95,FAM217B,ESPN,FITM2, GGT7,LOC647979,NAALADL2,PIGU,PLAGL2,POFUT1,QPRT, SLC5A6,STAU1,TAF4,TLE2,TM9SF4,VAV3,ZSWIM3 | ABAT,ACO2,ACSL5,AGPAT3,ANKS4B,CNTFR,DHRS11, ERBB2,FAM73B,FMO4,GDPD2,HADHA,KCNK5,LPCAT3, MAN1A1,MARCH8,NGEF,PBLD,PNPLA1,SCAMP5,SNX24 |

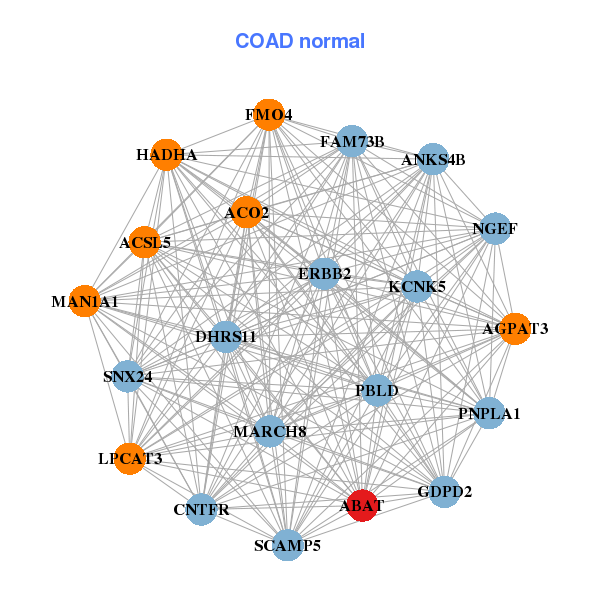
| * Co-Expression network figures were drawn using R package igraph. Only the top 20 genes with the highest correlations were shown. Red circle: input gene, orange circle: cell metabolism gene, sky circle: other gene |
: Open all plots for all cancer types
| Top |
: Open all interacting genes' information including KEGG pathway for all interacting genes from DAVID
| Top |
| Pharmacological Information for ABAT |
| DB Category | DB Name | DB's ID and Url link |
| * Gene Centered Interaction Network. |
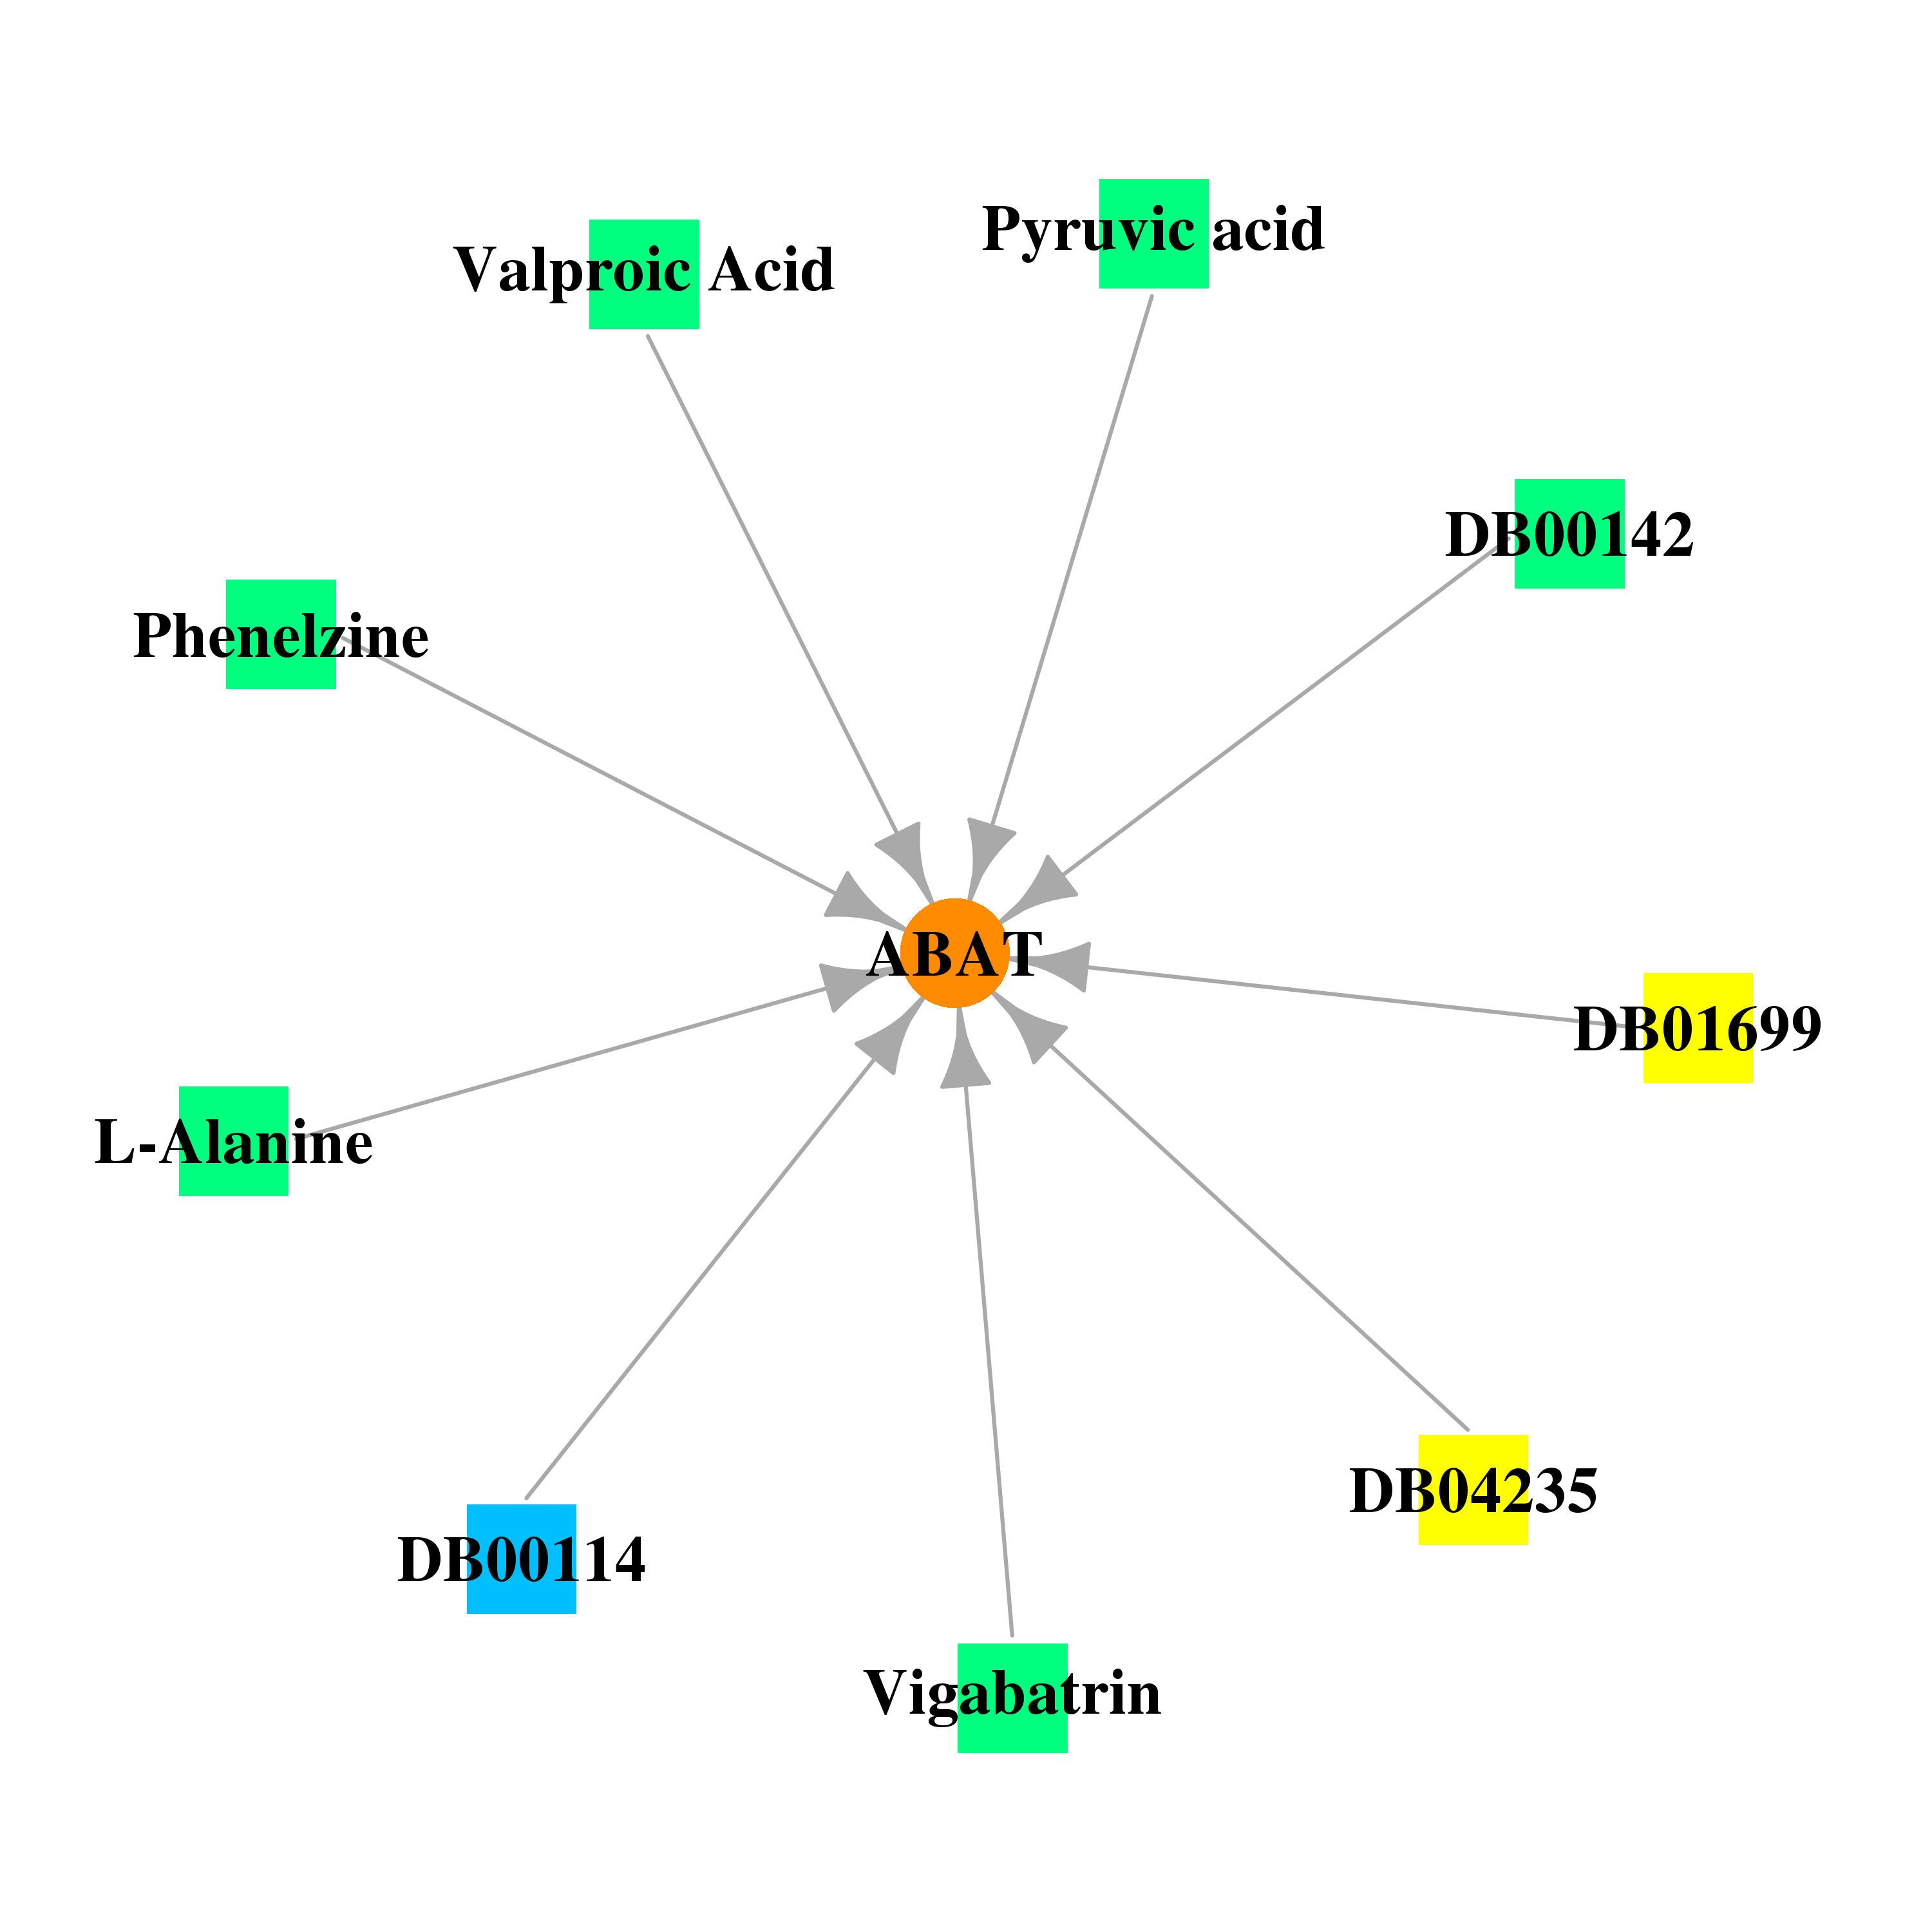 |
| * Drug Centered Interaction Network. |
| DrugBank ID | Target Name | Drug Groups | Generic Name | Drug Centered Network | Drug Structure |
| DB00114 | 4-aminobutyrate aminotransferase | nutraceutical | Pyridoxal Phosphate |  |  |
| DB00119 | 4-aminobutyrate aminotransferase | approved; nutraceutical | Pyruvic acid | 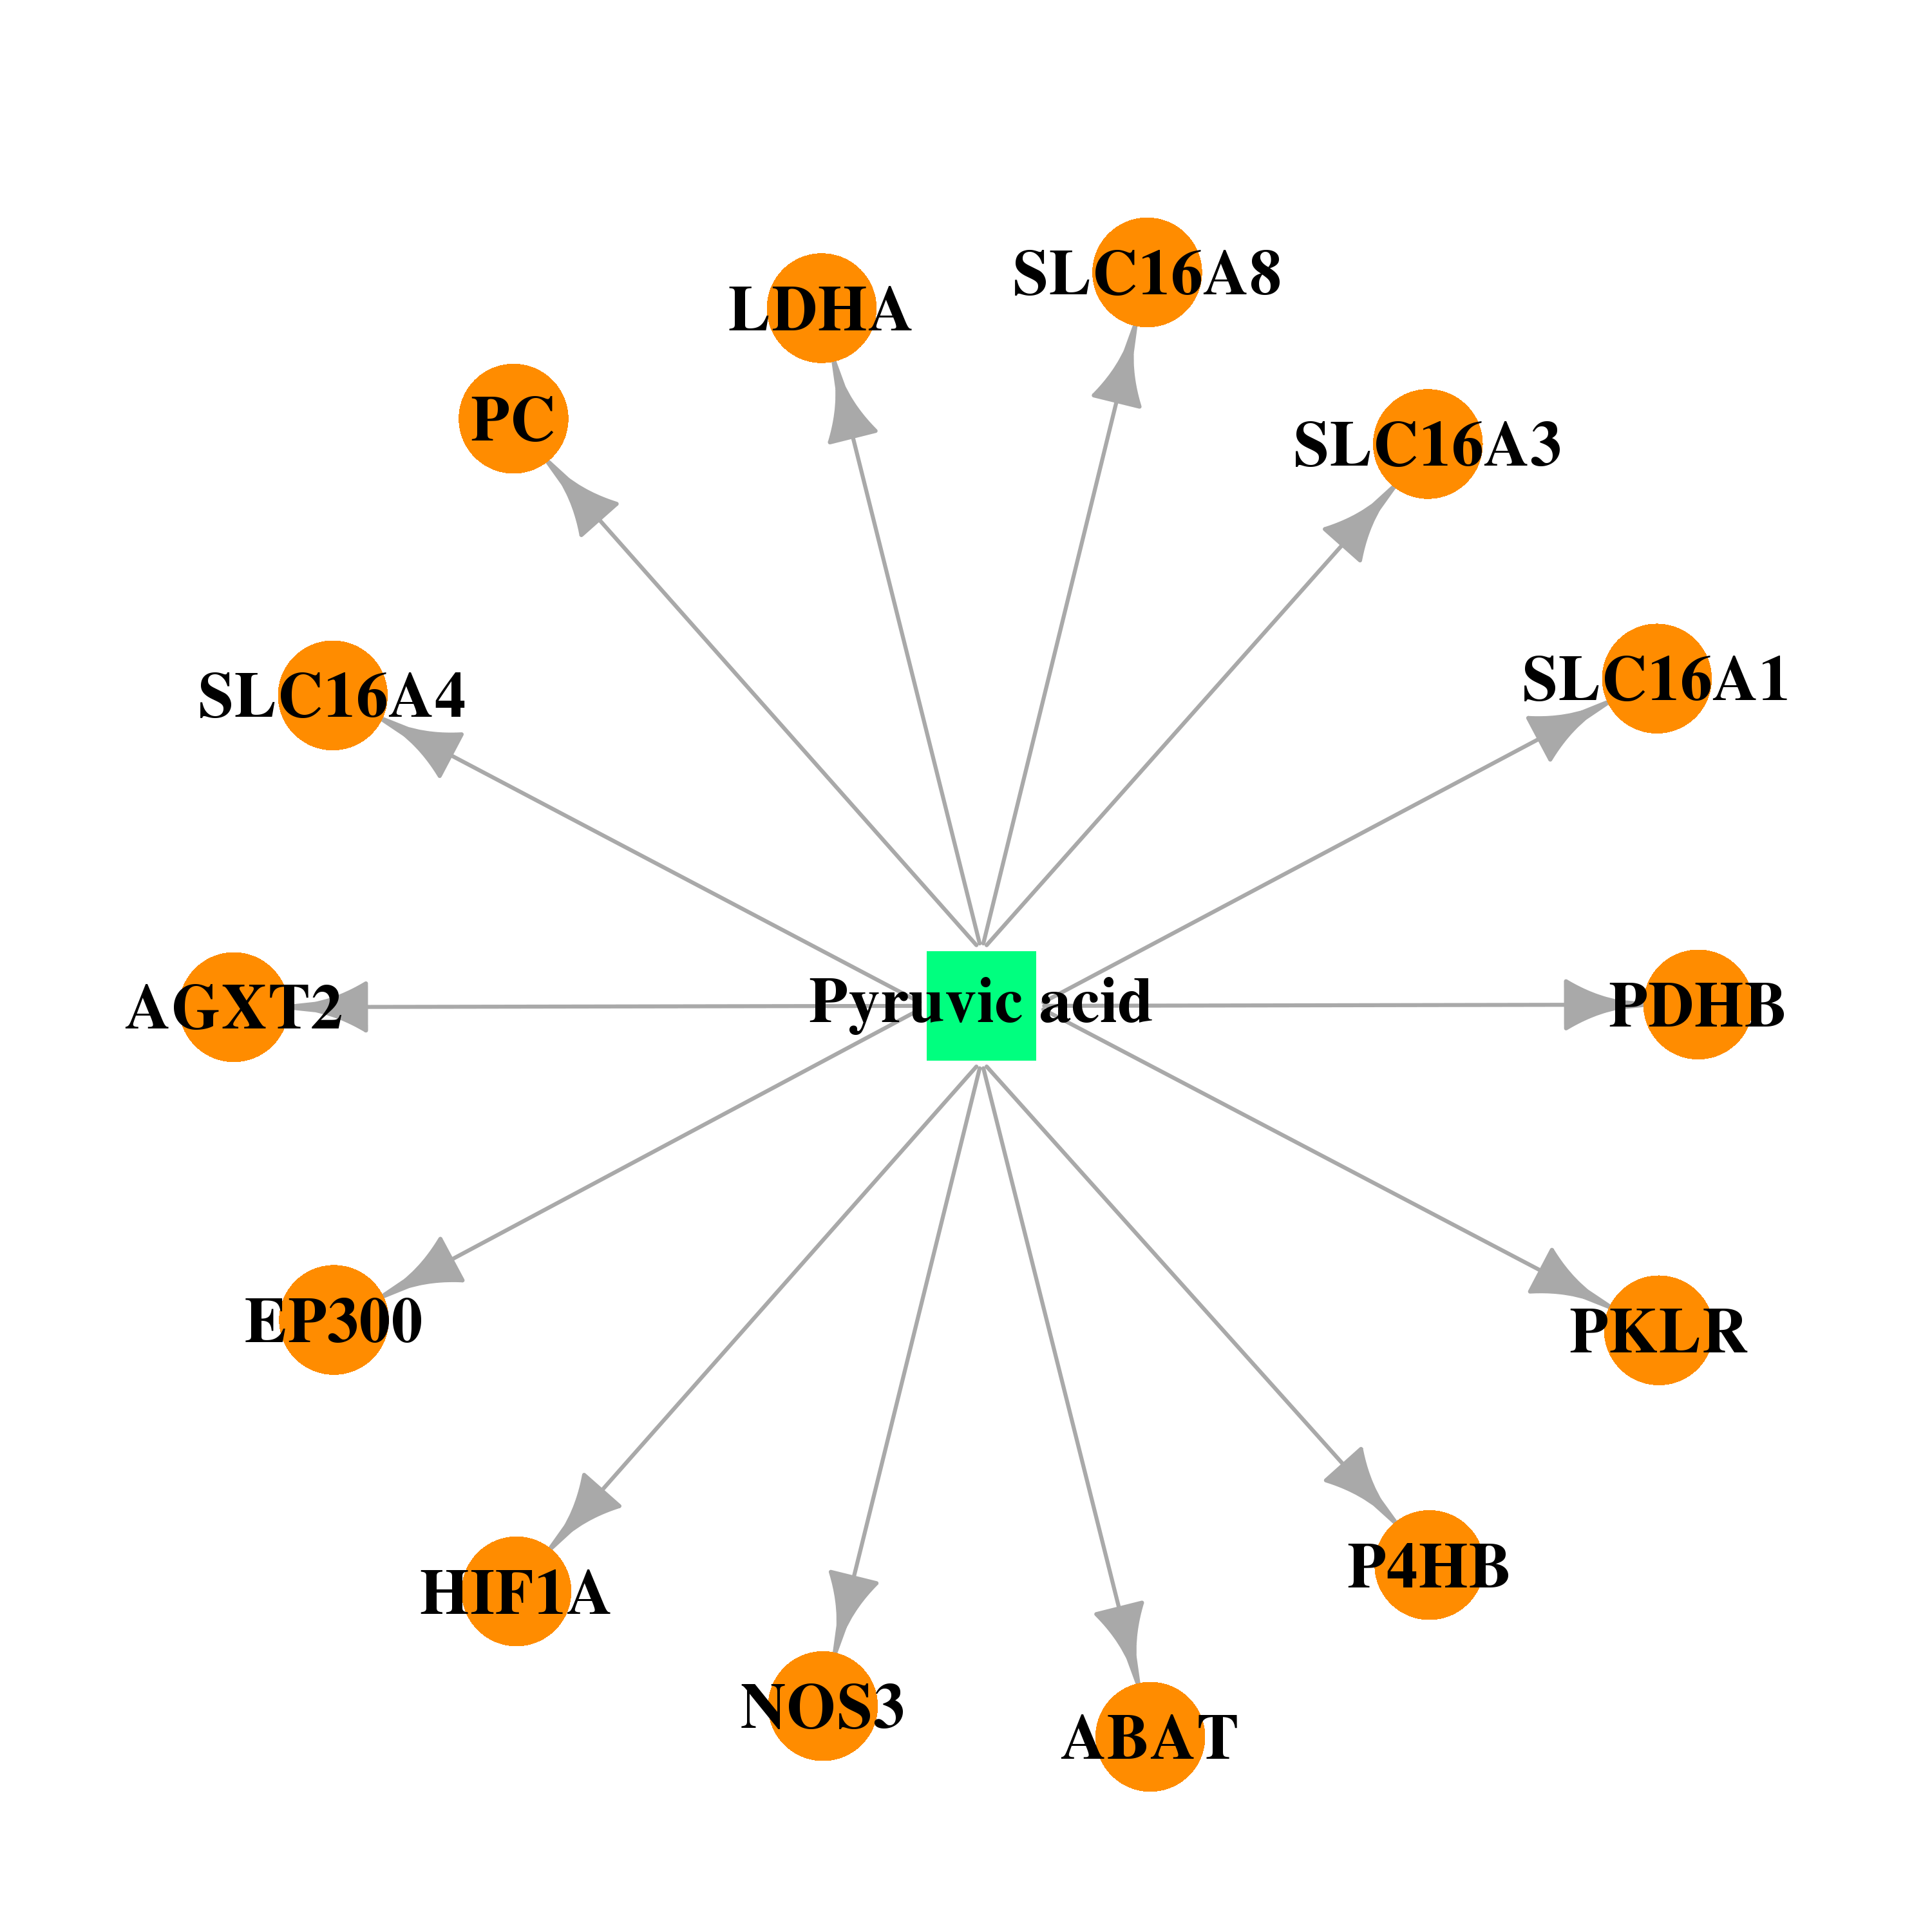 | 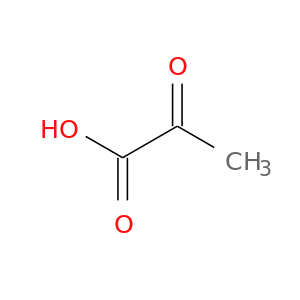 |
| DB00142 | 4-aminobutyrate aminotransferase | approved; nutraceutical | L-Glutamic Acid | 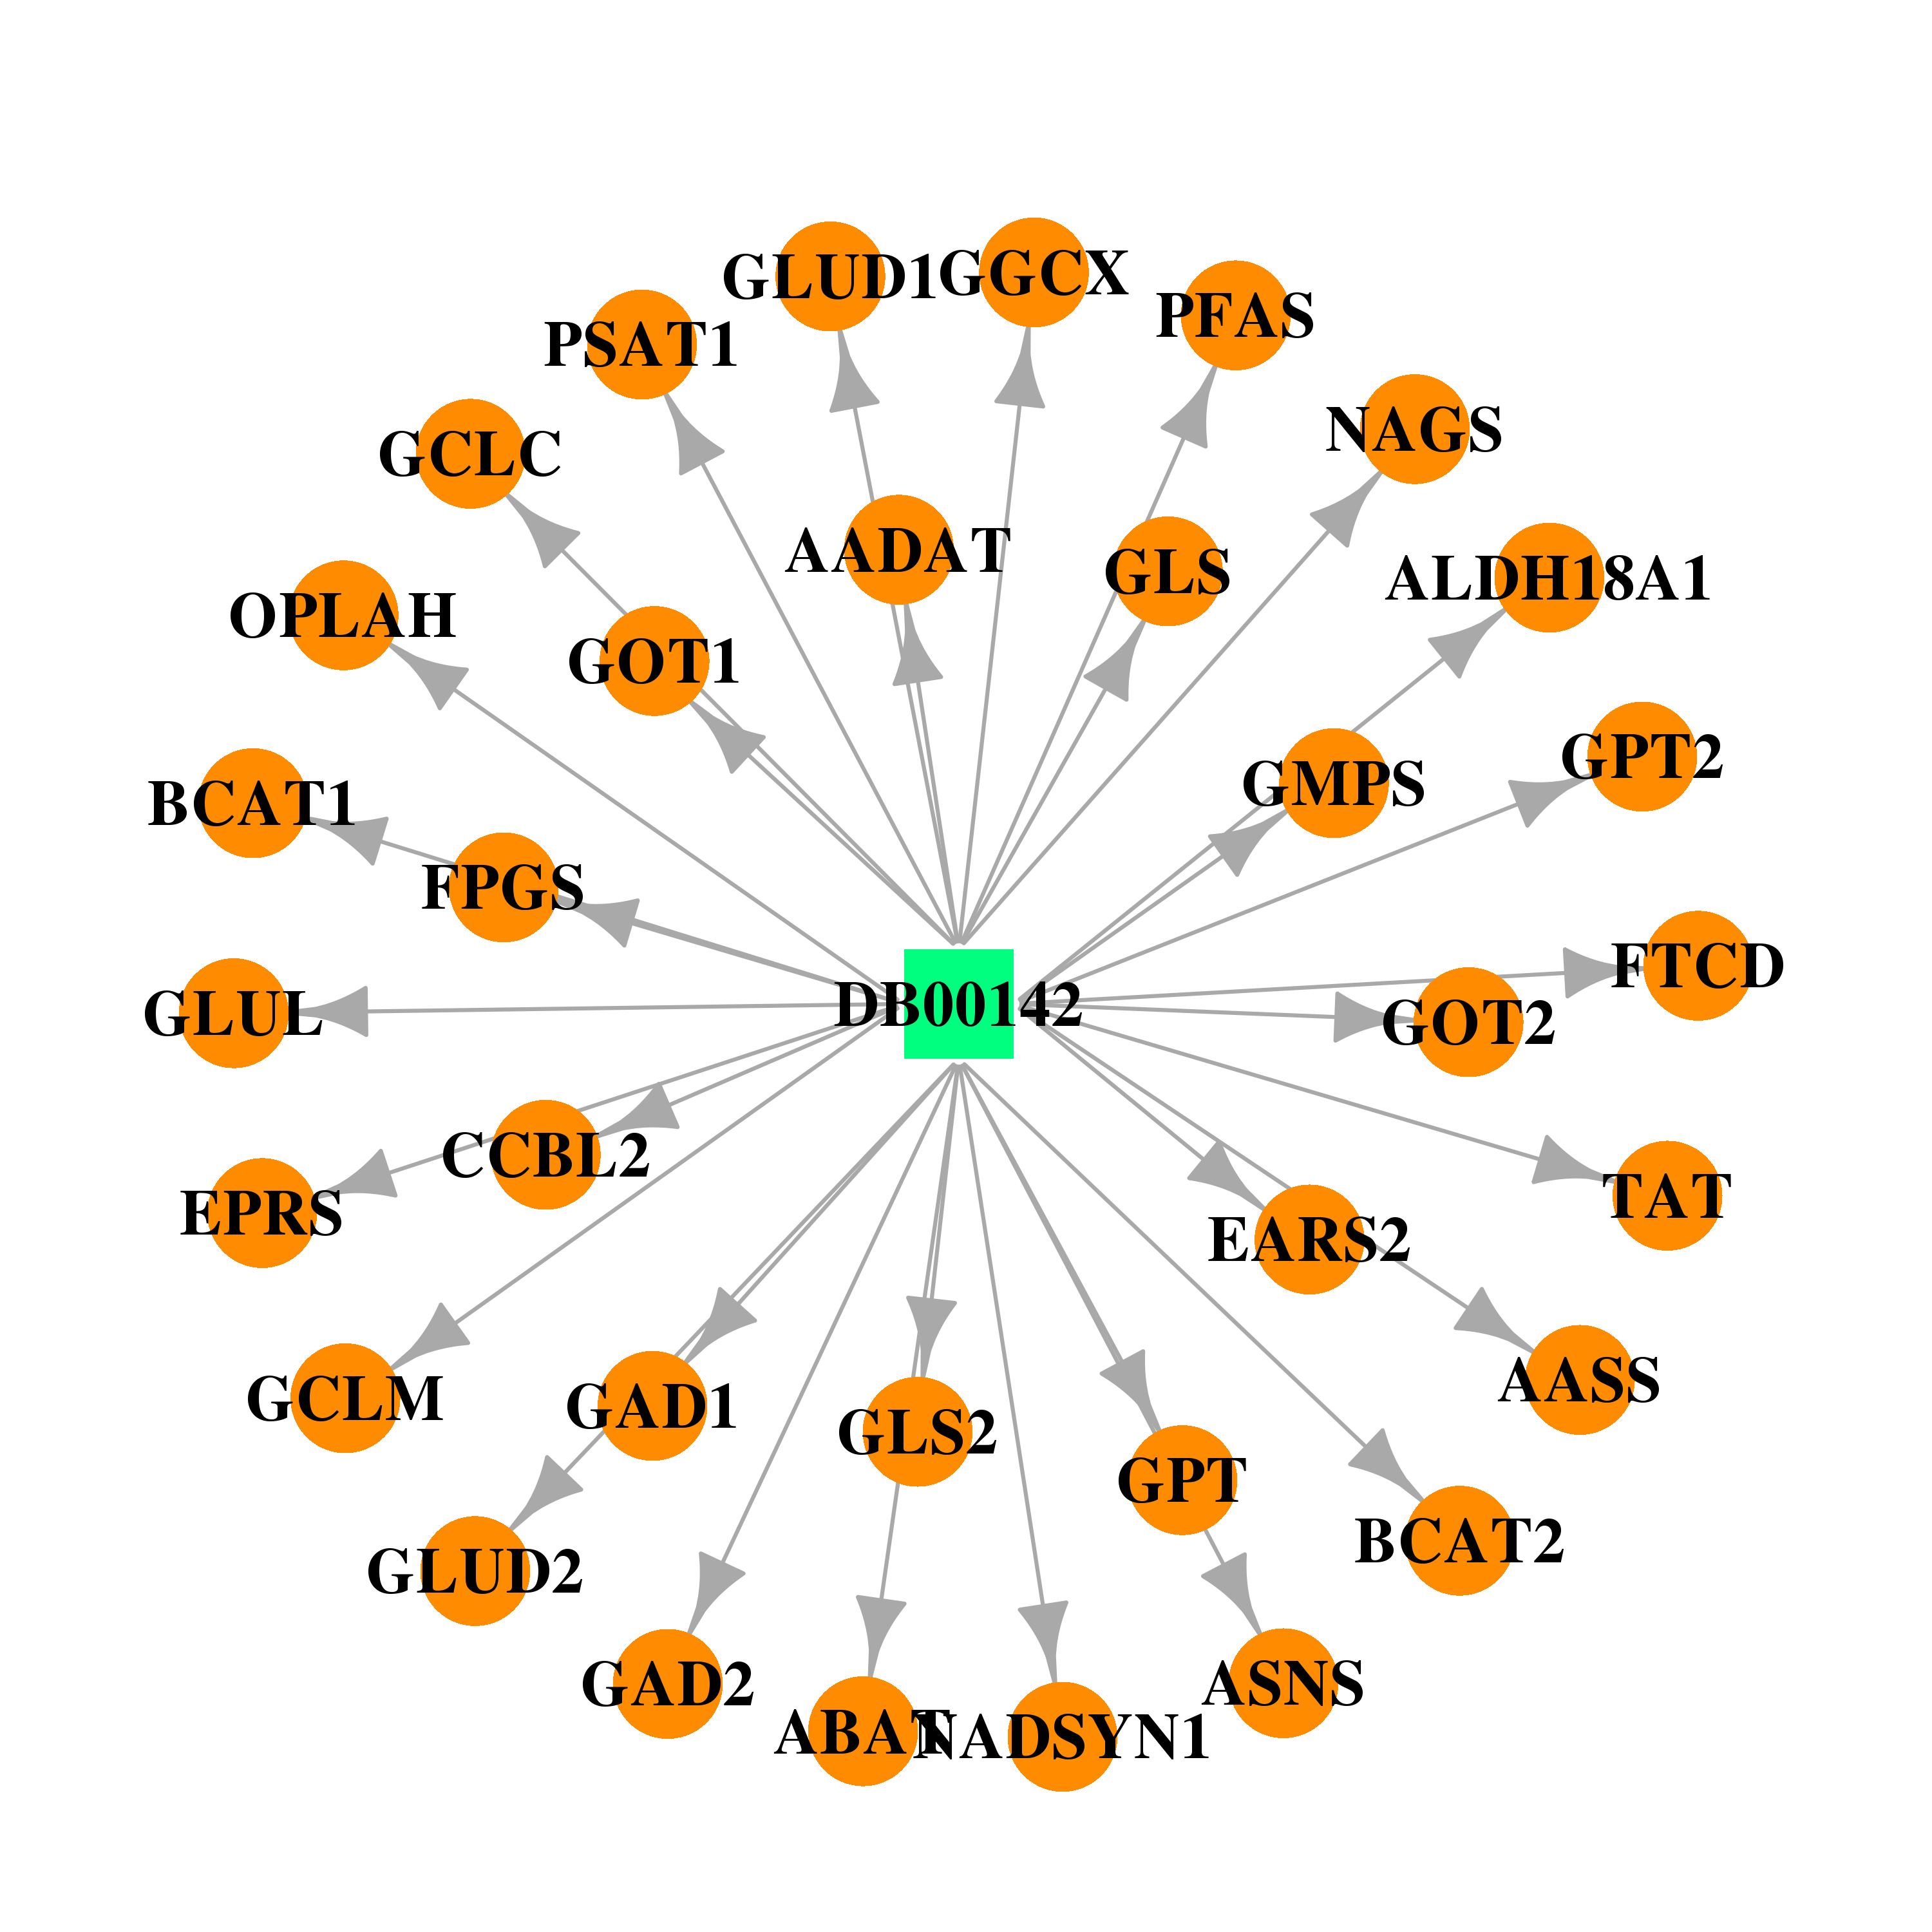 | 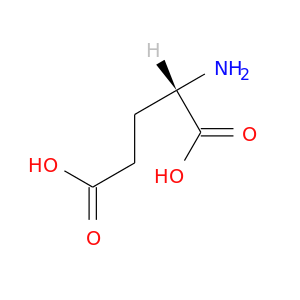 |
| DB00160 | 4-aminobutyrate aminotransferase | approved; nutraceutical | L-Alanine |  | 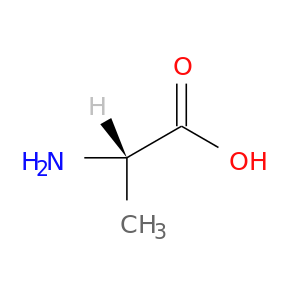 |
| DB00313 | 4-aminobutyrate aminotransferase | approved; investigational | Valproic Acid | 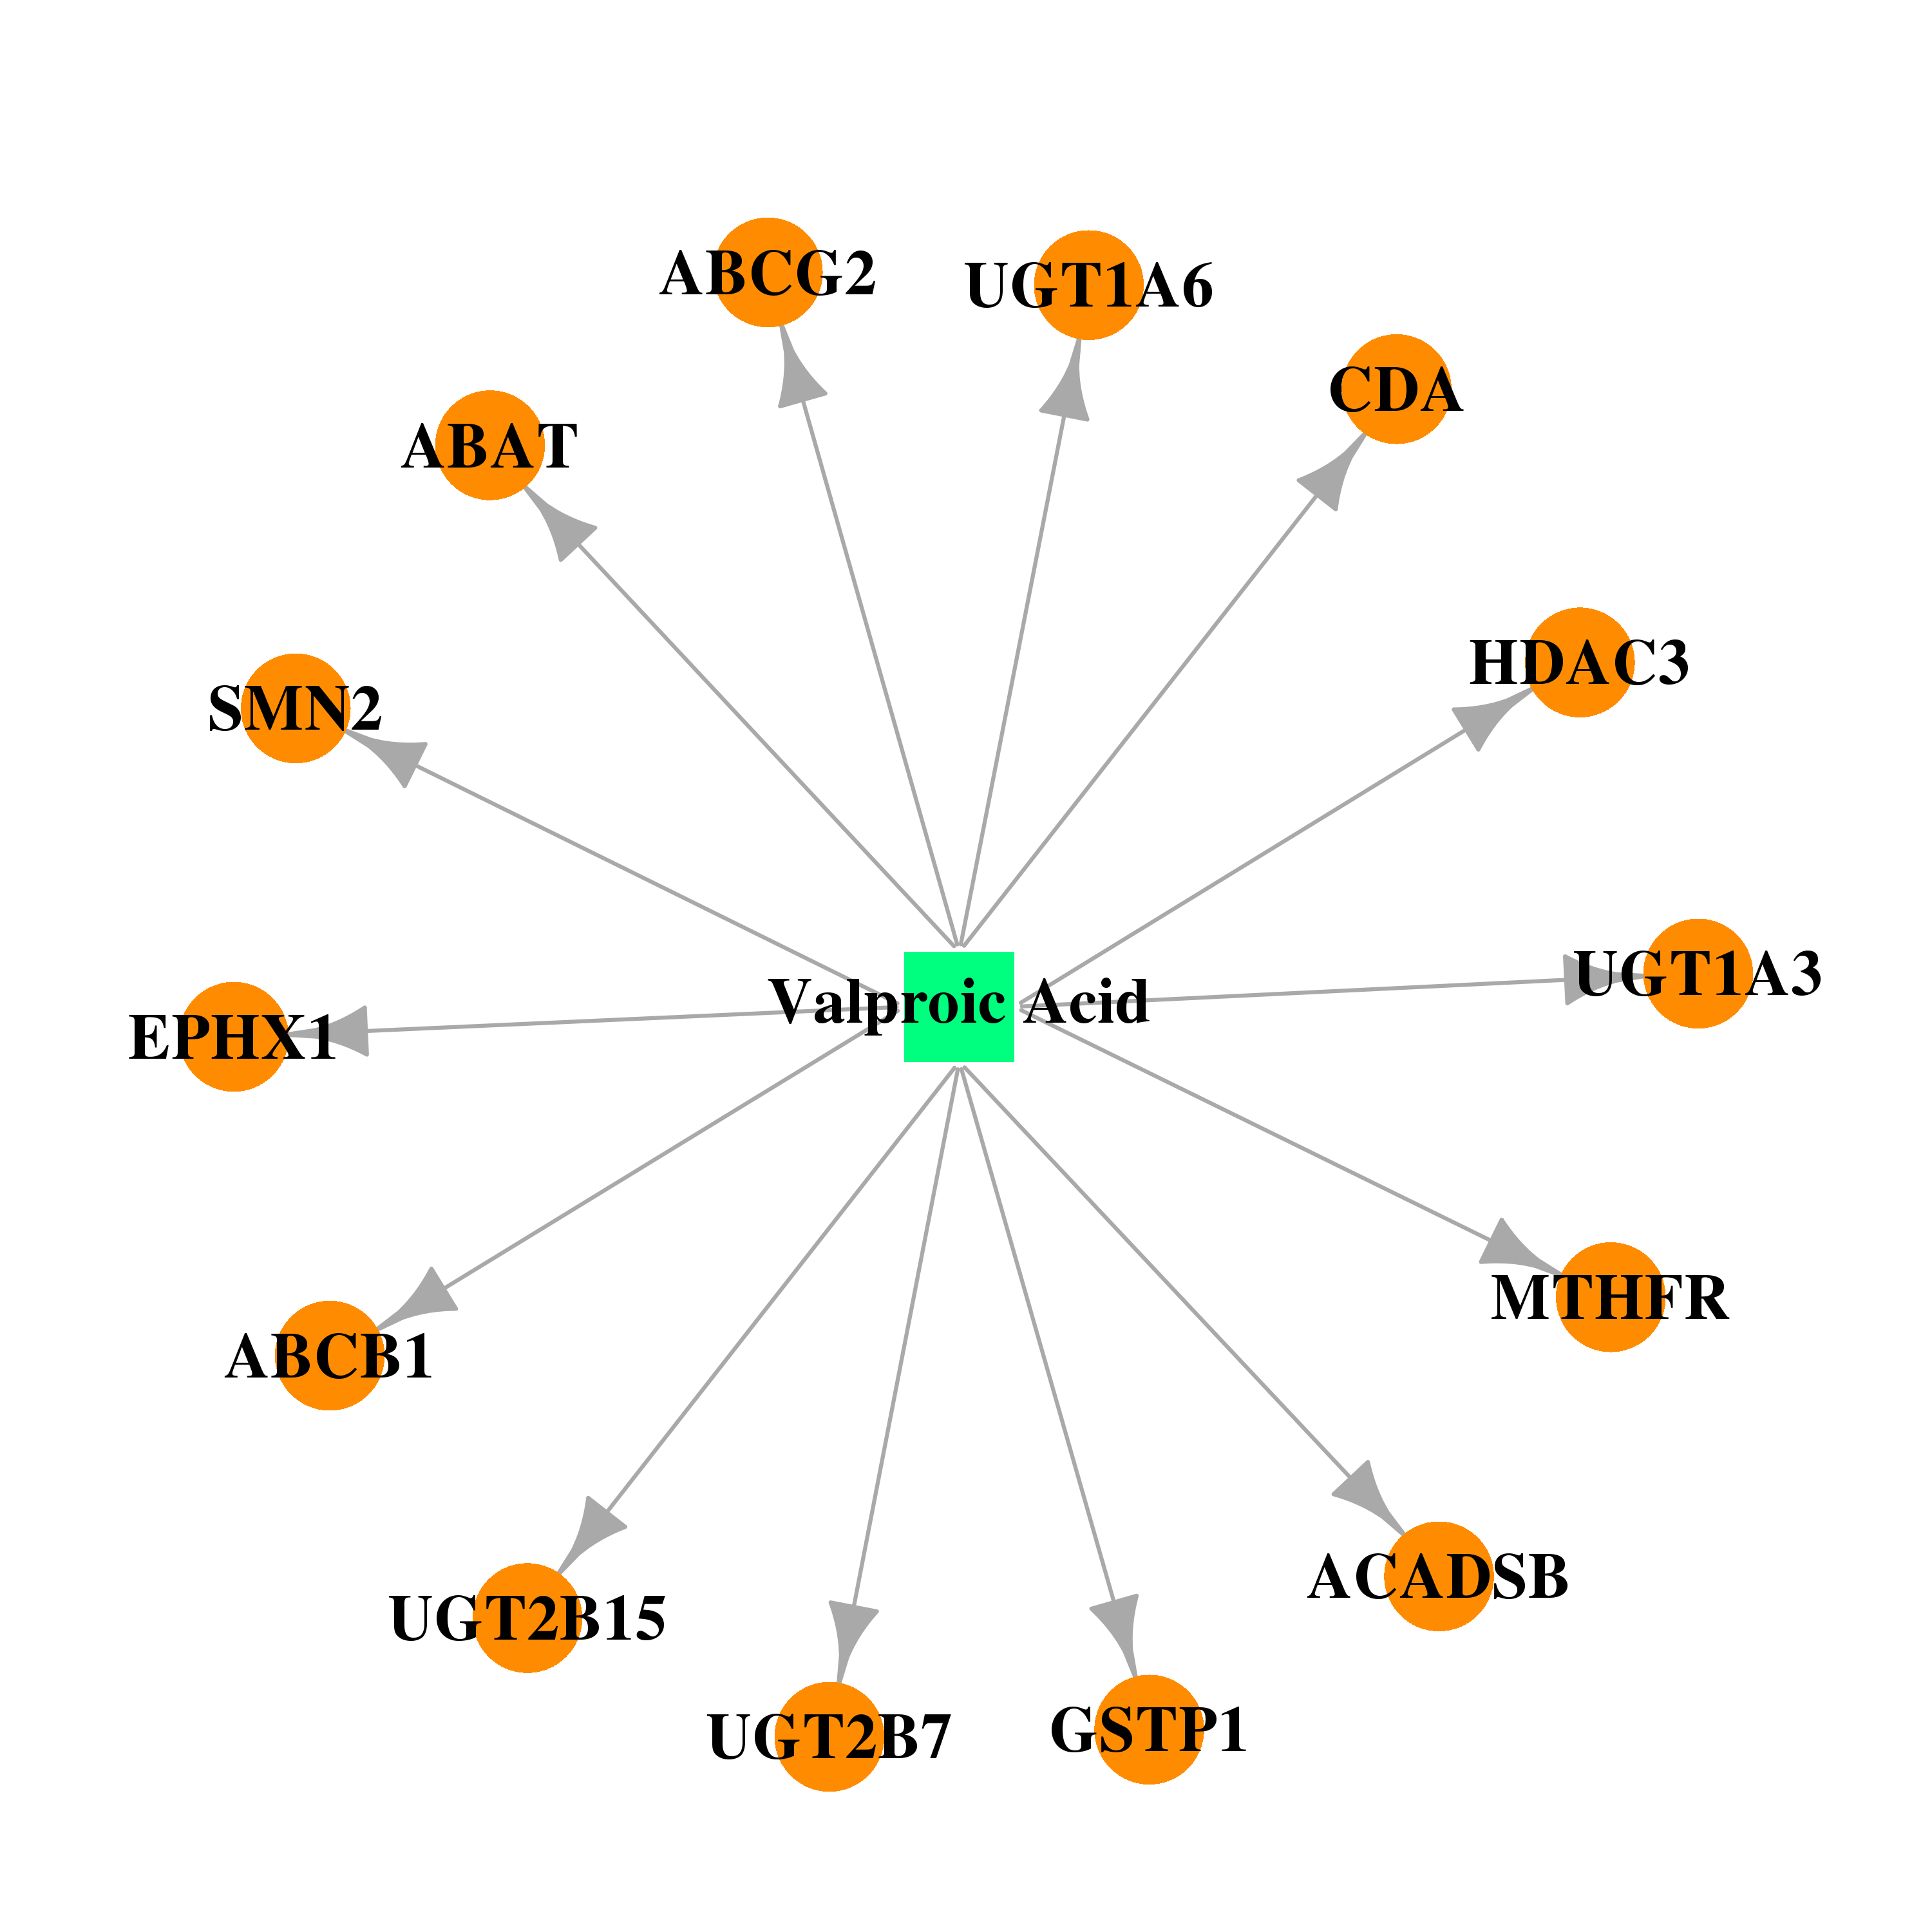 |  |
| DB00780 | 4-aminobutyrate aminotransferase | approved | Phenelzine | 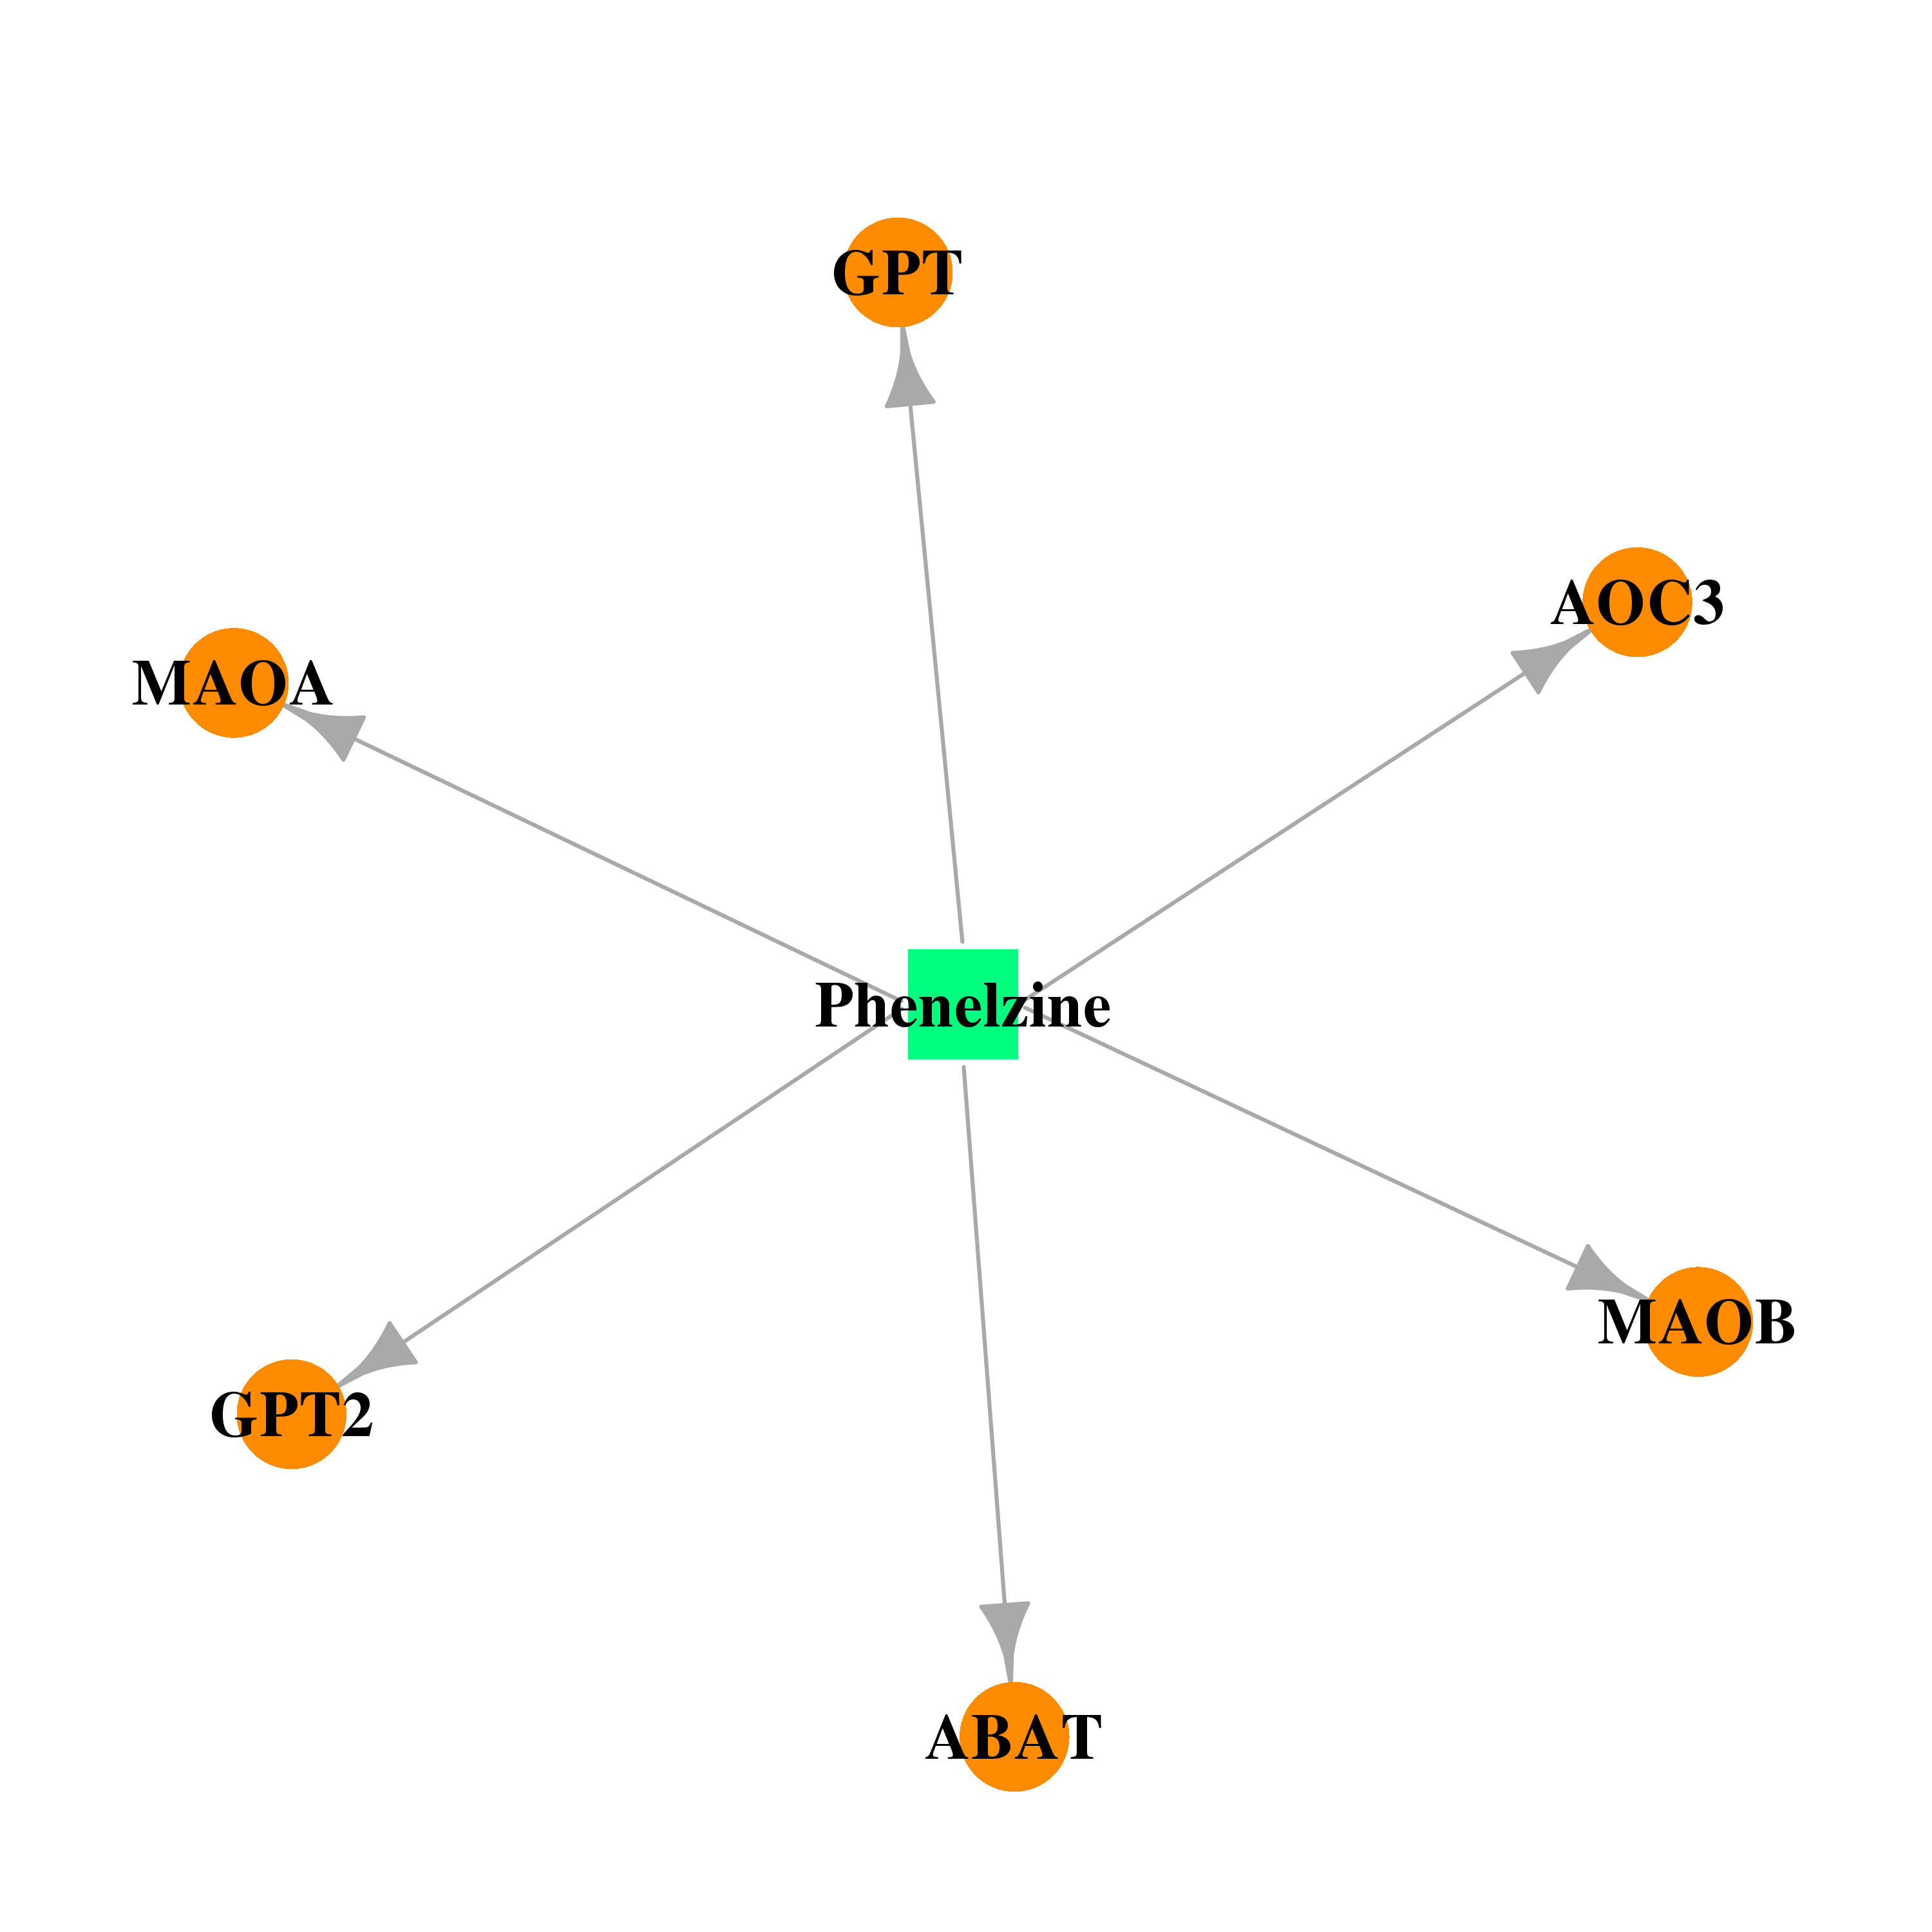 |  |
| DB01080 | 4-aminobutyrate aminotransferase | approved | Vigabatrin | 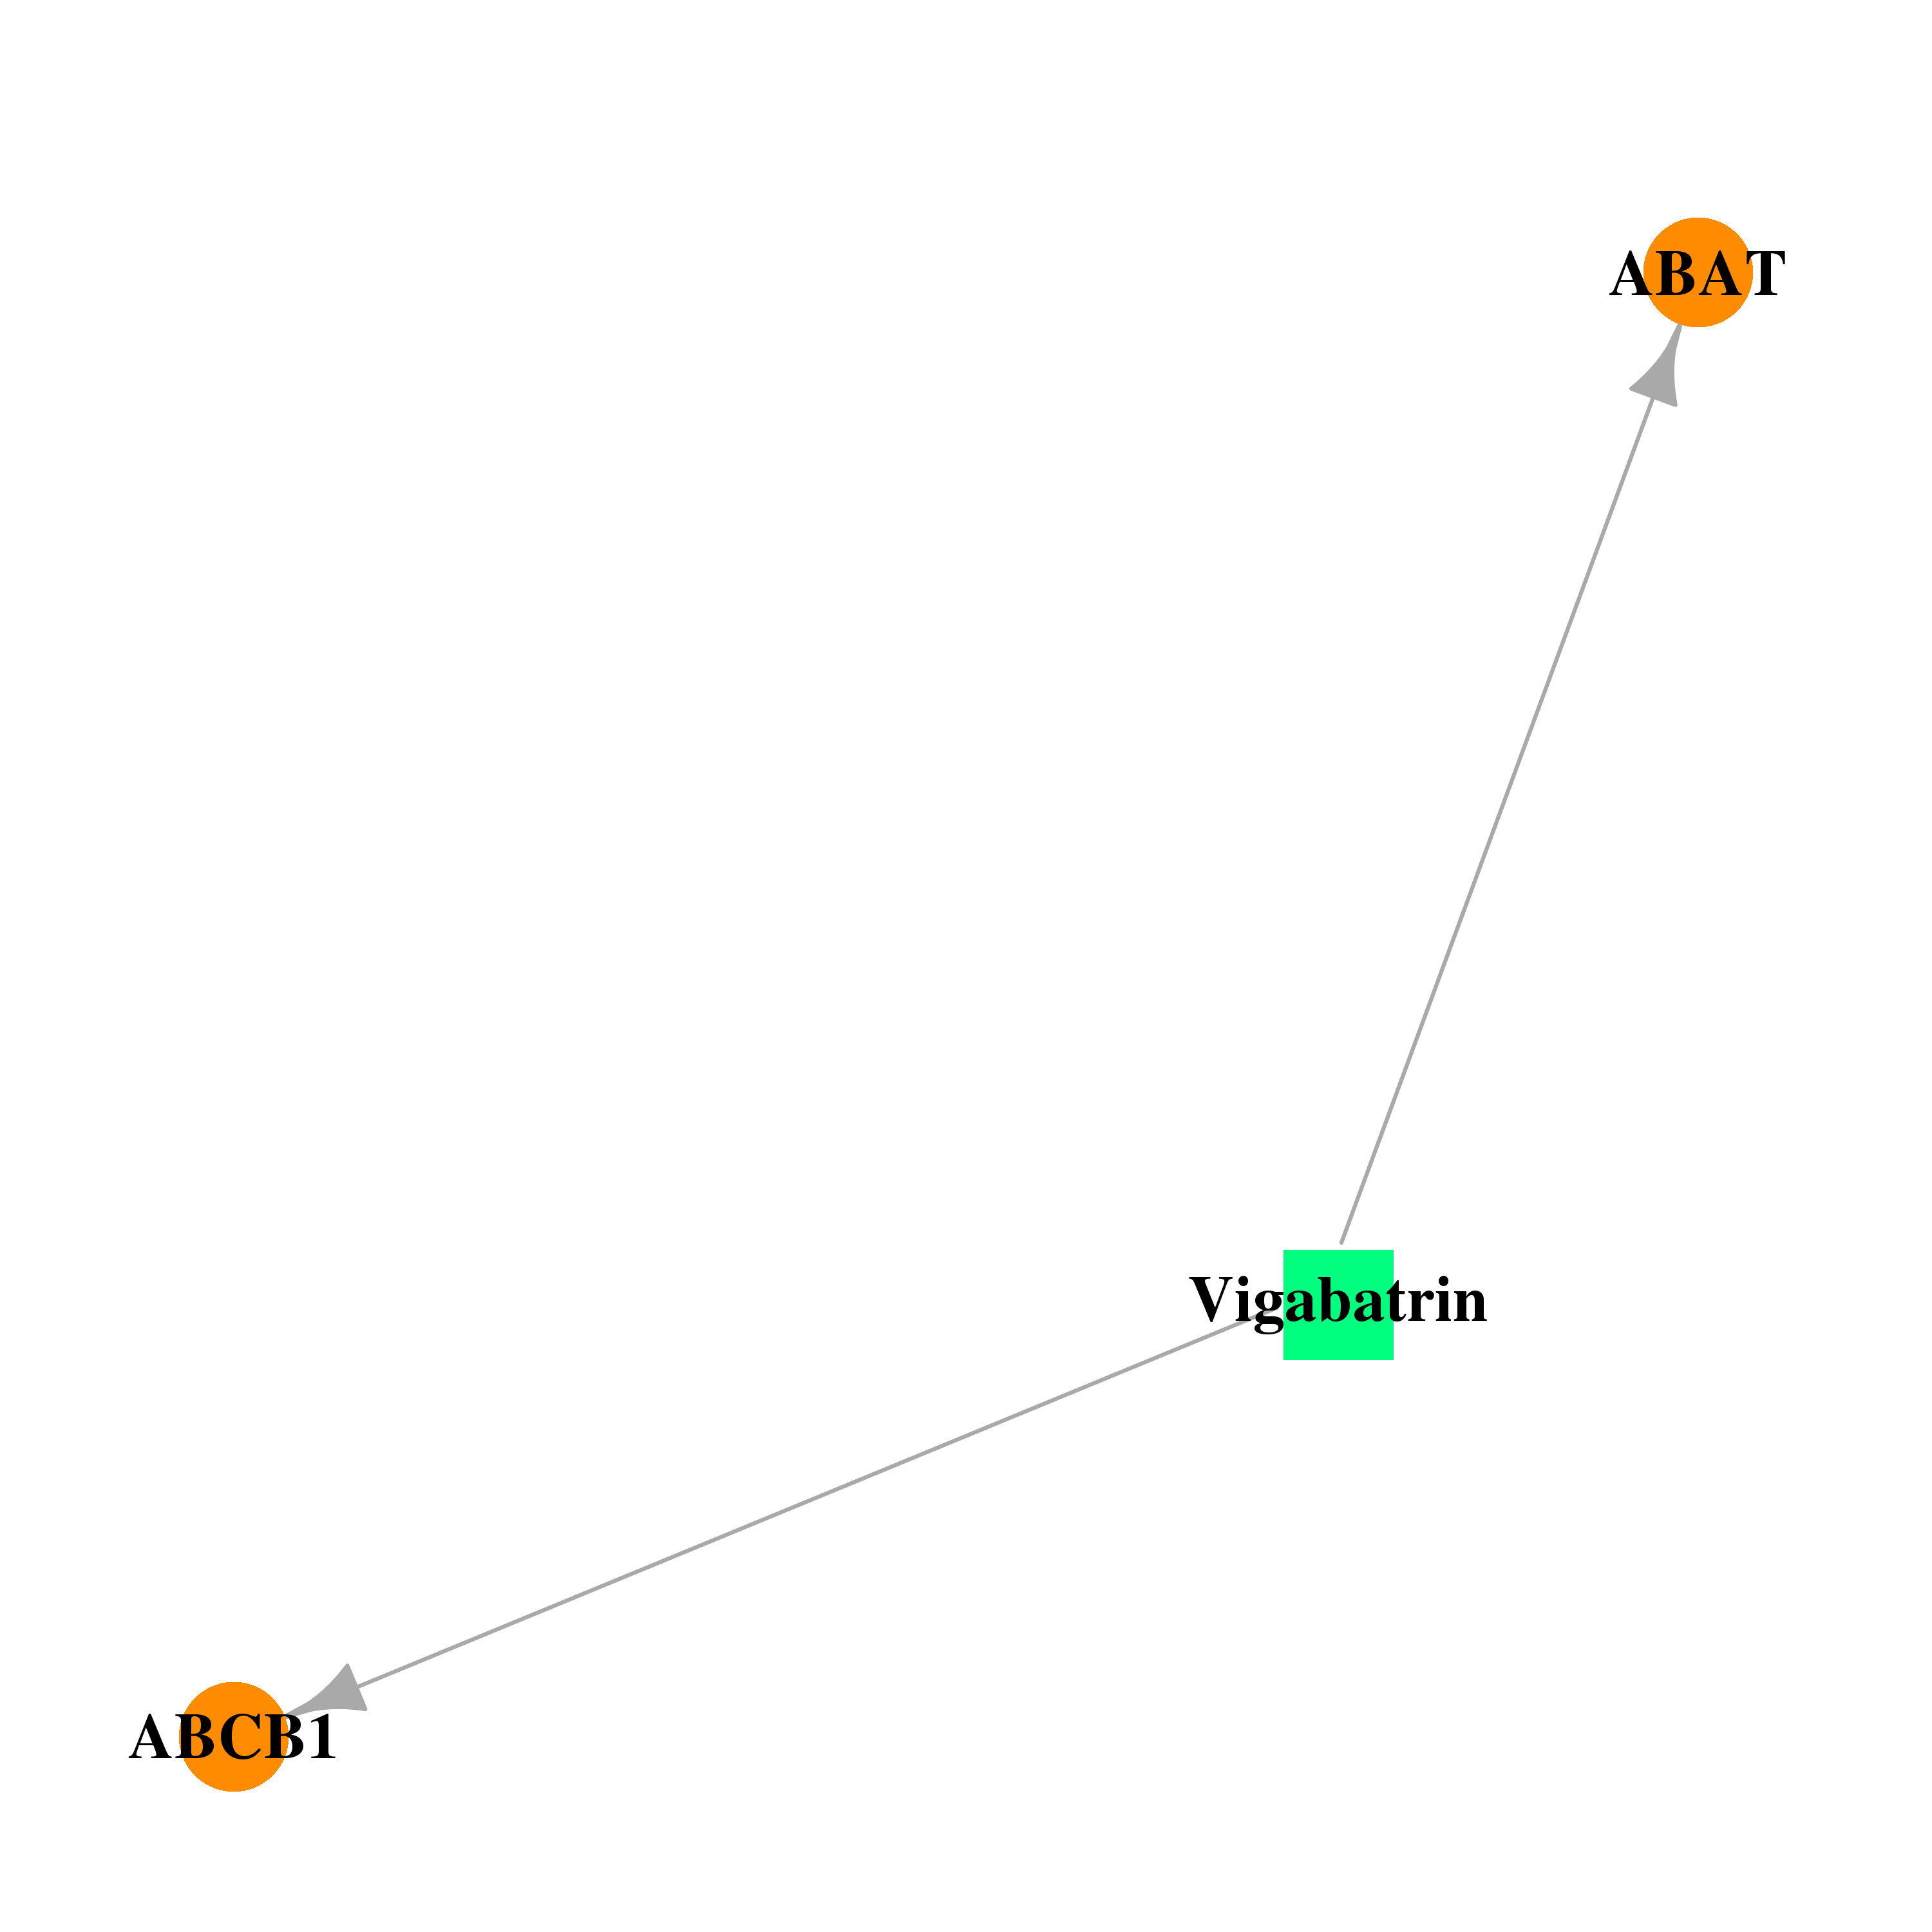 |  |
| DB01699 | 4-aminobutyrate aminotransferase | experimental | (4e)-4-Aminohex-4-Enoic Acid | 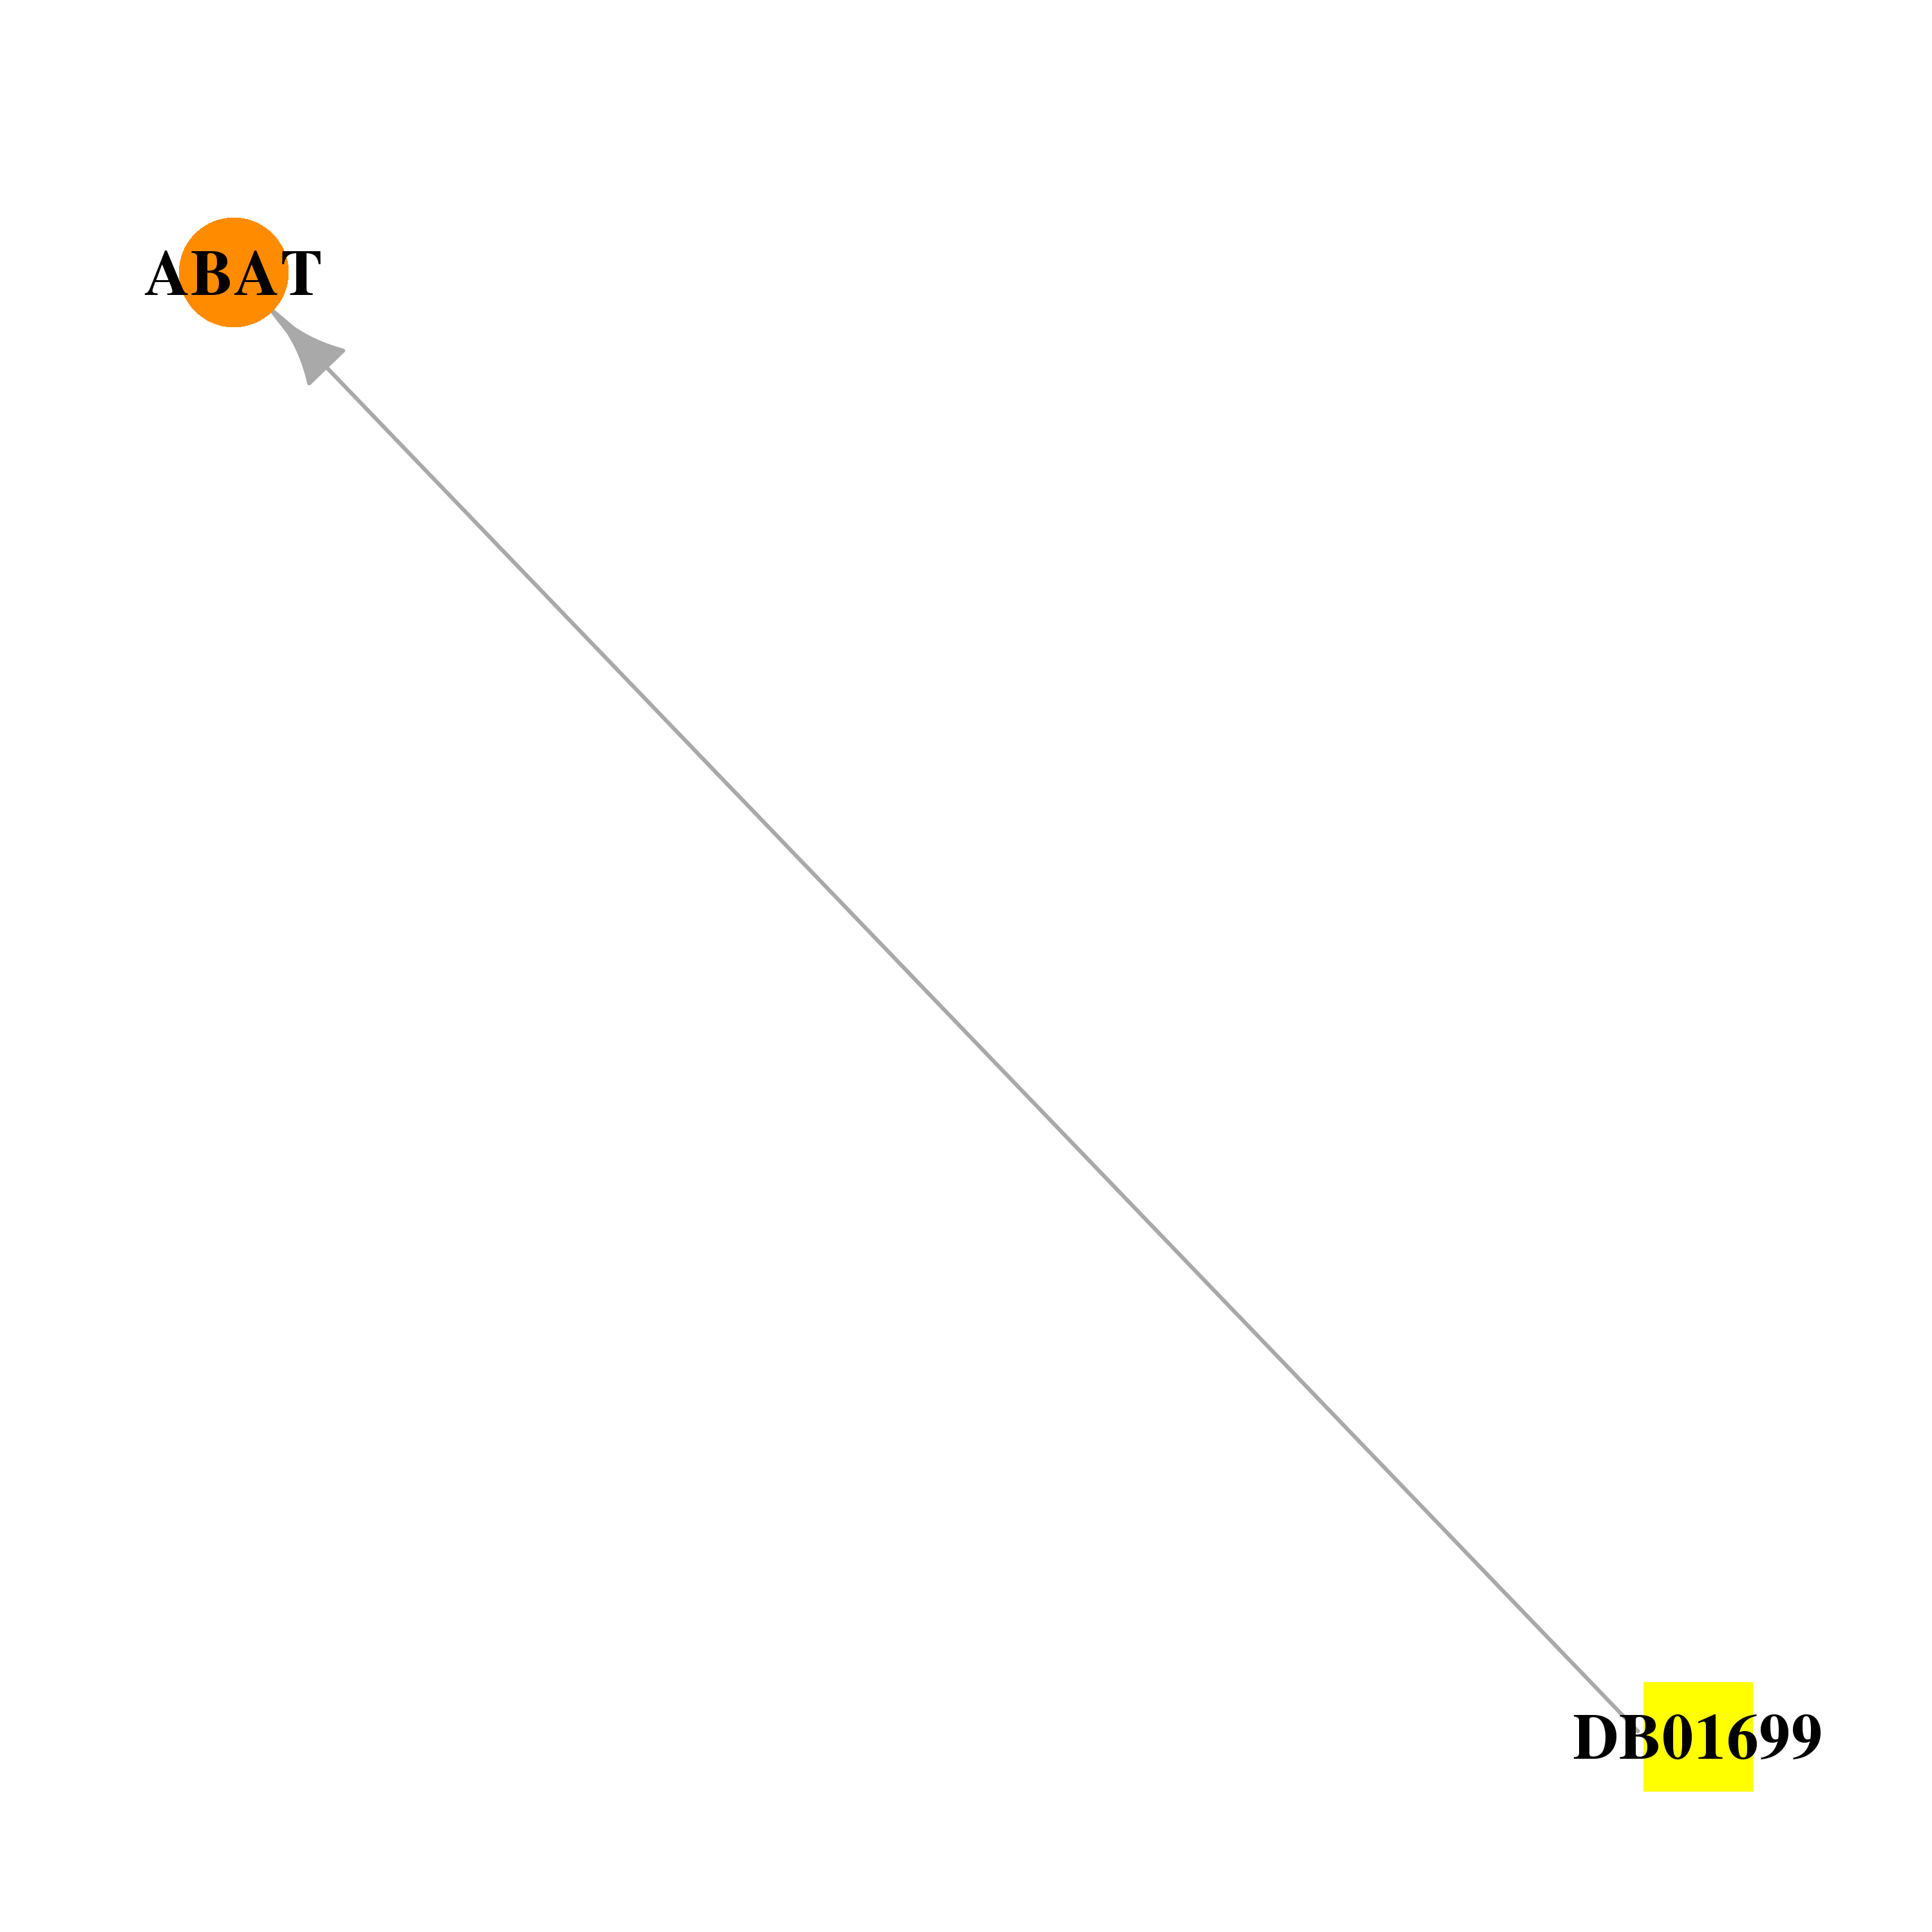 |  |
| DB04235 | 4-aminobutyrate aminotransferase | experimental | 4-Amino Hexanoic Acid | 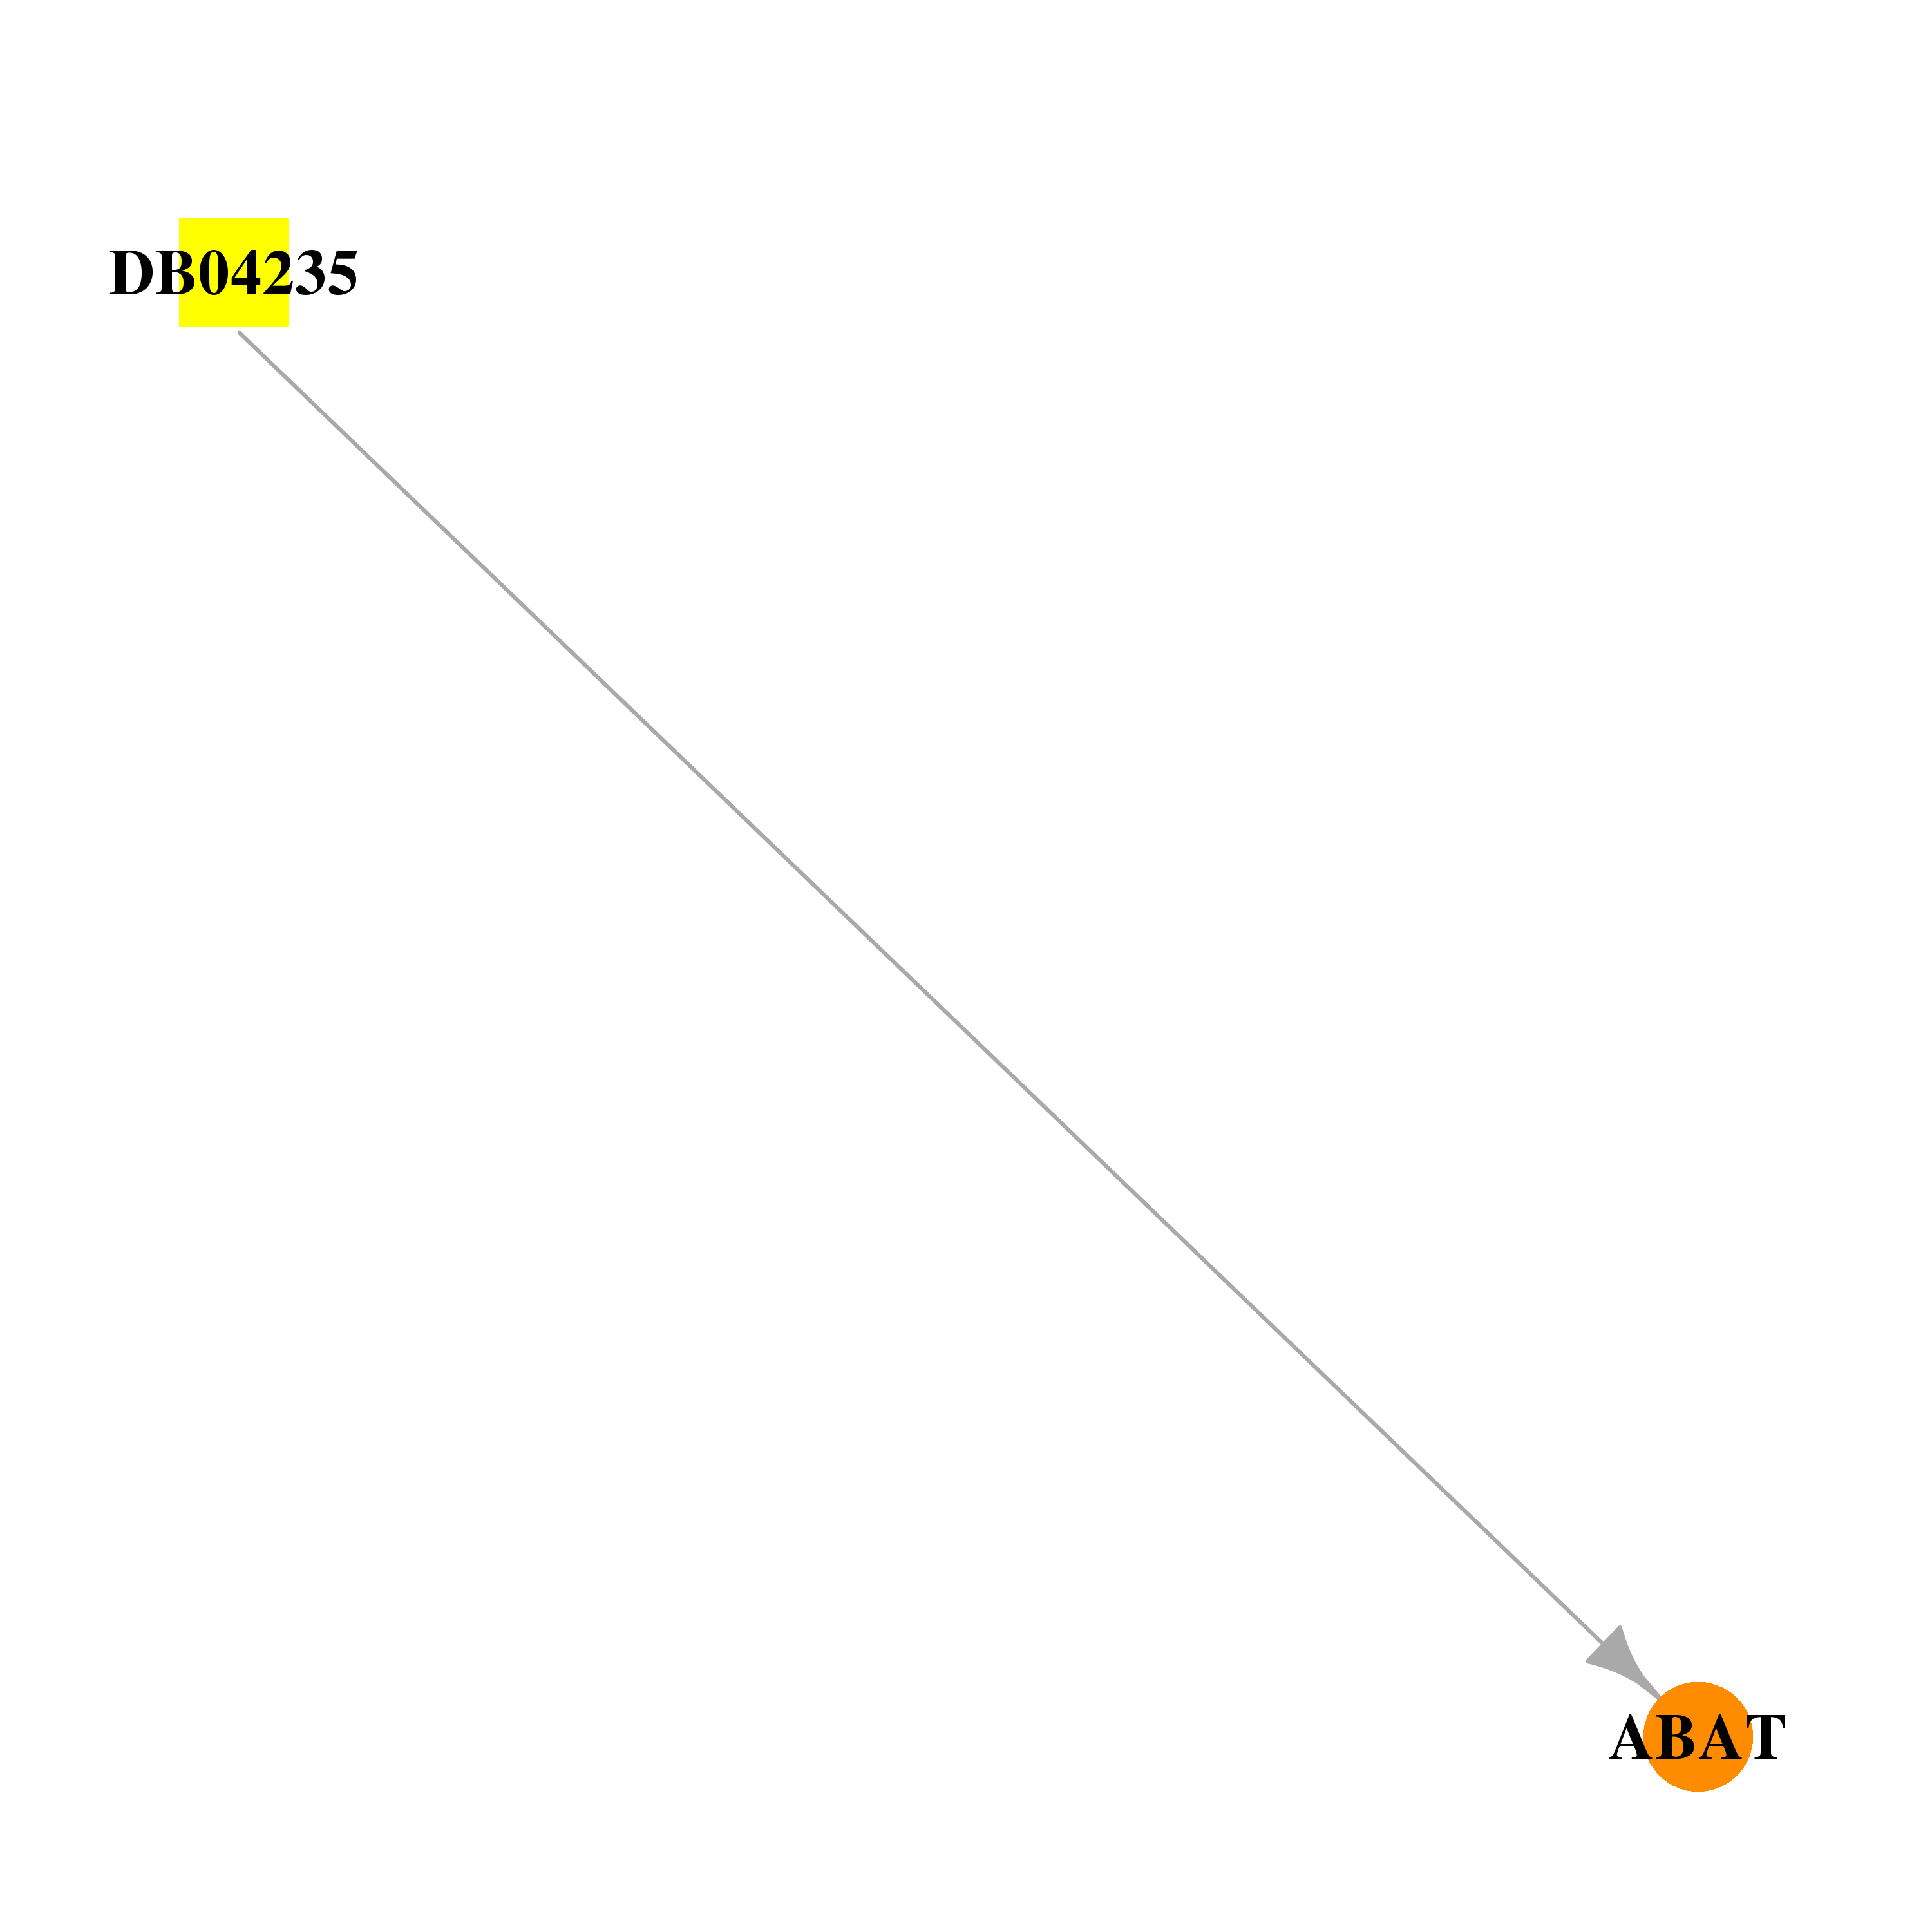 |  |
| Top |
| Cross referenced IDs for ABAT |
| * We obtained these cross-references from Uniprot database. It covers 150 different DBs, 18 categories. http://www.uniprot.org/help/cross_references_section |
: Open all cross reference information
|
Copyright © 2016-Present - The Univsersity of Texas Health Science Center at Houston @ |