|
|||||||||||||||||||||||||||||||||||||||||||||||||||||||||||||||||||||||||||||||||||||||||||||||||||||||||||||||||||||||||||||||||||||||||||||||||||||||||||||||||||||||||||||||||||||||||||||||||||||||||||||||||||||||||||||||||||||||||||||||||||||||||||||||||||||||||||||||||||||||||||||||||||||||||||||||||||||||||||||||||||||||||||||
| |
| Phenotypic Information (metabolism pathway, cancer, disease, phenome) |
| |
| |
| Gene-Gene Network Information: Co-Expression Network, Interacting Genes & KEGG |
| |
|


| Gene Summary for DPYS |
| Basic gene info. | Gene symbol | DPYS |
| Gene name | dihydropyrimidinase | |
| Synonyms | DHP|DHPase | |
| Cytomap | UCSC genome browser: 8q22 | |
| Genomic location | chr8 :105391651-105479277 | |
| Type of gene | protein-coding | |
| RefGenes | NM_001385.2, | |
| Ensembl id | ENSG00000147647 | |
| Description | dihydropyrimidine amidohydrolasehydantoinase | |
| Modification date | 20141207 | |
| dbXrefs | MIM : 613326 | |
| HGNC : HGNC | ||
| Ensembl : ENSG00000147647 | ||
| HPRD : 01960 | ||
| Vega : OTTHUMG00000164891 | ||
| Protein | UniProt: go to UniProt's Cross Reference DB Table | |
| Expression | CleanEX: HS_DPYS | |
| BioGPS: 1807 | ||
| Gene Expression Atlas: ENSG00000147647 | ||
| The Human Protein Atlas: ENSG00000147647 | ||
| Pathway | NCI Pathway Interaction Database: DPYS | |
| KEGG: DPYS | ||
| REACTOME: DPYS | ||
| ConsensusPathDB | ||
| Pathway Commons: DPYS | ||
| Metabolism | MetaCyc: DPYS | |
| HUMANCyc: DPYS | ||
| Regulation | Ensembl's Regulation: ENSG00000147647 | |
| miRBase: chr8 :105,391,651-105,479,277 | ||
| TargetScan: NM_001385 | ||
| cisRED: ENSG00000147647 | ||
| Context | iHOP: DPYS | |
| cancer metabolism search in PubMed: DPYS | ||
| UCL Cancer Institute: DPYS | ||
| Assigned class in ccmGDB | C | |
| Top |
| Phenotypic Information for DPYS(metabolism pathway, cancer, disease, phenome) |
| Cancer | CGAP: DPYS |
| Familial Cancer Database: DPYS | |
| * This gene is included in those cancer gene databases. |
|
|
|
|
|
| . | |||||||||||||||||||||||||||||||||||||||||||||||||||||||||||||||||||||||||||||||||||||||||||||||||||||||||||||||||||||||||||||||||||||||||||||||||||||||||||||||||||||||||||||||||||||||||||||||||||||||||||||||||||||||||||||||||||||||||||||||||||||||||||||||||||||||||||||||||||||||||||||||||||||||||||||||||||||||||||||||||||||||
Oncogene 1 | Significant driver gene in | ||||||||||||||||||||||||||||||||||||||||||||||||||||||||||||||||||||||||||||||||||||||||||||||||||||||||||||||||||||||||||||||||||||||||||||||||||||||||||||||||||||||||||||||||||||||||||||||||||||||||||||||||||||||||||||||||||||||||||||||||||||||||||||||||||||||||||||||||||||||||||||||||||||||||||||||||||||||||||||||||||||||||||||
| cf) number; DB name 1 Oncogene; http://nar.oxfordjournals.org/content/35/suppl_1/D721.long, 2 Tumor Suppressor gene; https://bioinfo.uth.edu/TSGene/, 3 Cancer Gene Census; http://www.nature.com/nrc/journal/v4/n3/abs/nrc1299.html, 4 CancerGenes; http://nar.oxfordjournals.org/content/35/suppl_1/D721.long, 5 Network of Cancer Gene; http://ncg.kcl.ac.uk/index.php, 1Therapeutic Vulnerabilities in Cancer; http://cbio.mskcc.org/cancergenomics/statius/ |
| KEGG_PYRIMIDINE_METABOLISM KEGG_BETA_ALANINE_METABOLISM KEGG_DRUG_METABOLISM_OTHER_ENZYMES REACTOME_METABOLISM_OF_NUCLEOTIDES REACTOME_PYRIMIDINE_METABOLISM | |
| OMIM | |
| Orphanet | |
| Disease | KEGG Disease: DPYS |
| MedGen: DPYS (Human Medical Genetics with Condition) | |
| ClinVar: DPYS | |
| Phenotype | MGI: DPYS (International Mouse Phenotyping Consortium) |
| PhenomicDB: DPYS | |
| Mutations for DPYS |
| * Under tables are showing count per each tissue to give us broad intuition about tissue specific mutation patterns.You can go to the detailed page for each mutation database's web site. |
| There's no structural variation information in COSMIC data for this gene. |
| * From mRNA Sanger sequences, Chitars2.0 arranged chimeric transcripts. This table shows DPYS related fusion information. |
| ID | Head Gene | Tail Gene | Accession | Gene_a | qStart_a | qEnd_a | Chromosome_a | tStart_a | tEnd_a | Gene_a | qStart_a | qEnd_a | Chromosome_a | tStart_a | tEnd_a |
| Top |
| Mutation type/ Tissue ID | brca | cns | cerv | endome | haematopo | kidn | Lintest | liver | lung | ns | ovary | pancre | prost | skin | stoma | thyro | urina | |||
| Total # sample | 5 | 1 | 1 | 1 | 2 | 1 | 2 | |||||||||||||
| GAIN (# sample) | 5 | 1 | 1 | 1 | 2 | 1 | 2 | |||||||||||||
| LOSS (# sample) |
| cf) Tissue ID; Tissue type (1; Breast, 2; Central_nervous_system, 3; Cervix, 4; Endometrium, 5; Haematopoietic_and_lymphoid_tissue, 6; Kidney, 7; Large_intestine, 8; Liver, 9; Lung, 10; NS, 11; Ovary, 12; Pancreas, 13; Prostate, 14; Skin, 15; Stomach, 16; Thyroid, 17; Urinary_tract) |
| Top |
|
 |
| Top |
| Stat. for Non-Synonymous SNVs (# total SNVs=84) | (# total SNVs=28) |
 |  |
(# total SNVs=2) | (# total SNVs=0) |
 |
| Top |
| * When you move the cursor on each content, you can see more deailed mutation information on the Tooltip. Those are primary_site,primary_histology,mutation(aa),pubmedID. |
| GRCh37 position | Mutation(aa) | Unique sampleID count |
| chr8:105459605-105459605 | p.E184K | 4 |
| chr8:105436539-105436539 | p.R391G | 4 |
| chr8:105463544-105463544 | p.R118Q | 4 |
| chr8:105478933-105478933 | p.F72F | 4 |
| chr8:105463529-105463529 | p.P123H | 3 |
| chr8:105459696-105459696 | p.K153K | 3 |
| chr8:105393517-105393517 | p.R490H | 3 |
| chr8:105456494-105456494 | p.A259S | 2 |
| chr8:105405062-105405062 | p.R465G | 2 |
| chr8:105405130-105405130 | p.S442L | 2 |
| Top |
|
 |
| Point Mutation/ Tissue ID | 1 | 2 | 3 | 4 | 5 | 6 | 7 | 8 | 9 | 10 | 11 | 12 | 13 | 14 | 15 | 16 | 17 | 18 | 19 | 20 |
| # sample | 4 | 1 | 14 | 1 | 5 | 3 | 19 | 6 | 1 | 24 | 10 | 7 | ||||||||
| # mutation | 4 | 1 | 15 | 1 | 5 | 3 | 21 | 6 | 1 | 25 | 8 | 8 | ||||||||
| nonsynonymous SNV | 4 | 1 | 13 | 1 | 5 | 2 | 14 | 5 | 1 | 19 | 5 | 6 | ||||||||
| synonymous SNV | 2 | 1 | 7 | 1 | 6 | 4 | 2 |
| cf) Tissue ID; Tissue type (1; BLCA[Bladder Urothelial Carcinoma], 2; BRCA[Breast invasive carcinoma], 3; CESC[Cervical squamous cell carcinoma and endocervical adenocarcinoma], 4; COAD[Colon adenocarcinoma], 5; GBM[Glioblastoma multiforme], 6; Glioma Low Grade, 7; HNSC[Head and Neck squamous cell carcinoma], 8; KICH[Kidney Chromophobe], 9; KIRC[Kidney renal clear cell carcinoma], 10; KIRP[Kidney renal papillary cell carcinoma], 11; LAML[Acute Myeloid Leukemia], 12; LUAD[Lung adenocarcinoma], 13; LUSC[Lung squamous cell carcinoma], 14; OV[Ovarian serous cystadenocarcinoma ], 15; PAAD[Pancreatic adenocarcinoma], 16; PRAD[Prostate adenocarcinoma], 17; SKCM[Skin Cutaneous Melanoma], 18:STAD[Stomach adenocarcinoma], 19:THCA[Thyroid carcinoma], 20:UCEC[Uterine Corpus Endometrial Carcinoma]) |
| Top |
| * We represented just top 10 SNVs. When you move the cursor on each content, you can see more deailed mutation information on the Tooltip. Those are primary_site, primary_histology, mutation(aa), pubmedID. |
| Genomic Position | Mutation(aa) | Unique sampleID count |
| chr8:105436539 | p.R391G | 5 |
| chr8:105459696 | p.F428F | 3 |
| chr8:105405031 | p.R475Q | 3 |
| chr8:105405171 | p.K153K | 3 |
| chr8:105405182 | p.R118Q | 2 |
| chr8:105456608 | p.F101F | 2 |
| chr8:105440237 | p.F425V | 2 |
| chr8:105459605 | p.R355W | 2 |
| chr8:105459626 | p.E184K | 2 |
| chr8:105456623 | p.E177K | 2 |
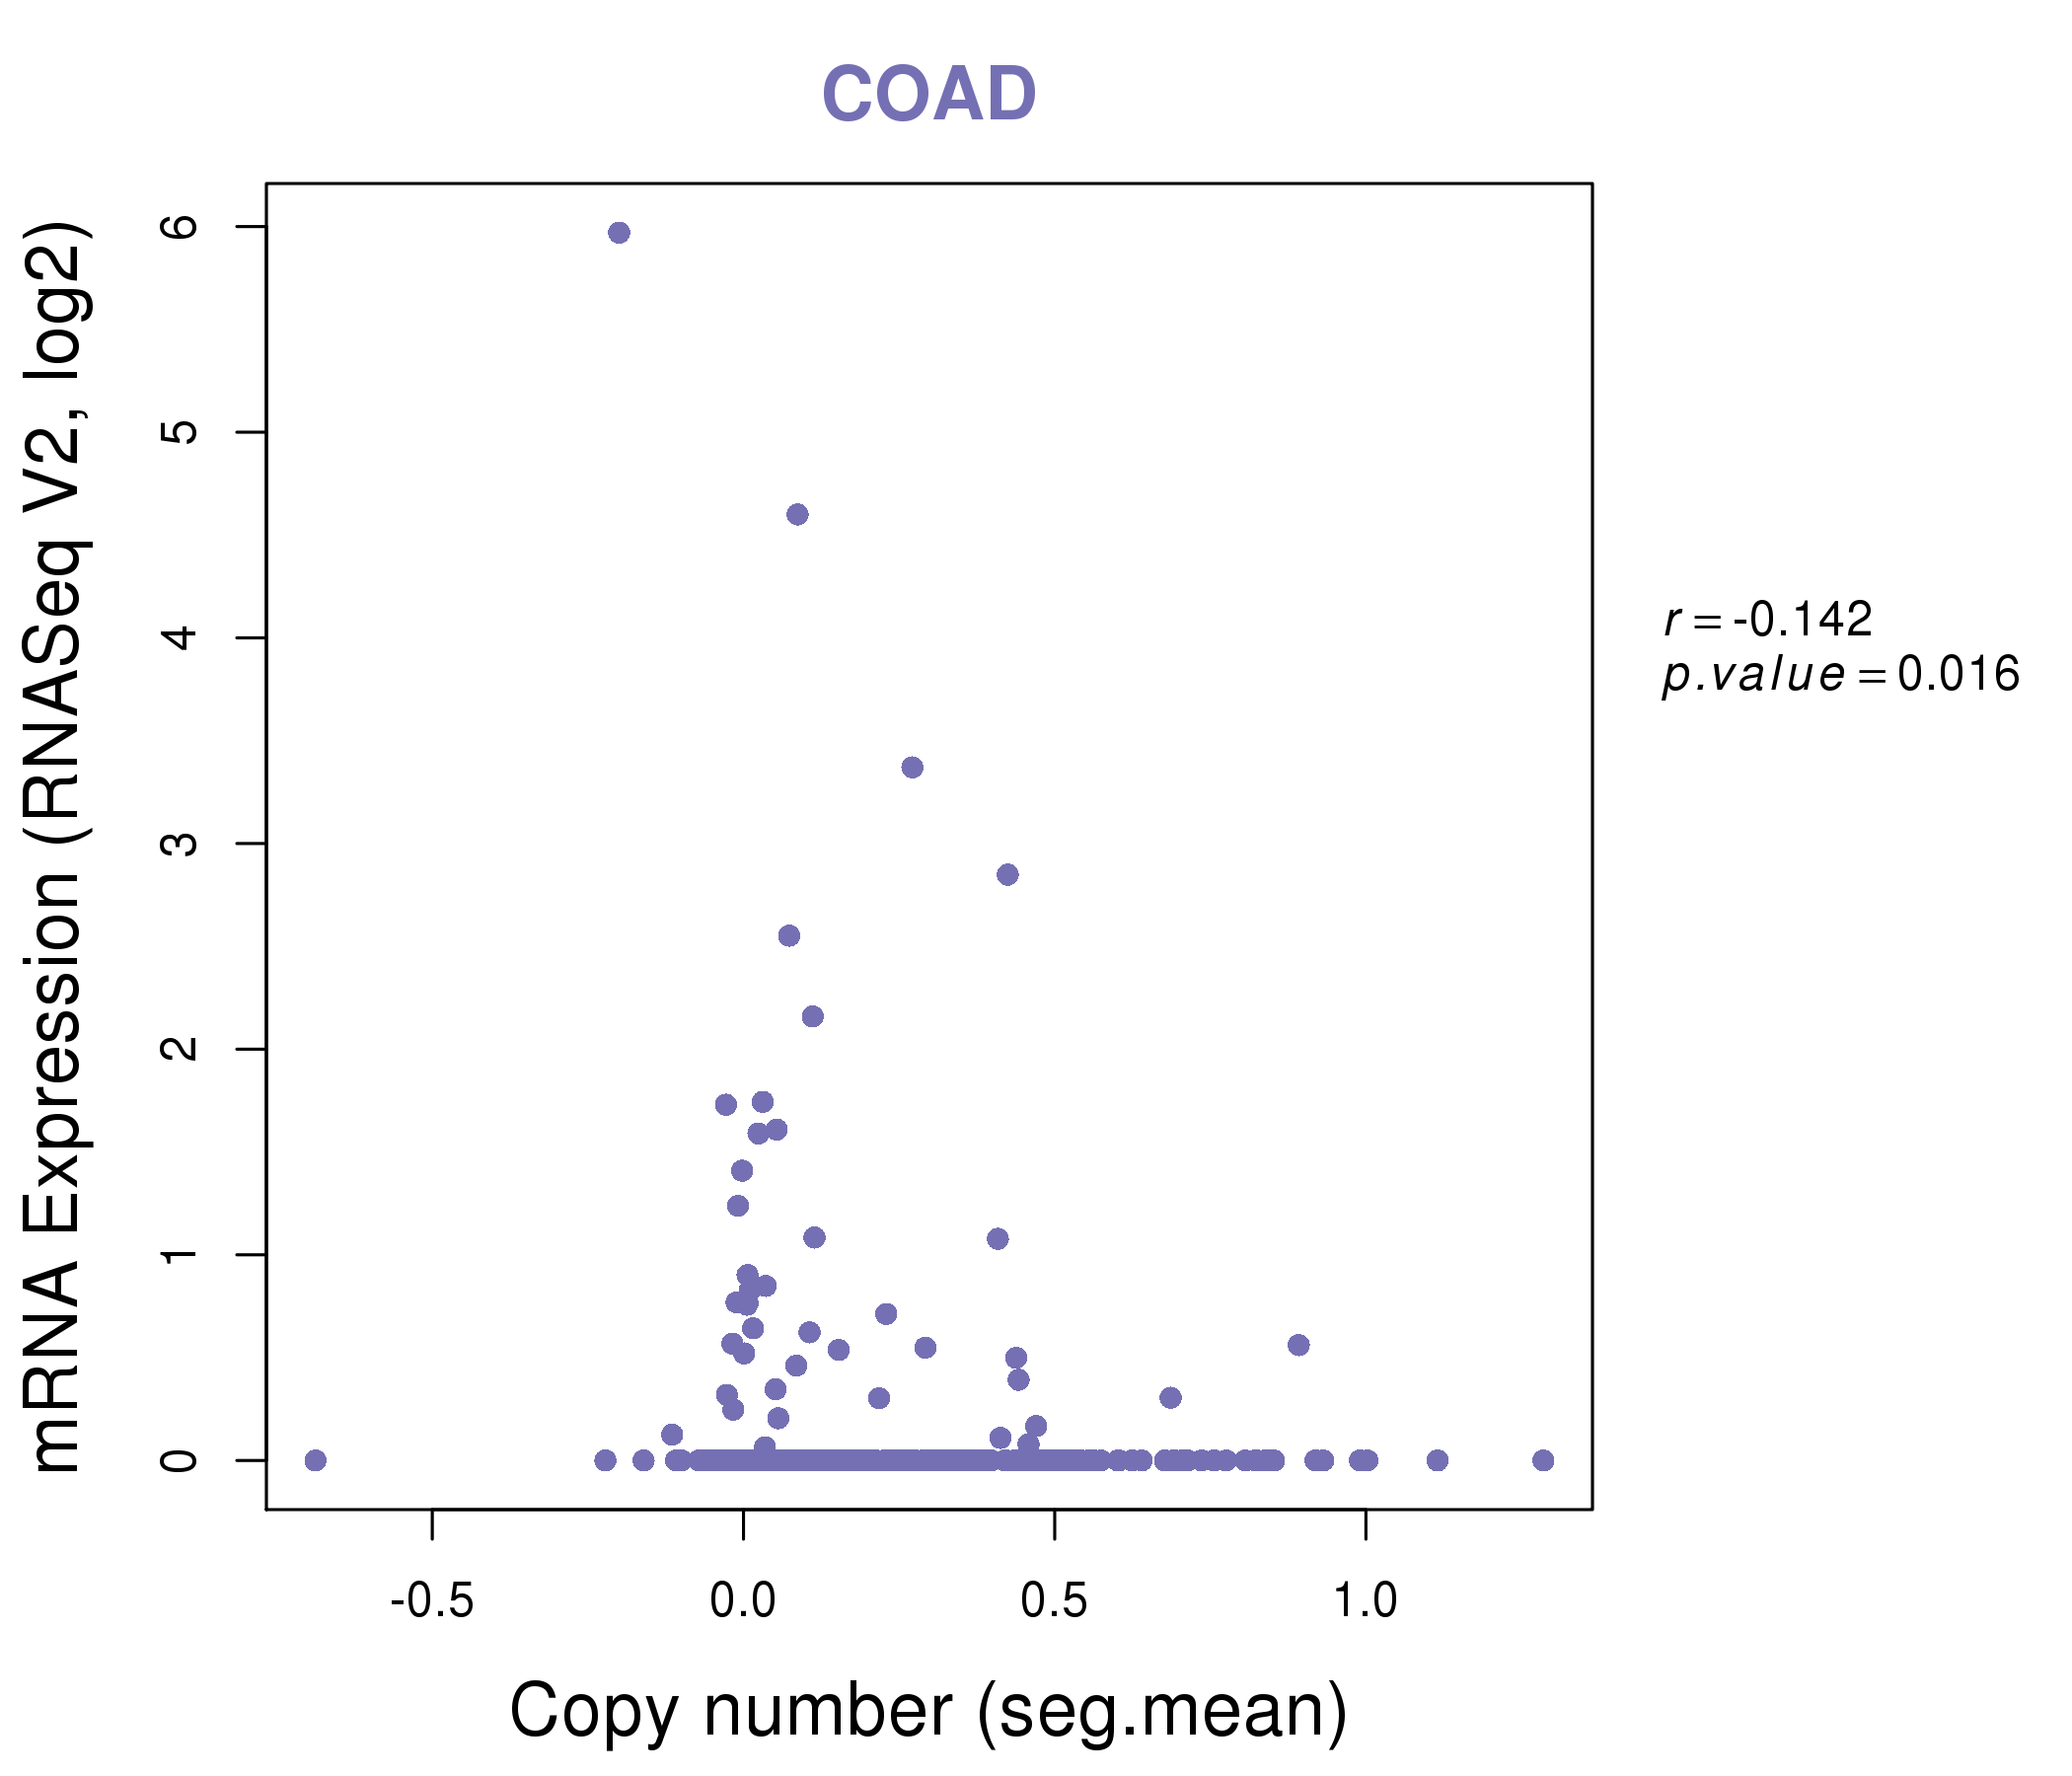
| * Copy number data were extracted from TCGA using R package TCGA-Assembler. The URLs of all public data files on TCGA DCC data server were gathered on Jan-05-2015. Function ProcessCNAData in TCGA-Assembler package was used to obtain gene-level copy number value which is calculated as the average copy number of the genomic region of a gene. |
 |
| cf) Tissue ID[Tissue type]: BLCA[Bladder Urothelial Carcinoma], BRCA[Breast invasive carcinoma], CESC[Cervical squamous cell carcinoma and endocervical adenocarcinoma], COAD[Colon adenocarcinoma], GBM[Glioblastoma multiforme], Glioma Low Grade, HNSC[Head and Neck squamous cell carcinoma], KICH[Kidney Chromophobe], KIRC[Kidney renal clear cell carcinoma], KIRP[Kidney renal papillary cell carcinoma], LAML[Acute Myeloid Leukemia], LUAD[Lung adenocarcinoma], LUSC[Lung squamous cell carcinoma], OV[Ovarian serous cystadenocarcinoma ], PAAD[Pancreatic adenocarcinoma], PRAD[Prostate adenocarcinoma], SKCM[Skin Cutaneous Melanoma], STAD[Stomach adenocarcinoma], THCA[Thyroid carcinoma], UCEC[Uterine Corpus Endometrial Carcinoma] |
| Top |
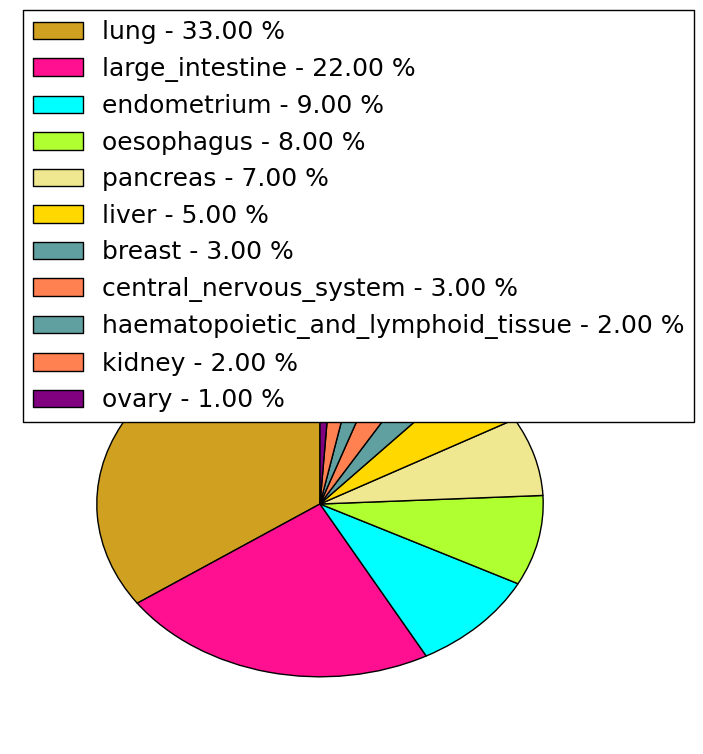
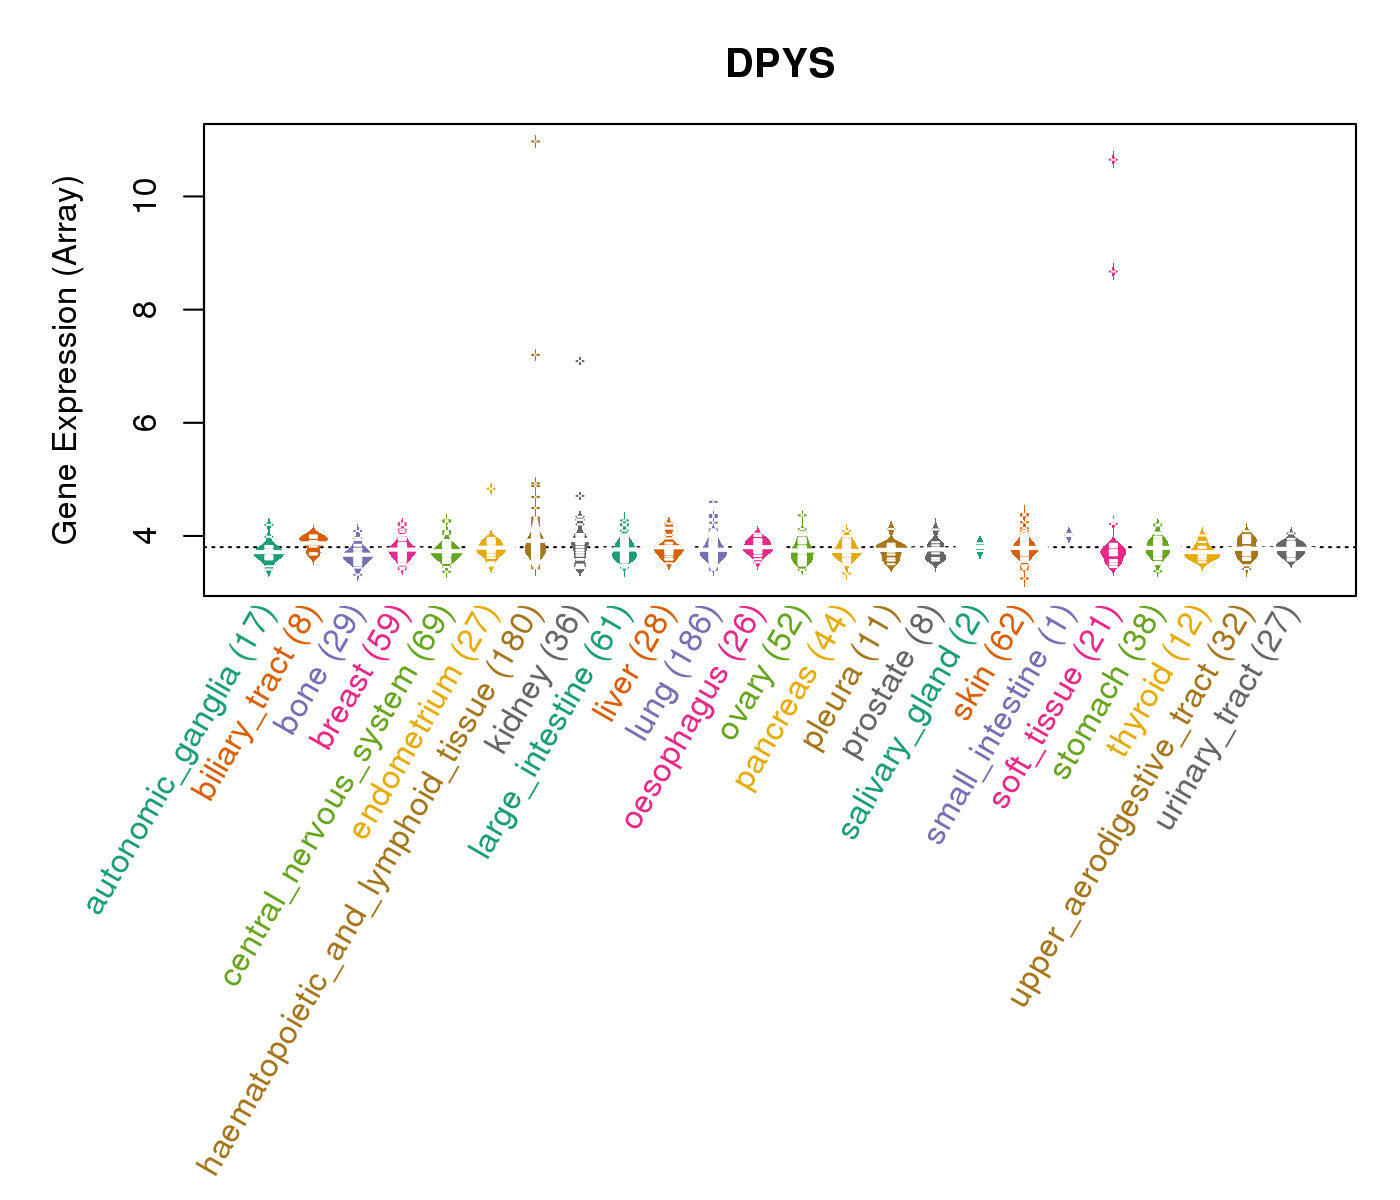
| Gene Expression for DPYS |
| * CCLE gene expression data were extracted from CCLE_Expression_Entrez_2012-10-18.res: Gene-centric RMA-normalized mRNA expression data. |
 |
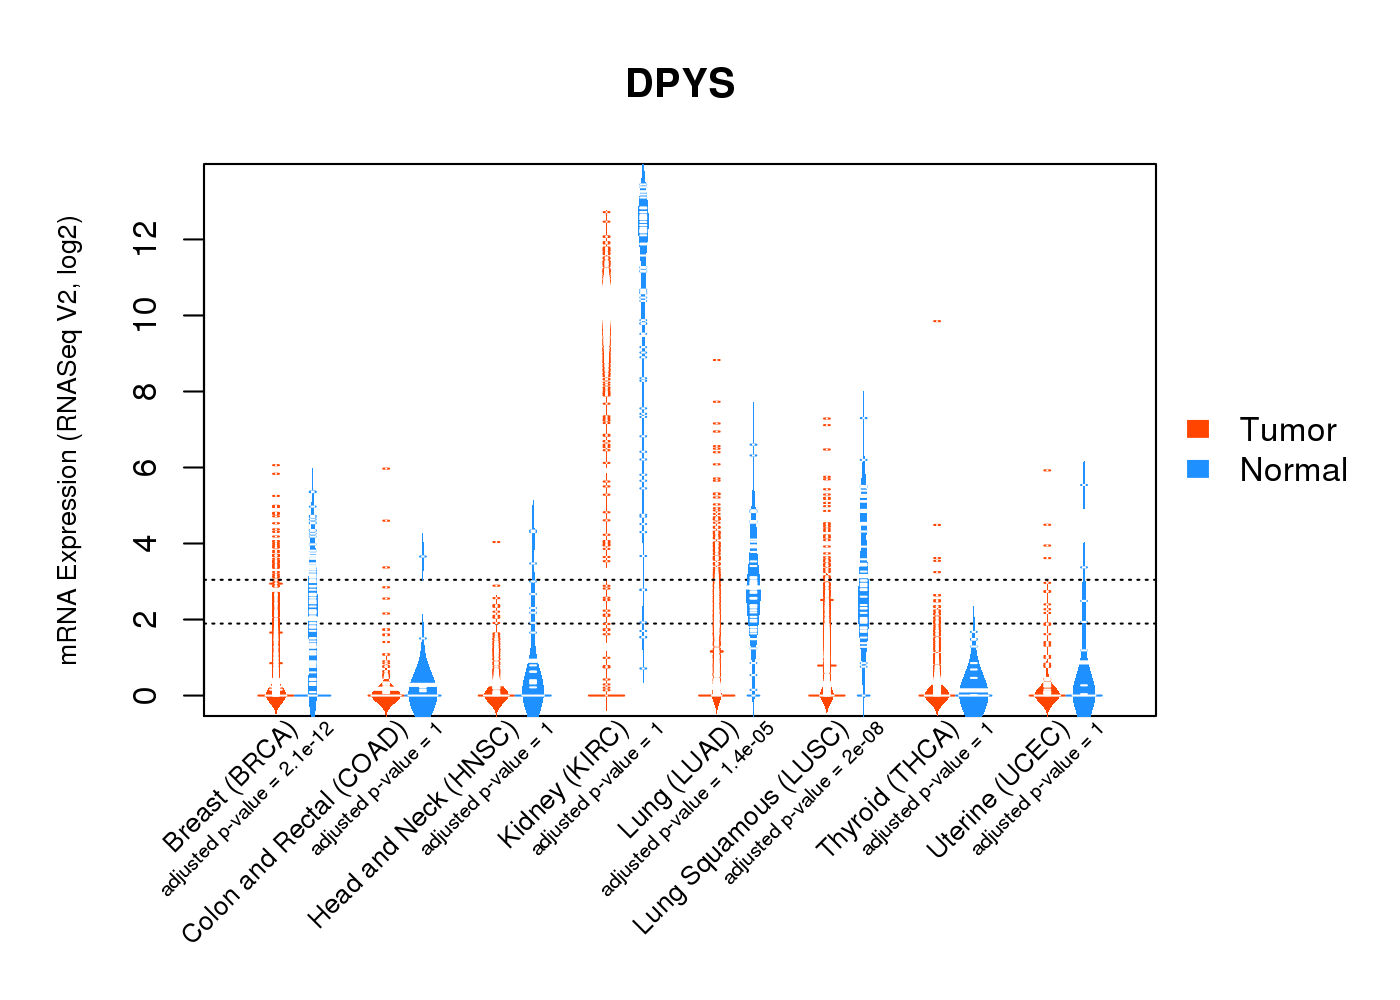
| * Normalized gene expression data of RNASeqV2 was extracted from TCGA using R package TCGA-Assembler. The URLs of all public data files on TCGA DCC data server were gathered at Jan-05-2015. Only eight cancer types have enough normal control samples for differential expression analysis. (t test, adjusted p<0.05 (using Benjamini-Hochberg FDR)) |
 |
| Top |
| * This plots show the correlation between CNV and gene expression. |
: Open all plots for all cancer types
 |
|
 |
|


| Top |
| Gene-Gene Network Information |
| * Co-Expression network figures were drawn using R package igraph. Only the top 20 genes with the highest correlations were shown. Red circle: input gene, orange circle: cell metabolism gene, sky circle: other gene |
: Open all plots for all cancer types
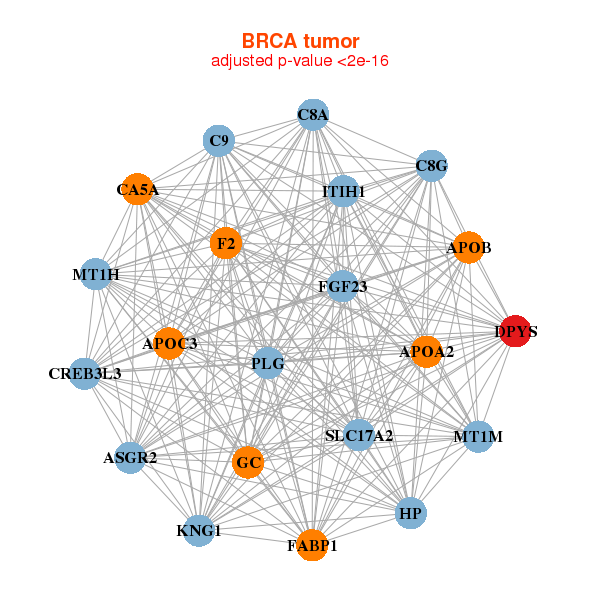 |
| ||||
| APOA2,APOB,APOC3,ASGR2,C8A,C8G,C9, CA5A,CREB3L3,DPYS,F2,FABP1,FGF23,GC, HP,ITIH1,KNG1,MT1H,MT1M,PLG,SLC17A2 | CNNM1,DPYS,ENPP6,FHAD1,FMO1,GPR15,GPRC5D, HPSE2,KCNMB2,LOC254559,LOC96610,MAP3K15,MEI1,NTRK1, PHC1,PHF12,SLC16A5,SLC26A10,TMEM178A,TXNDC11,ZNF266 | ||||
 |
| ||||
| BNC1,SERTM1,BPIFB4,CIDEA,CTSL3P,CYLC2,DPYS, EPGN,FAM180B,BRINP2,FIGLA,HAS1,HEPN1,HP, LINC01105,LRP2,OR6C3,PKHD1L1,PTPRQ,RFPL4A,TNNT3 | BPIFB4,C4A,CCDC144NL,CD300LG,CHRDL2,CNBD1,CST11, DEFB124,DPYS,DYDC1,GLYCAM1,LIM2,LOC55908,MARCO, OR3A4P,REG1A,REG1B,RNASE2,SBSN,SCGB1A1,SNORA22 |

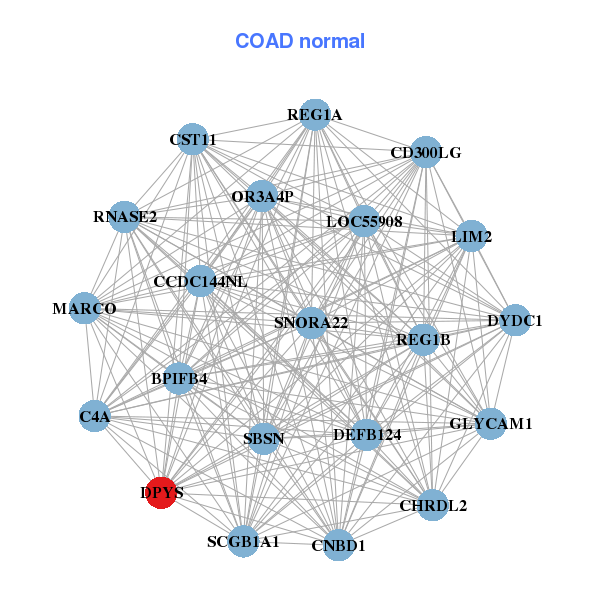
| * Co-Expression network figures were drawn using R package igraph. Only the top 20 genes with the highest correlations were shown. Red circle: input gene, orange circle: cell metabolism gene, sky circle: other gene |
: Open all plots for all cancer types
| Top |
: Open all interacting genes' information including KEGG pathway for all interacting genes from DAVID
| Top |
| Pharmacological Information for DPYS |
| DB Category | DB Name | DB's ID and Url link |
| * Gene Centered Interaction Network. |
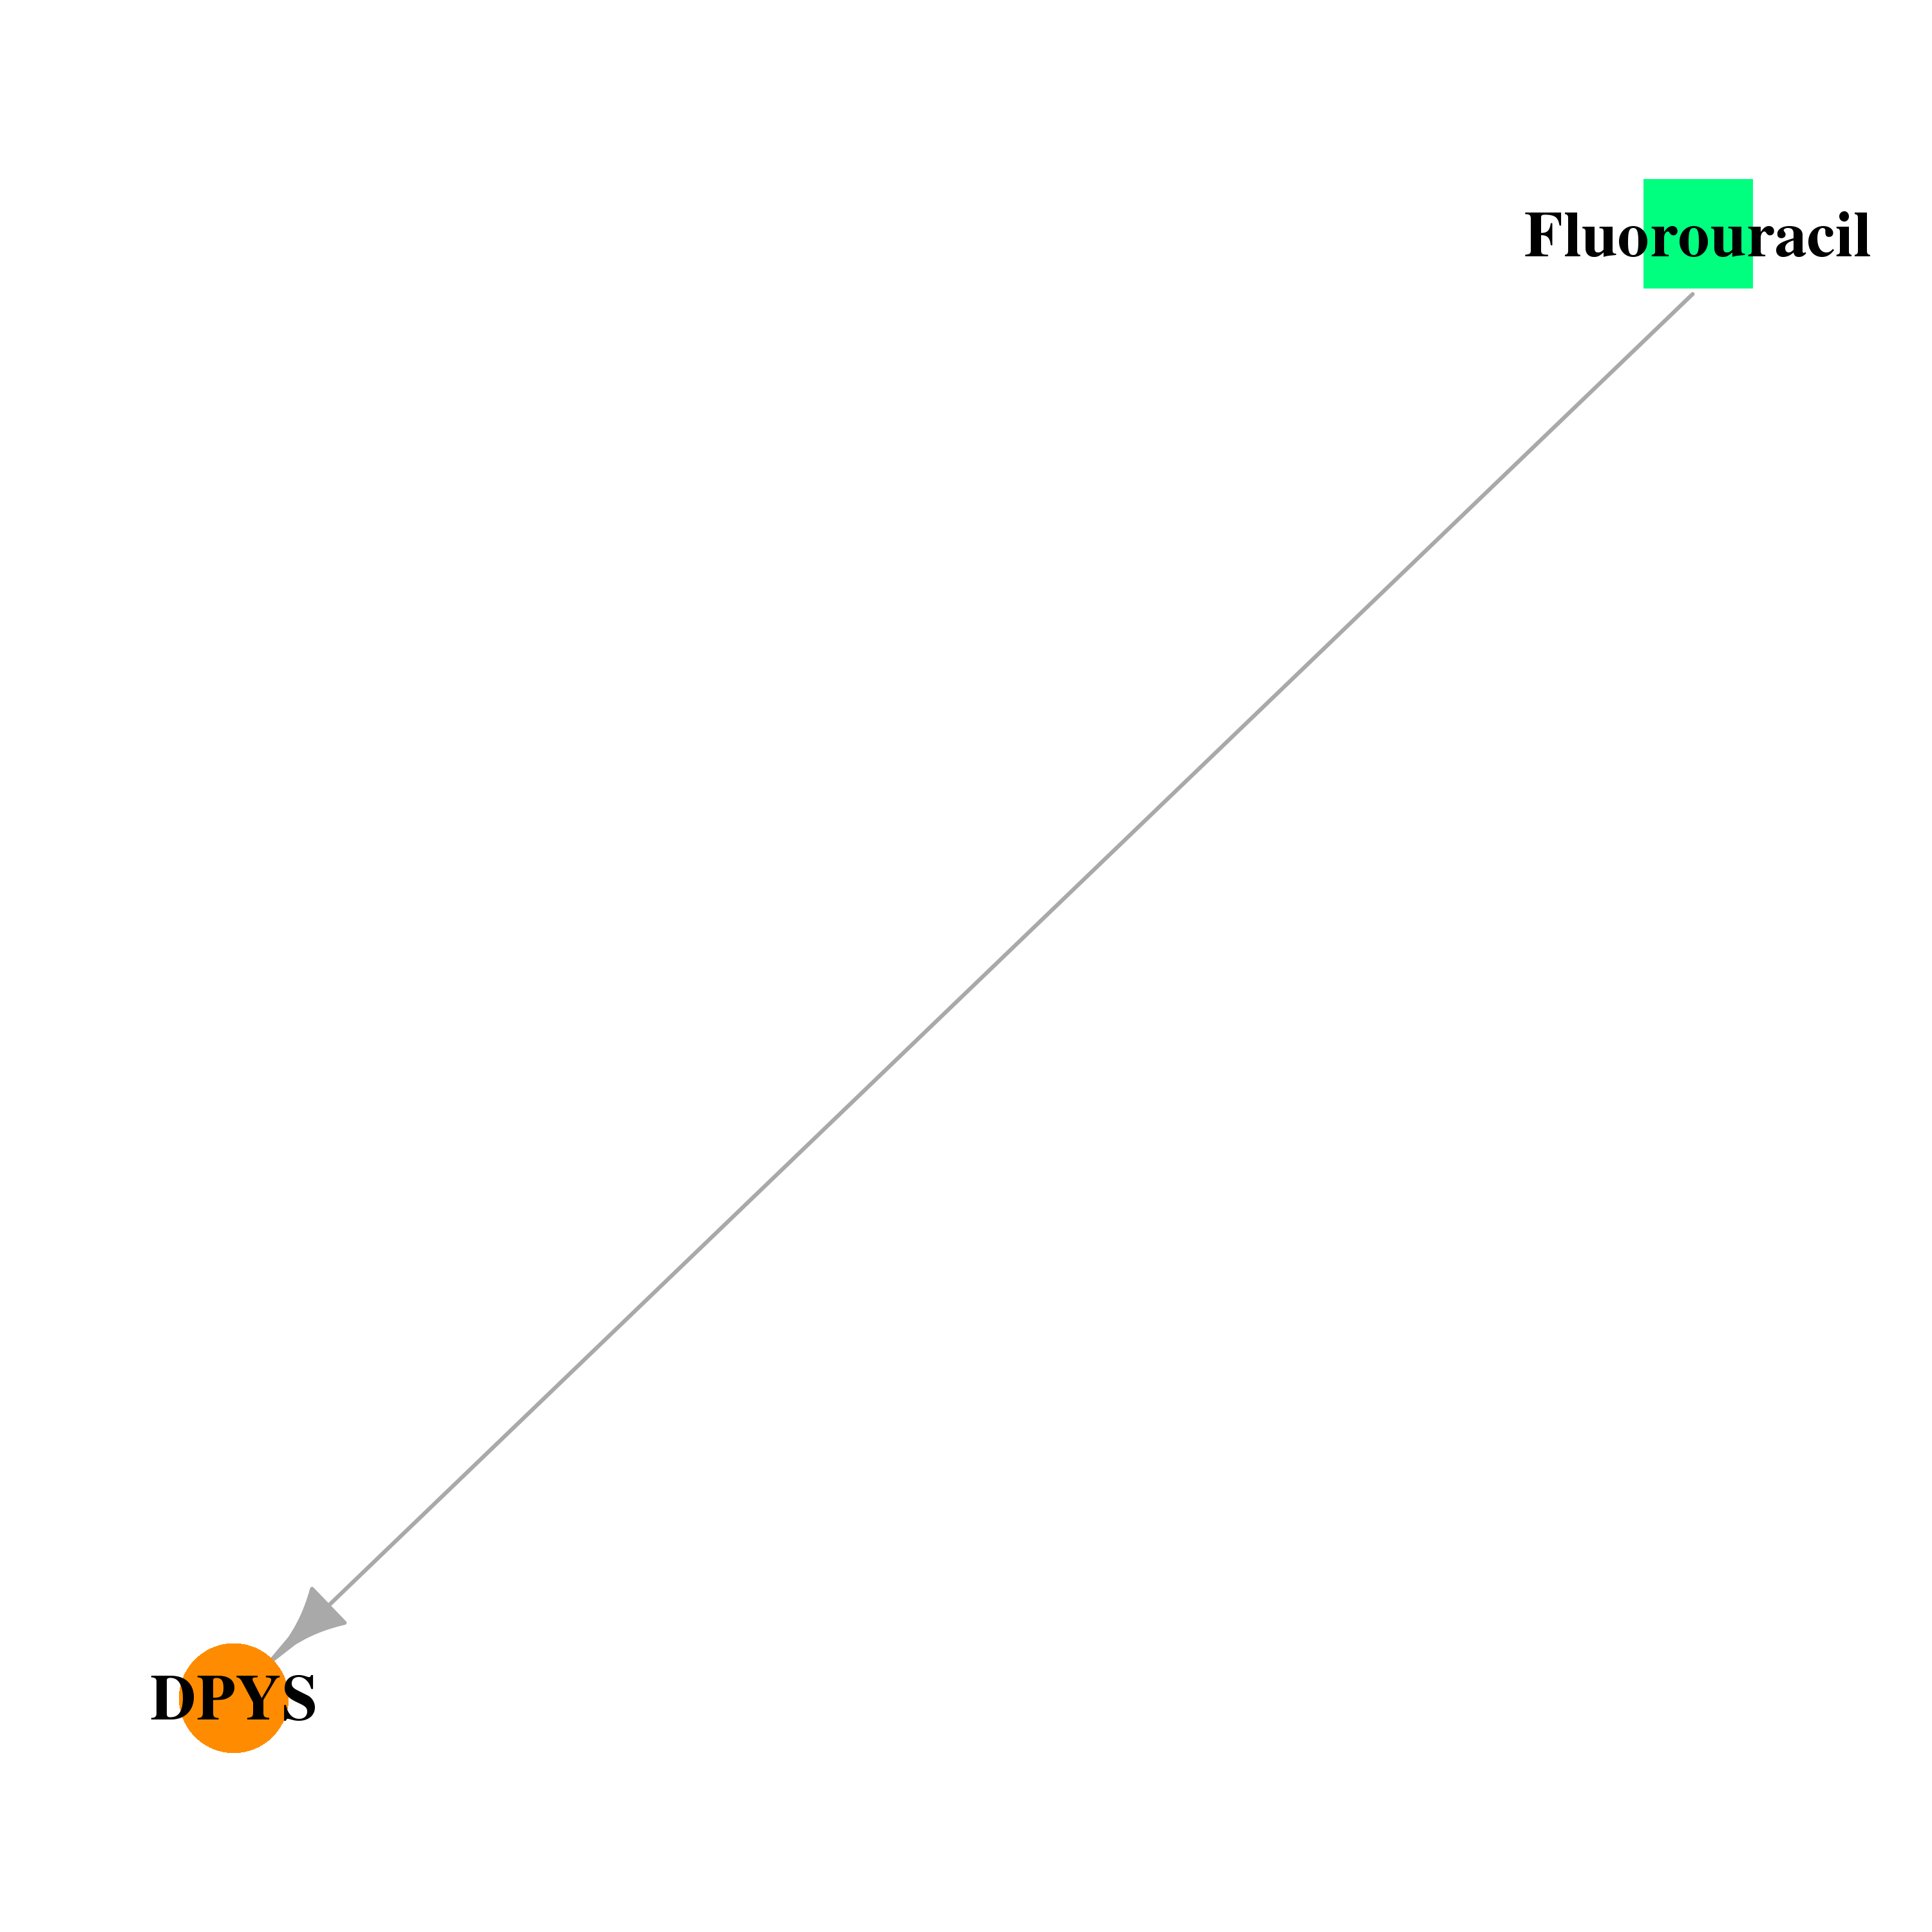 |
| * Drug Centered Interaction Network. |
| DrugBank ID | Target Name | Drug Groups | Generic Name | Drug Centered Network | Drug Structure |
| DB00544 | dihydropyrimidinase | approved | Fluorouracil |  |  |
| Top |
| Cross referenced IDs for DPYS |
| * We obtained these cross-references from Uniprot database. It covers 150 different DBs, 18 categories. http://www.uniprot.org/help/cross_references_section |
: Open all cross reference information
|
Copyright © 2016-Present - The Univsersity of Texas Health Science Center at Houston @ |