|
|||||||||||||||||||||||||||||||||||||||||||||||||||||||||||||||||||||||||||||||||||||||||||||||||||||||||||||||||||||||||||||||||||||||||||||||||||||||||||||||||||||||||||||||||||||||||||||||||||||||||||||||||||||||||||||||||||||||||||||||||||||||||||||||||||||||||||||||||||||||||||||||||||||||||||||||||||||||||||||||||||||||||||||||||||||||||||||||||||||
| |
| Phenotypic Information (metabolism pathway, cancer, disease, phenome) |
| |
| |
| Gene-Gene Network Information: Co-Expression Network, Interacting Genes & KEGG |
| |
|


| Gene Summary for TYMP |
| Top |
| Phenotypic Information for TYMP(metabolism pathway, cancer, disease, phenome) |
| Cancer | CGAP: TYMP |
| Familial Cancer Database: TYMP | |
| * This gene is included in those cancer gene databases. |
|
|
|
|
|
| . | |||||||||||||||||||||||||||||||||||||||||||||||||||||||||||||||||||||||||||||||||||||||||||||||||||||||||||||||||||||||||||||||||||||||||||||||||||||||||||||||||||||||||||||||||||||||||||||||||||||||||||||||||||||||||||||||||||||||||||||||||||||||||||||||||||||||||||||||||||||||||||||||||||||||||||||||||||||||||||||||||||||||||||||||||||||||||||||||
Oncogene 1 | Significant driver gene in | ||||||||||||||||||||||||||||||||||||||||||||||||||||||||||||||||||||||||||||||||||||||||||||||||||||||||||||||||||||||||||||||||||||||||||||||||||||||||||||||||||||||||||||||||||||||||||||||||||||||||||||||||||||||||||||||||||||||||||||||||||||||||||||||||||||||||||||||||||||||||||||||||||||||||||||||||||||||||||||||||||||||||||||||||||||||||||||||||||||
| cf) number; DB name 1 Oncogene; http://nar.oxfordjournals.org/content/35/suppl_1/D721.long, 2 Tumor Suppressor gene; https://bioinfo.uth.edu/TSGene/, 3 Cancer Gene Census; http://www.nature.com/nrc/journal/v4/n3/abs/nrc1299.html, 4 CancerGenes; http://nar.oxfordjournals.org/content/35/suppl_1/D721.long, 5 Network of Cancer Gene; http://ncg.kcl.ac.uk/index.php, 1Therapeutic Vulnerabilities in Cancer; http://cbio.mskcc.org/cancergenomics/statius/ |
| KEGG_PYRIMIDINE_METABOLISM KEGG_DRUG_METABOLISM_OTHER_ENZYMES REACTOME_METABOLISM_OF_NUCLEOTIDES REACTOME_PYRIMIDINE_METABOLISM | |
| OMIM | |
| Orphanet | |
| Disease | KEGG Disease: TYMP |
| MedGen: TYMP (Human Medical Genetics with Condition) | |
| ClinVar: TYMP | |
| Phenotype | MGI: TYMP (International Mouse Phenotyping Consortium) |
| PhenomicDB: TYMP | |
| Mutations for TYMP |
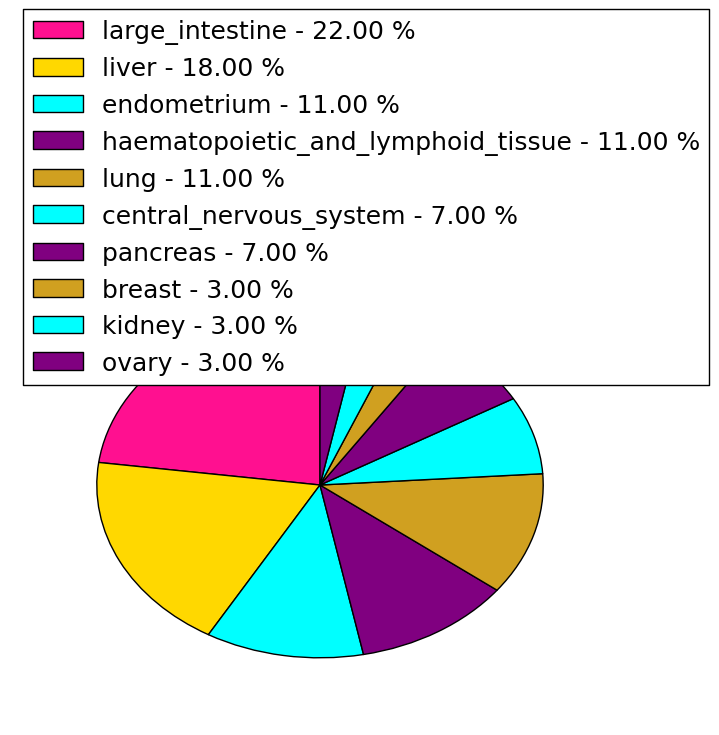
| * Under tables are showing count per each tissue to give us broad intuition about tissue specific mutation patterns.You can go to the detailed page for each mutation database's web site. |
| There's no structural variation information in COSMIC data for this gene. |
| * From mRNA Sanger sequences, Chitars2.0 arranged chimeric transcripts. This table shows TYMP related fusion information. |
| ID | Head Gene | Tail Gene | Accession | Gene_a | qStart_a | qEnd_a | Chromosome_a | tStart_a | tEnd_a | Gene_a | qStart_a | qEnd_a | Chromosome_a | tStart_a | tEnd_a |
| Top |
| Mutation type/ Tissue ID | brca | cns | cerv | endome | haematopo | kidn | Lintest | liver | lung | ns | ovary | pancre | prost | skin | stoma | thyro | urina | |||
| Total # sample | 1 | |||||||||||||||||||
| GAIN (# sample) | ||||||||||||||||||||
| LOSS (# sample) | 1 |
| cf) Tissue ID; Tissue type (1; Breast, 2; Central_nervous_system, 3; Cervix, 4; Endometrium, 5; Haematopoietic_and_lymphoid_tissue, 6; Kidney, 7; Large_intestine, 8; Liver, 9; Lung, 10; NS, 11; Ovary, 12; Pancreas, 13; Prostate, 14; Skin, 15; Stomach, 16; Thyroid, 17; Urinary_tract) |
| Top |
|
 |
| Top |
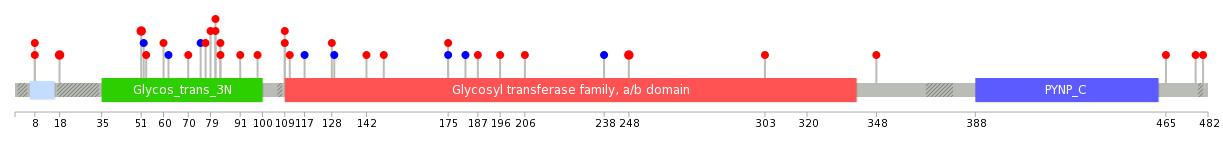
| Stat. for Non-Synonymous SNVs (# total SNVs=27) | (# total SNVs=6) |
 |  |
(# total SNVs=0) | (# total SNVs=0) |
| Top |
| * When you move the cursor on each content, you can see more deailed mutation information on the Tooltip. Those are primary_site,primary_histology,mutation(aa),pubmedID. |
| GRCh37 position | Mutation(aa) | Unique sampleID count |
| chr22:50967656-50967656 | p.R109H | 2 |
| chr22:50967988-50967988 | p.E51K | 2 |
| chr22:50965616-50965616 | p.A248D | 2 |
| chr22:50968085-50968085 | p.F18L | 2 |
| chr22:50968116-50968116 | p.G8A | 2 |
| chr22:50966102-50966102 | p.Q187H | 1 |
| chr22:50964209-50964209 | p.P480Q | 1 |
| chr22:50967953-50967953 | p.V62V | 1 |
| chr22:50966117-50966117 | p.C182C | 1 |
| chr22:50967689-50967689 | p.S98W | 1 |
| Top |
|
 |
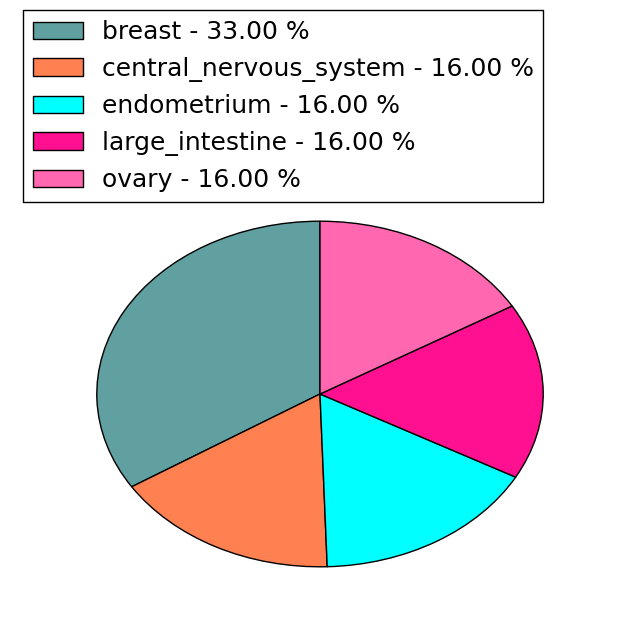
| Point Mutation/ Tissue ID | 1 | 2 | 3 | 4 | 5 | 6 | 7 | 8 | 9 | 10 | 11 | 12 | 13 | 14 | 15 | 16 | 17 | 18 | 19 | 20 |
| # sample | 1 | 1 | 4 | 1 | 2 | 1 | 1 | 1 | 1 | 4 | 1 | 3 | ||||||||
| # mutation | 1 | 1 | 5 | 1 | 2 | 1 | 1 | 1 | 1 | 4 | 1 | 3 | ||||||||
| nonsynonymous SNV | 1 | 4 | 1 | 1 | 1 | 1 | 2 | 1 | 2 | |||||||||||
| synonymous SNV | 1 | 1 | 1 | 1 | 1 | 2 | 1 |
| cf) Tissue ID; Tissue type (1; BLCA[Bladder Urothelial Carcinoma], 2; BRCA[Breast invasive carcinoma], 3; CESC[Cervical squamous cell carcinoma and endocervical adenocarcinoma], 4; COAD[Colon adenocarcinoma], 5; GBM[Glioblastoma multiforme], 6; Glioma Low Grade, 7; HNSC[Head and Neck squamous cell carcinoma], 8; KICH[Kidney Chromophobe], 9; KIRC[Kidney renal clear cell carcinoma], 10; KIRP[Kidney renal papillary cell carcinoma], 11; LAML[Acute Myeloid Leukemia], 12; LUAD[Lung adenocarcinoma], 13; LUSC[Lung squamous cell carcinoma], 14; OV[Ovarian serous cystadenocarcinoma ], 15; PAAD[Pancreatic adenocarcinoma], 16; PRAD[Prostate adenocarcinoma], 17; SKCM[Skin Cutaneous Melanoma], 18:STAD[Stomach adenocarcinoma], 19:THCA[Thyroid carcinoma], 20:UCEC[Uterine Corpus Endometrial Carcinoma]) |
| Top |
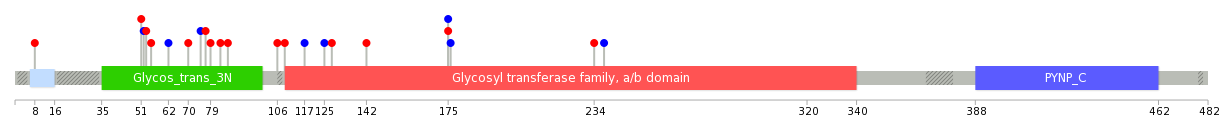
| * We represented just top 10 SNVs. When you move the cursor on each content, you can see more deailed mutation information on the Tooltip. Those are primary_site, primary_histology, mutation(aa), pubmedID. |
| Genomic Position | Mutation(aa) | Unique sampleID count |
| chr22:50967665 | p.L75L,TYMP | 1 |
| chr22:50967988 | p.G238G,TYMP | 1 |
| chr22:50965645 | p.Q70H,TYMP | 1 |
| chr22:50967726 | p.V234D,TYMP | 1 |
| chr22:50968116 | p.V62V,TYMP | 1 |
| chr22:50965658 | p.L176L,TYMP | 1 |
| chr22:50967733 | p.R55G,TYMP | 1 |
| chr22:50966137 | p.V175V,TYMP | 1 |
| chr22:50967746 | p.D53G,TYMP | 1 |
| chr22:50966138 | p.V175A,TYMP | 1 |
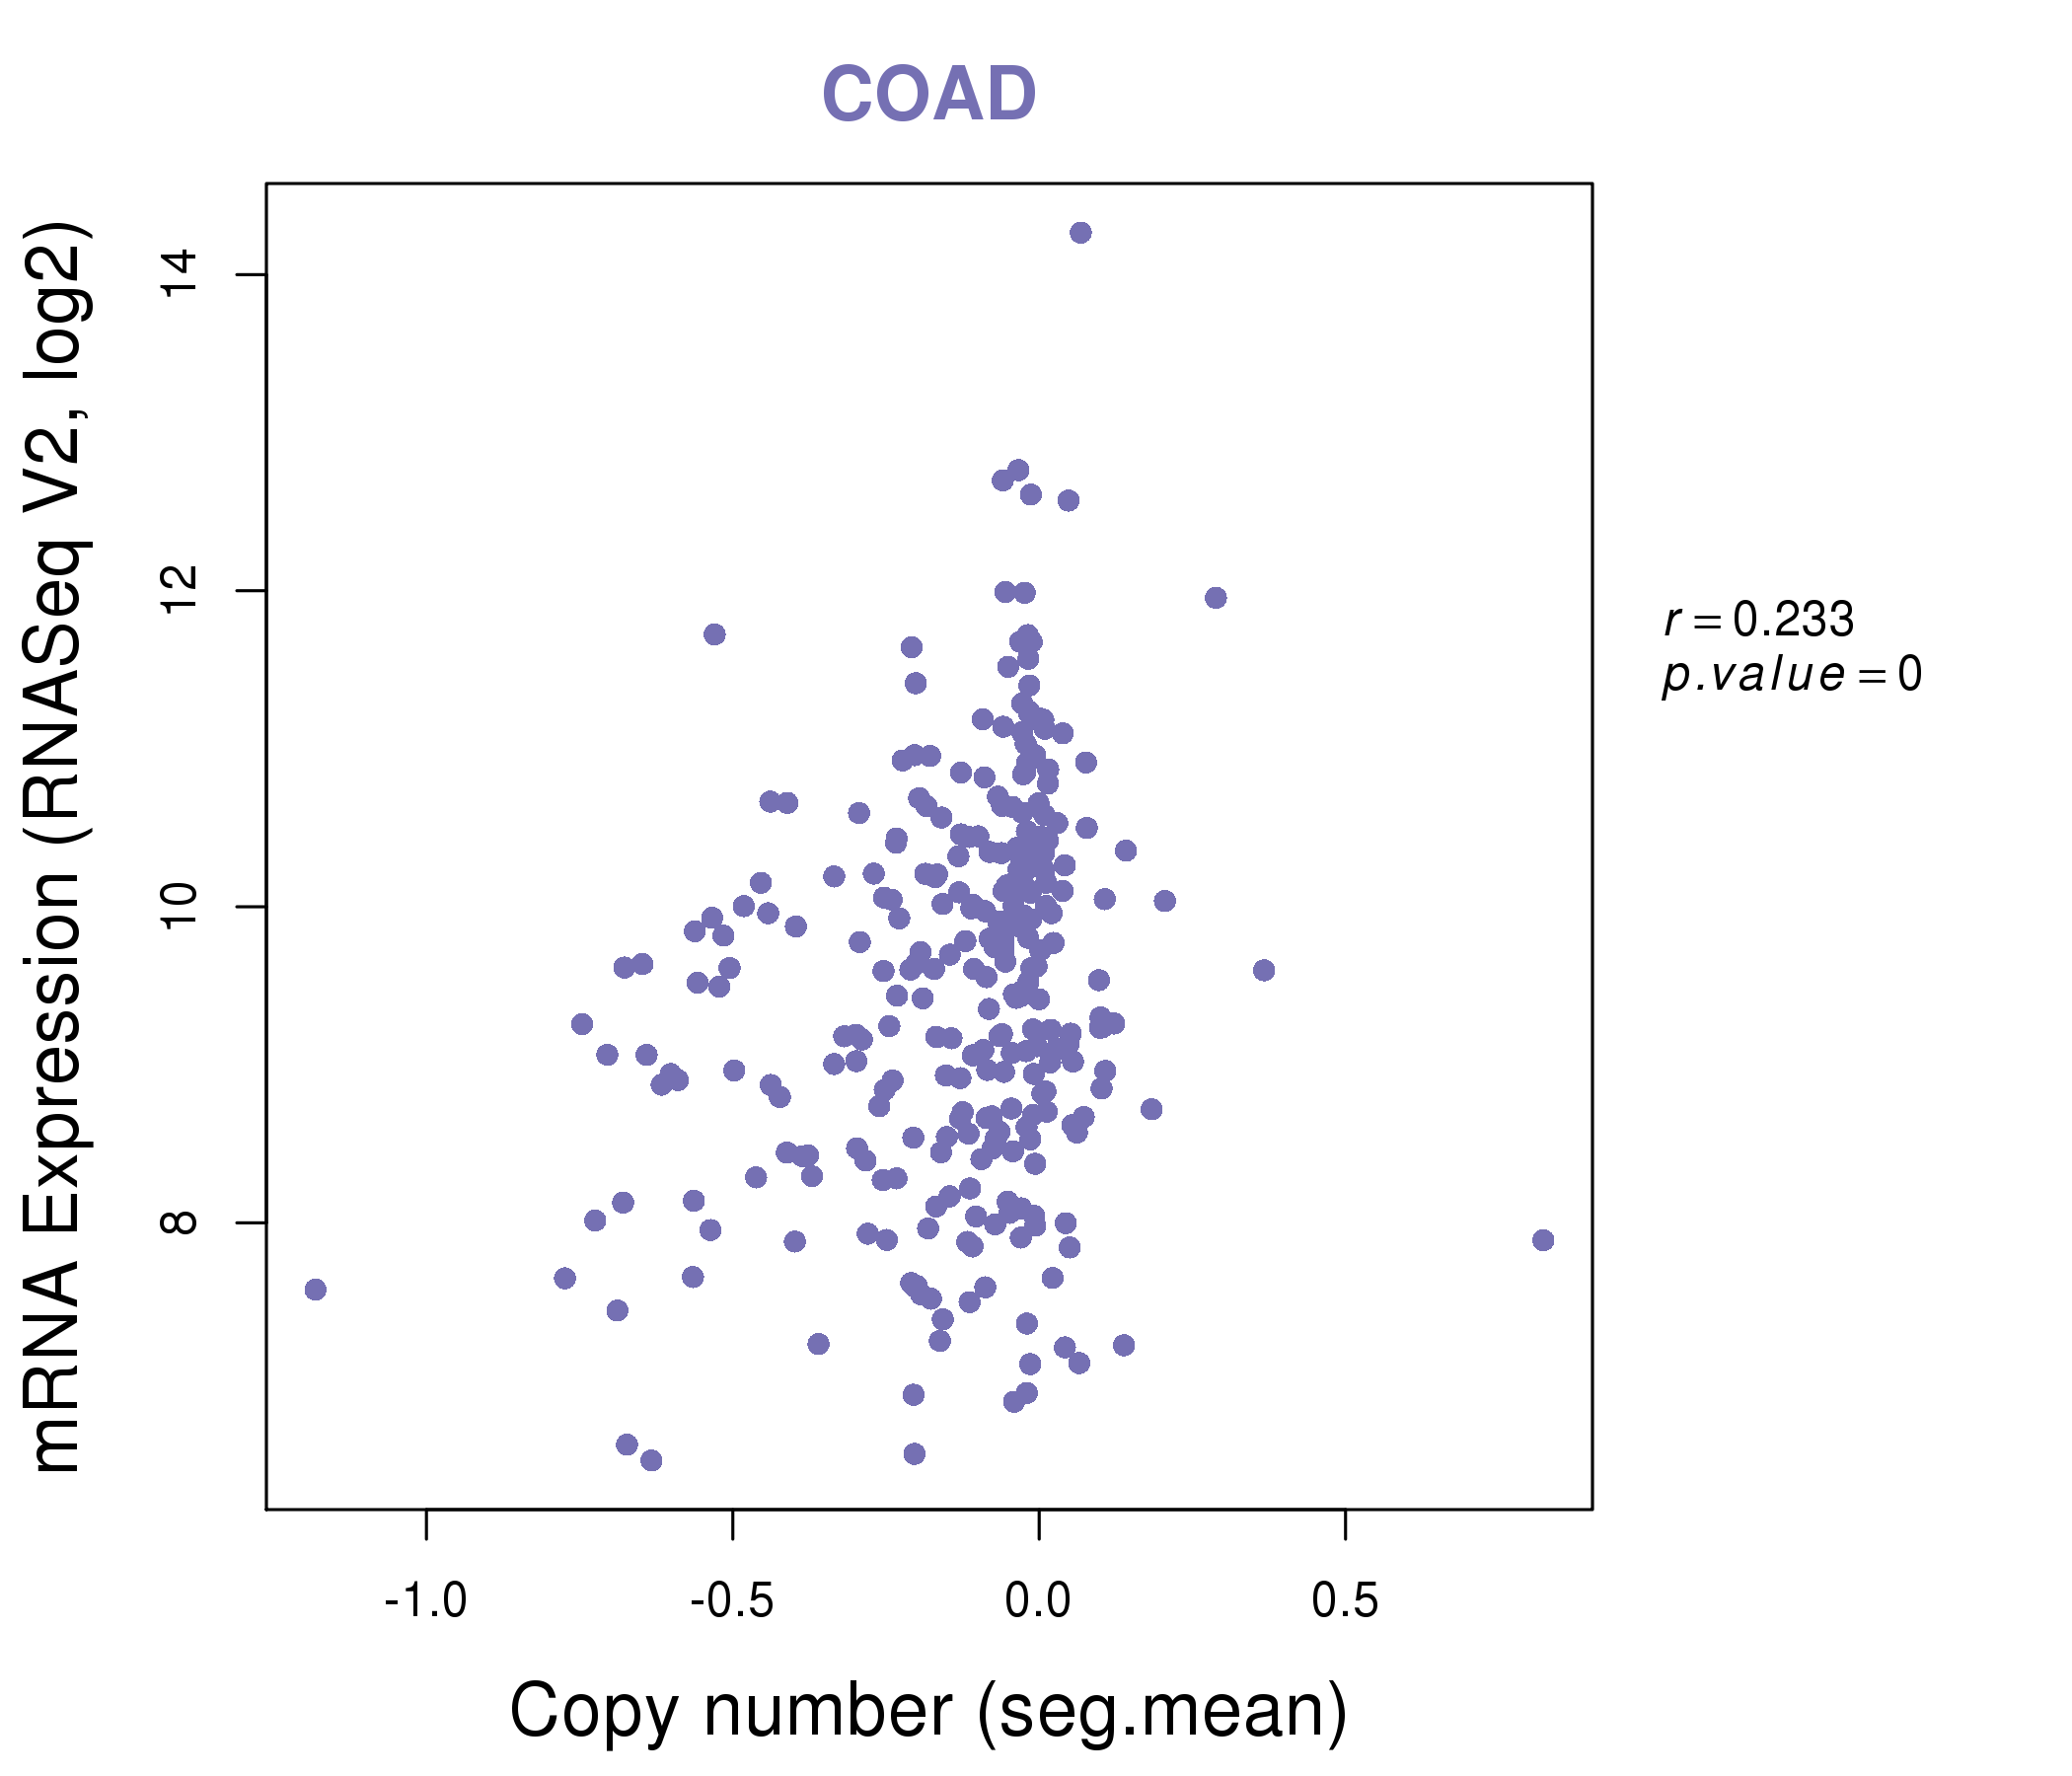
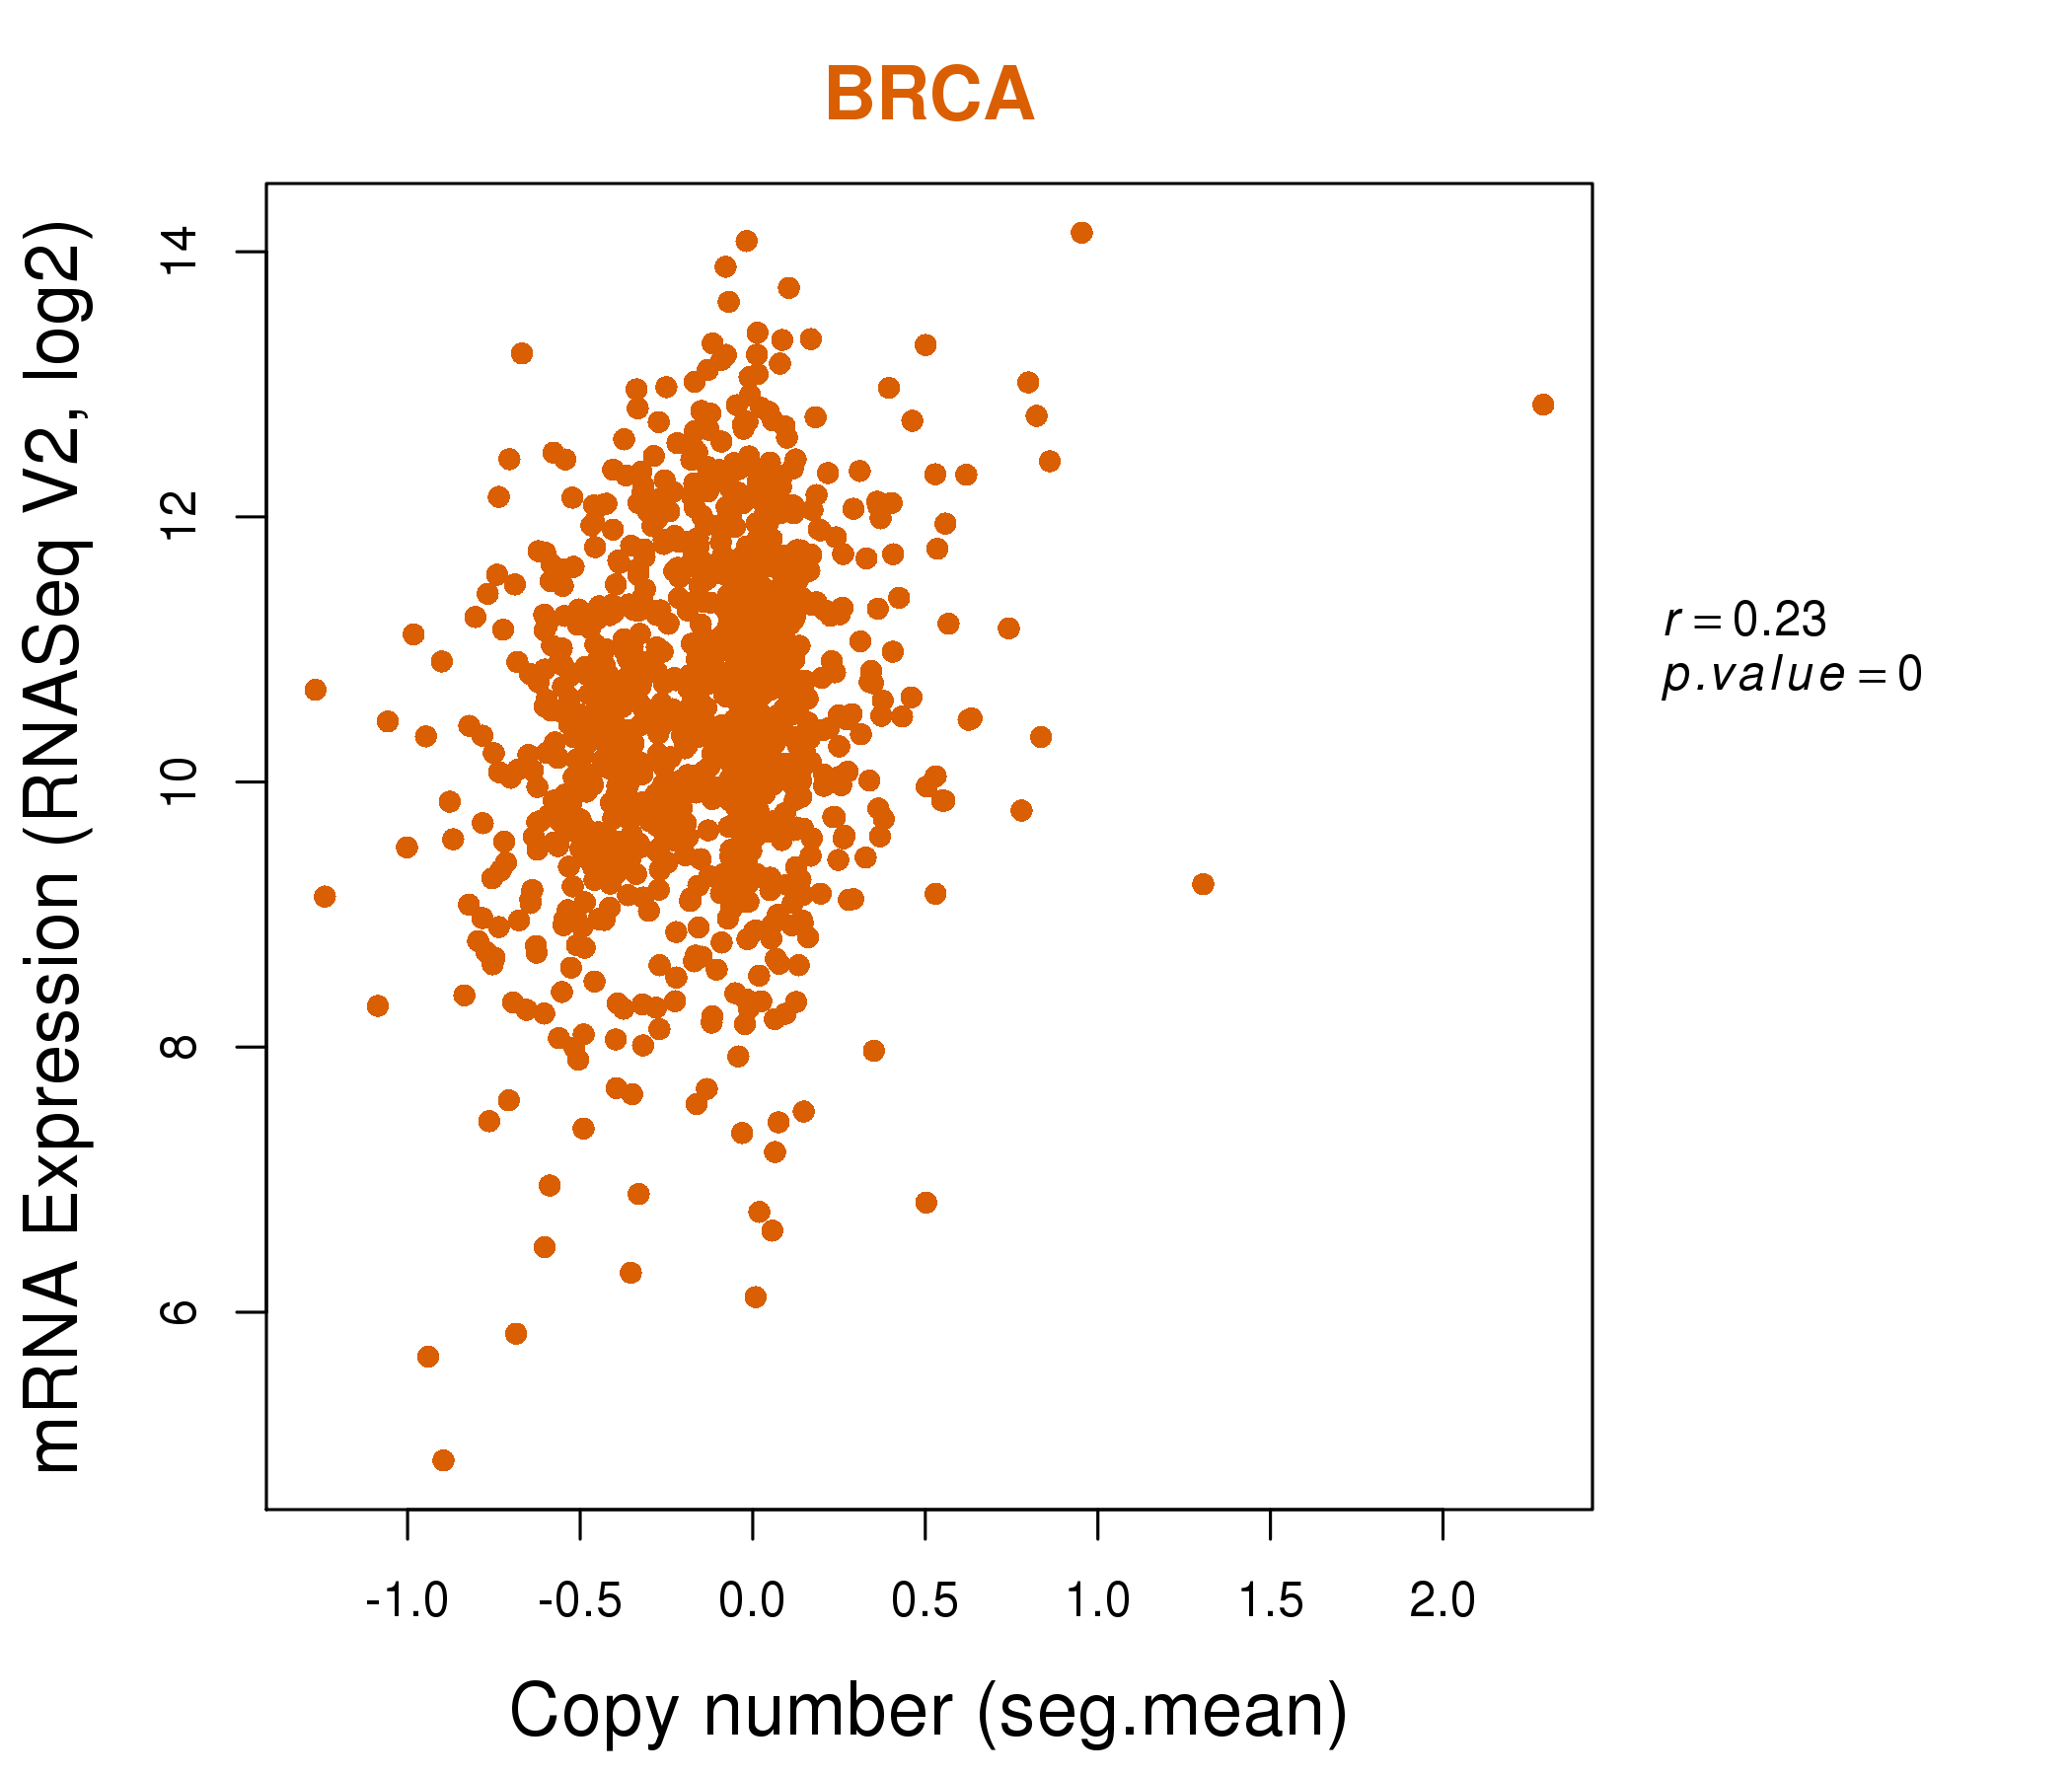
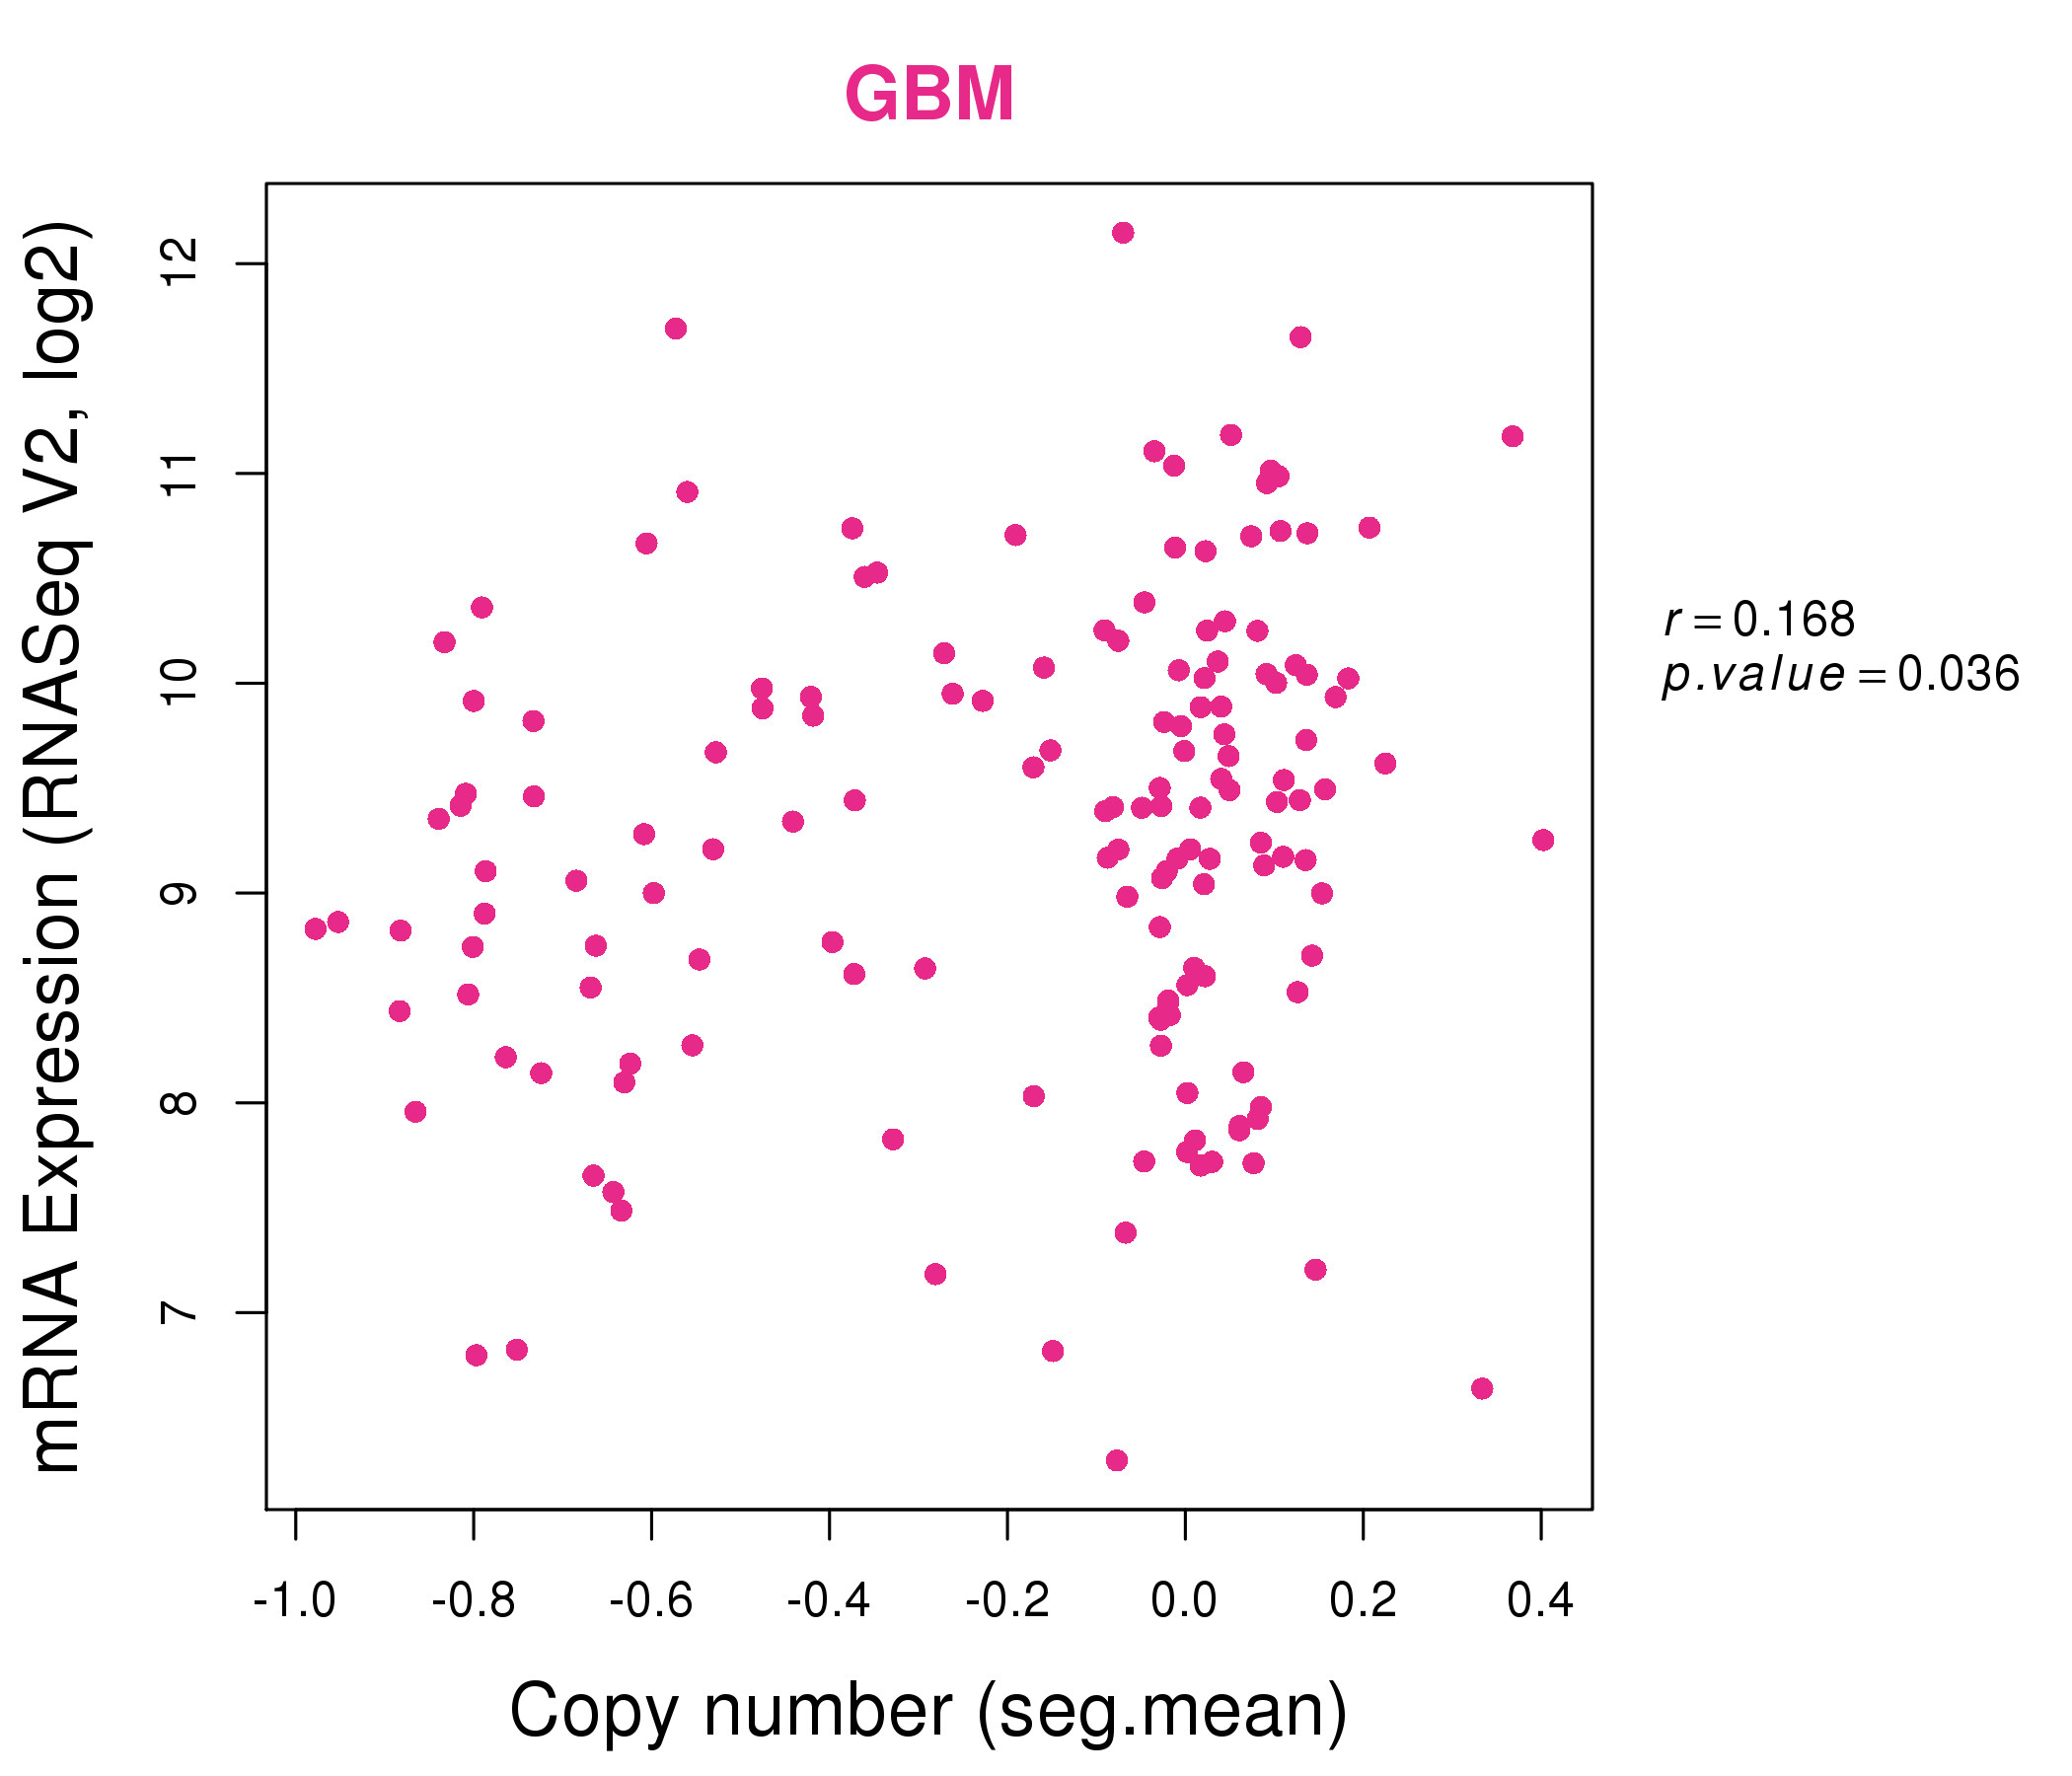
| * Copy number data were extracted from TCGA using R package TCGA-Assembler. The URLs of all public data files on TCGA DCC data server were gathered on Jan-05-2015. Function ProcessCNAData in TCGA-Assembler package was used to obtain gene-level copy number value which is calculated as the average copy number of the genomic region of a gene. |
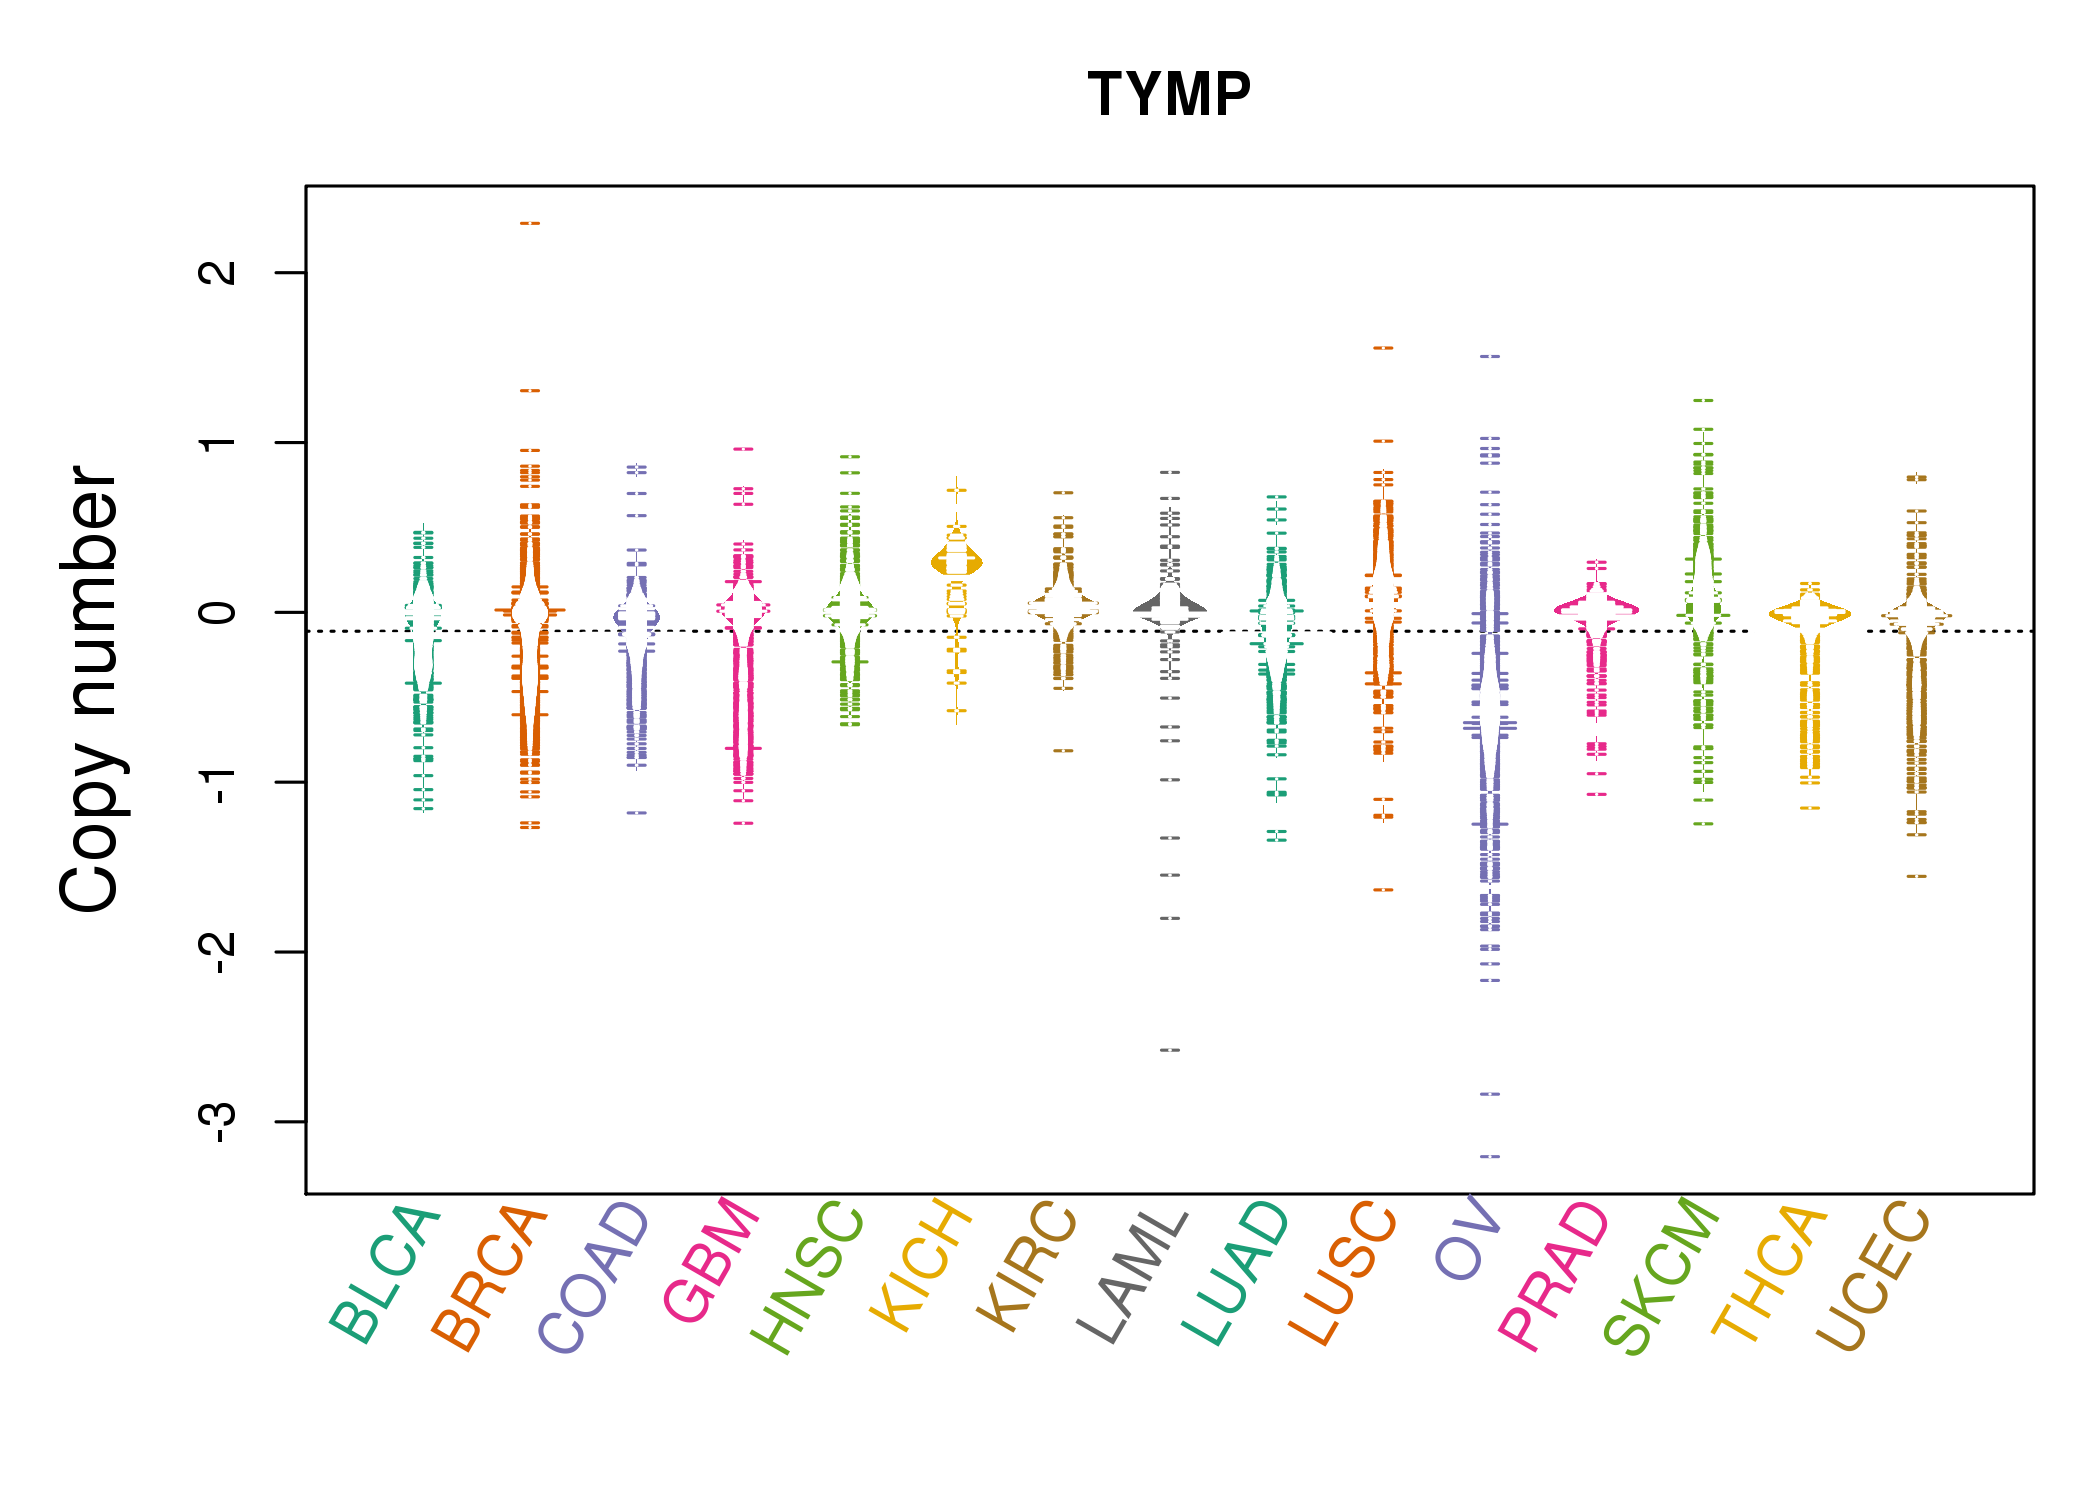 |
| cf) Tissue ID[Tissue type]: BLCA[Bladder Urothelial Carcinoma], BRCA[Breast invasive carcinoma], CESC[Cervical squamous cell carcinoma and endocervical adenocarcinoma], COAD[Colon adenocarcinoma], GBM[Glioblastoma multiforme], Glioma Low Grade, HNSC[Head and Neck squamous cell carcinoma], KICH[Kidney Chromophobe], KIRC[Kidney renal clear cell carcinoma], KIRP[Kidney renal papillary cell carcinoma], LAML[Acute Myeloid Leukemia], LUAD[Lung adenocarcinoma], LUSC[Lung squamous cell carcinoma], OV[Ovarian serous cystadenocarcinoma ], PAAD[Pancreatic adenocarcinoma], PRAD[Prostate adenocarcinoma], SKCM[Skin Cutaneous Melanoma], STAD[Stomach adenocarcinoma], THCA[Thyroid carcinoma], UCEC[Uterine Corpus Endometrial Carcinoma] |
| Top |
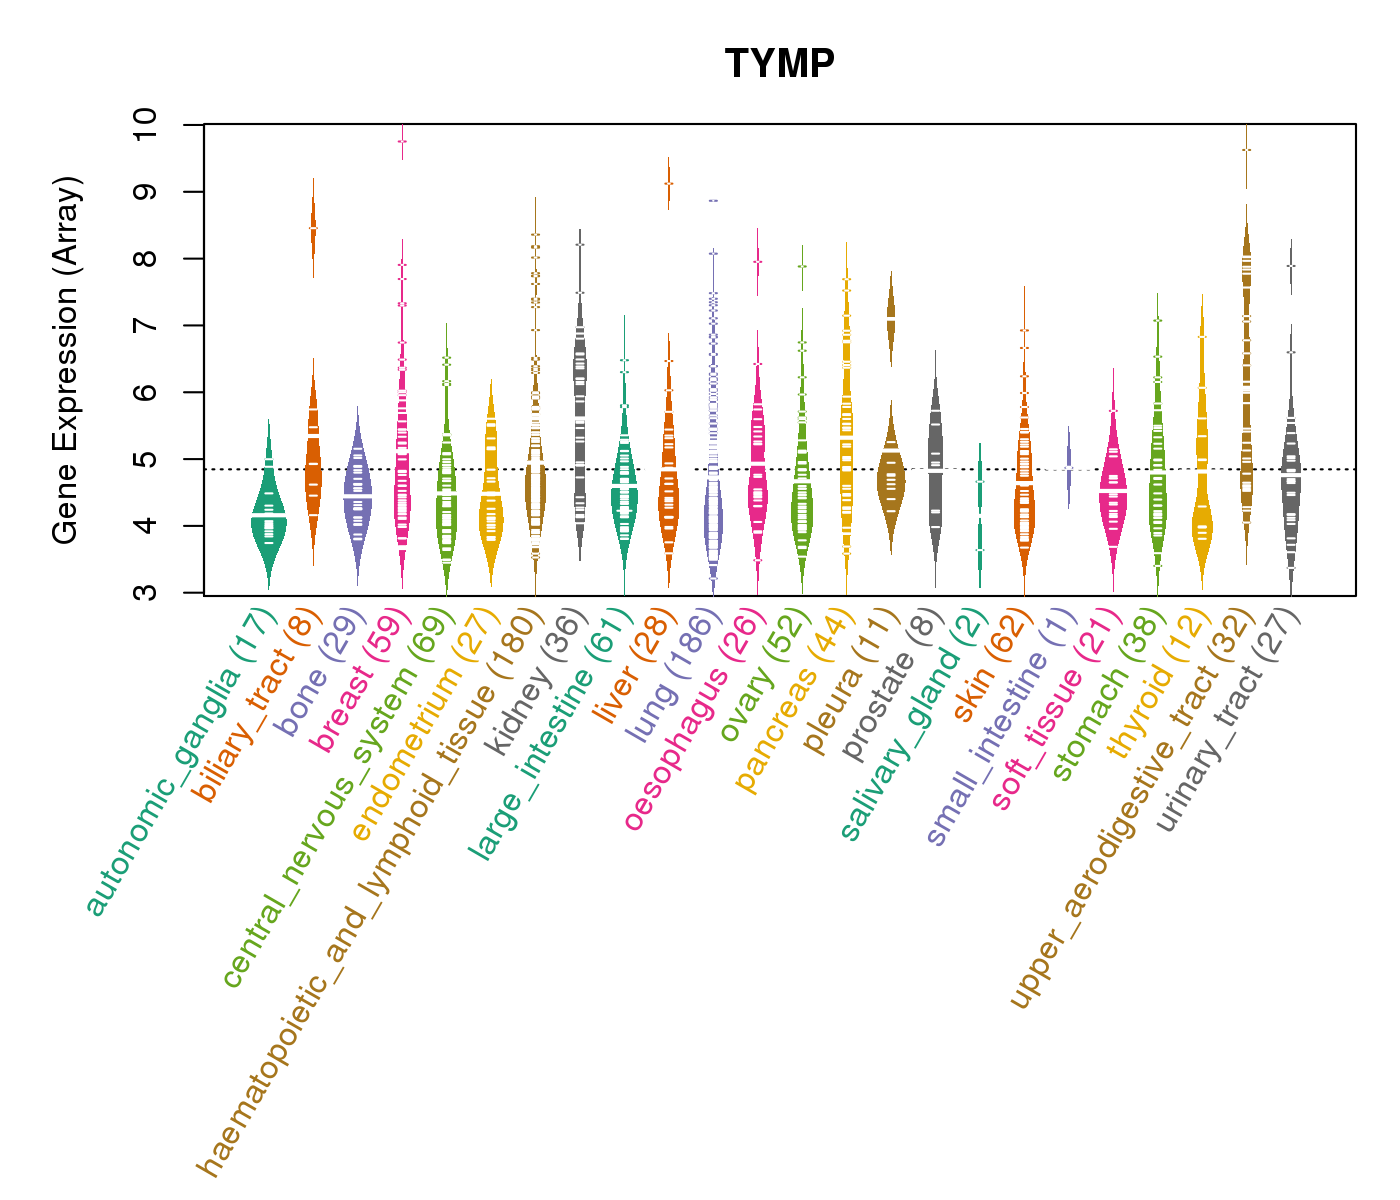
| Gene Expression for TYMP |
| * CCLE gene expression data were extracted from CCLE_Expression_Entrez_2012-10-18.res: Gene-centric RMA-normalized mRNA expression data. |
 |
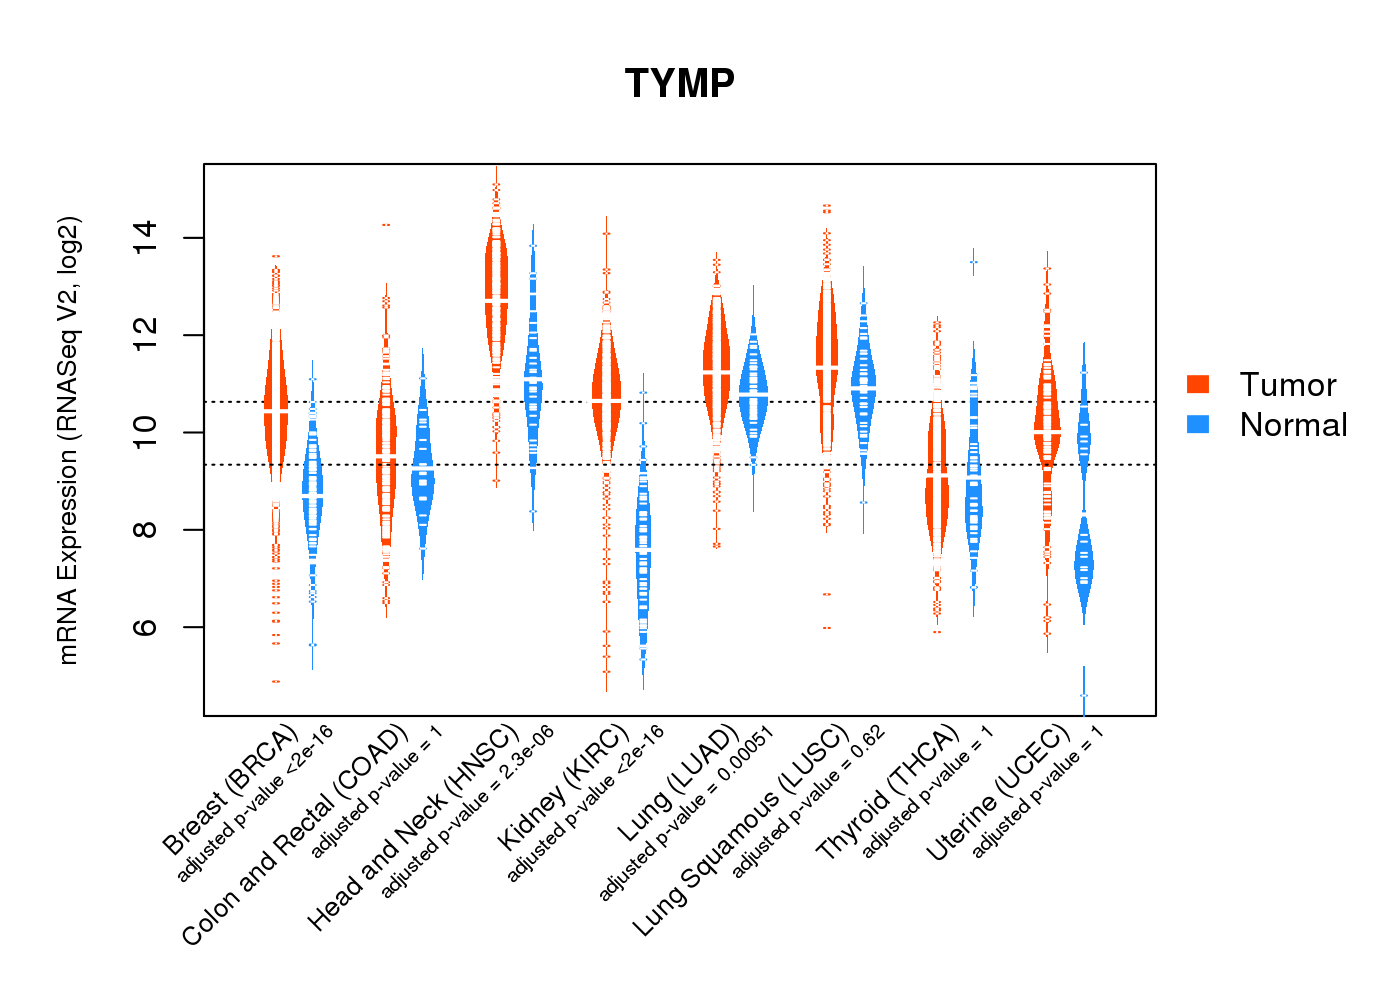
| * Normalized gene expression data of RNASeqV2 was extracted from TCGA using R package TCGA-Assembler. The URLs of all public data files on TCGA DCC data server were gathered at Jan-05-2015. Only eight cancer types have enough normal control samples for differential expression analysis. (t test, adjusted p<0.05 (using Benjamini-Hochberg FDR)) |
 |
| Top |
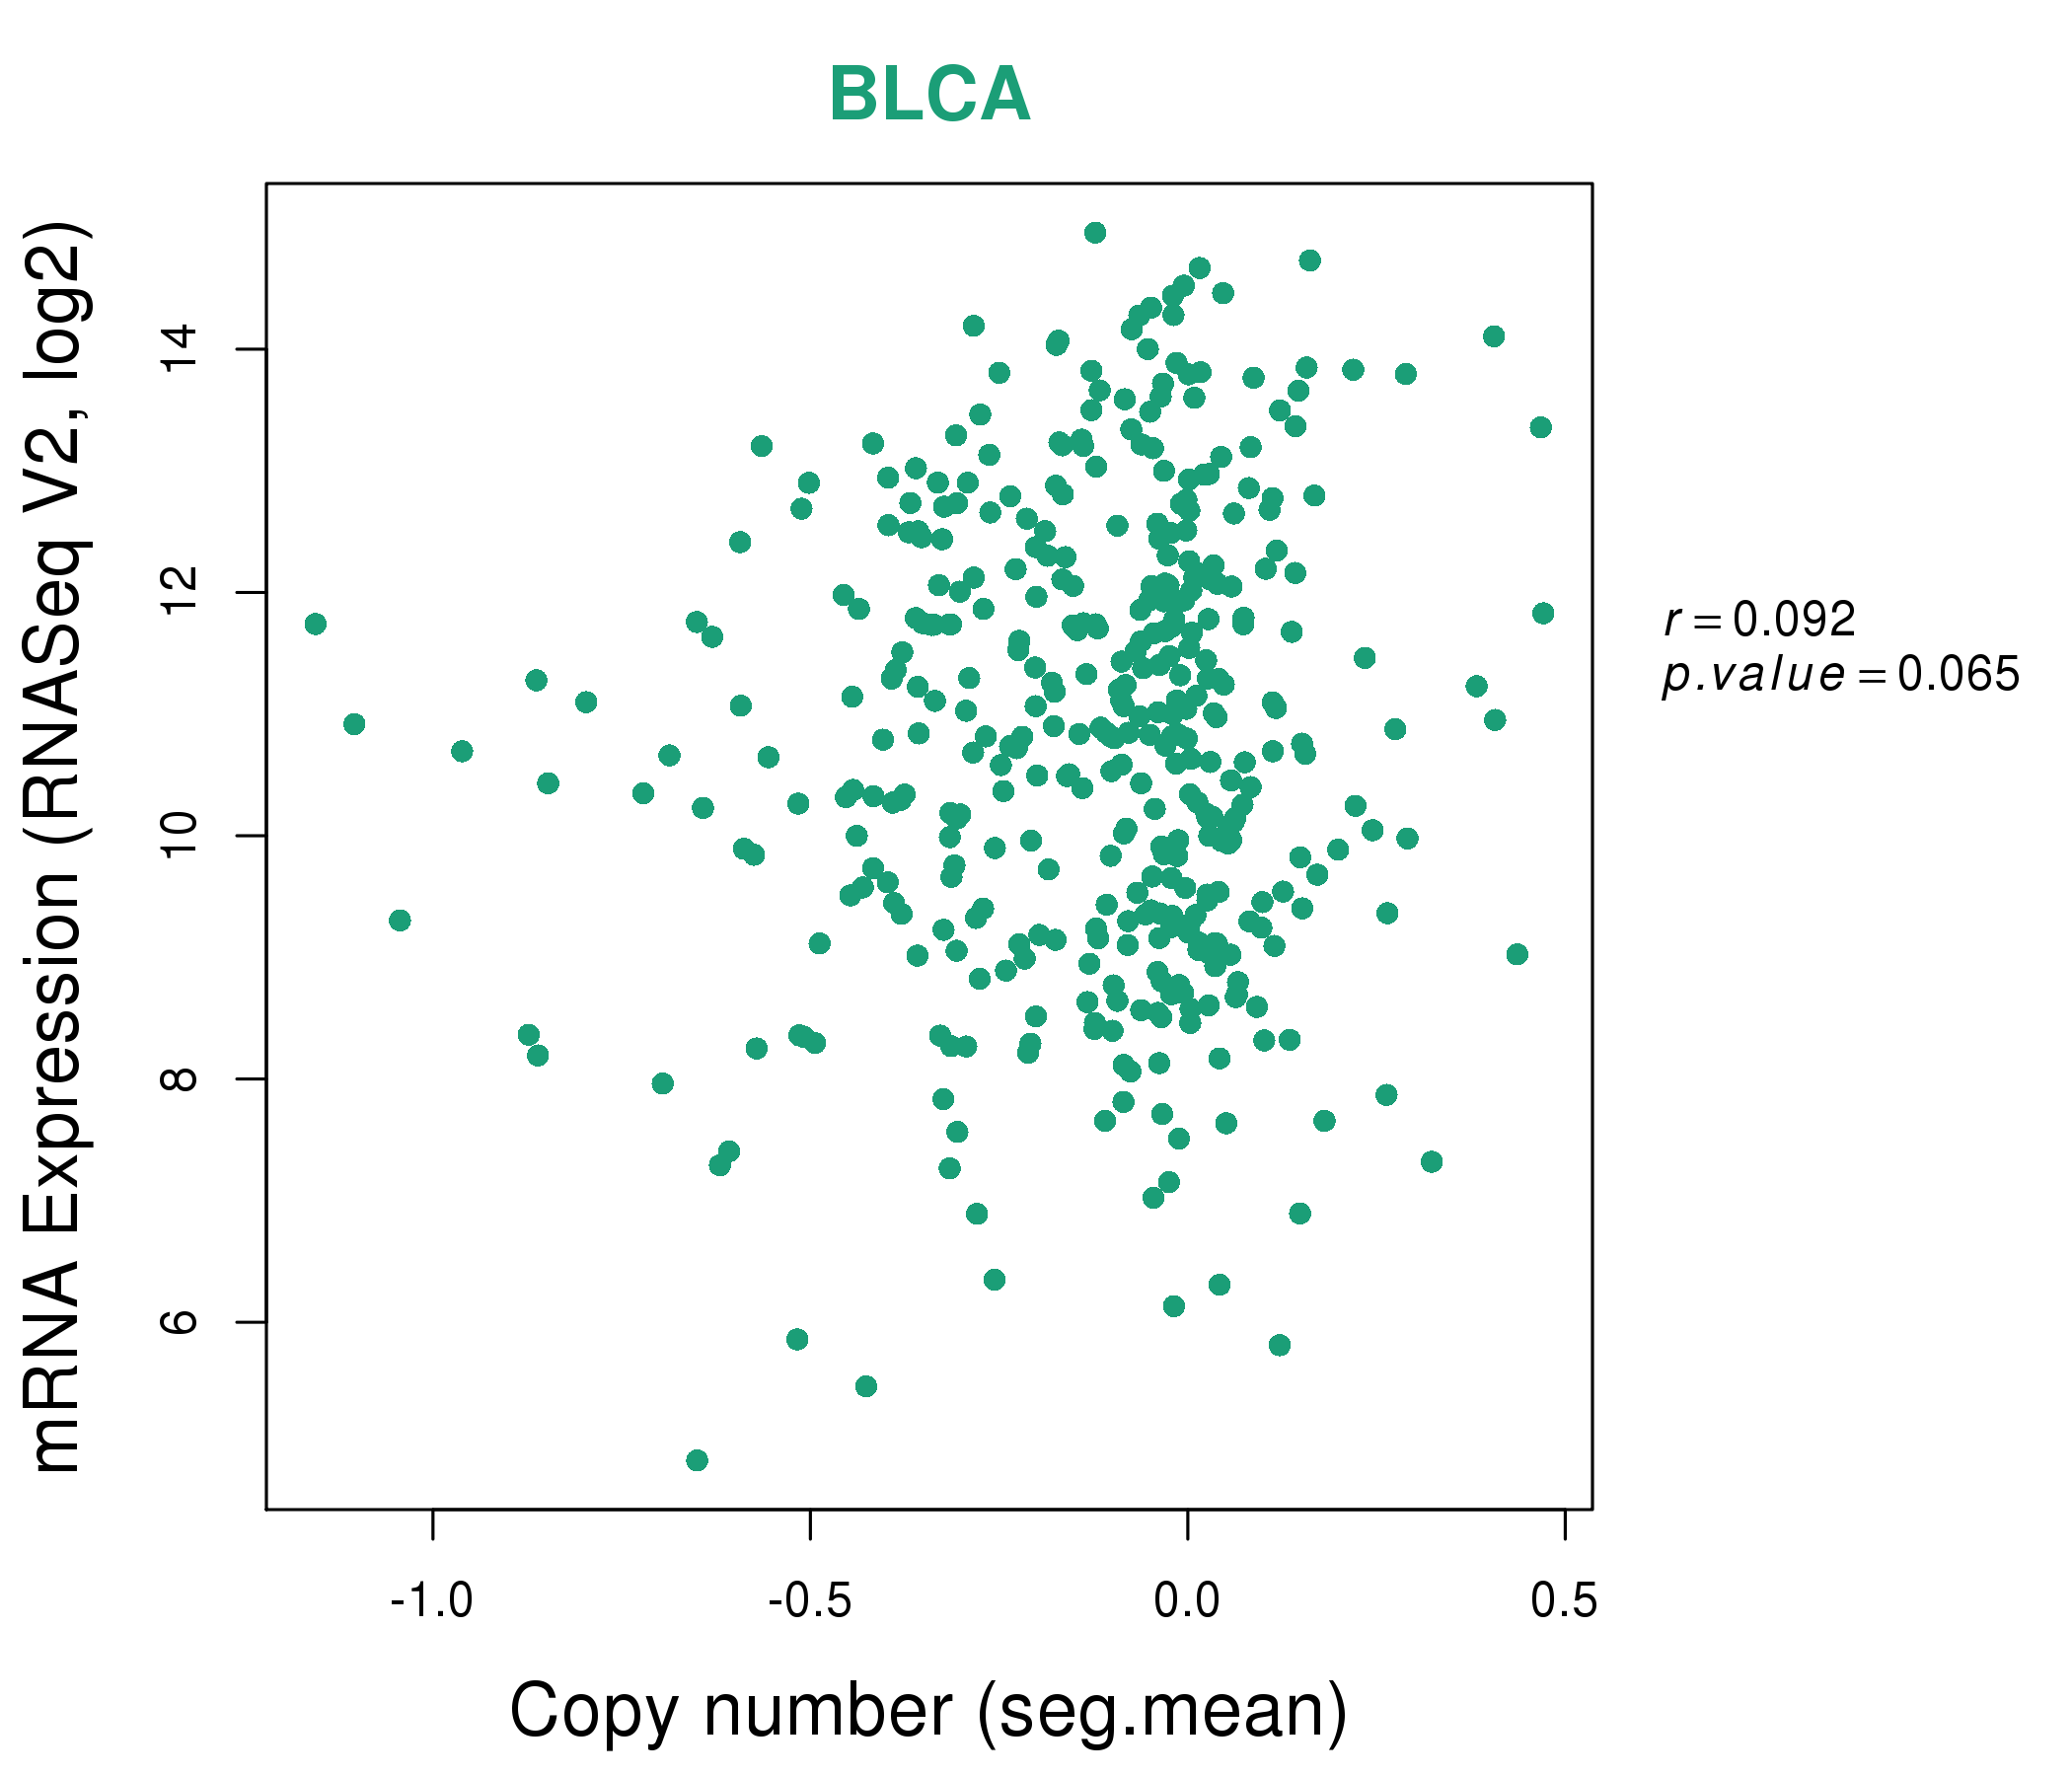
| * This plots show the correlation between CNV and gene expression. |
: Open all plots for all cancer types
 |
|
 |
|
| Top |
| Gene-Gene Network Information |
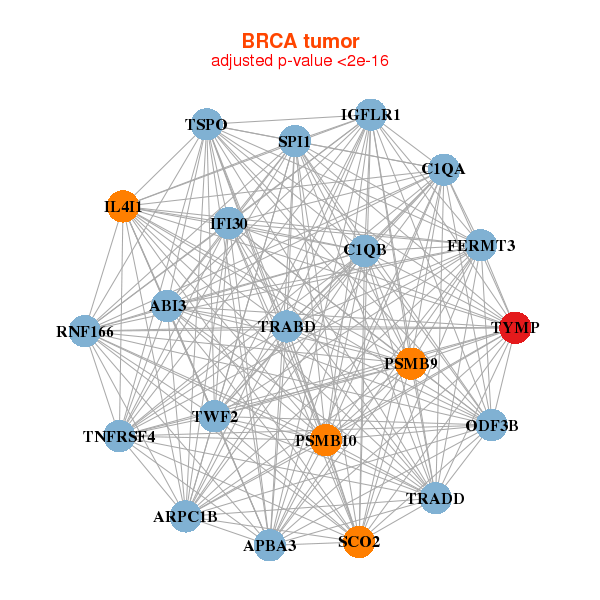
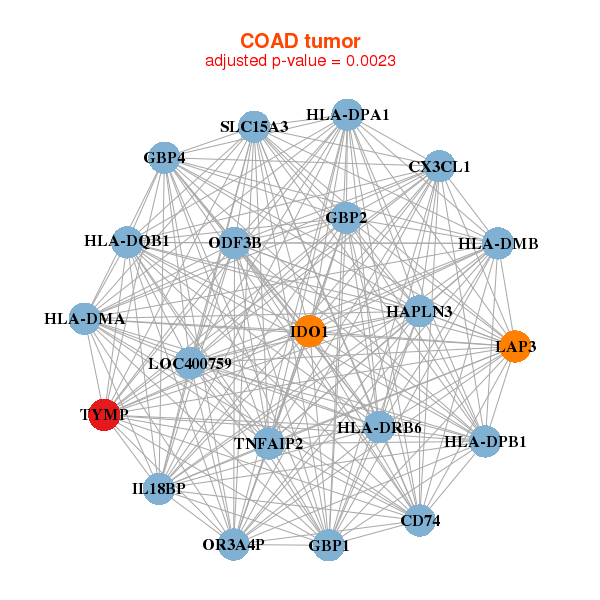
| * Co-Expression network figures were drawn using R package igraph. Only the top 20 genes with the highest correlations were shown. Red circle: input gene, orange circle: cell metabolism gene, sky circle: other gene |
: Open all plots for all cancer types
 |
| ||||
| ABI3,APBA3,ARPC1B,C1QA,C1QB,FERMT3,IFI30, IL4I1,ODF3B,PSMB10,PSMB9,RNF166,SCO2,SPI1, IGFLR1,TNFRSF4,TRABD,TRADD,TSPO,TWF2,TYMP | ADAP1,ARHGAP4,ARPC1B,C17orf62,MFSD12,CORO7,CYBA, EFHD2,GMIP,GNA15,HMHA1,MAN2B1,MVP,RGS19, RPS6KA4,SH3TC1,SHKBP1,SLC38A10,STX4,TYMP,UNC93B1 | ||||
 |
| ||||
| CD74,CX3CL1,GBP1,GBP2,GBP4,HAPLN3,HLA-DMA, HLA-DMB,HLA-DPA1,HLA-DPB1,HLA-DQB1,HLA-DRB6,IDO1,IL18BP, LAP3,LOC400759,ODF3B,OR3A4P,SLC15A3,TNFAIP2,TYMP | APOL1,CASP8,EPSTI1,FAM26F,GBP5,GRIN3A,GZMA, GZMB,IFITM1,LAP3,NUB1,PARP9,PRF1,PSMB10, PSMB9,PSME2,SAMD9L,STAT1,TAP1,TAP2,TYMP |
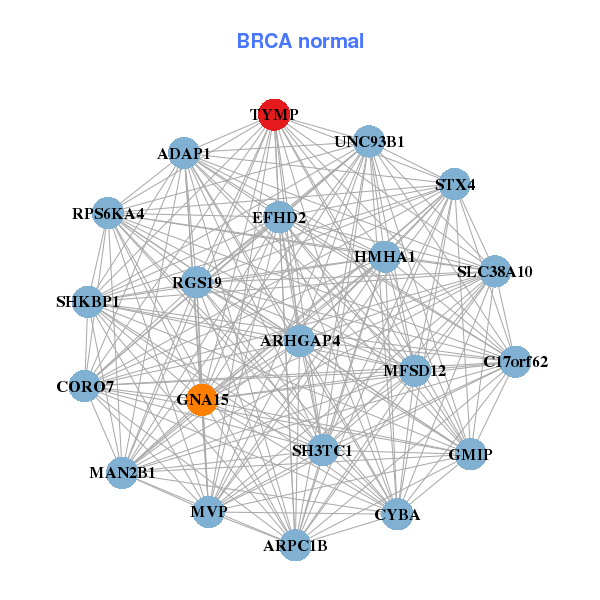
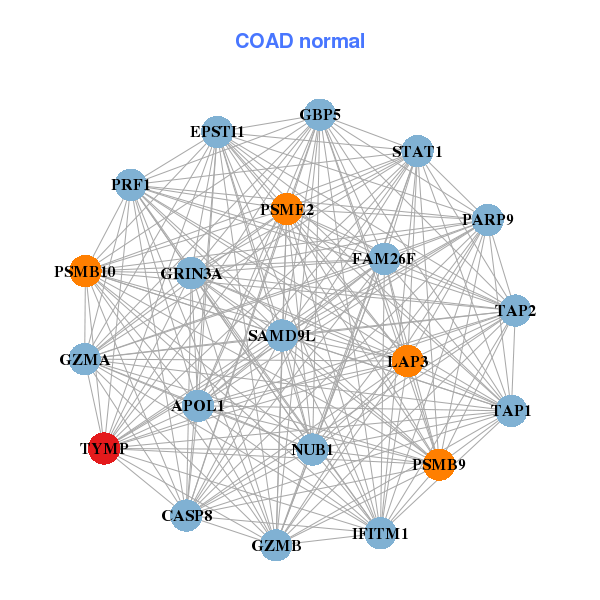
| * Co-Expression network figures were drawn using R package igraph. Only the top 20 genes with the highest correlations were shown. Red circle: input gene, orange circle: cell metabolism gene, sky circle: other gene |
: Open all plots for all cancer types
| Top |
: Open all interacting genes' information including KEGG pathway for all interacting genes from DAVID
| Top |
| Pharmacological Information for TYMP |
| DB Category | DB Name | DB's ID and Url link |
| * Gene Centered Interaction Network. |
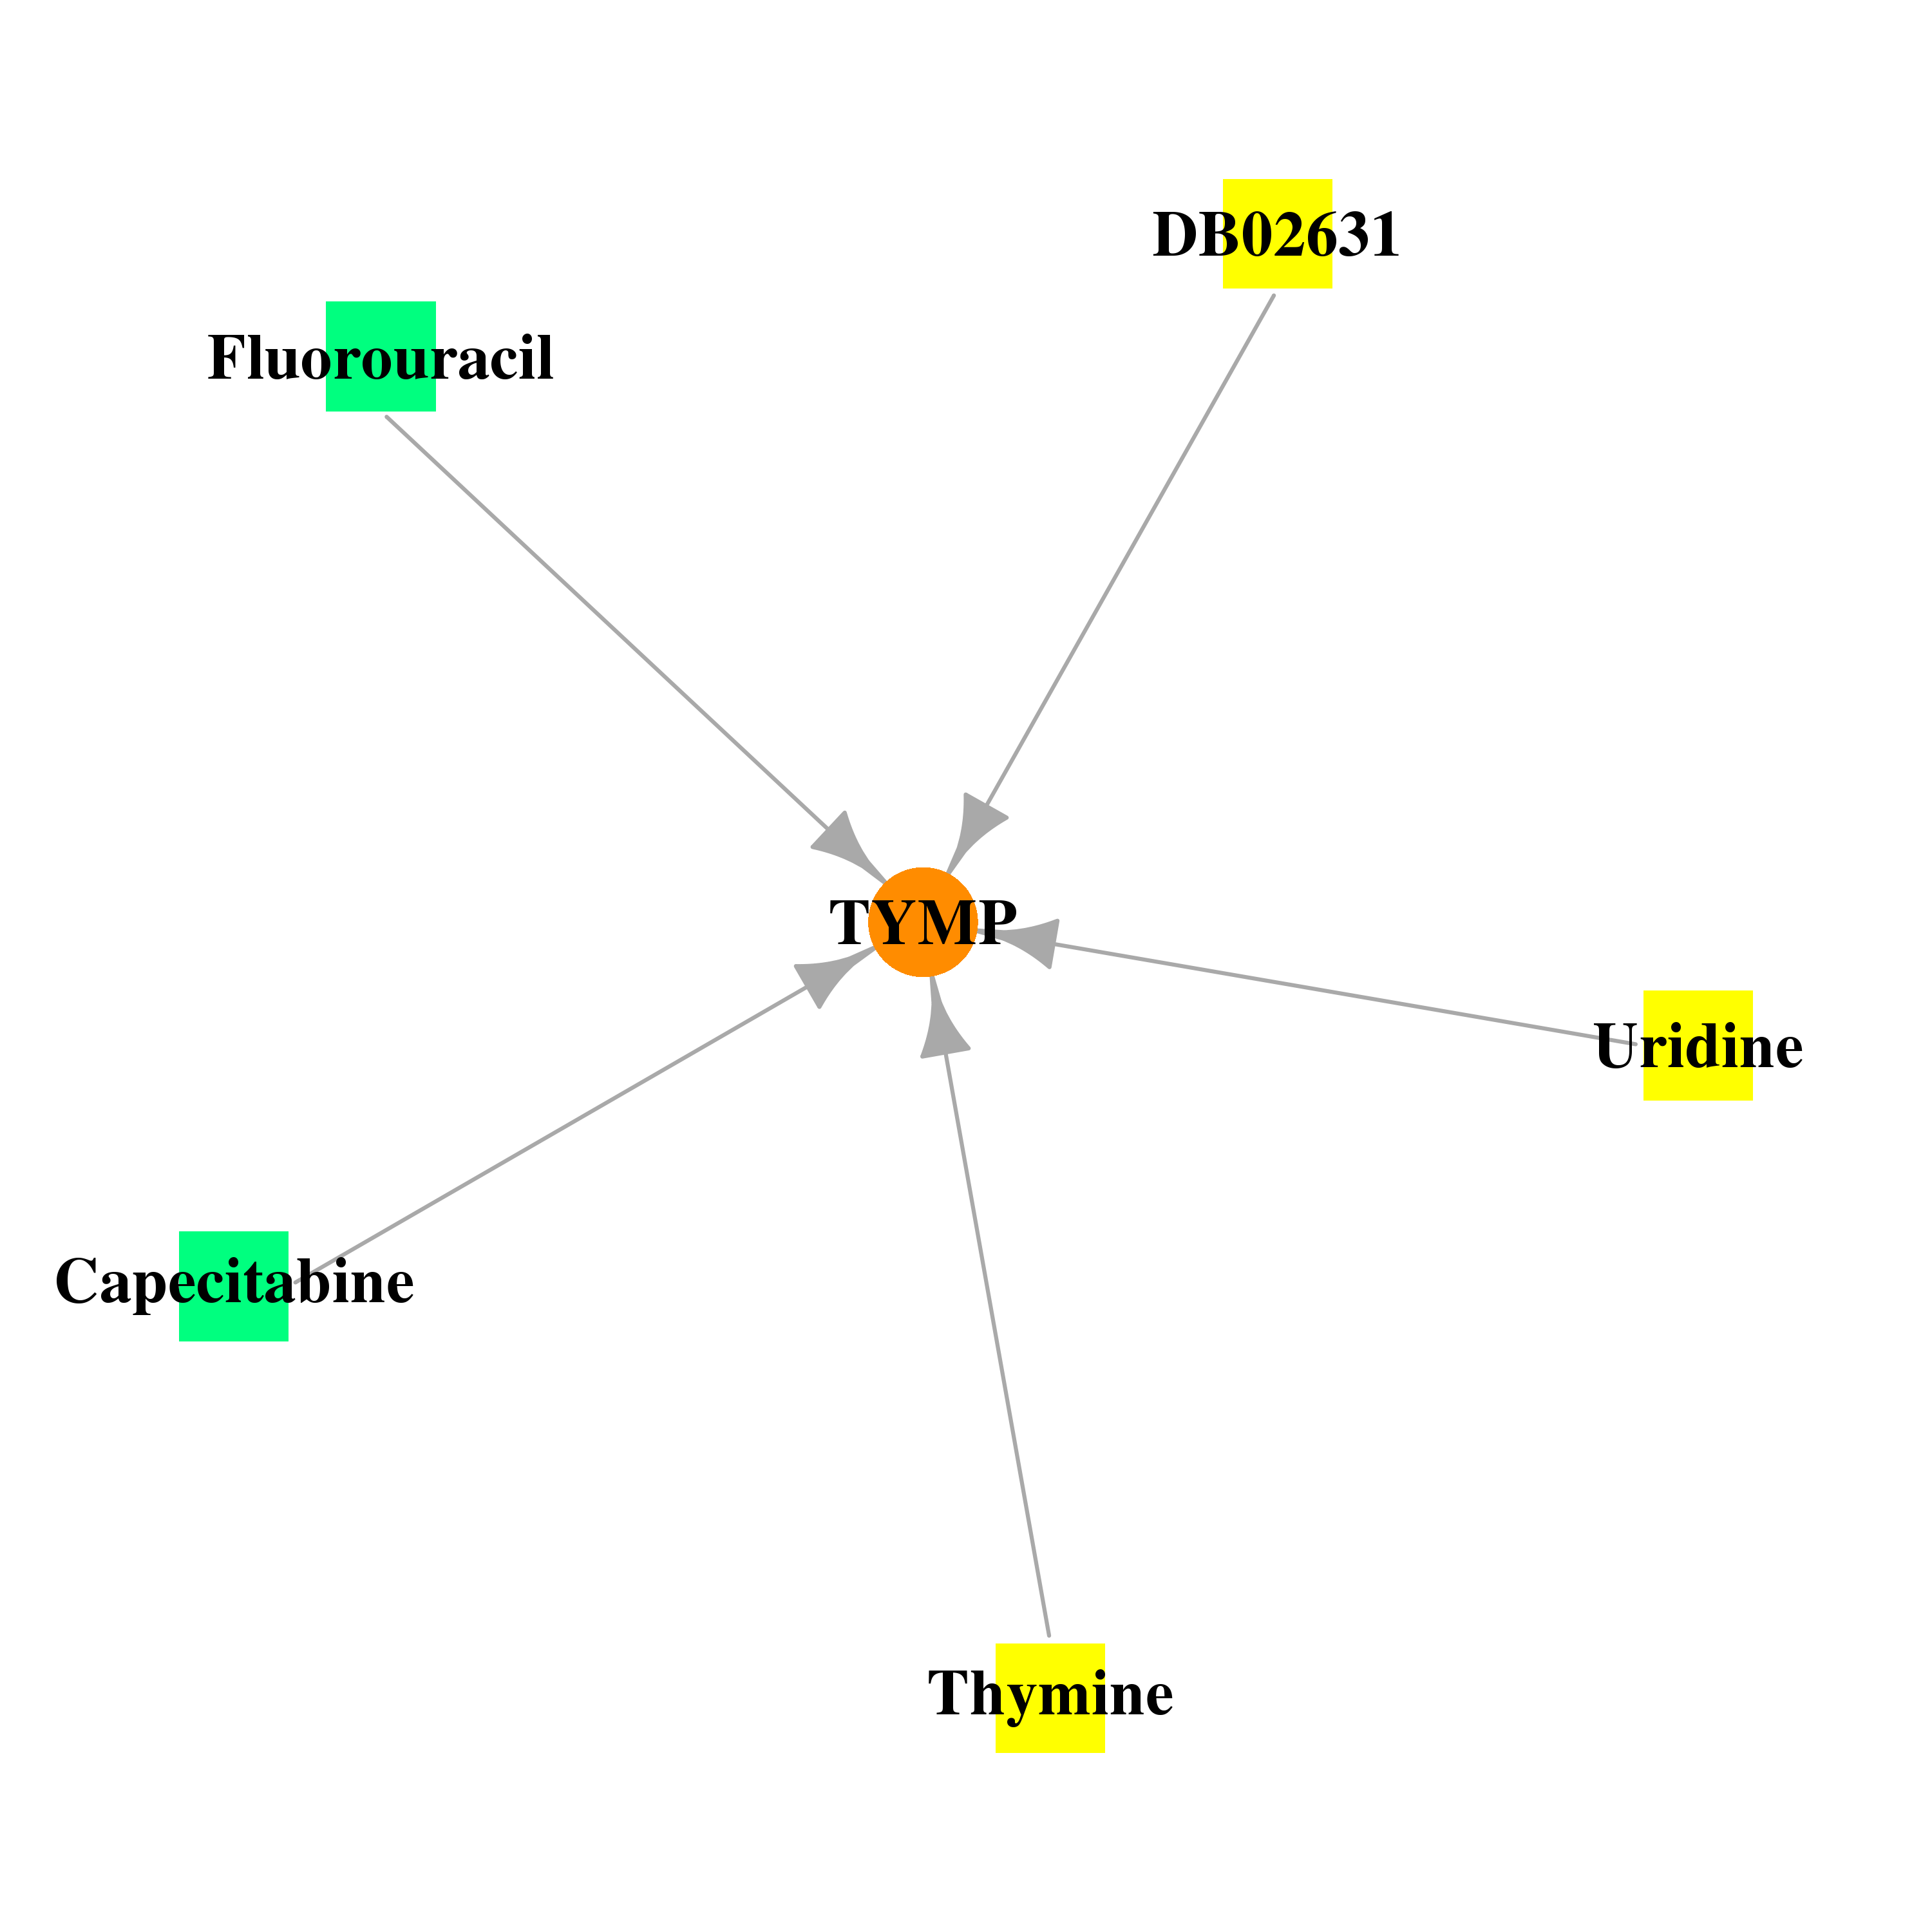 |
| * Drug Centered Interaction Network. |
| DrugBank ID | Target Name | Drug Groups | Generic Name | Drug Centered Network | Drug Structure |
| DB03462 | thymidine phosphorylase | experimental | Thymine | 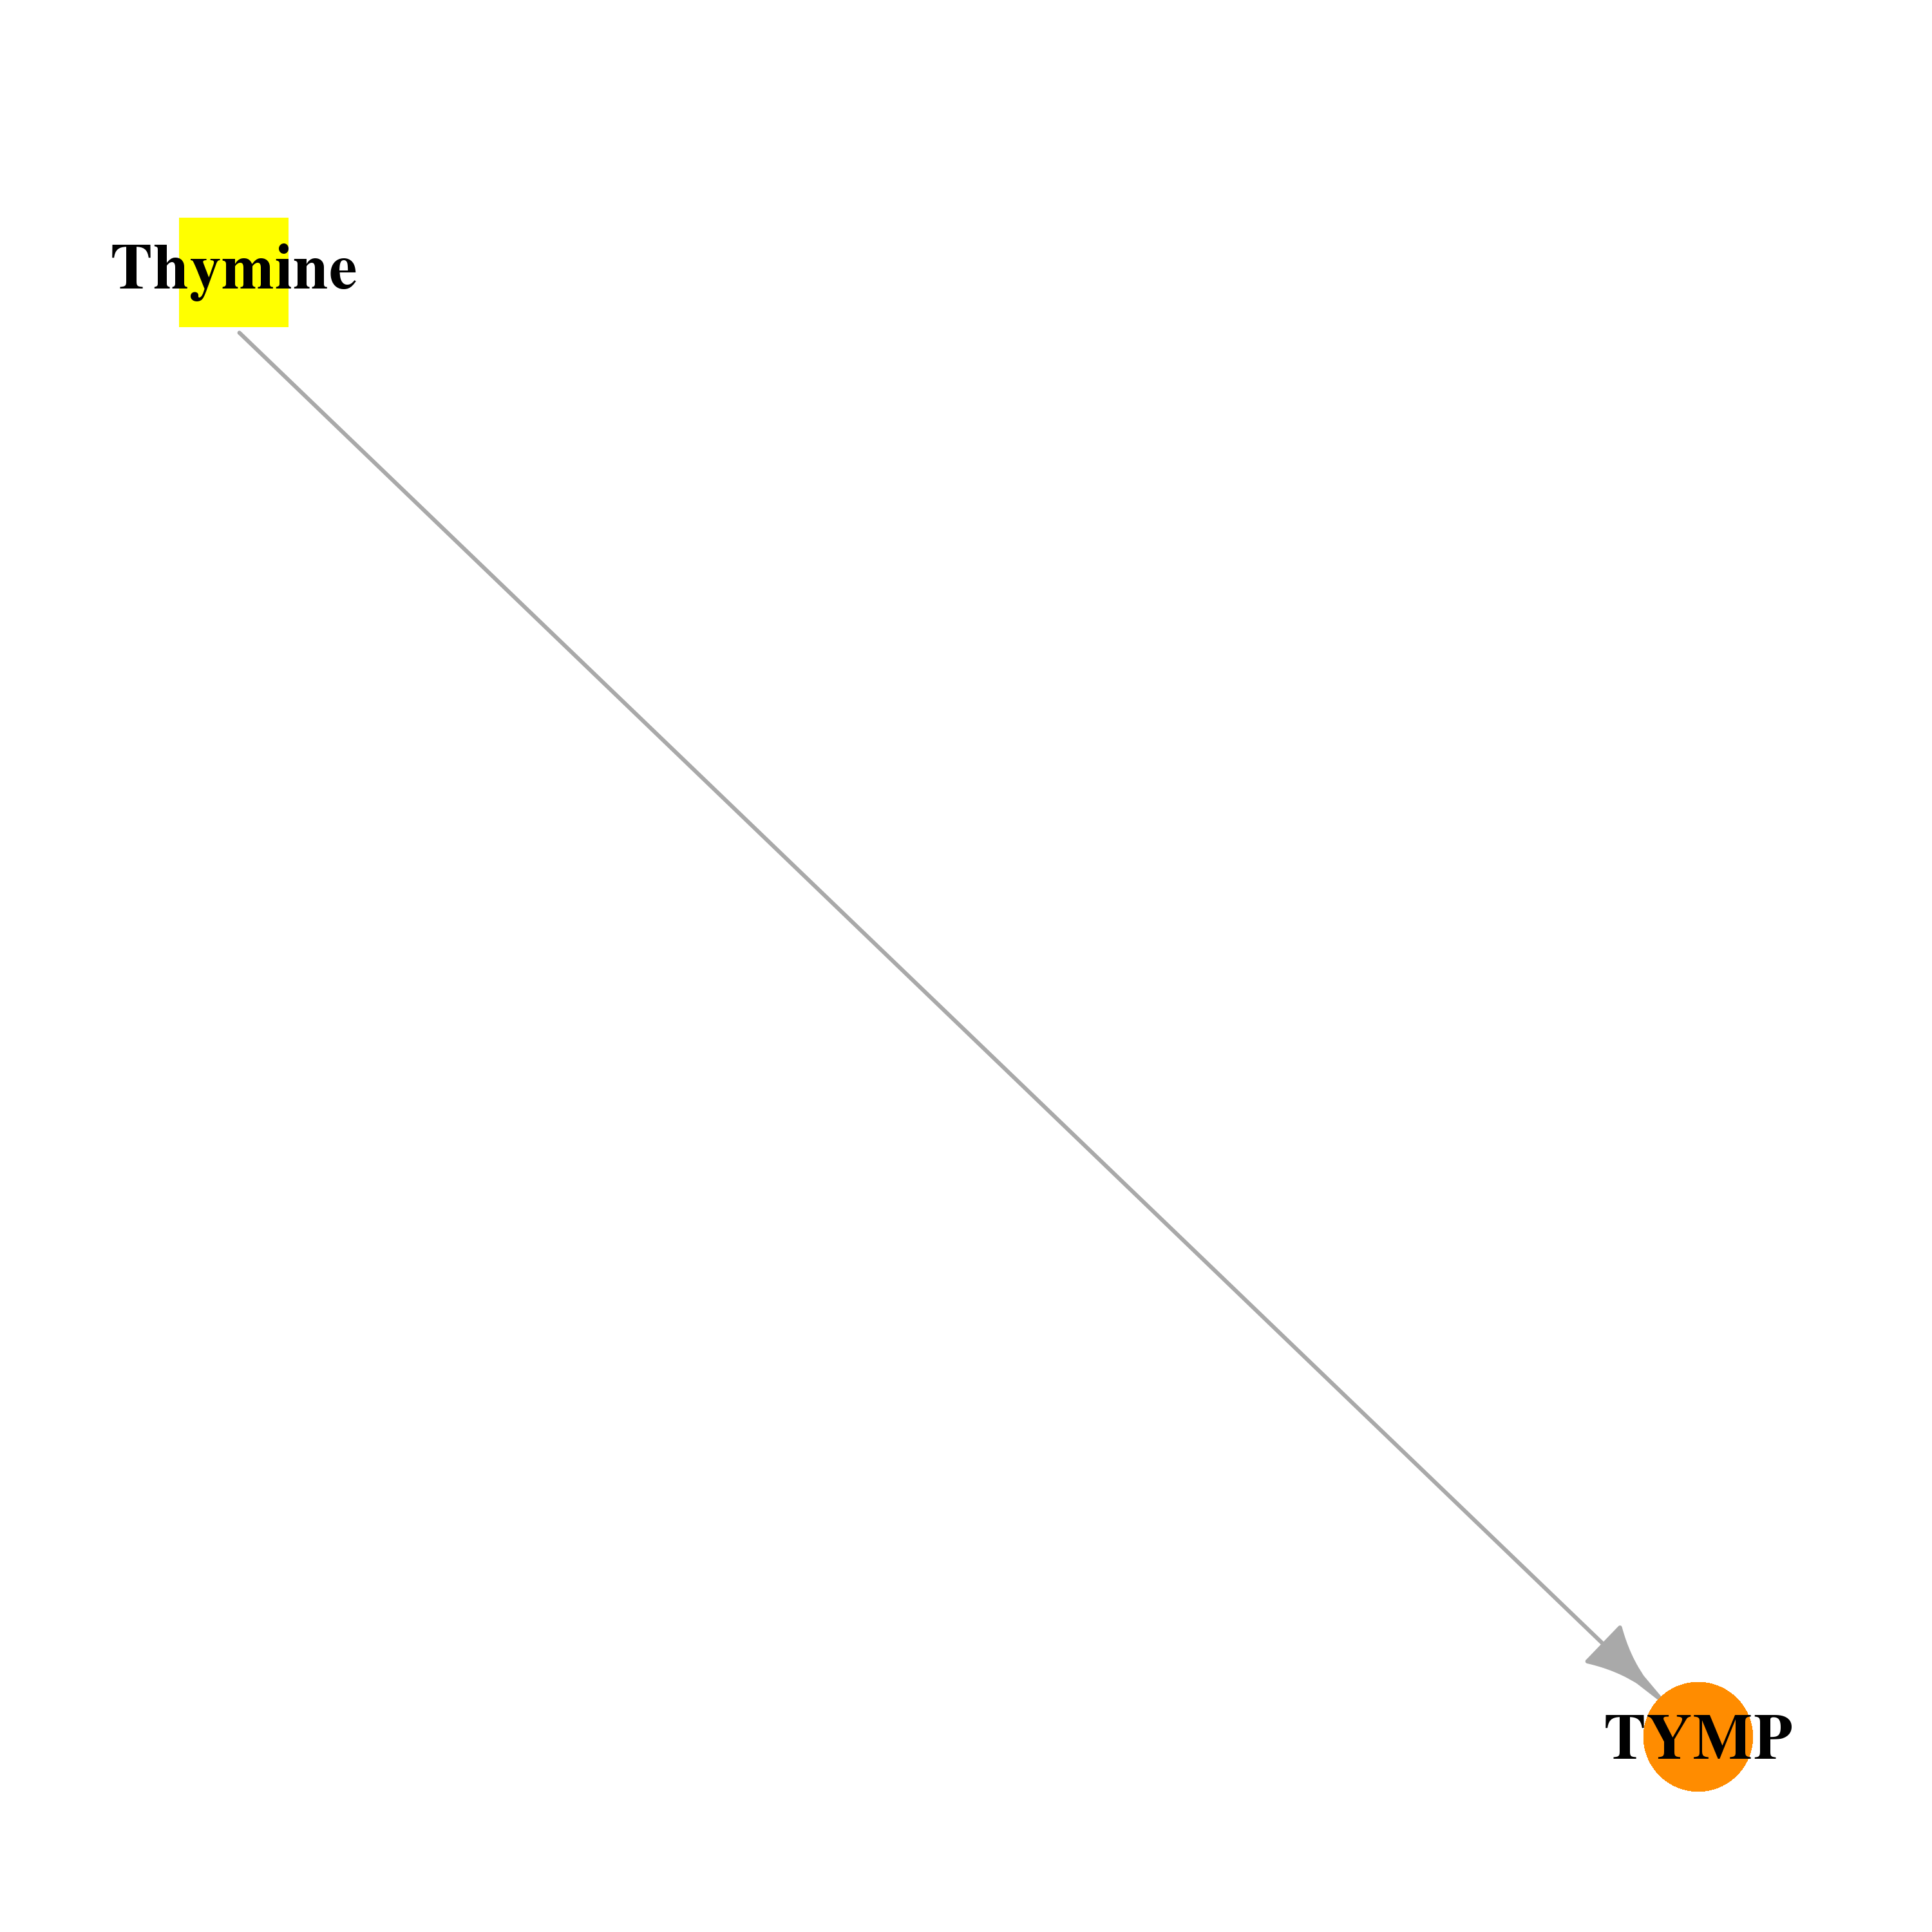 | 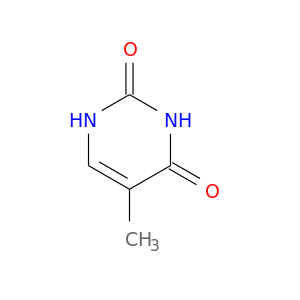 |
| DB02631 | thymidine phosphorylase | experimental | 5-Chloro-6-[(2-Iminopyrrolidin-1-Yl)Methyl]Pyrimidine-2,4(1h,3h)-Dione | 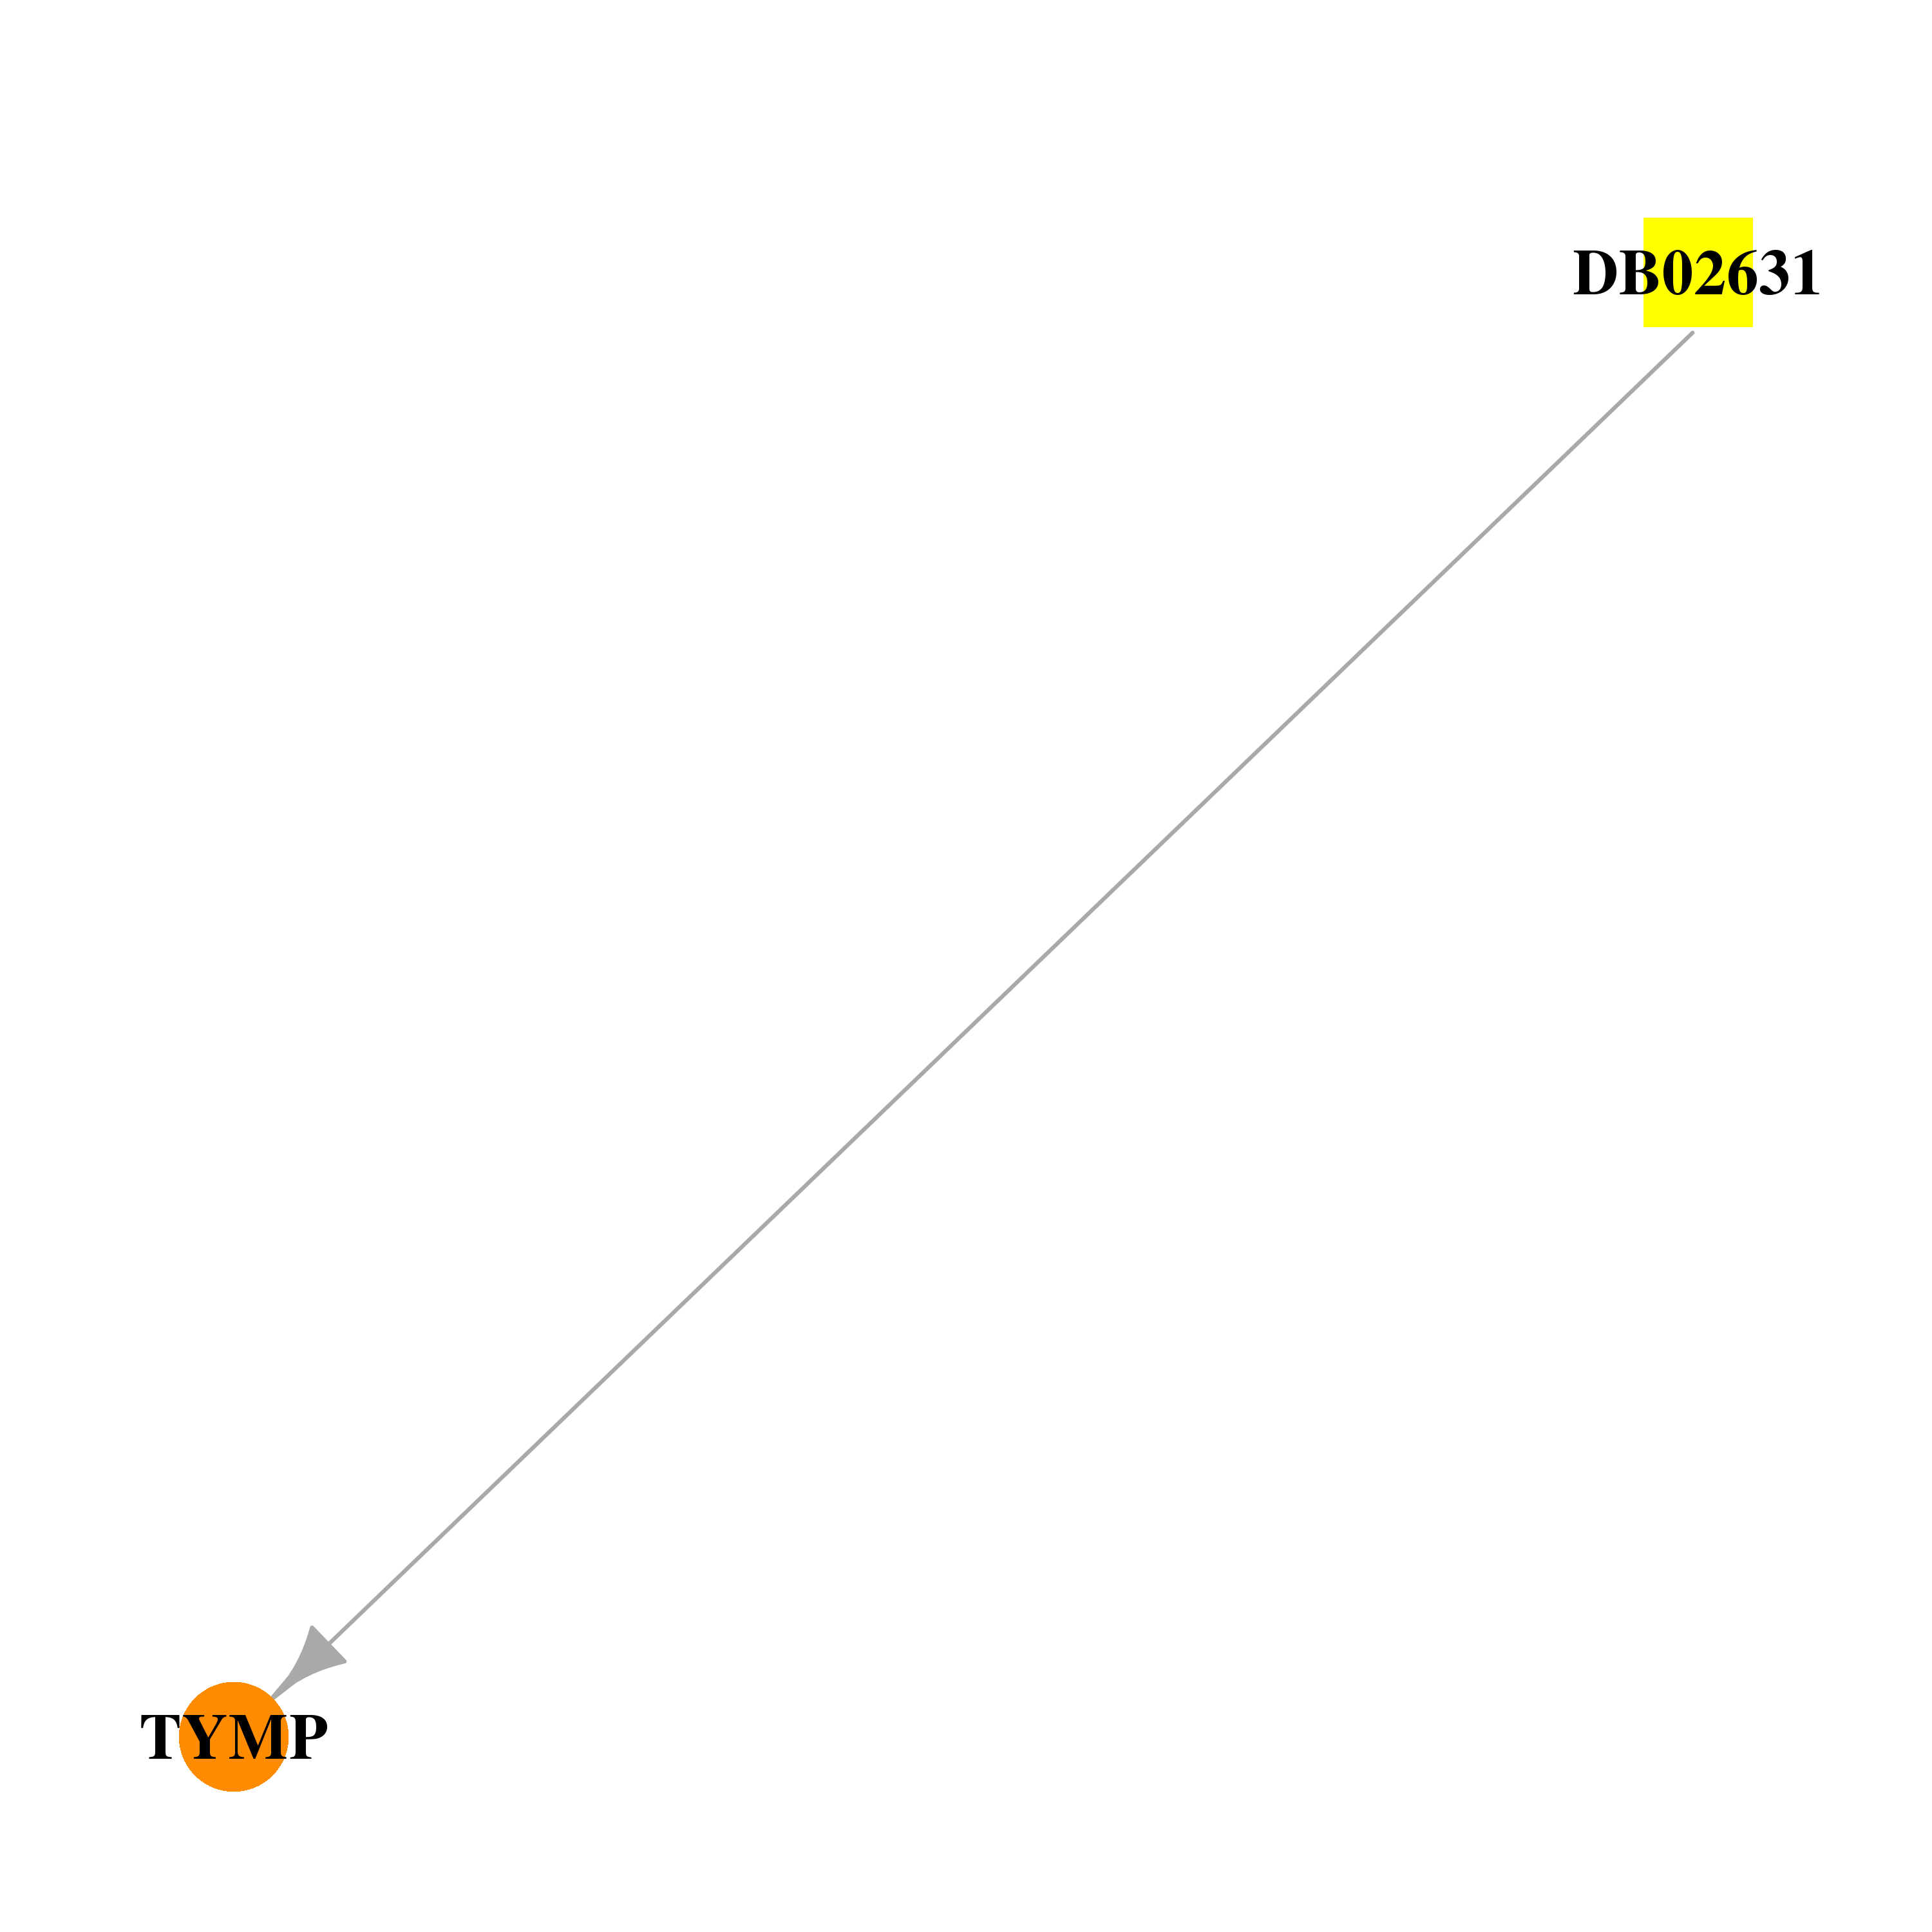 | 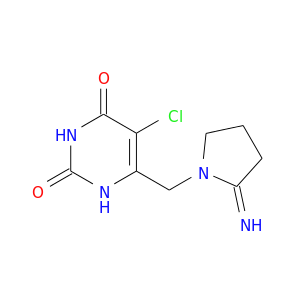 |
| DB01101 | thymidine phosphorylase | approved; investigational | Capecitabine |  |  |
| DB00544 | thymidine phosphorylase | approved | Fluorouracil |  |  |
| DB02745 | thymidine phosphorylase | experimental | Uridine | 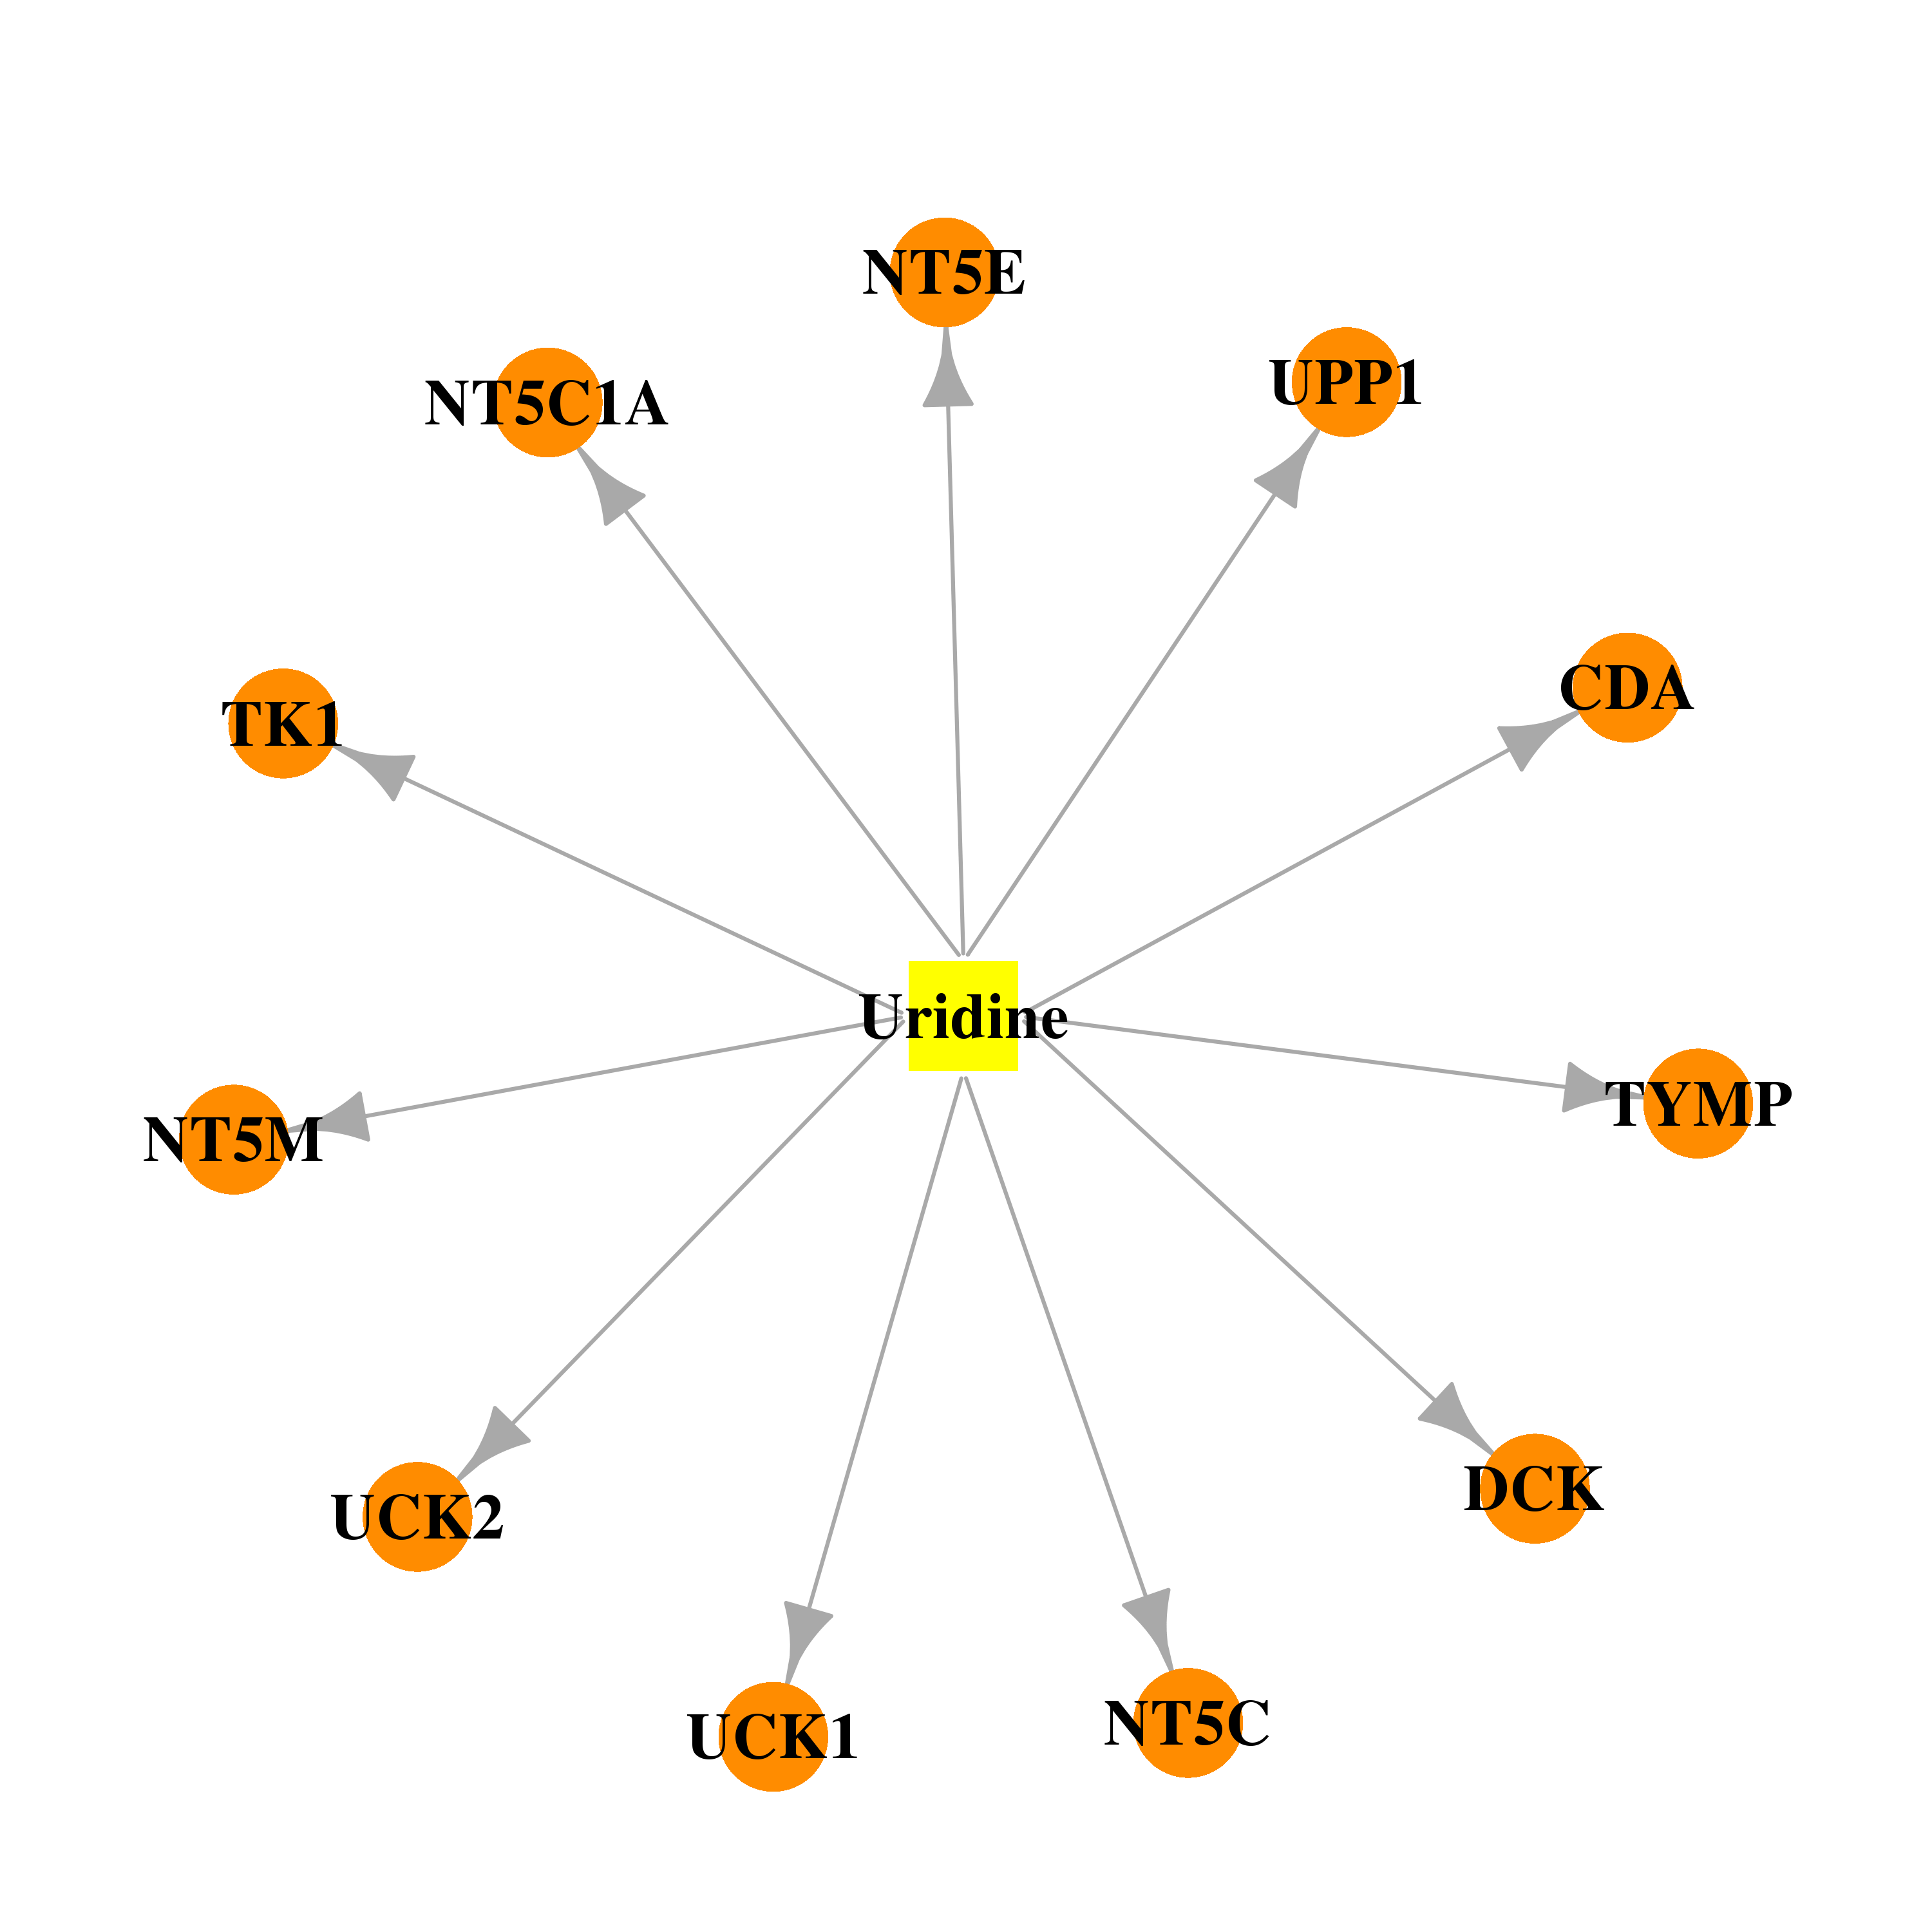 |  |
| Top |
| Cross referenced IDs for TYMP |
| * We obtained these cross-references from Uniprot database. It covers 150 different DBs, 18 categories. http://www.uniprot.org/help/cross_references_section |
: Open all cross reference information
|
Copyright © 2016-Present - The Univsersity of Texas Health Science Center at Houston @ |