|
|||||||||||||||||||||||||||||||||||||||||||||||||||||||||||||||||||||||||||||||||||||||||||||||||||||||||||||||||||||||||||||||||||||||||||||||||||||||||||||||||||||||||||||||||||||||||||||||||||||||||||||||||||||||||||||||||||||||||||||||||||||||||||||||||||||||||||||||||||||||||||||||||||||||||||||||||||||||||||||||||||||||||||||||||||||||||||||||||||||||||||||||||||||||||||||||||||||||||||||||||||||
| |
| Phenotypic Information (metabolism pathway, cancer, disease, phenome) |
| |
| |
| Gene-Gene Network Information: Co-Expression Network, Interacting Genes & KEGG |
| |
|


| Gene Summary for ABCA1 |
| Basic gene info. | Gene symbol | ABCA1 |
| Gene name | ATP-binding cassette, sub-family A (ABC1), member 1 | |
| Synonyms | ABC-1|ABC1|CERP|HDLDT1|TGD | |
| Cytomap | UCSC genome browser: 9q31.1 | |
| Genomic location | chr9 :107543283-107690527 | |
| Type of gene | protein-coding | |
| RefGenes | NM_005502.3, | |
| Ensembl id | ENSG00000165029 | |
| Description | ATP-binding cassette sub-family A member 1ATP-binding cassette transporter A1cholesterol efflux regulatory proteinmembrane-bound | |
| Modification date | 20141222 | |
| dbXrefs | MIM : 600046 | |
| HGNC : HGNC | ||
| Ensembl : ENSG00000165029 | ||
| HPRD : 02501 | ||
| Vega : OTTHUMG00000020417 | ||
| Protein | UniProt: O95477 go to UniProt's Cross Reference DB Table | |
| Expression | CleanEX: HS_ABCA1 | |
| BioGPS: 19 | ||
| Gene Expression Atlas: ENSG00000165029 | ||
| The Human Protein Atlas: ENSG00000165029 | ||
| Pathway | NCI Pathway Interaction Database: ABCA1 | |
| KEGG: ABCA1 | ||
| REACTOME: ABCA1 | ||
| ConsensusPathDB | ||
| Pathway Commons: ABCA1 | ||
| Metabolism | MetaCyc: ABCA1 | |
| HUMANCyc: ABCA1 | ||
| Regulation | Ensembl's Regulation: ENSG00000165029 | |
| miRBase: chr9 :107,543,283-107,690,527 | ||
| TargetScan: NM_005502 | ||
| cisRED: ENSG00000165029 | ||
| Context | iHOP: ABCA1 | |
| cancer metabolism search in PubMed: ABCA1 | ||
| UCL Cancer Institute: ABCA1 | ||
| Assigned class in ccmGDB | A - This gene has a literature evidence and it belongs to cancer gene. | |
| References showing role of ABCA1 in cancer cell metabolism | 1. Lee BH, Taylor MG, Robinet P, Smith JD, Schweitzer J, et al. (2013) Dysregulation of cholesterol homeostasis in human prostate cancer through loss of ABCA1. Cancer Res 73: 1211-1218. doi: 10.1158/0008-5472.CAN-12-3128. pmid: 3563867 go to article 2. He Y, Zhang L, Li Z, Gao H, Yue Z, et al. (2015) RIP140 triggers foam-cell formation by repressing ABCA1/G1 expression and cholesterol efflux via liver X receptor. FEBS Lett 589: 455-460. doi: 10.1016/j.febslet.2015.01.001. go to article 3. Vargas T, Moreno-Rubio J, Herranz J, Cejas P, Molina S, et al. (2015) ColoLipidGene: signature of lipid metabolism-related genes to predict prognosis in stage-II colon cancer patients. Oncotarget 6: 7348-7363. pmid: 4466690. go to article 4. Smith B, Land H (2012) Anticancer activity of the cholesterol exporter ABCA1 gene. Cell Rep 2: 580-590. doi: 10.1016/j.celrep.2012.08.011. pmid: 3462268. go to article 5. Jones RJ, Gu D, Bjorklund CC, Kuiatse I, Remaley AT, et al. (2013) The novel anticancer agent JNJ-26854165 induces cell death through inhibition of cholesterol transport and degradation of ABCA1. J Pharmacol Exp Ther 346: 381-392. doi: 10.1124/jpet.113.204958. pmid: 3876782. go to article | |
| Top |
| Phenotypic Information for ABCA1(metabolism pathway, cancer, disease, phenome) |
| Cancer | CGAP: ABCA1 |
| Familial Cancer Database: ABCA1 | |
| * This gene is included in those cancer gene databases. |
|
|
|
|
|
|
| |||||||||||||||||||||||||||||||||||||||||||||||||||||||||||||||||||||||||||||||||||||||||||||||||||||||||||||||||||||||||||||||||||||||||||||||||||||||||||||||||||||||||||||||||||||||||||||||||||||||||||||||||||||||||||||||||||||||||||||||||||||||||||||||||||||||||||||||||||||||||||||||||||||||||||||||||||||||||||||||||||||||||||||||||||||||||||||||||||||||||||||||||||||||||||||||||||||||||||||||
Oncogene 1 | Significant driver gene in | ||||||||||||||||||||||||||||||||||||||||||||||||||||||||||||||||||||||||||||||||||||||||||||||||||||||||||||||||||||||||||||||||||||||||||||||||||||||||||||||||||||||||||||||||||||||||||||||||||||||||||||||||||||||||||||||||||||||||||||||||||||||||||||||||||||||||||||||||||||||||||||||||||||||||||||||||||||||||||||||||||||||||||||||||||||||||||||||||||||||||||||||||||||||||||||||||||||||||||||||||||||
| cf) number; DB name 1 Oncogene; http://nar.oxfordjournals.org/content/35/suppl_1/D721.long, 2 Tumor Suppressor gene; https://bioinfo.uth.edu/TSGene/, 3 Cancer Gene Census; http://www.nature.com/nrc/journal/v4/n3/abs/nrc1299.html, 4 CancerGenes; http://nar.oxfordjournals.org/content/35/suppl_1/D721.long, 5 Network of Cancer Gene; http://ncg.kcl.ac.uk/index.php, 1Therapeutic Vulnerabilities in Cancer; http://cbio.mskcc.org/cancergenomics/statius/ |
| REACTOME_METABOLISM_OF_LIPIDS_AND_LIPOPROTEINS REACTOME_LIPOPROTEIN_METABOLISM | |
| OMIM | 205400; phenotype. 205400; phenotype. 600046; gene+phenotype. 600046; gene+phenotype. 604091; phenotype. 604091; phenotype. |
| Orphanet | 31150; Tangier disease. 31150; Tangier disease. 425; Apolipoprotein A-I deficiency. 425; Apolipoprotein A-I deficiency. |
| Disease | KEGG Disease: ABCA1 |
| MedGen: ABCA1 (Human Medical Genetics with Condition) | |
| ClinVar: ABCA1 | |
| Phenotype | MGI: ABCA1 (International Mouse Phenotyping Consortium) |
| PhenomicDB: ABCA1 | |
| Mutations for ABCA1 |
| * Under tables are showing count per each tissue to give us broad intuition about tissue specific mutation patterns.You can go to the detailed page for each mutation database's web site. |
| - Statistics for Tissue and Mutation type | Top |
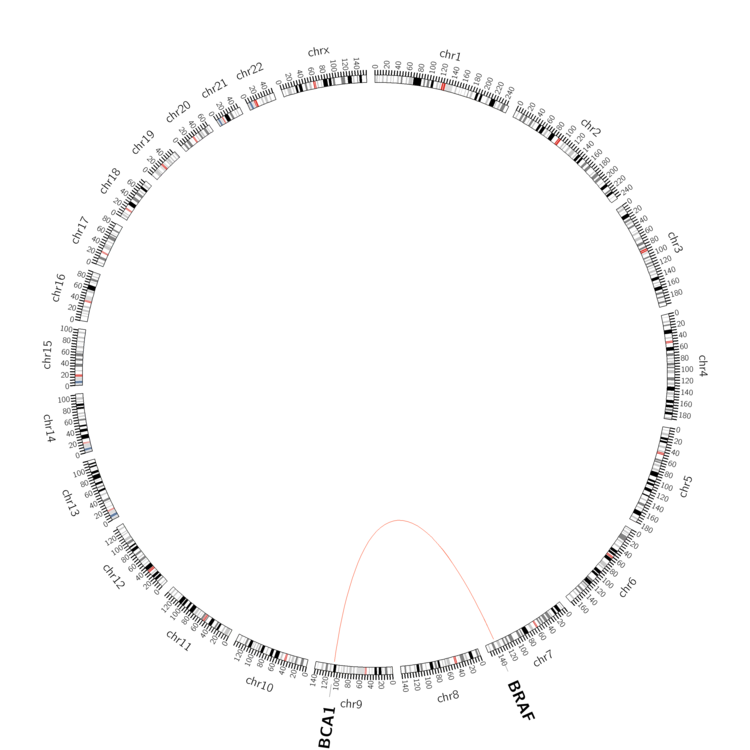 |
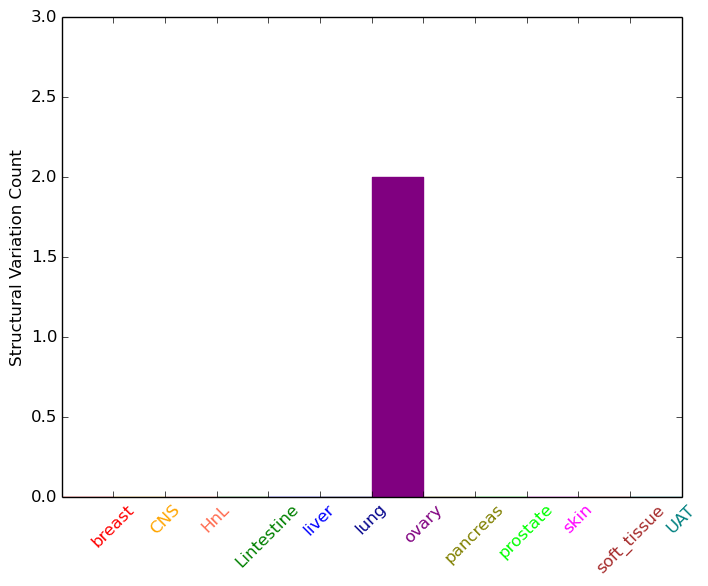
| - For Inter-chromosomal Variations |
| * Inter-chromosomal variantions includes 'interchromosomal amplicon to amplicon', 'interchromosomal amplicon to non-amplified dna', 'interchromosomal insertion', 'Interchromosomal unknown type'. |
 |
| - For Intra-chromosomal Variations |
| There's no intra-chromosomal structural variation. |
| Sample | Symbol_a | Chr_a | Start_a | End_a | Symbol_b | Chr_b | Start_b | End_b |
| ovary | ABCA1 | chr9 | 107666329 | 107666349 | BRAF | chr7 | 140485456 | 140485476 |
| cf) Tissue number; Tissue name (1;Breast, 2;Central_nervous_system, 3;Haematopoietic_and_lymphoid_tissue, 4;Large_intestine, 5;Liver, 6;Lung, 7;Ovary, 8;Pancreas, 9;Prostate, 10;Skin, 11;Soft_tissue, 12;Upper_aerodigestive_tract) |
| * From mRNA Sanger sequences, Chitars2.0 arranged chimeric transcripts. This table shows ABCA1 related fusion information. |
| ID | Head Gene | Tail Gene | Accession | Gene_a | qStart_a | qEnd_a | Chromosome_a | tStart_a | tEnd_a | Gene_a | qStart_a | qEnd_a | Chromosome_a | tStart_a | tEnd_a |
| AK130814 | ABCA1 | 14 | 1438 | 9 | 107576733 | 107588168 | LAS1L | 1434 | 1987 | X | 64732463 | 64737950 | |
| BF879888 | ABCA1 | 7 | 294 | 9 | 107587996 | 107589344 | EIF4E | 288 | 486 | 4 | 99809803 | 99810001 | |
| DB286350 | ABCA1 | 1 | 381 | 9 | 107665894 | 107690436 | KCNMA1 | 381 | 462 | 10 | 78850187 | 78850268 | |
| CR983438 | ABCA1 | 1 | 190 | 9 | 107690215 | 107690404 | HNRNPK | 188 | 858 | 9 | 86587842 | 86593369 | |
| BF988288 | SNRNP200 | 1 | 188 | 2 | 96966780 | 96967435 | ABCA1 | 181 | 466 | 9 | 107639717 | 107640002 | |
| Top |
| Mutation type/ Tissue ID | brca | cns | cerv | endome | haematopo | kidn | Lintest | liver | lung | ns | ovary | pancre | prost | skin | stoma | thyro | urina | |||
| Total # sample | 1 | 1 | ||||||||||||||||||
| GAIN (# sample) | 1 | |||||||||||||||||||
| LOSS (# sample) | 1 |
| cf) Tissue ID; Tissue type (1; Breast, 2; Central_nervous_system, 3; Cervix, 4; Endometrium, 5; Haematopoietic_and_lymphoid_tissue, 6; Kidney, 7; Large_intestine, 8; Liver, 9; Lung, 10; NS, 11; Ovary, 12; Pancreas, 13; Prostate, 14; Skin, 15; Stomach, 16; Thyroid, 17; Urinary_tract) |
| Top |
|
 |
| Top |
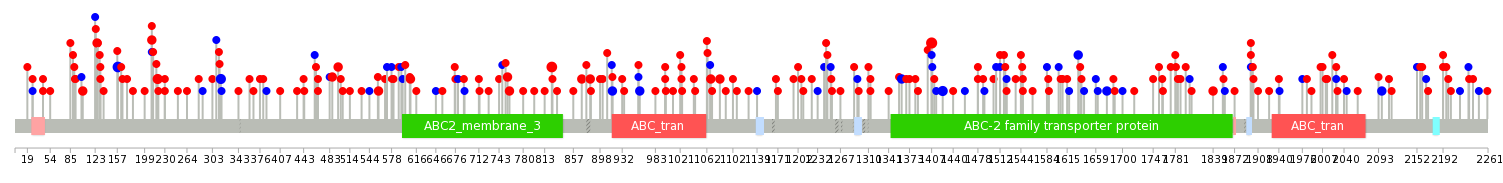
| Stat. for Non-Synonymous SNVs (# total SNVs=199) | (# total SNVs=60) |
 | 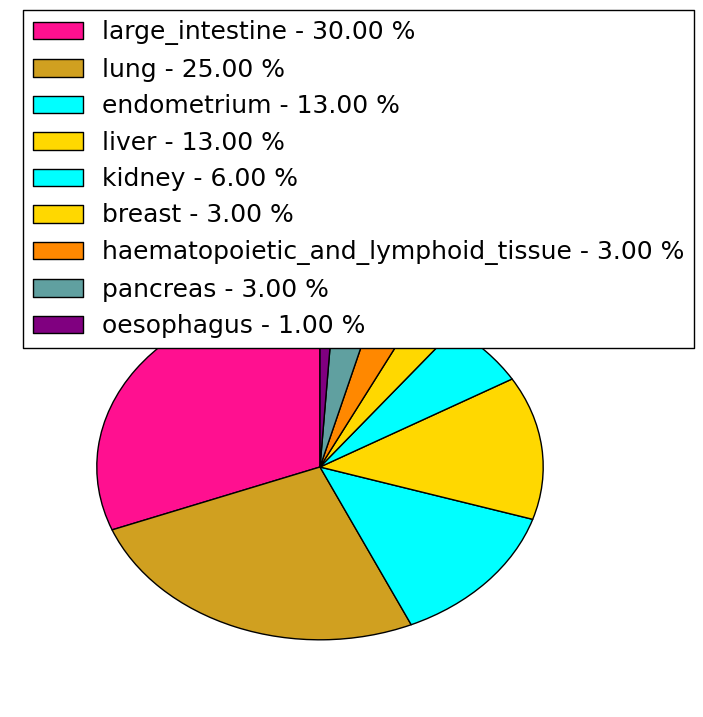 |
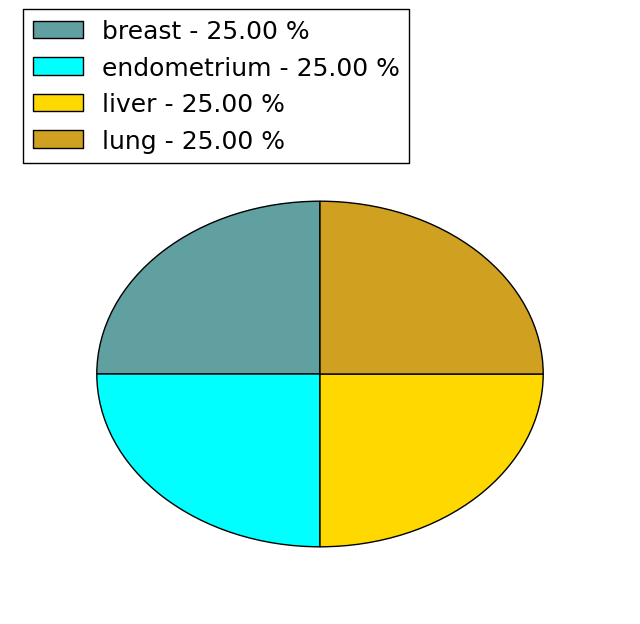
(# total SNVs=4) | (# total SNVs=0) |
 |
| Top |
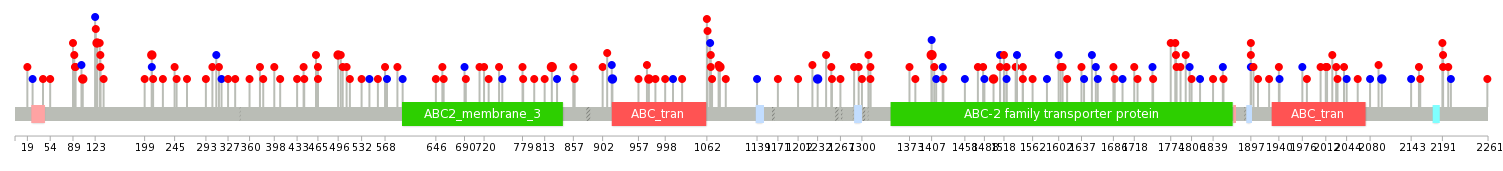
| * When you move the cursor on each content, you can see more deailed mutation information on the Tooltip. Those are primary_site,primary_histology,mutation(aa),pubmedID. |
| GRCh37 position | Mutation(aa) | Unique sampleID count |
| chr9:107571802-107571802 | p.A1407T | 5 |
| chr9:107588035-107588035 | p.S824L | 4 |
| chr9:107602666-107602666 | p.G316G | 4 |
| chr9:107624029-107624029 | p.L158L | 4 |
| chr9:107620867-107620867 | p.R219K | 3 |
| chr9:107556793-107556793 | p.? | 3 |
| chr9:107571749-107571749 | p.I1424I | 3 |
| chr9:107564394-107564394 | p.P1547A | 2 |
| chr9:107651416-107651416 | p.R43G | 2 |
| chr9:107562147-107562147 | p.F1632F | 2 |
| Top |
|
 |
| Point Mutation/ Tissue ID | 1 | 2 | 3 | 4 | 5 | 6 | 7 | 8 | 9 | 10 | 11 | 12 | 13 | 14 | 15 | 16 | 17 | 18 | 19 | 20 |
| # sample | 6 | 5 | 1 | 40 | 7 | 9 | 8 | 1 | 18 | 12 | 6 | 12 | 17 | 1 | 23 | |||||
| # mutation | 6 | 5 | 1 | 50 | 7 | 9 | 8 | 1 | 25 | 14 | 6 | 12 | 18 | 1 | 35 | |||||
| nonsynonymous SNV | 5 | 4 | 1 | 38 | 5 | 6 | 7 | 1 | 18 | 8 | 6 | 8 | 15 | 1 | 28 | |||||
| synonymous SNV | 1 | 1 | 12 | 2 | 3 | 1 | 7 | 6 | 4 | 3 | 7 |
| cf) Tissue ID; Tissue type (1; BLCA[Bladder Urothelial Carcinoma], 2; BRCA[Breast invasive carcinoma], 3; CESC[Cervical squamous cell carcinoma and endocervical adenocarcinoma], 4; COAD[Colon adenocarcinoma], 5; GBM[Glioblastoma multiforme], 6; Glioma Low Grade, 7; HNSC[Head and Neck squamous cell carcinoma], 8; KICH[Kidney Chromophobe], 9; KIRC[Kidney renal clear cell carcinoma], 10; KIRP[Kidney renal papillary cell carcinoma], 11; LAML[Acute Myeloid Leukemia], 12; LUAD[Lung adenocarcinoma], 13; LUSC[Lung squamous cell carcinoma], 14; OV[Ovarian serous cystadenocarcinoma ], 15; PAAD[Pancreatic adenocarcinoma], 16; PRAD[Prostate adenocarcinoma], 17; SKCM[Skin Cutaneous Melanoma], 18:STAD[Stomach adenocarcinoma], 19:THCA[Thyroid carcinoma], 20:UCEC[Uterine Corpus Endometrial Carcinoma]) |
| Top |
| * We represented just top 10 SNVs. When you move the cursor on each content, you can see more deailed mutation information on the Tooltip. Those are primary_site, primary_histology, mutation(aa), pubmedID. |
| Genomic Position | Mutation(aa) | Unique sampleID count |
| chr9:107588035 | p.S824L | 3 |
| chr9:107571802 | p.A1407T | 3 |
| chr9:107547747 | p.S2192N | 2 |
| chr9:107584854 | p.V2098V | 2 |
| chr9:107578466 | p.E210G | 2 |
| chr9:107594877 | p.L1232L | 2 |
| chr9:107645431 | p.Q973R | 2 |
| chr9:107564394 | p.P1547A | 2 |
| chr9:107555134 | p.R1897L | 2 |
| chr9:107620894 | p.T131S | 2 |
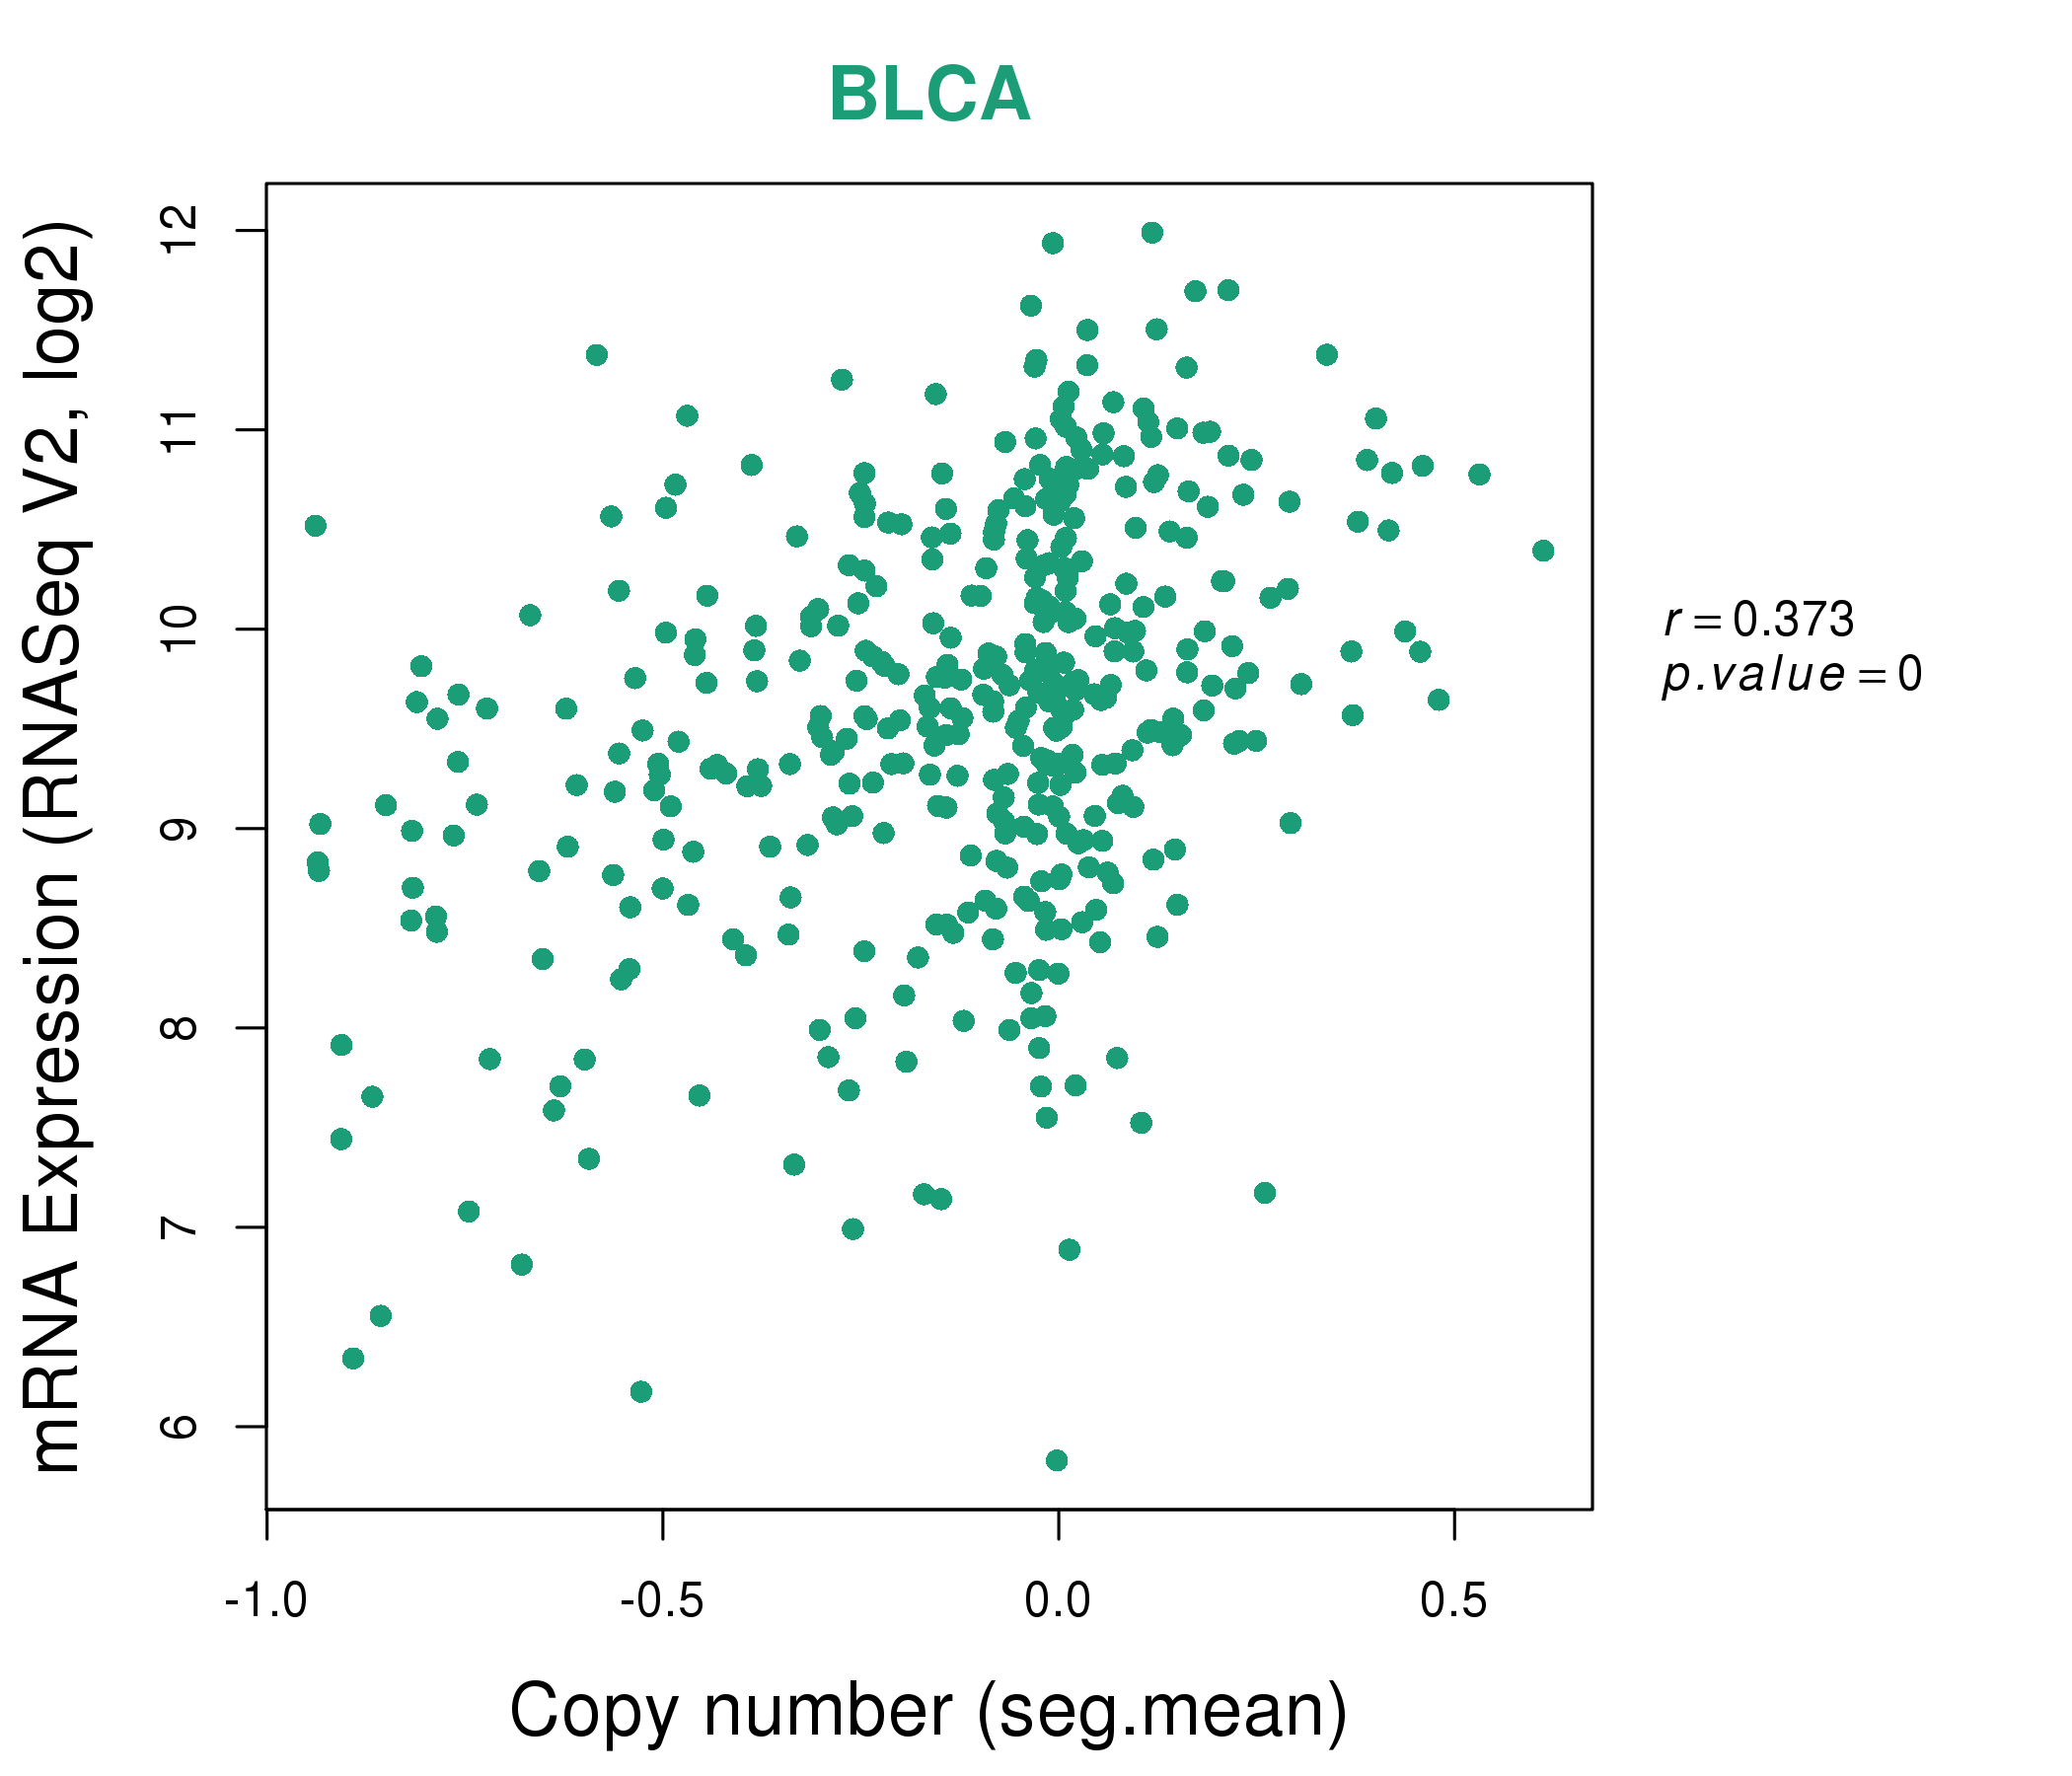
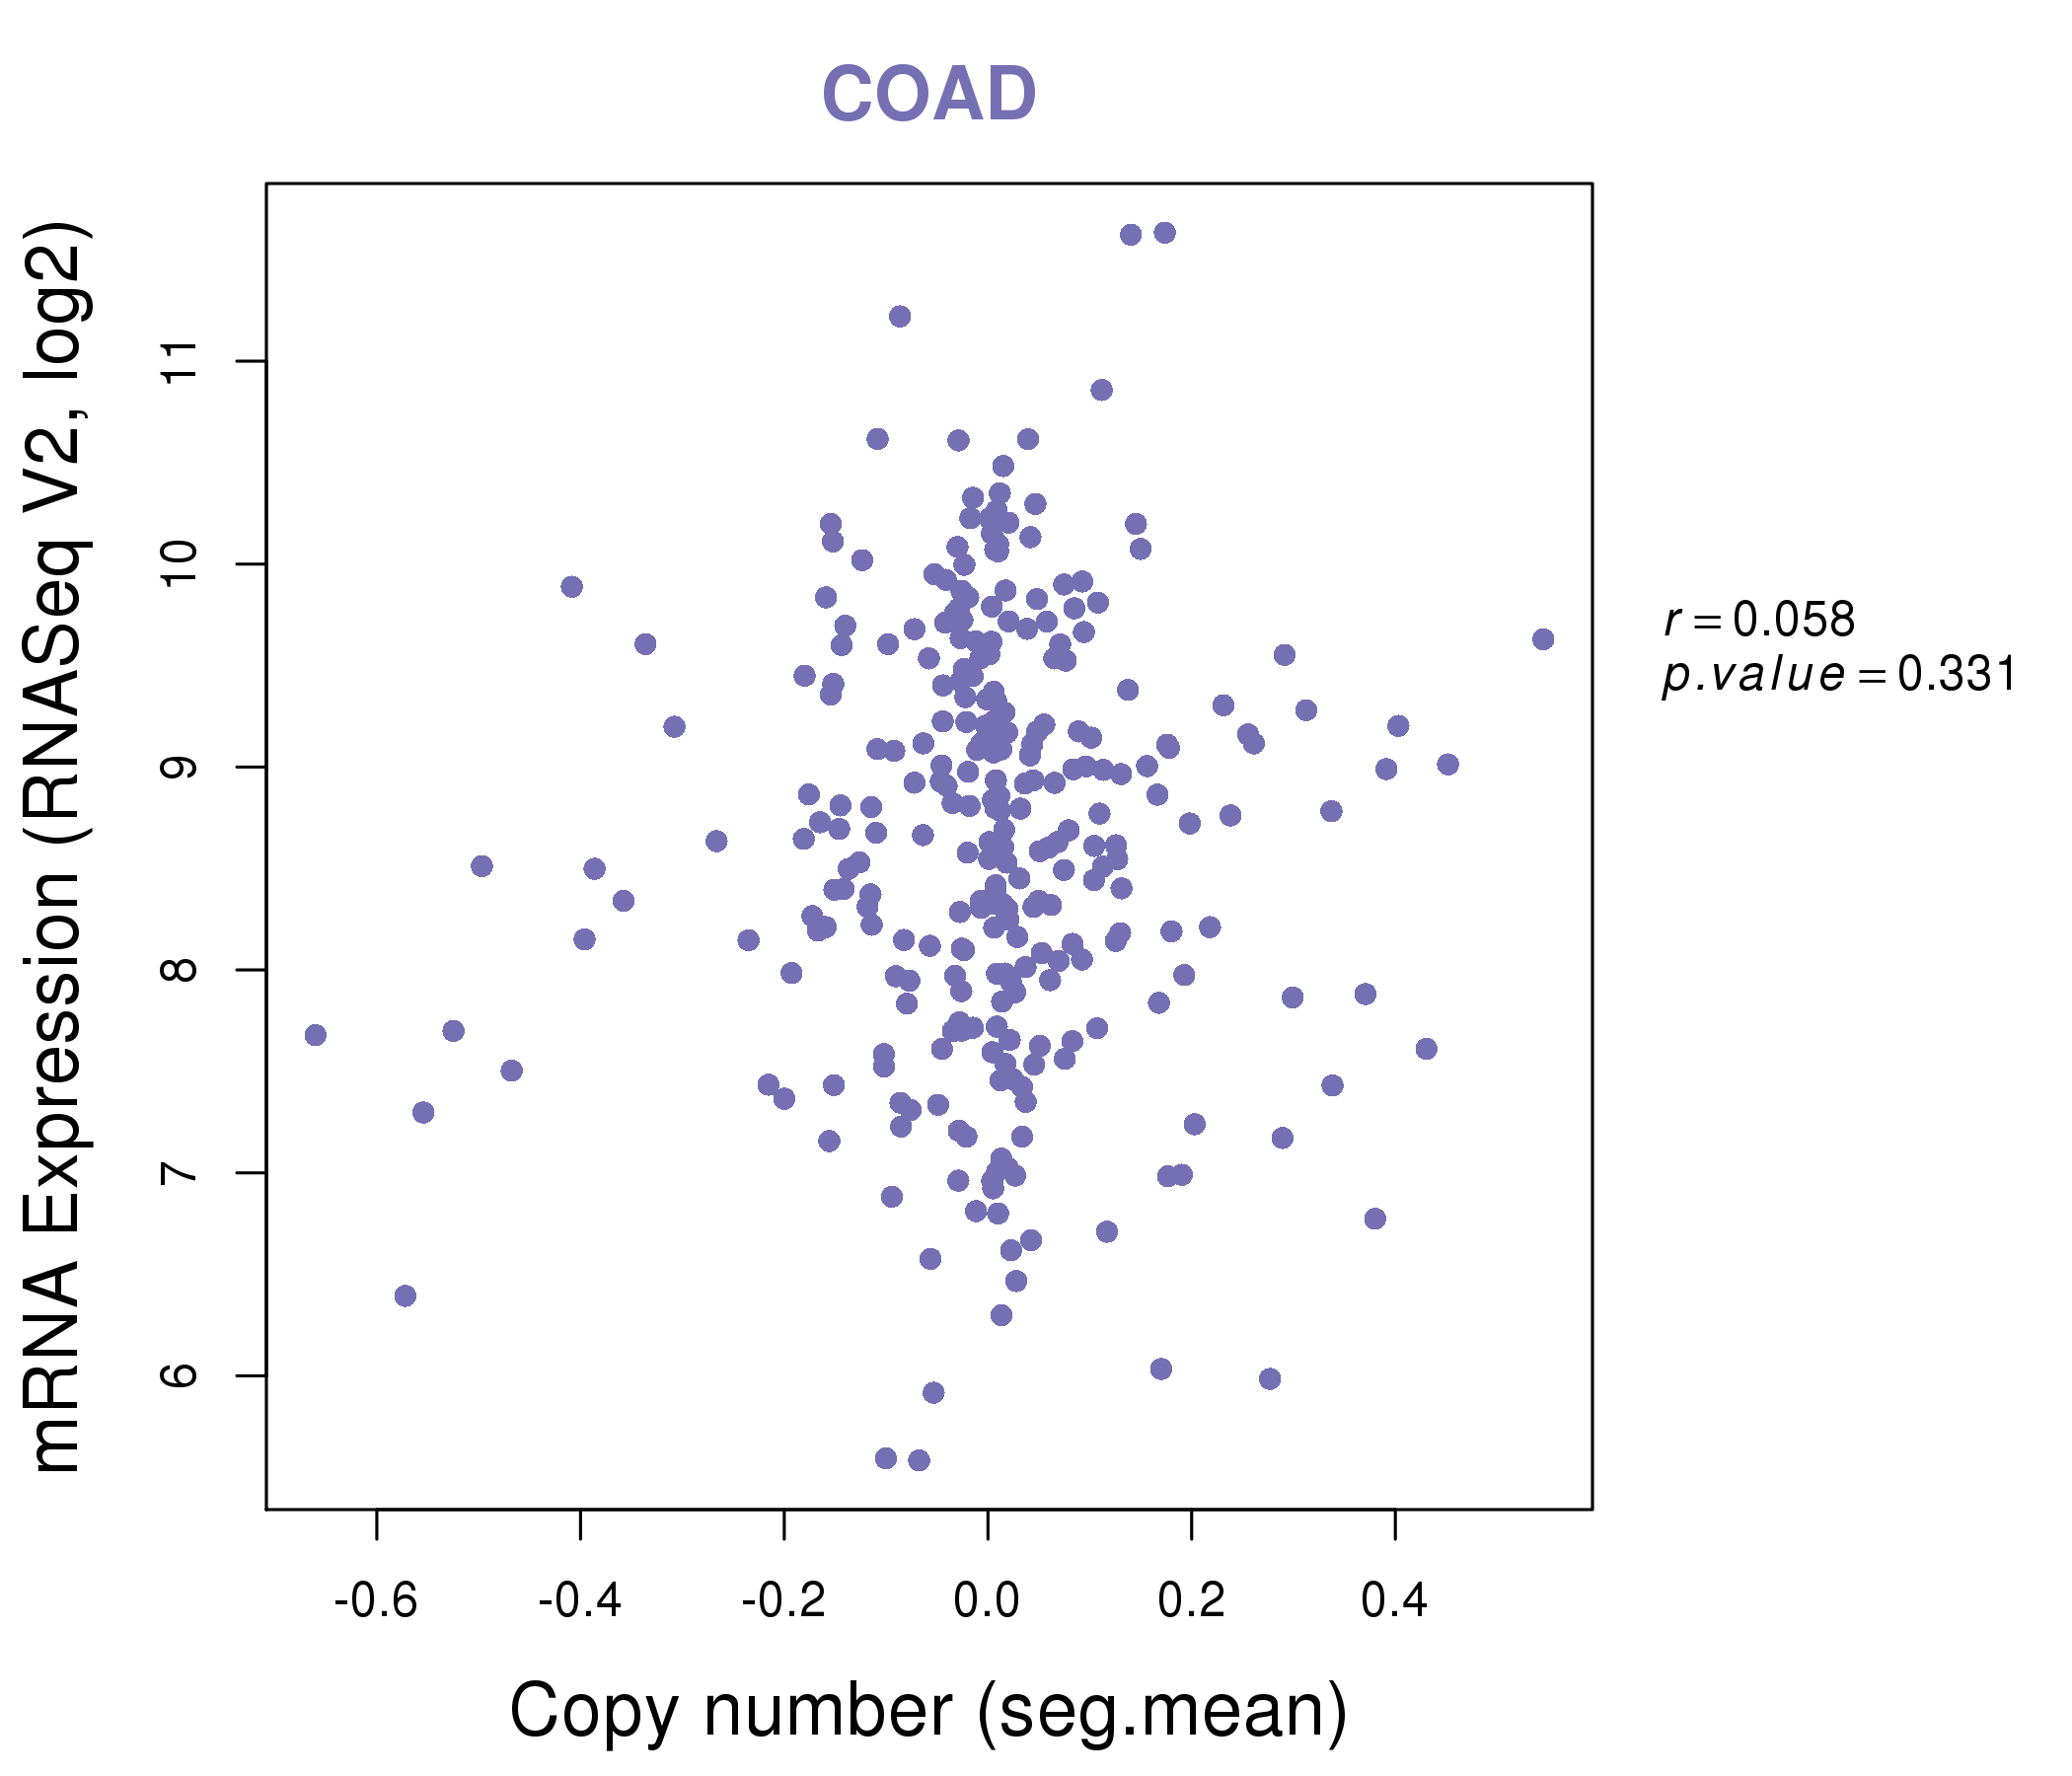
| * Copy number data were extracted from TCGA using R package TCGA-Assembler. The URLs of all public data files on TCGA DCC data server were gathered on Jan-05-2015. Function ProcessCNAData in TCGA-Assembler package was used to obtain gene-level copy number value which is calculated as the average copy number of the genomic region of a gene. |
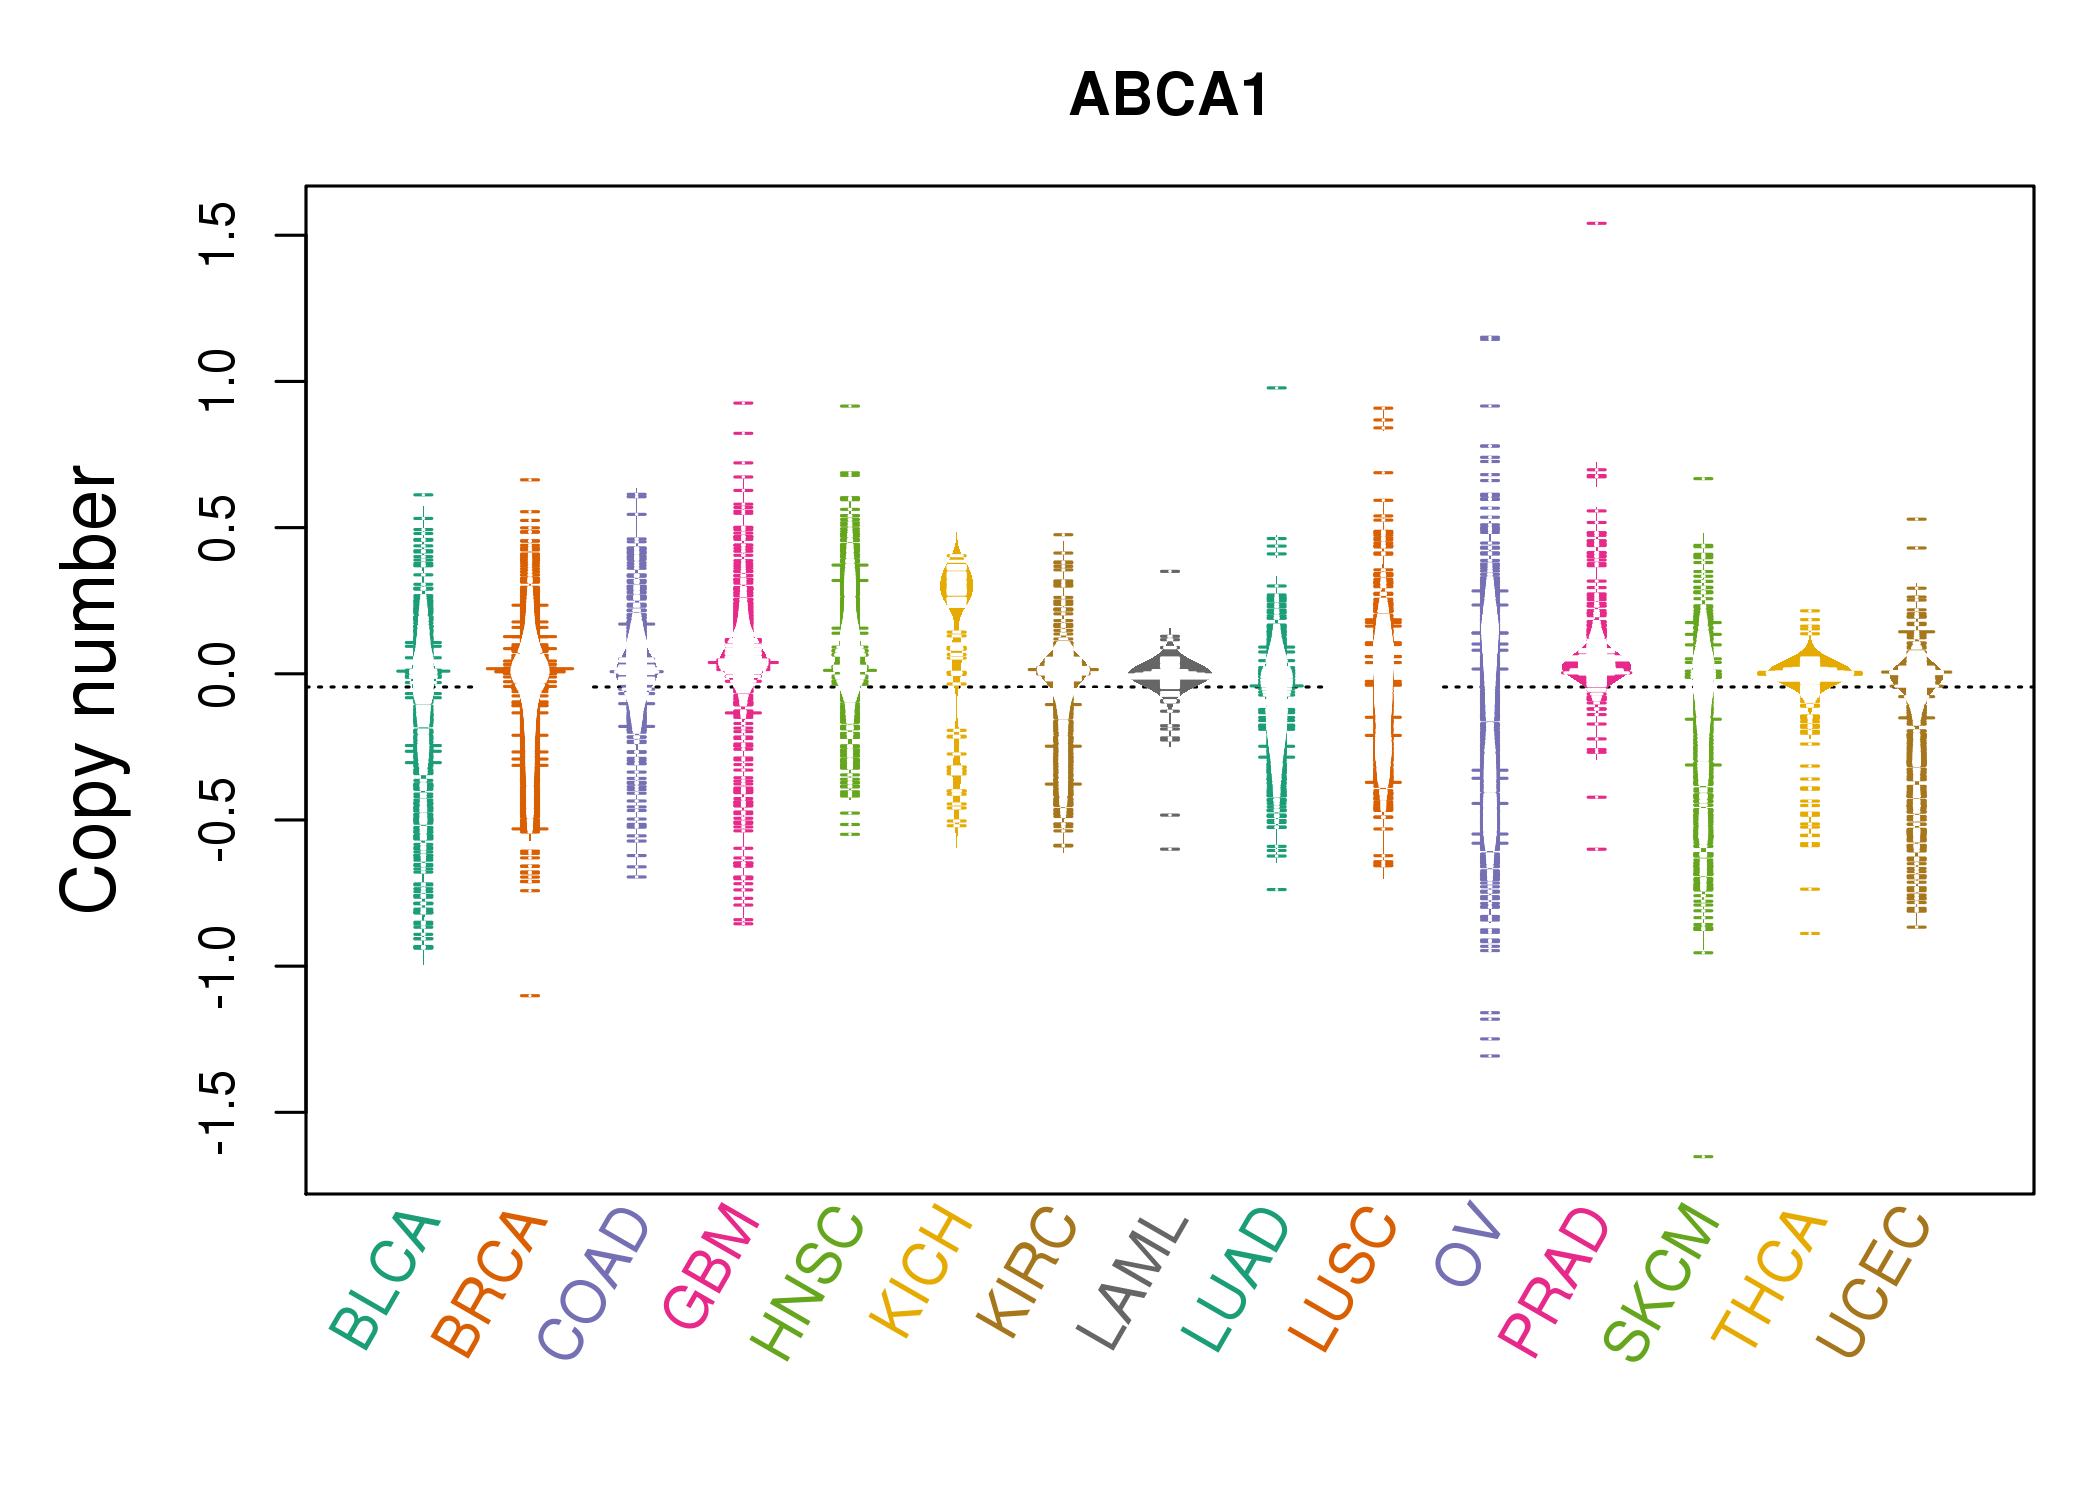 |
| cf) Tissue ID[Tissue type]: BLCA[Bladder Urothelial Carcinoma], BRCA[Breast invasive carcinoma], CESC[Cervical squamous cell carcinoma and endocervical adenocarcinoma], COAD[Colon adenocarcinoma], GBM[Glioblastoma multiforme], Glioma Low Grade, HNSC[Head and Neck squamous cell carcinoma], KICH[Kidney Chromophobe], KIRC[Kidney renal clear cell carcinoma], KIRP[Kidney renal papillary cell carcinoma], LAML[Acute Myeloid Leukemia], LUAD[Lung adenocarcinoma], LUSC[Lung squamous cell carcinoma], OV[Ovarian serous cystadenocarcinoma ], PAAD[Pancreatic adenocarcinoma], PRAD[Prostate adenocarcinoma], SKCM[Skin Cutaneous Melanoma], STAD[Stomach adenocarcinoma], THCA[Thyroid carcinoma], UCEC[Uterine Corpus Endometrial Carcinoma] |
| Top |
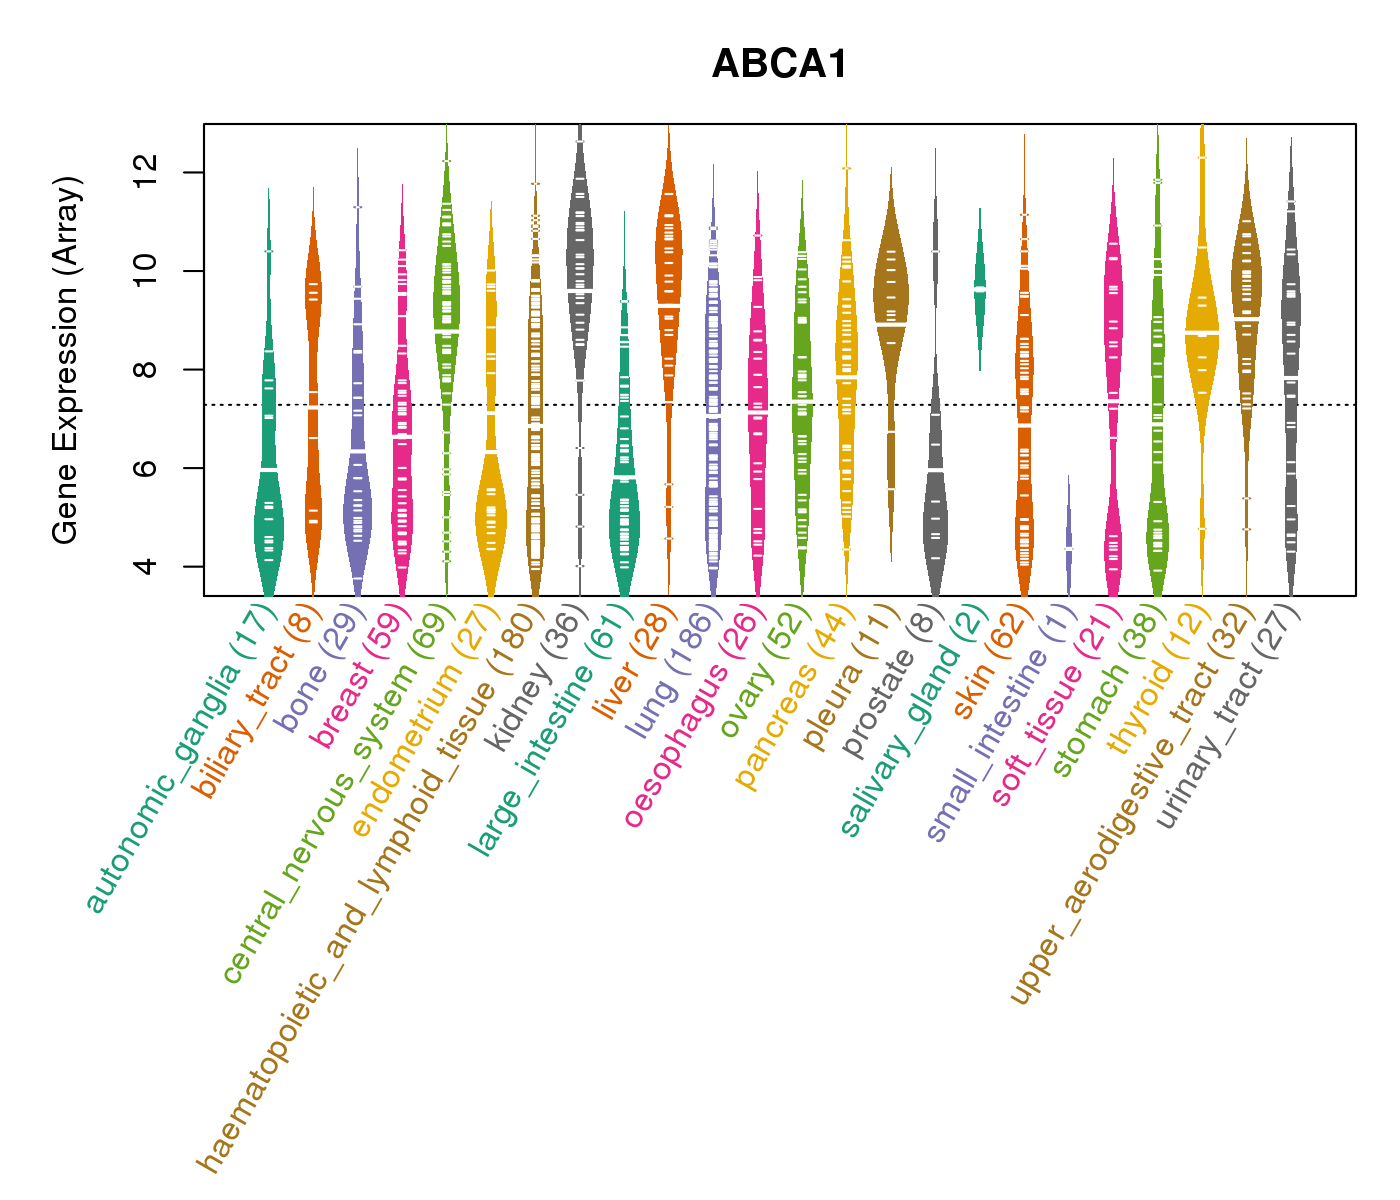
| Gene Expression for ABCA1 |
| * CCLE gene expression data were extracted from CCLE_Expression_Entrez_2012-10-18.res: Gene-centric RMA-normalized mRNA expression data. |
 |
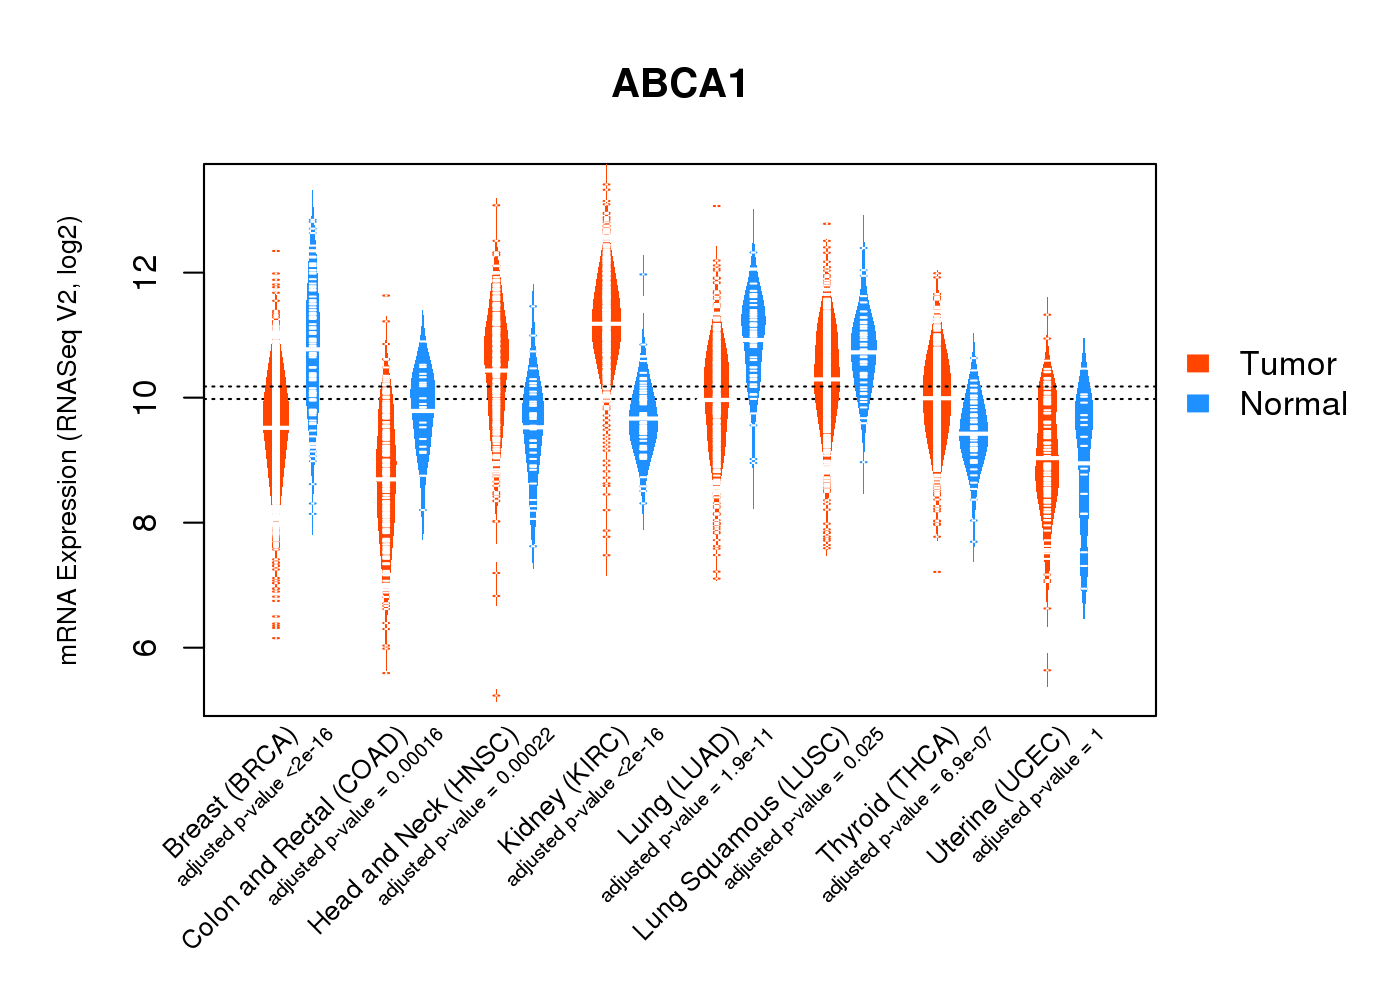
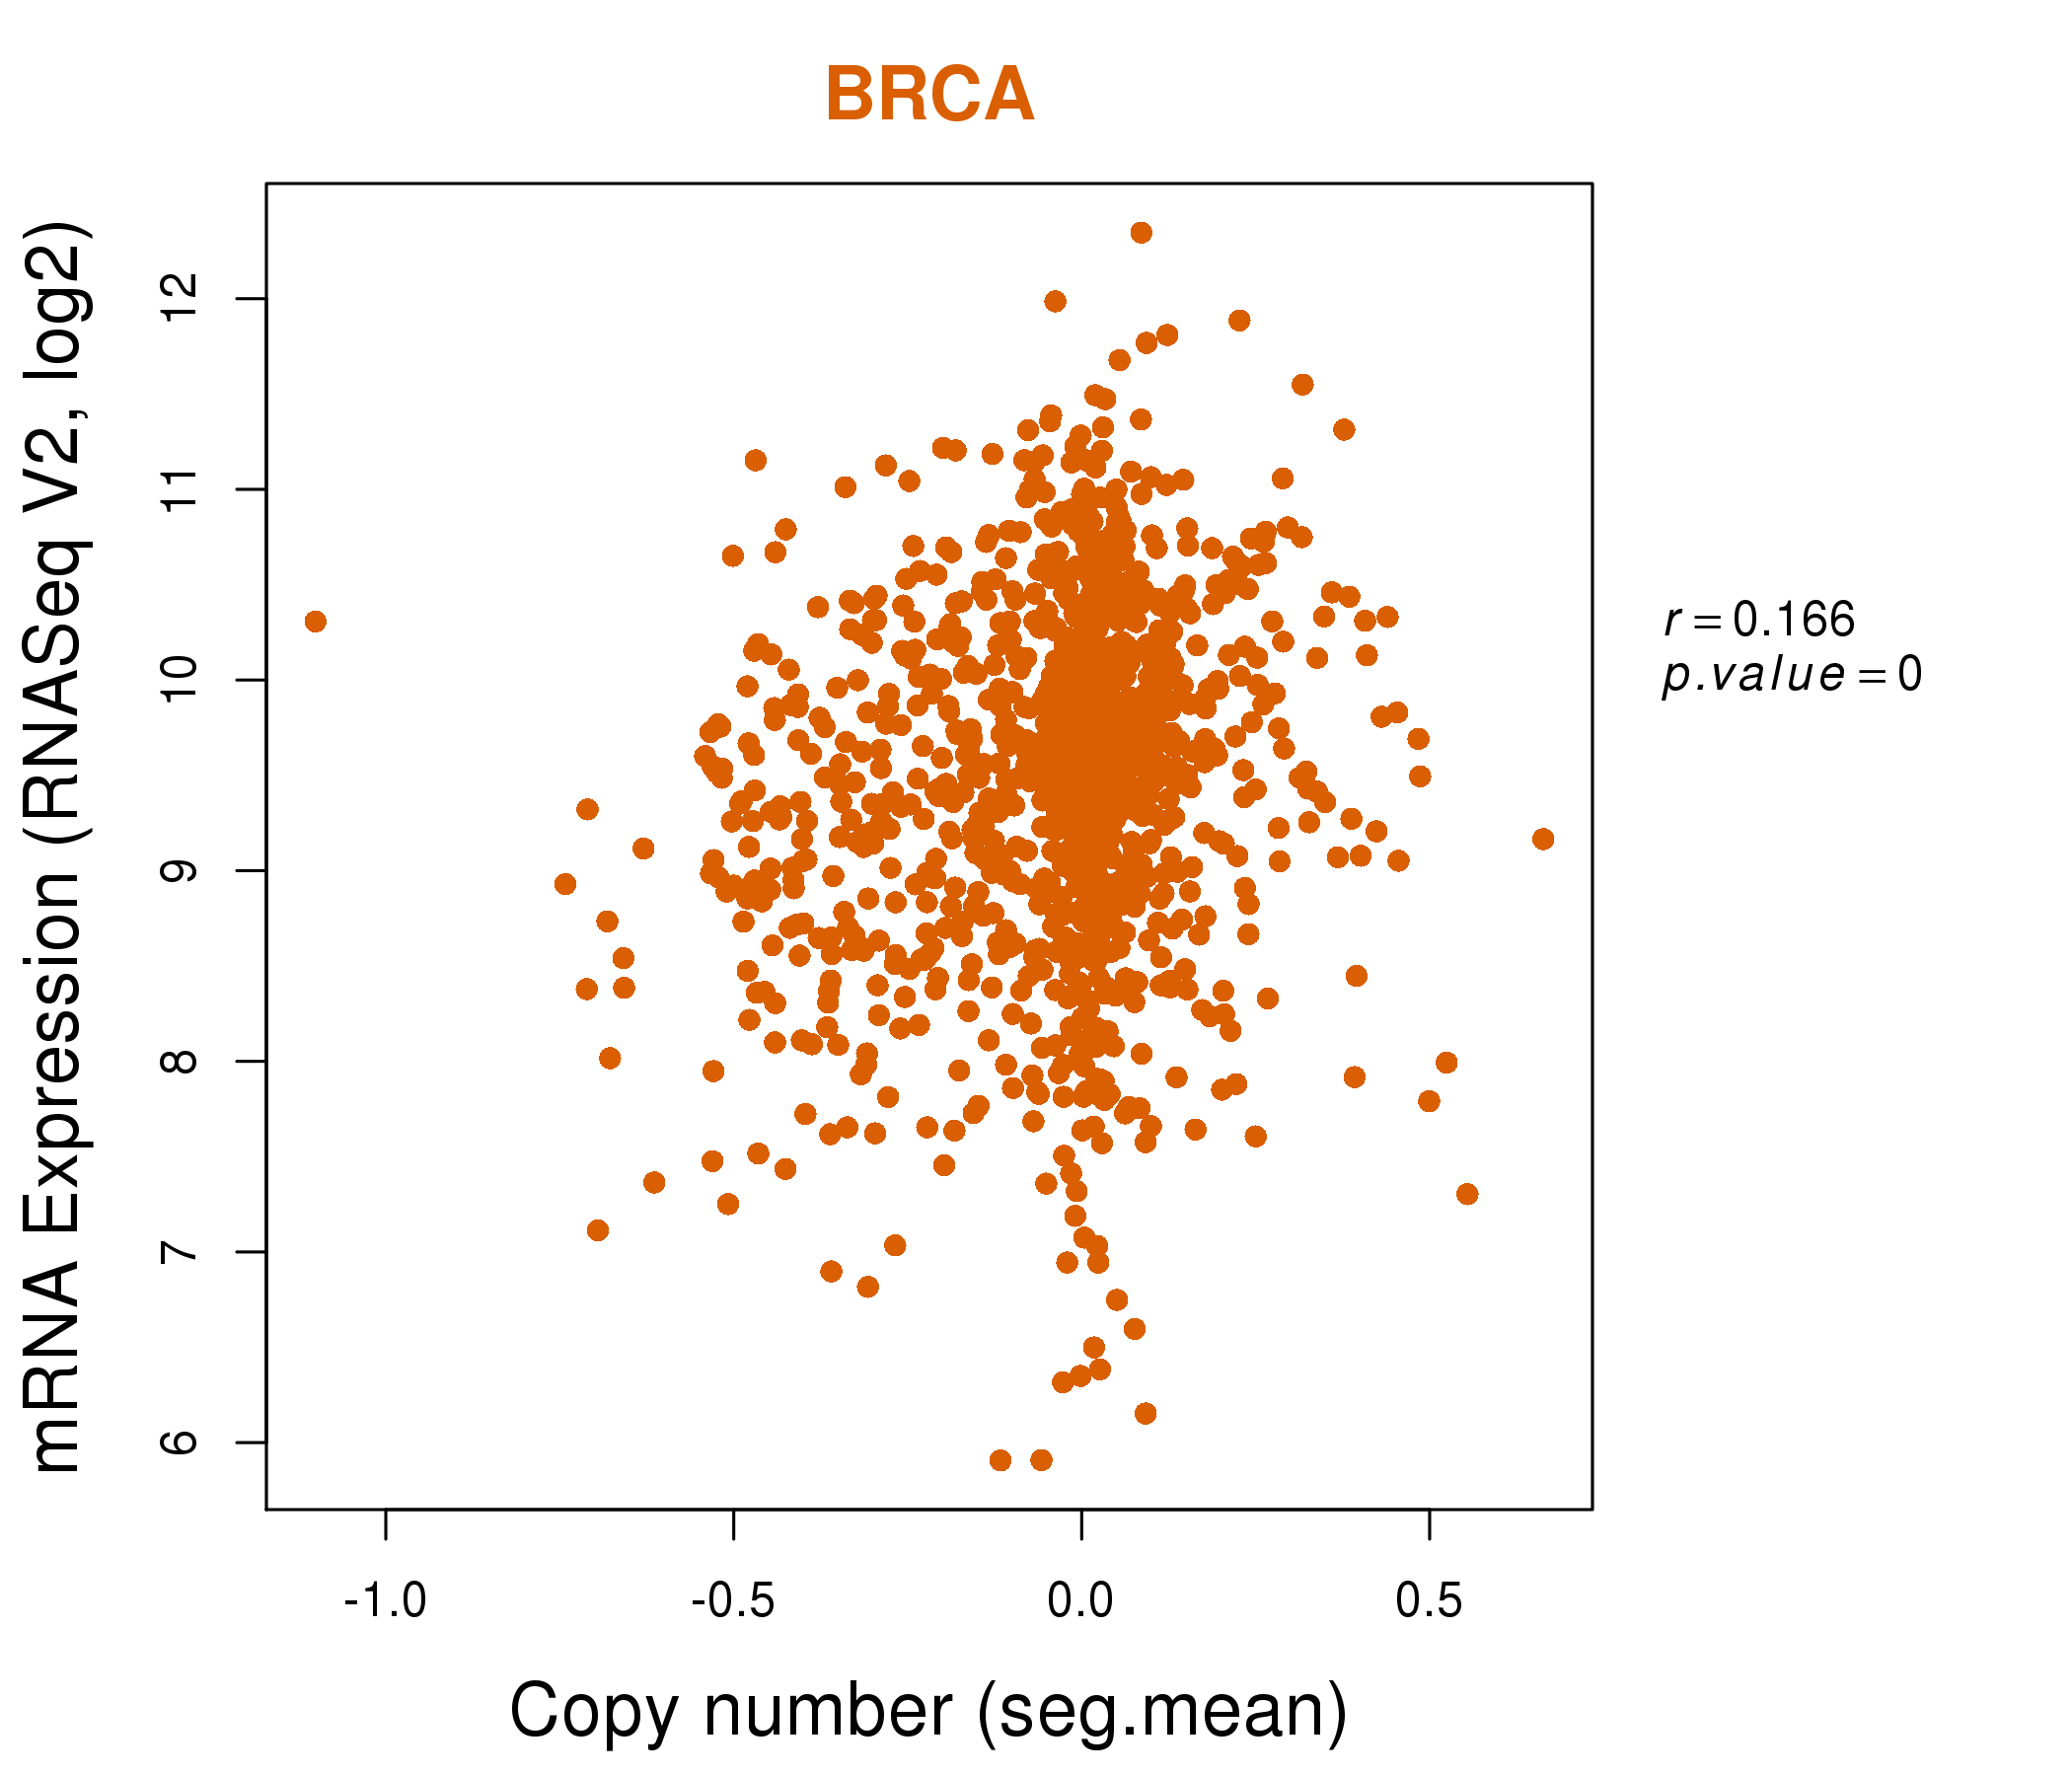
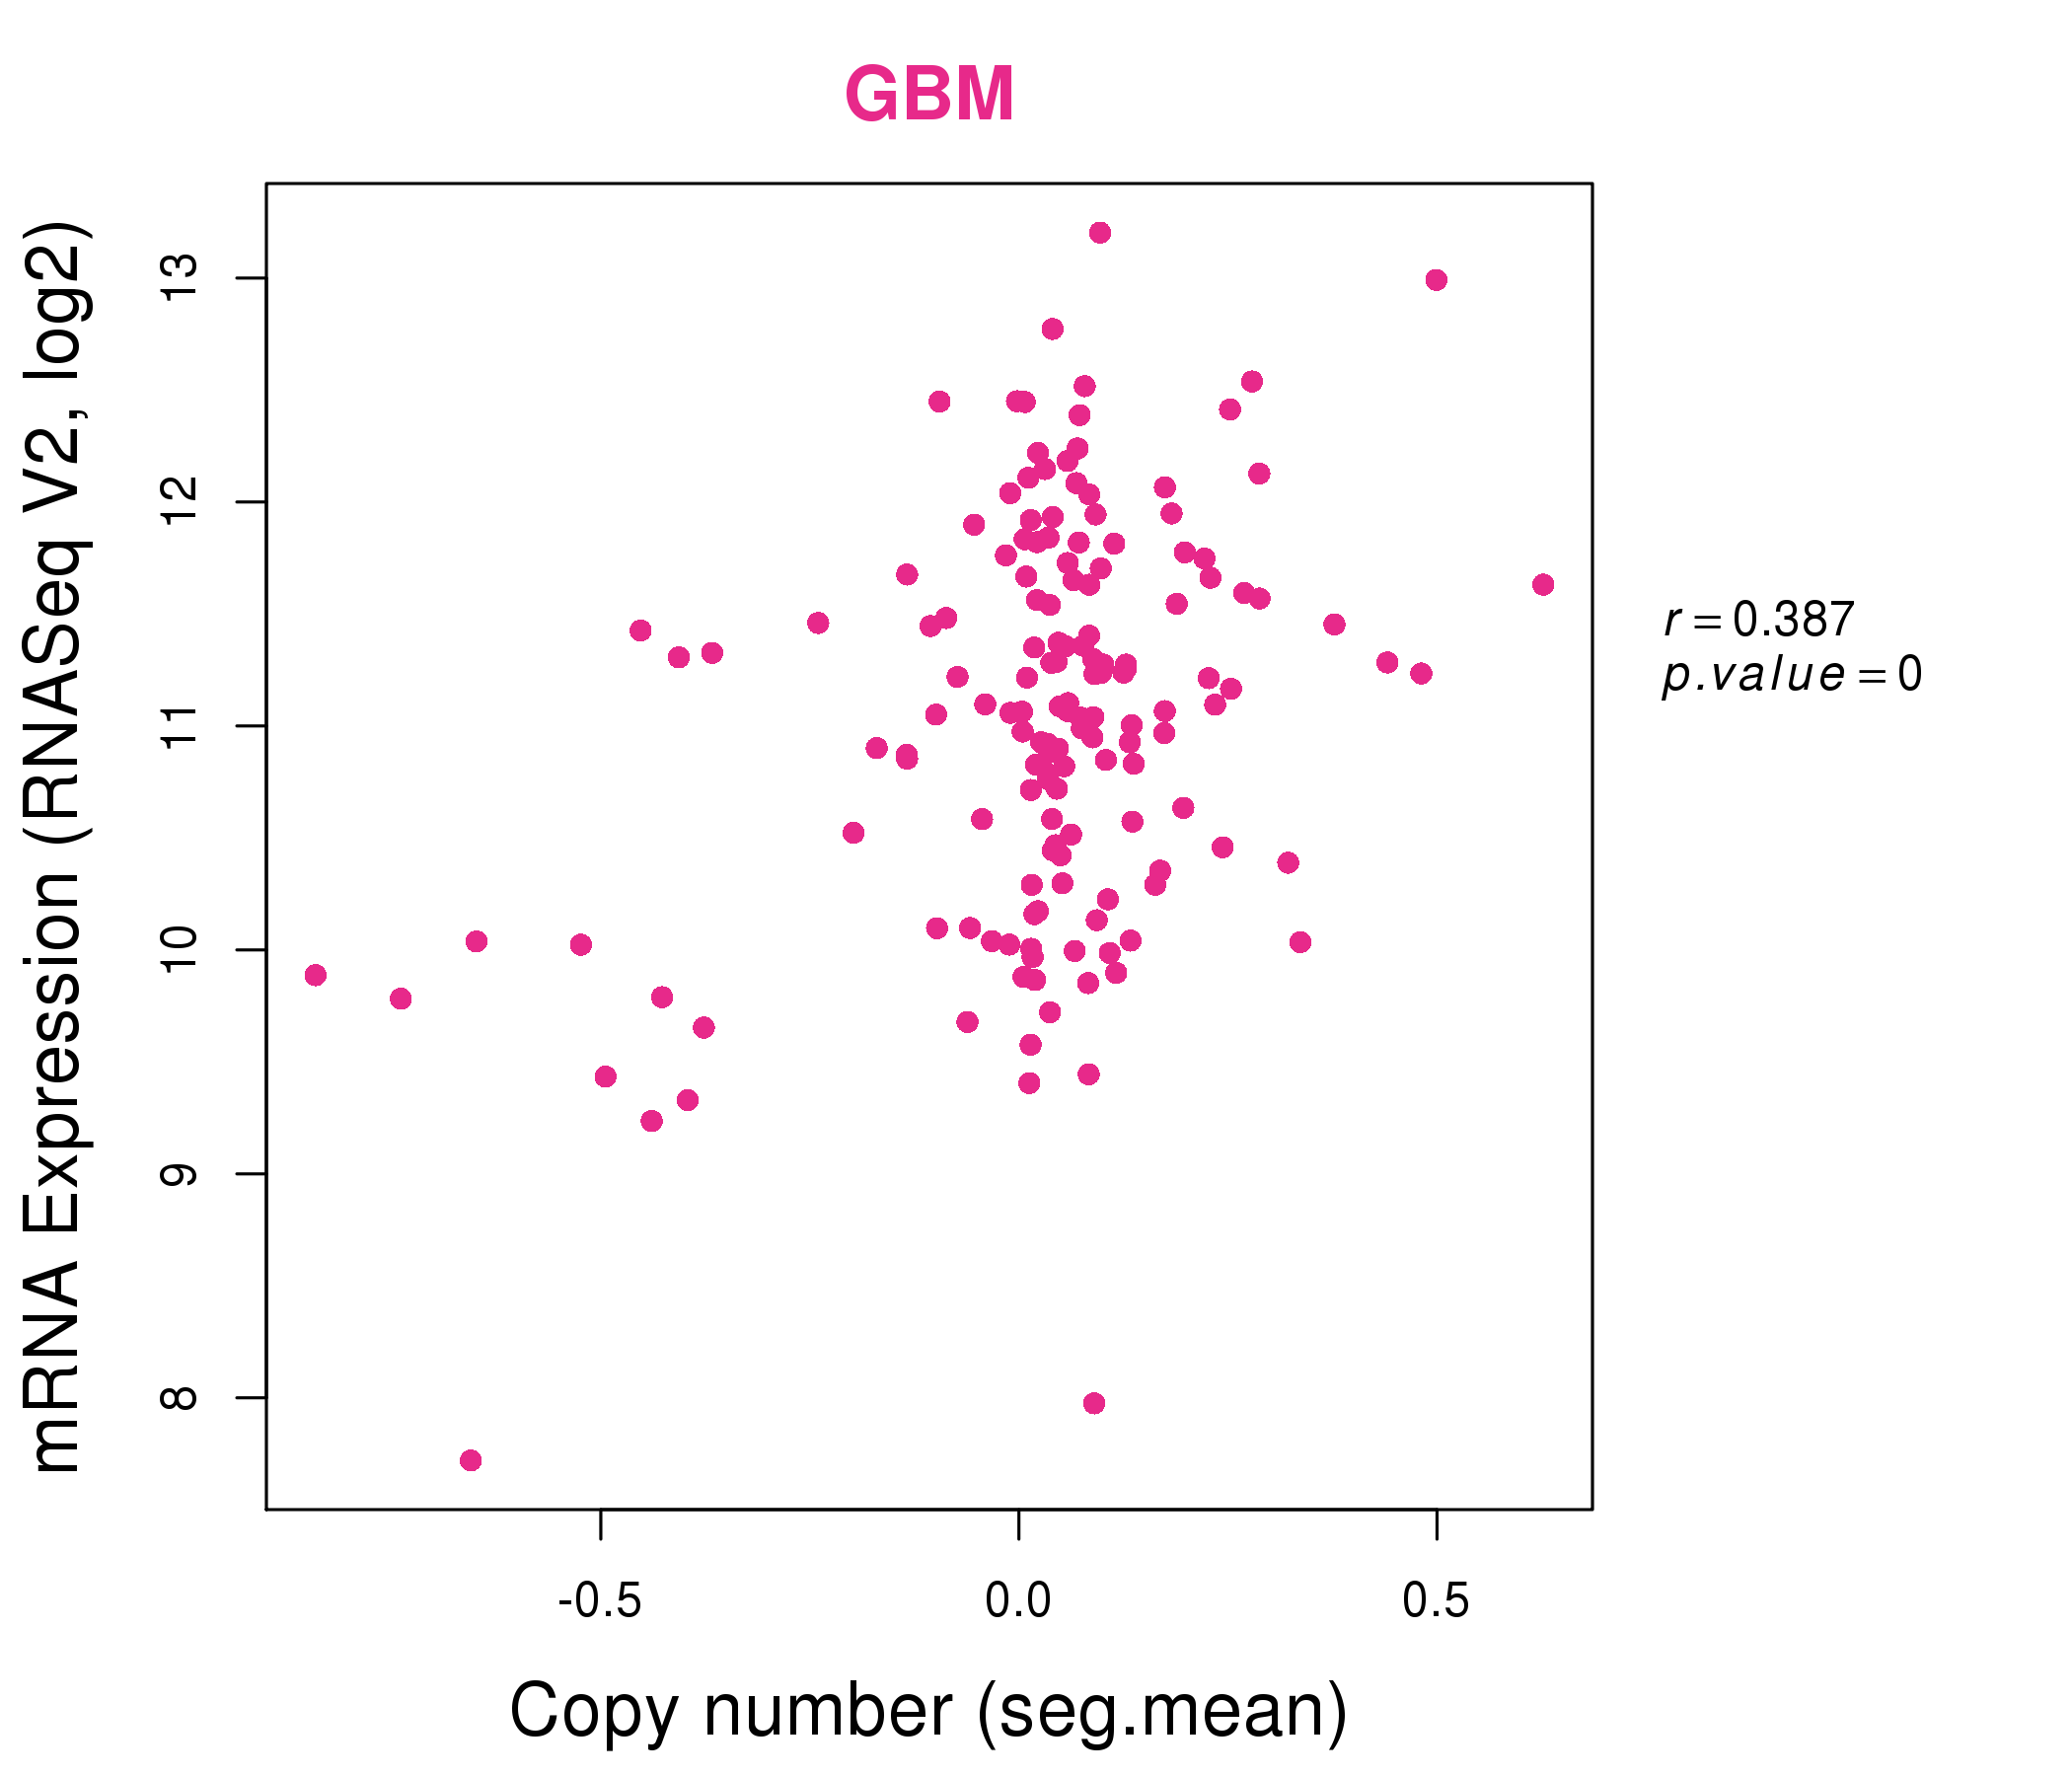
| * Normalized gene expression data of RNASeqV2 was extracted from TCGA using R package TCGA-Assembler. The URLs of all public data files on TCGA DCC data server were gathered at Jan-05-2015. Only eight cancer types have enough normal control samples for differential expression analysis. (t test, adjusted p<0.05 (using Benjamini-Hochberg FDR)) |
 |
| Top |
| * This plots show the correlation between CNV and gene expression. |
: Open all plots for all cancer types
 |
|
 |
|
| Top |
| Gene-Gene Network Information |
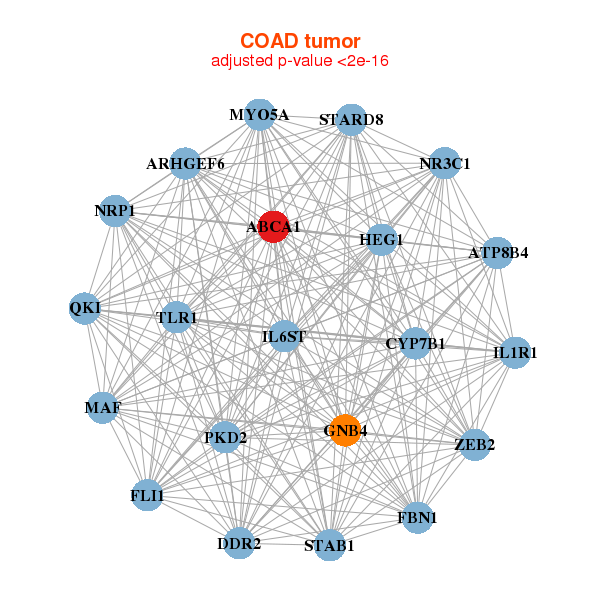
| * Co-Expression network figures were drawn using R package igraph. Only the top 20 genes with the highest correlations were shown. Red circle: input gene, orange circle: cell metabolism gene, sky circle: other gene |
: Open all plots for all cancer types
 |
| ||||
| ABCA1,DOCK11,DOCK4,HEG1,KCTD12,KIAA1033,LEPROT, LHFPL2,MARCH1,MSR1,PCNX,PLXNC1,RAB8B,SETX, PEAK1,SGTB,SLC8A1,SSH1,TLR4,ZEB2,ZNF699 | ABCA1,ABCC9,ANO6,ANTXR2,AQPEP,CD36,CDO1, CELF2,COL4A3BP,CPM,DIAPH2,EBF1,FRMD4A,GHR, GNAI1,JAK1,LAMC1,TENM3___TENM1,PDE8A,RHOBTB3,ZEB2 | ||||
 |
| ||||
| ABCA1,ARHGEF6,ATP8B4,CYP7B1,DDR2,FBN1,FLI1, GNB4,HEG1,IL1R1,IL6ST,MAF,MYO5A,NR3C1, NRP1,PKD2,QKI,STAB1,STARD8,TLR1,ZEB2 | A2M,ABCA1,ARNT,COL4A3BP,FZD1,GIMAP8,GPNMB, HAP1,KDR,LOC283999,LTBP2,PCDH12,PLXND1,RASA3, RRAGD,SLC23A2,SMG6,SRGAP3,TLE4,UBE4B,WASF2 |
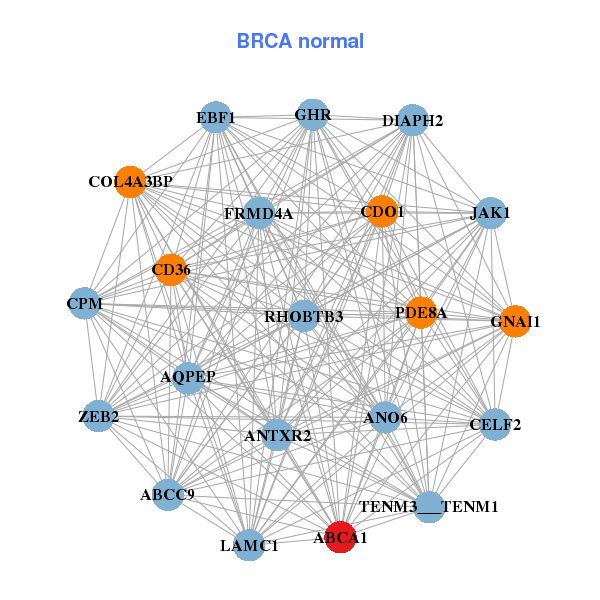

| * Co-Expression network figures were drawn using R package igraph. Only the top 20 genes with the highest correlations were shown. Red circle: input gene, orange circle: cell metabolism gene, sky circle: other gene |
: Open all plots for all cancer types
| Top |
: Open all interacting genes' information including KEGG pathway for all interacting genes from DAVID
| Top |
| Pharmacological Information for ABCA1 |
| DB Category | DB Name | DB's ID and Url link |
| Chemistry | ChEMBL | CHEMBL2362986; -. |
| Chemistry | GuidetoPHARMACOLOGY | 756; -. |
| Chemistry | ChEMBL | CHEMBL2362986; -. |
| Chemistry | GuidetoPHARMACOLOGY | 756; -. |
| Organism-specific databases | PharmGKB | PA24373; -. |
| Organism-specific databases | PharmGKB | PA24373; -. |
| Organism-specific databases | CTD | 19; -. |
| Organism-specific databases | CTD | 19; -. |
| * Gene Centered Interaction Network. |
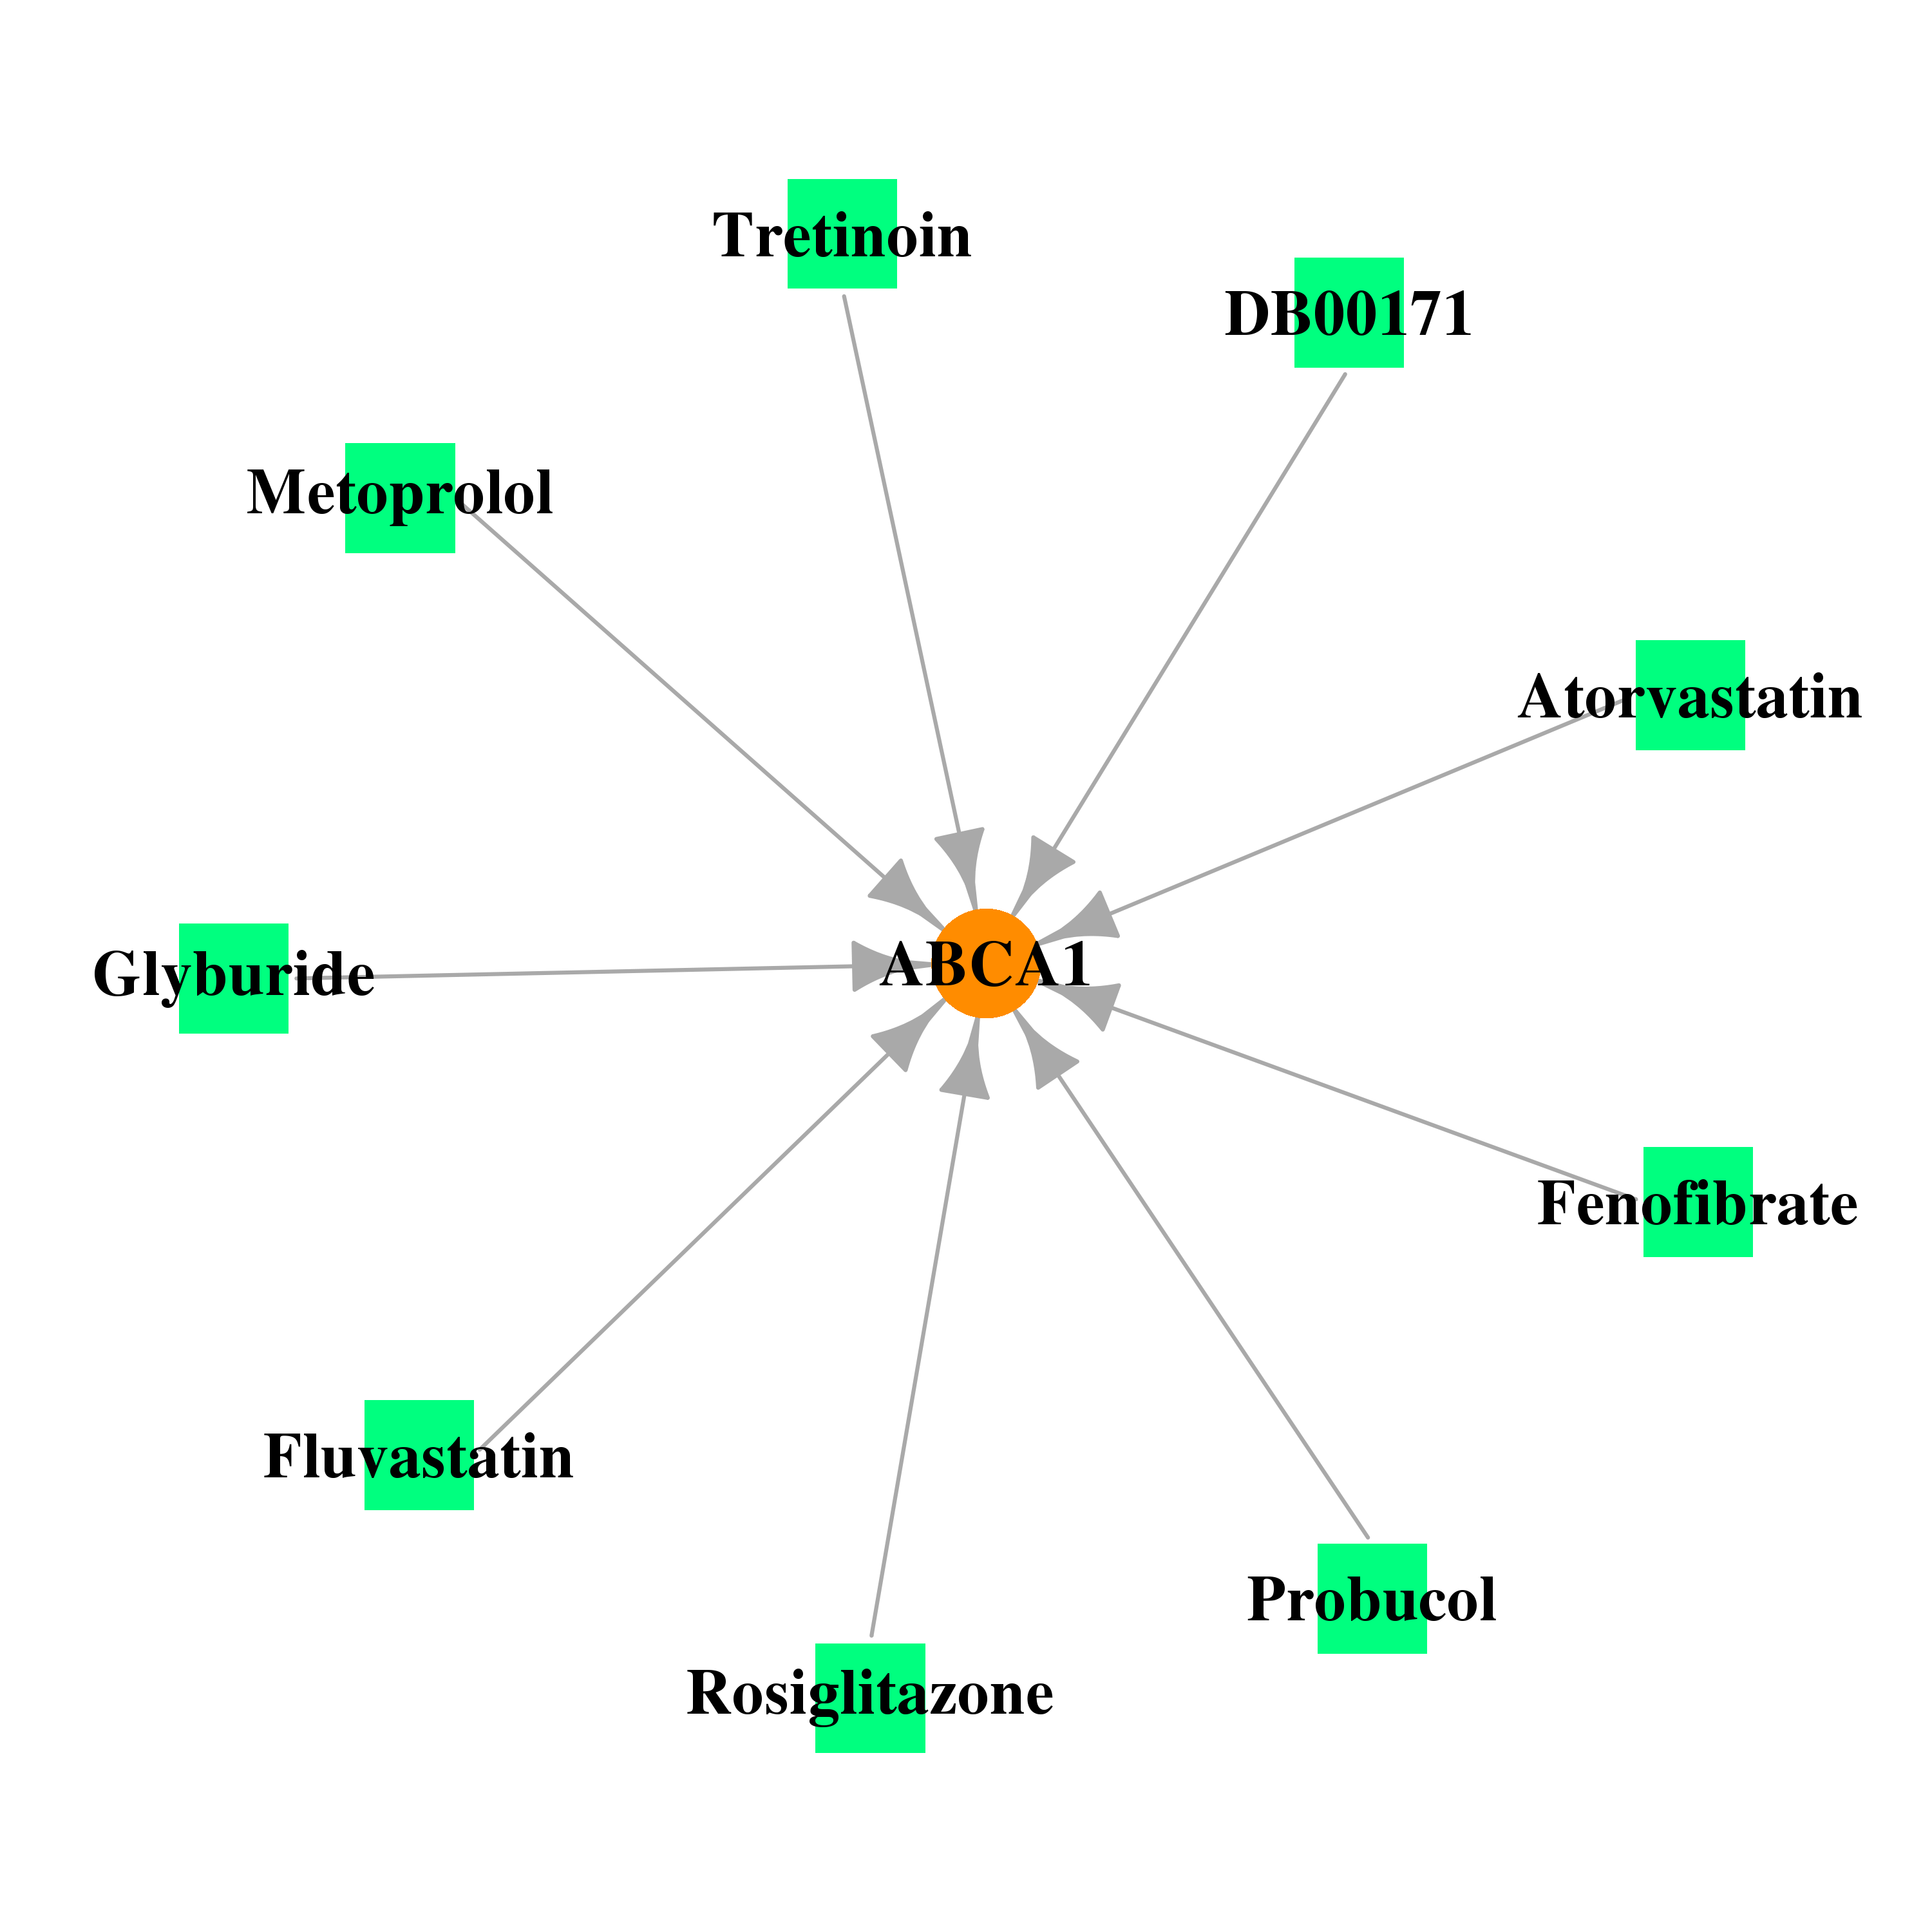 |
| * Drug Centered Interaction Network. |
| DrugBank ID | Target Name | Drug Groups | Generic Name | Drug Centered Network | Drug Structure |
| DB00171 | ATP-binding cassette, sub-family A (ABC1), member 1 | approved; nutraceutical | Adenosine triphosphate |  |  |
| DB01016 | ATP-binding cassette, sub-family A (ABC1), member 1 | approved | Glyburide | 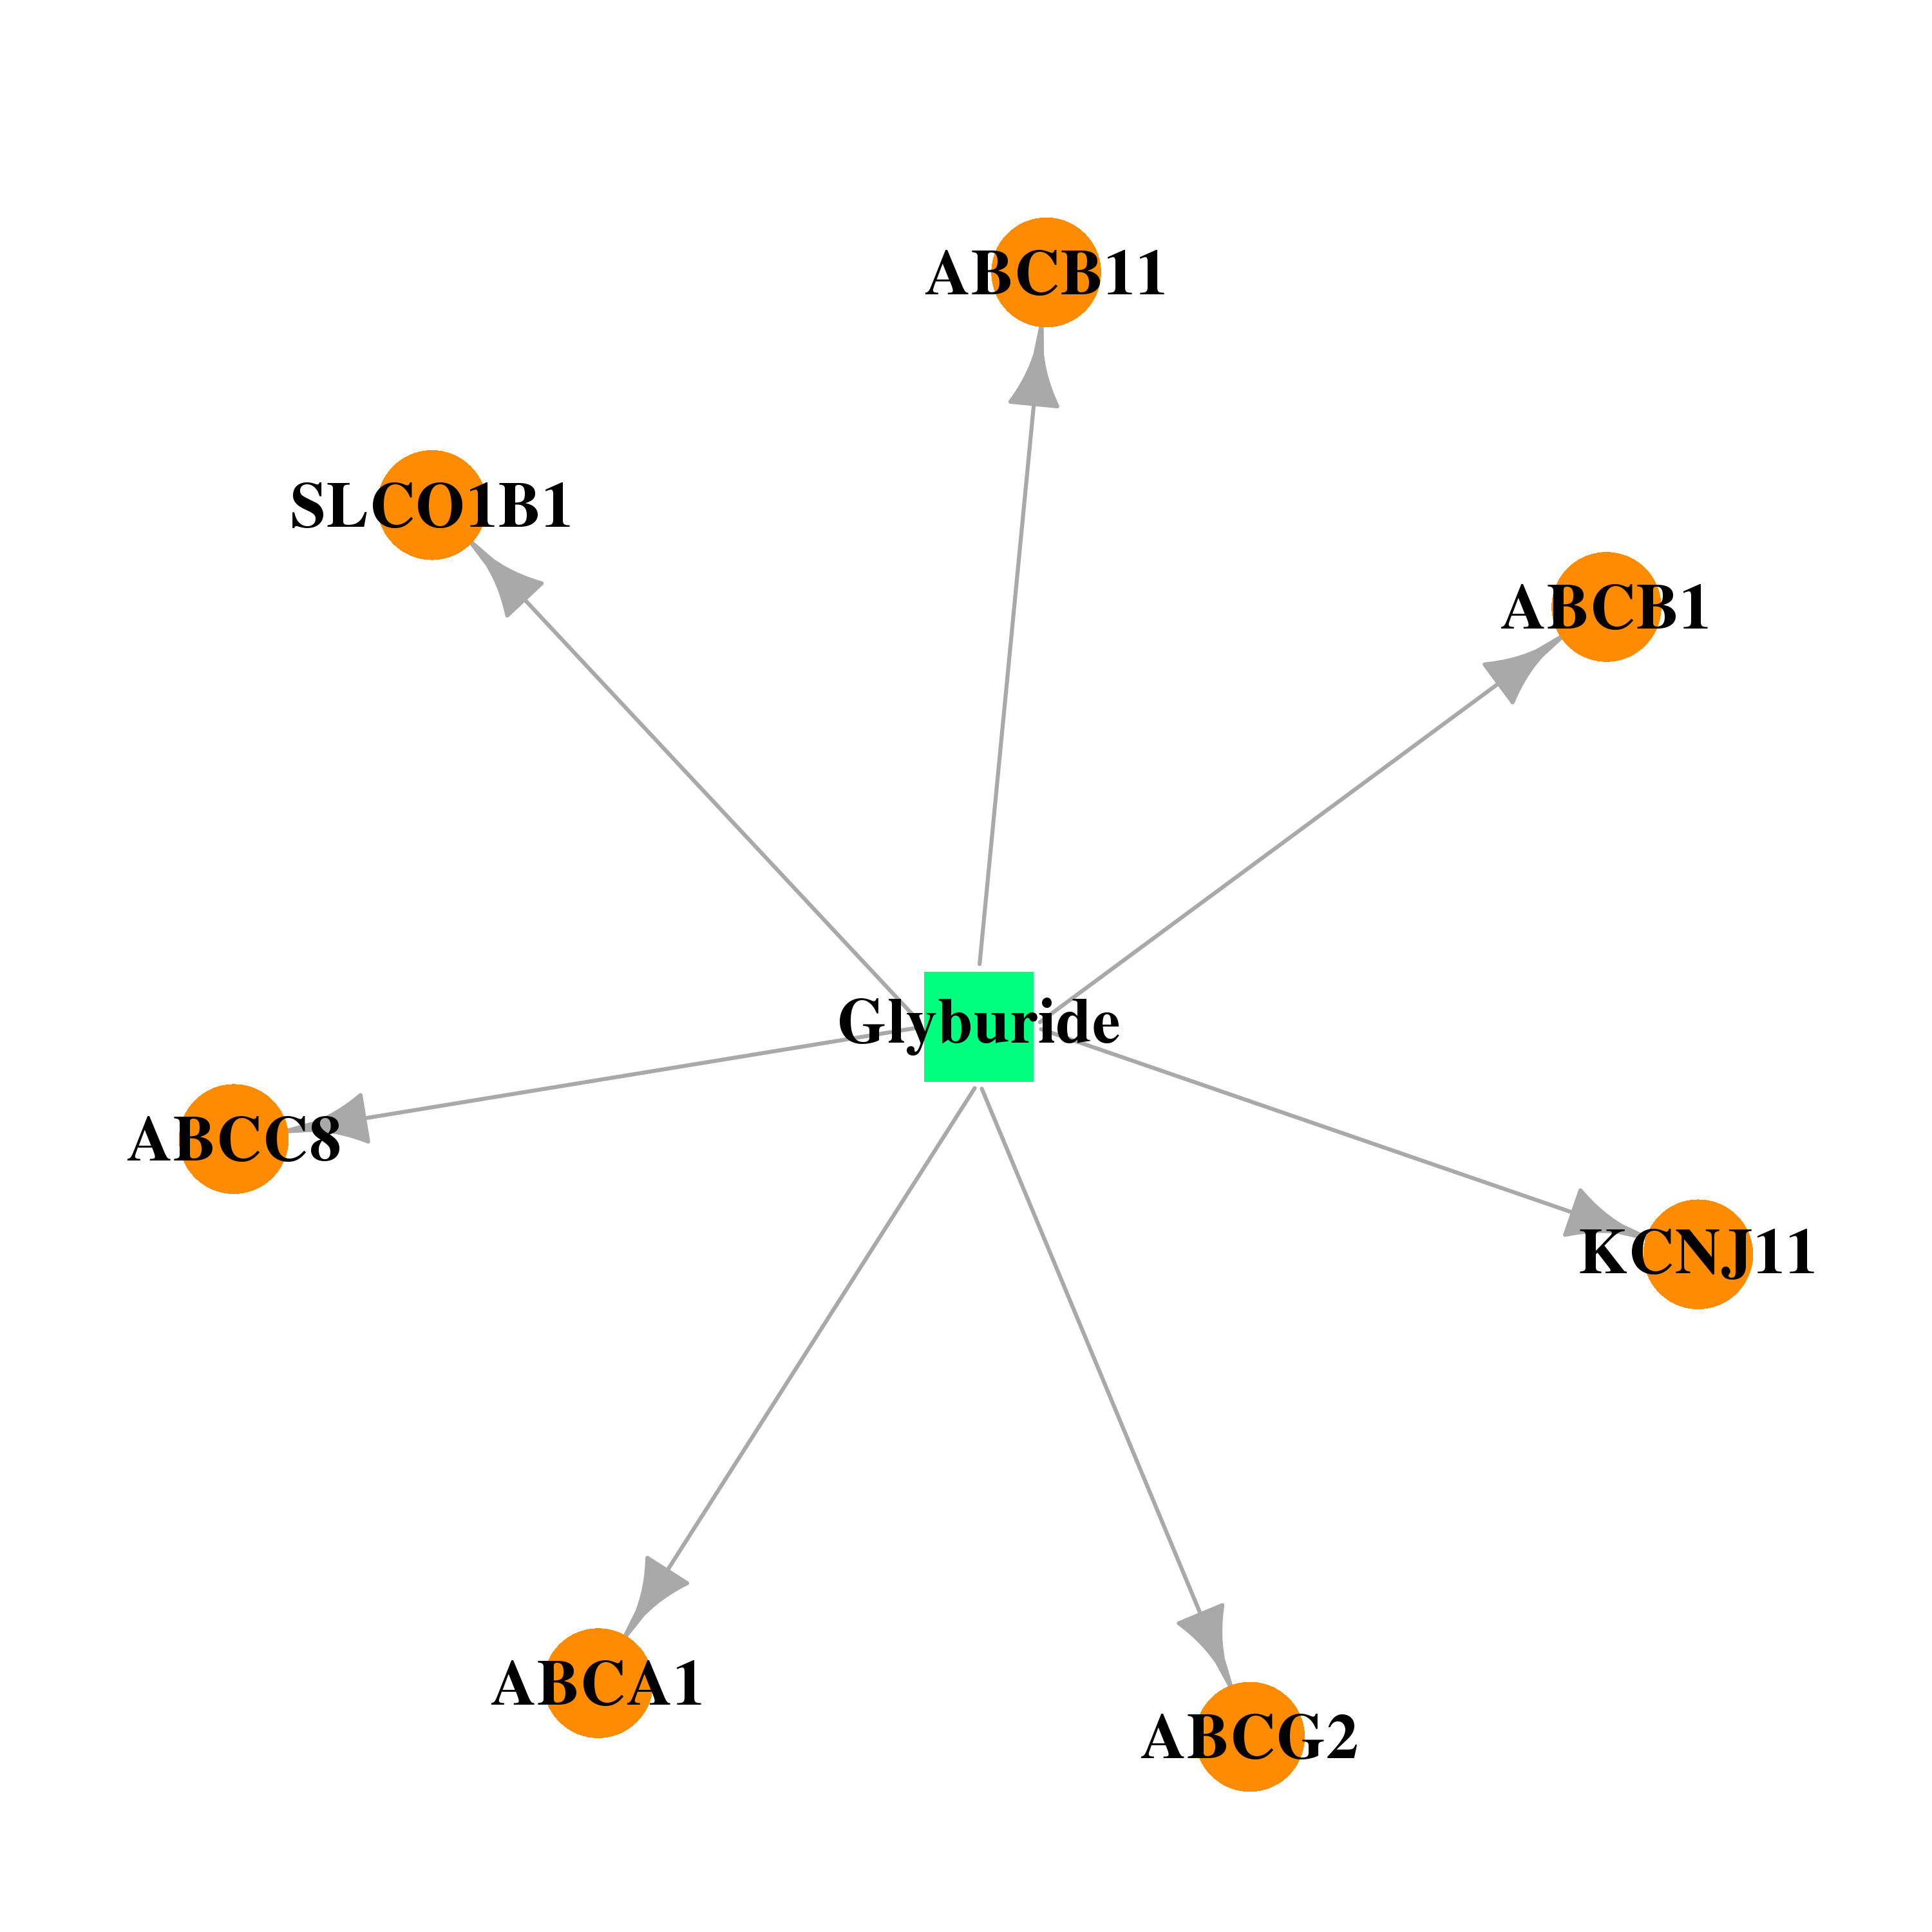 |  |
| DB01599 | ATP-binding cassette, sub-family A (ABC1), member 1 | approved | Probucol | 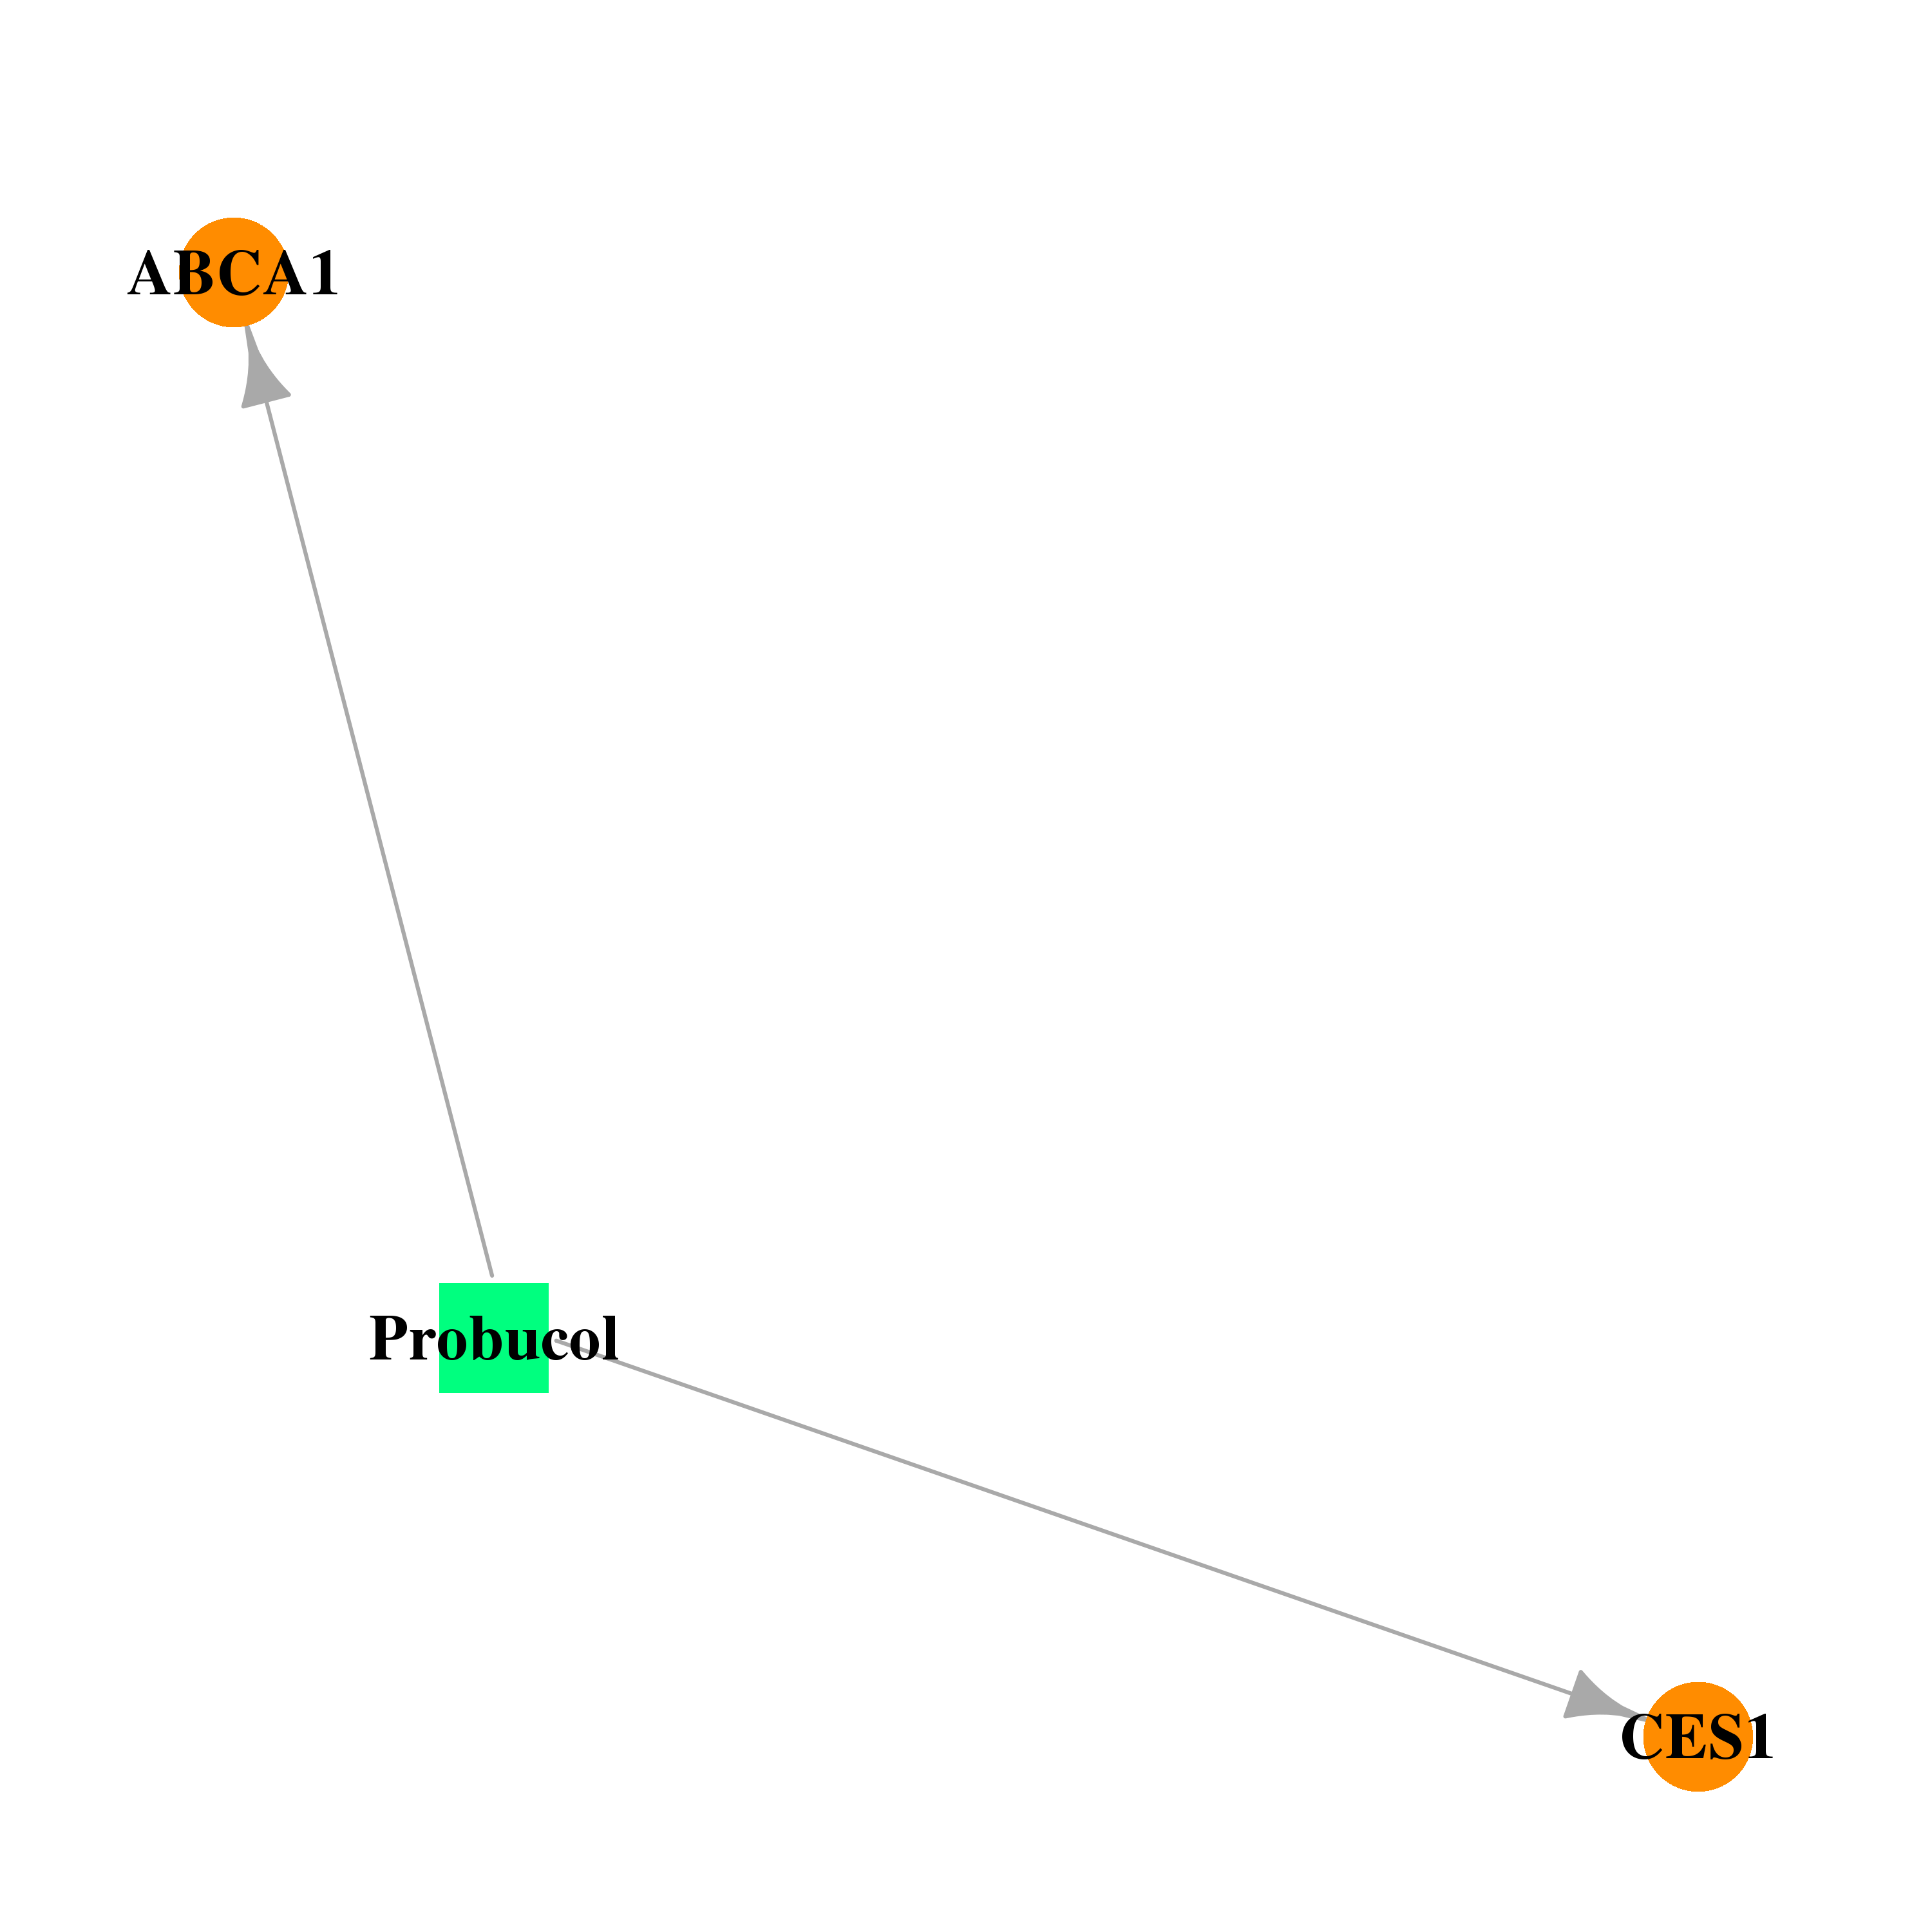 | 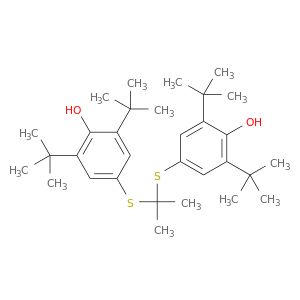 |
| DB01039 | ATP-binding cassette, sub-family A (ABC1), member 1 | approved | Fenofibrate | 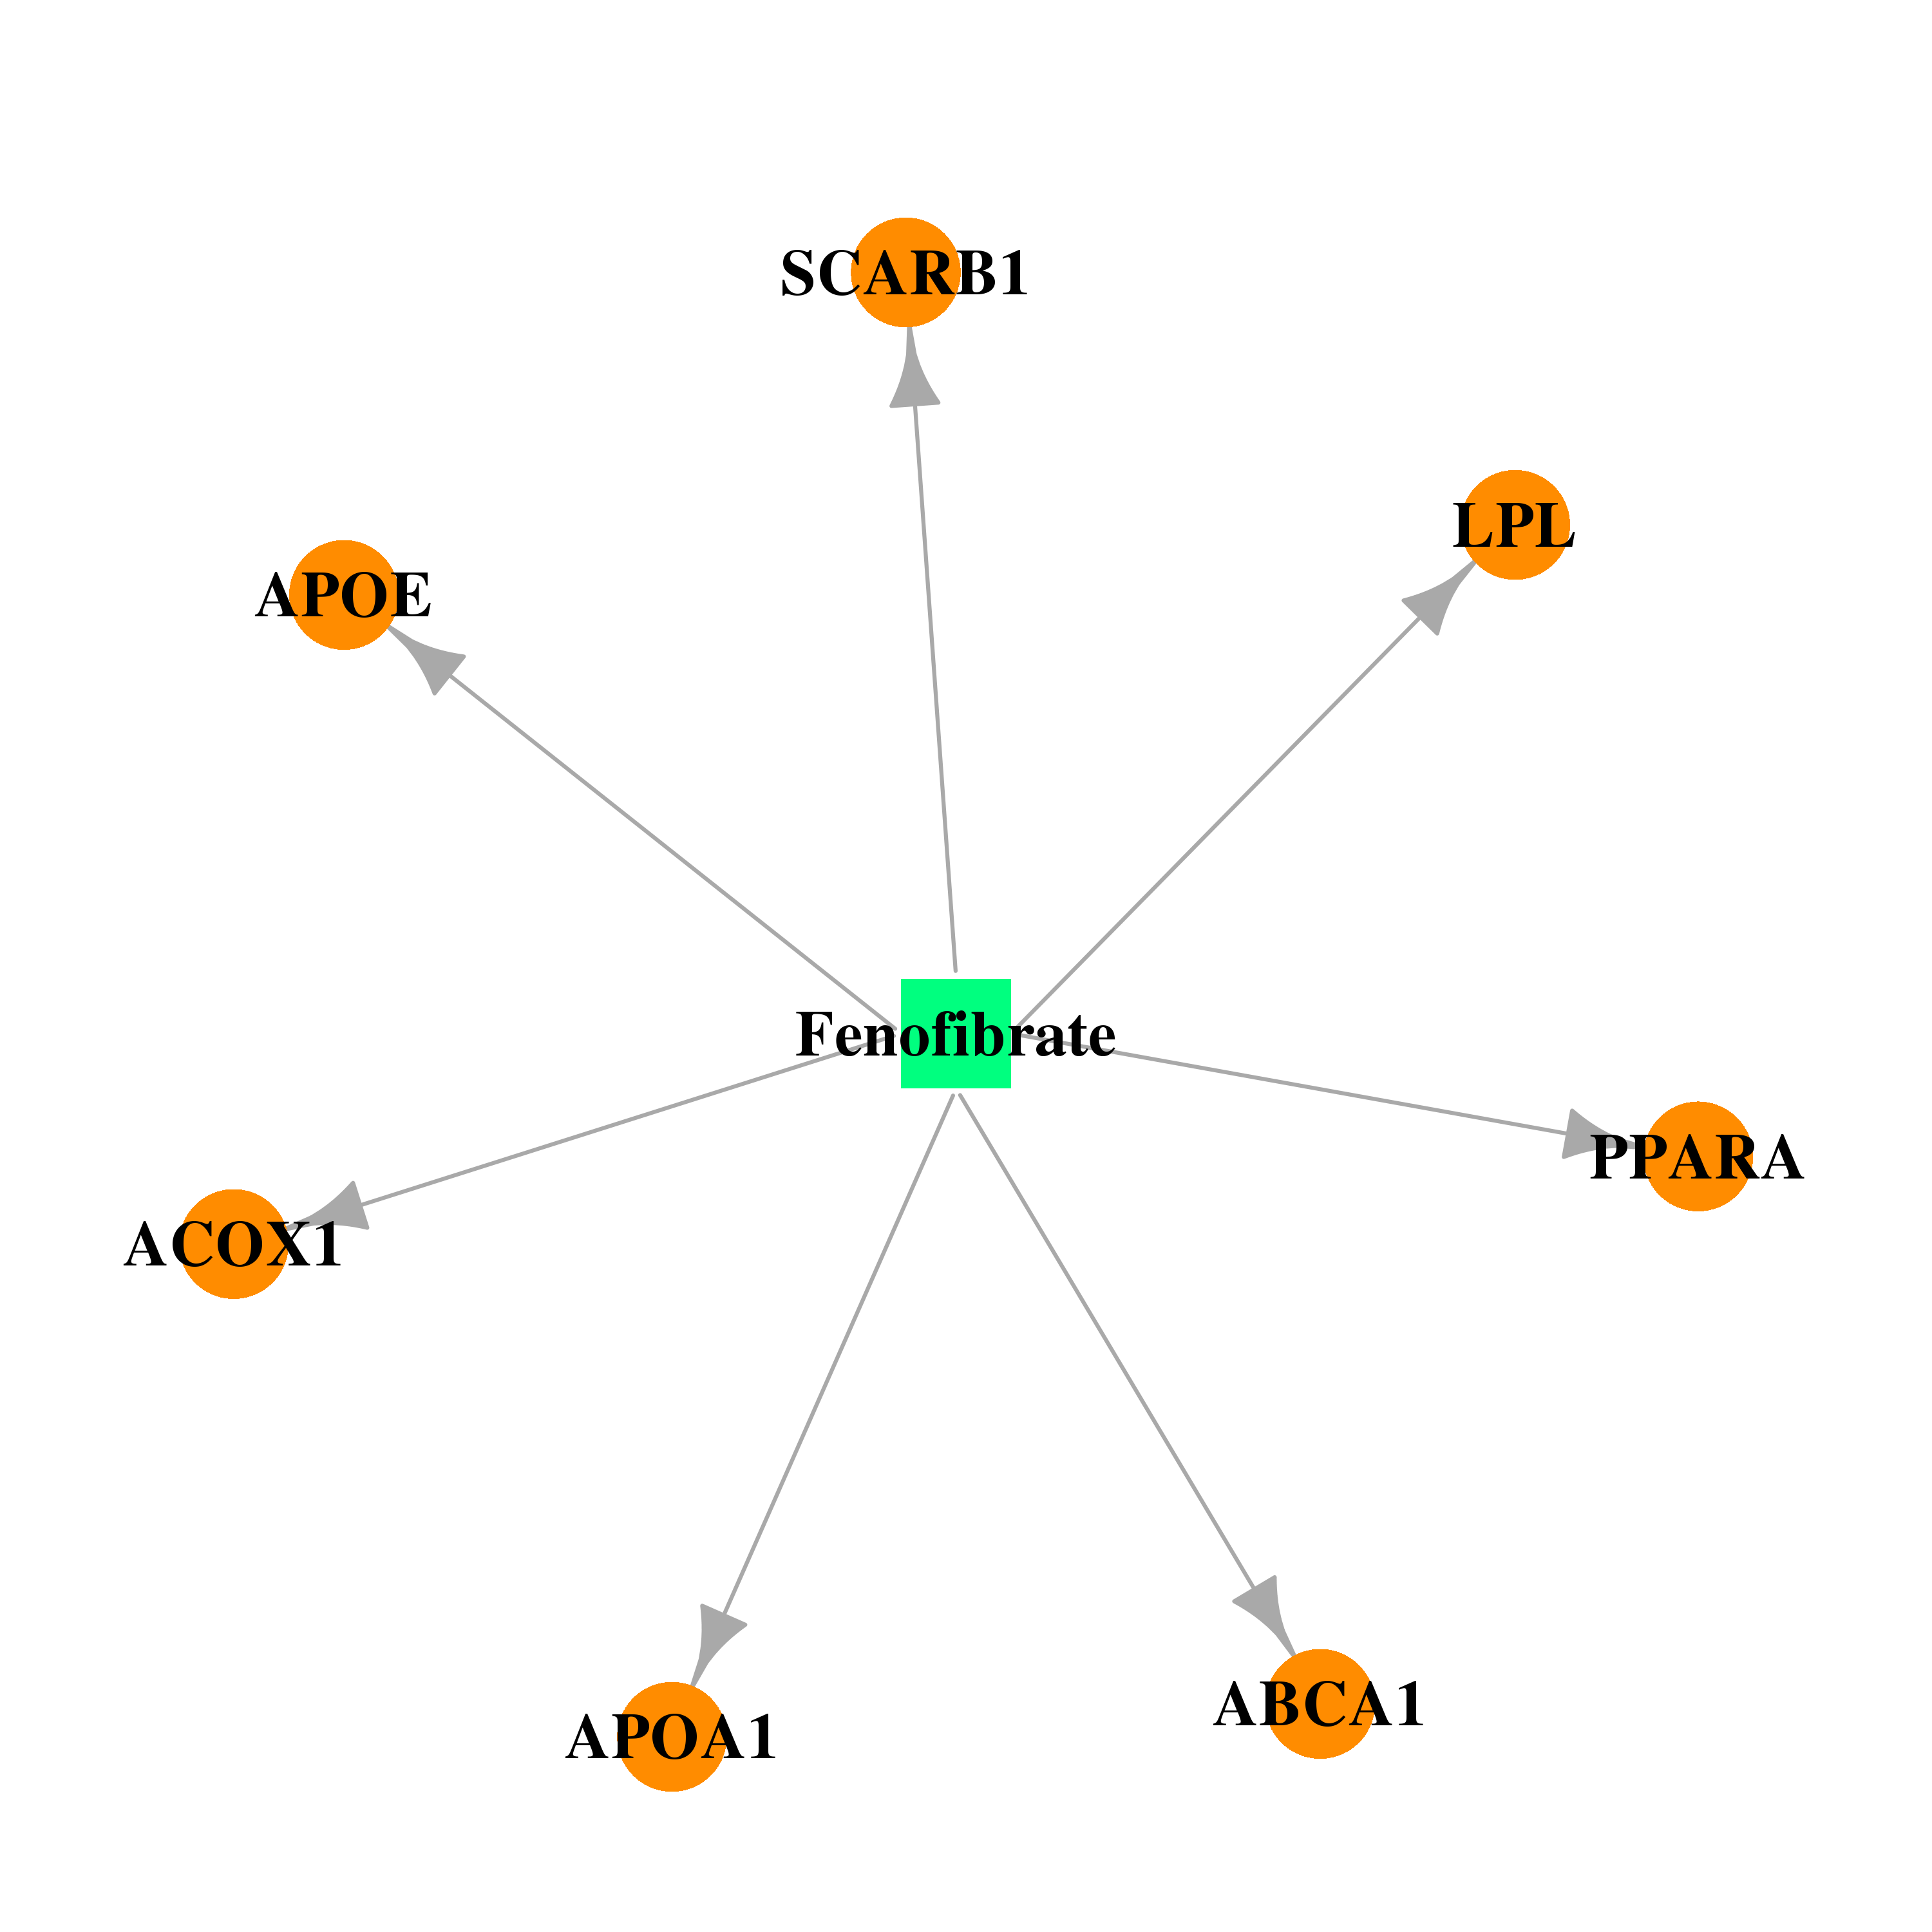 | 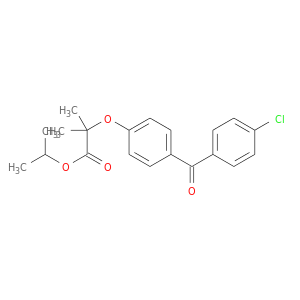 |
| DB01076 | ATP-binding cassette, sub-family A (ABC1), member 1 | approved | Atorvastatin | 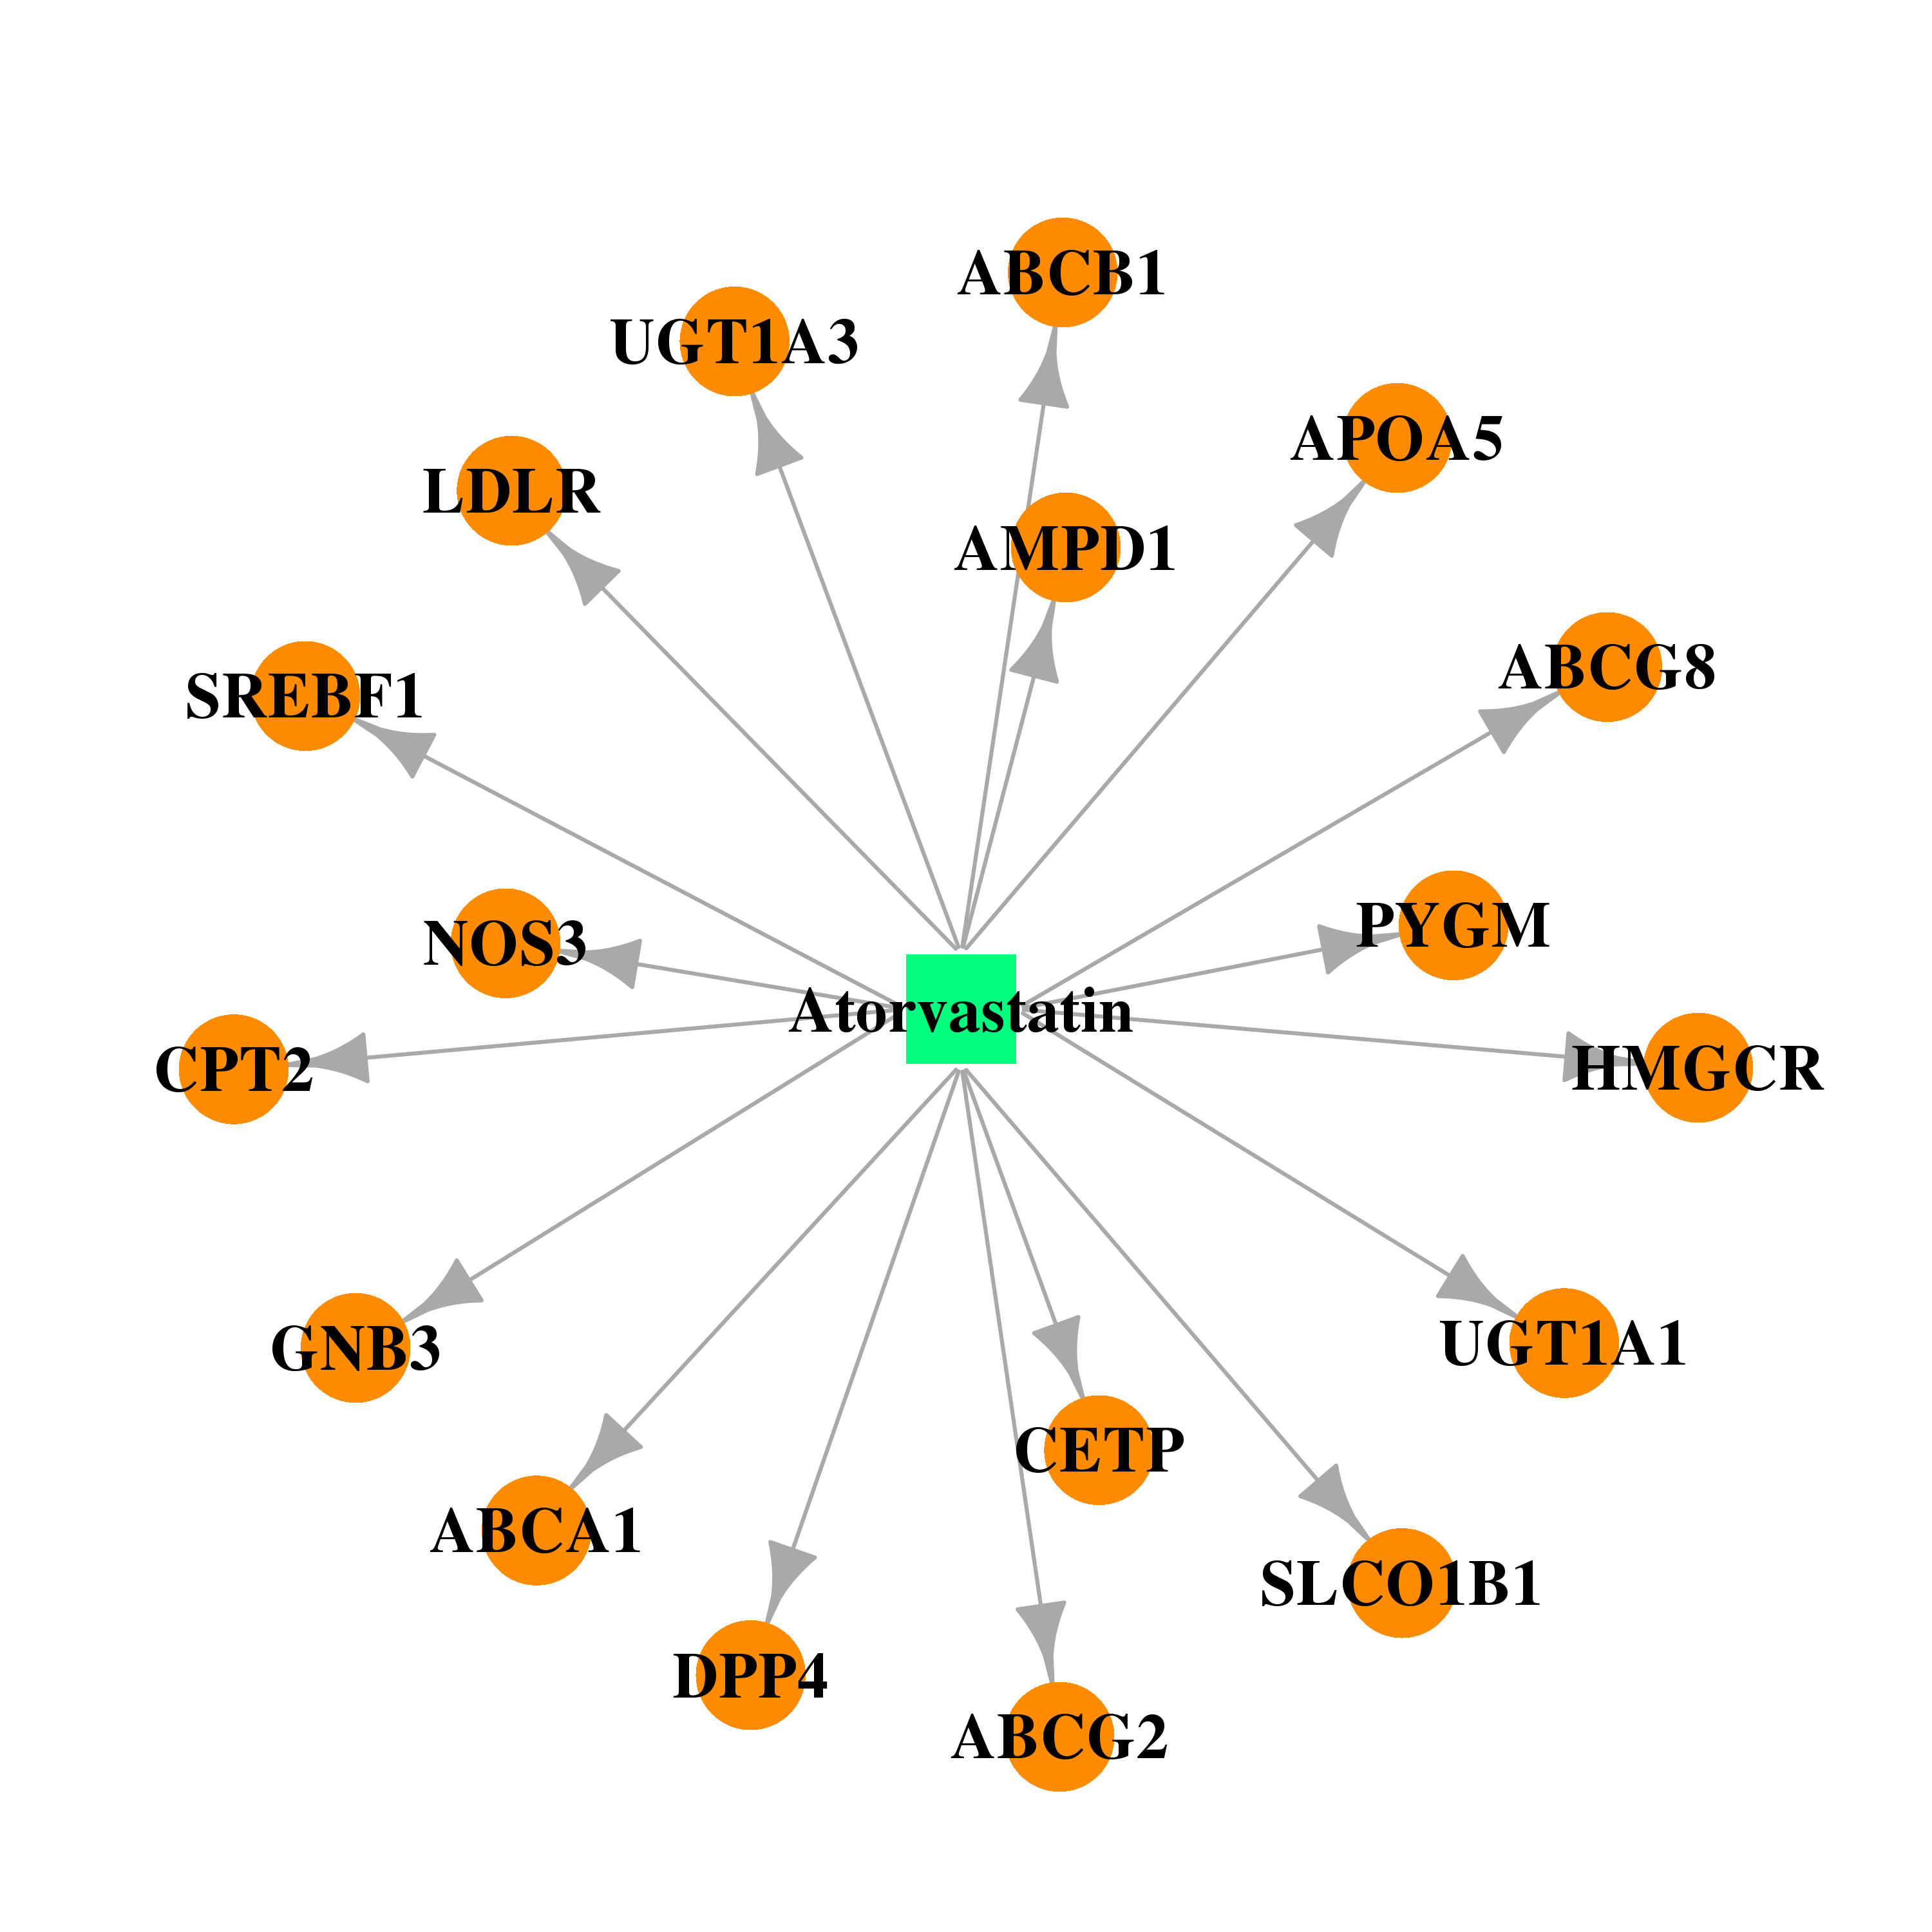 | 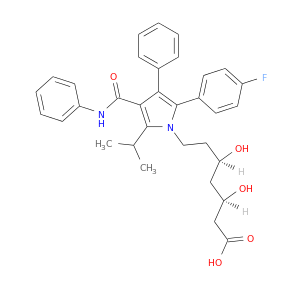 |
| DB00755 | ATP-binding cassette, sub-family A (ABC1), member 1 | approved; nutraceutical; investigational | Tretinoin | 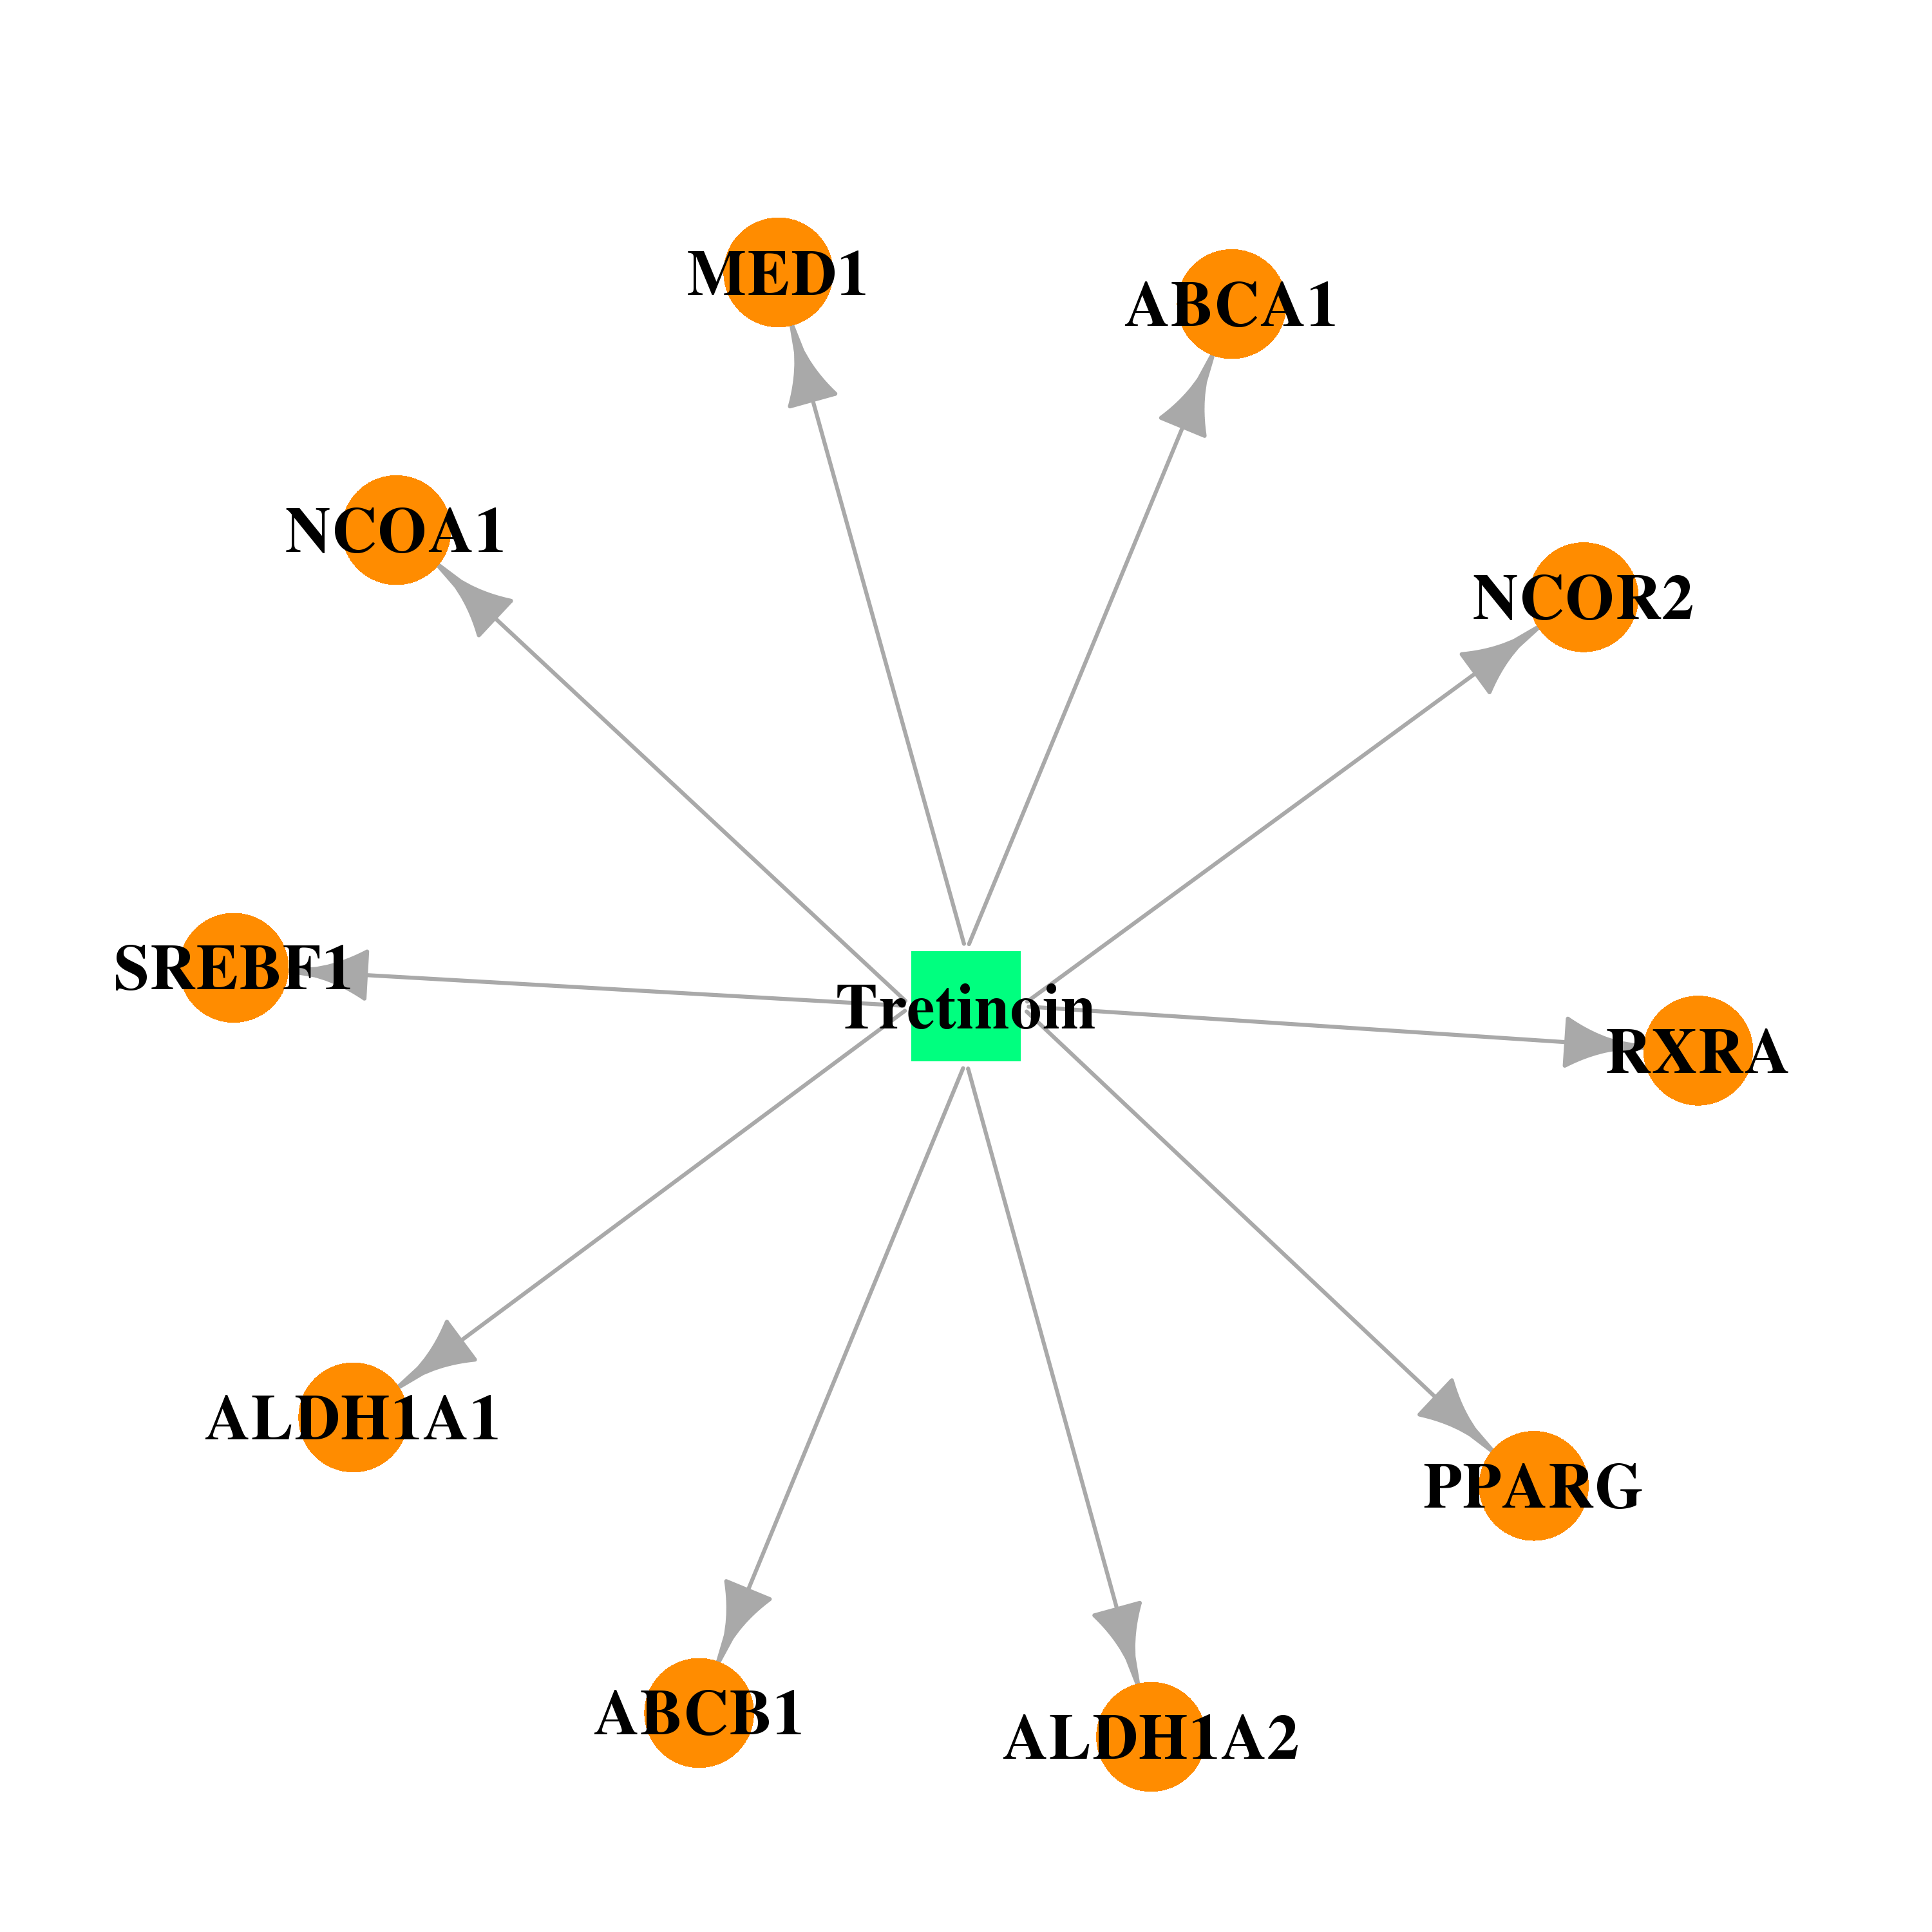 | 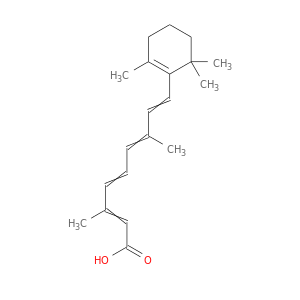 |
| DB01095 | ATP-binding cassette, sub-family A (ABC1), member 1 | approved | Fluvastatin | 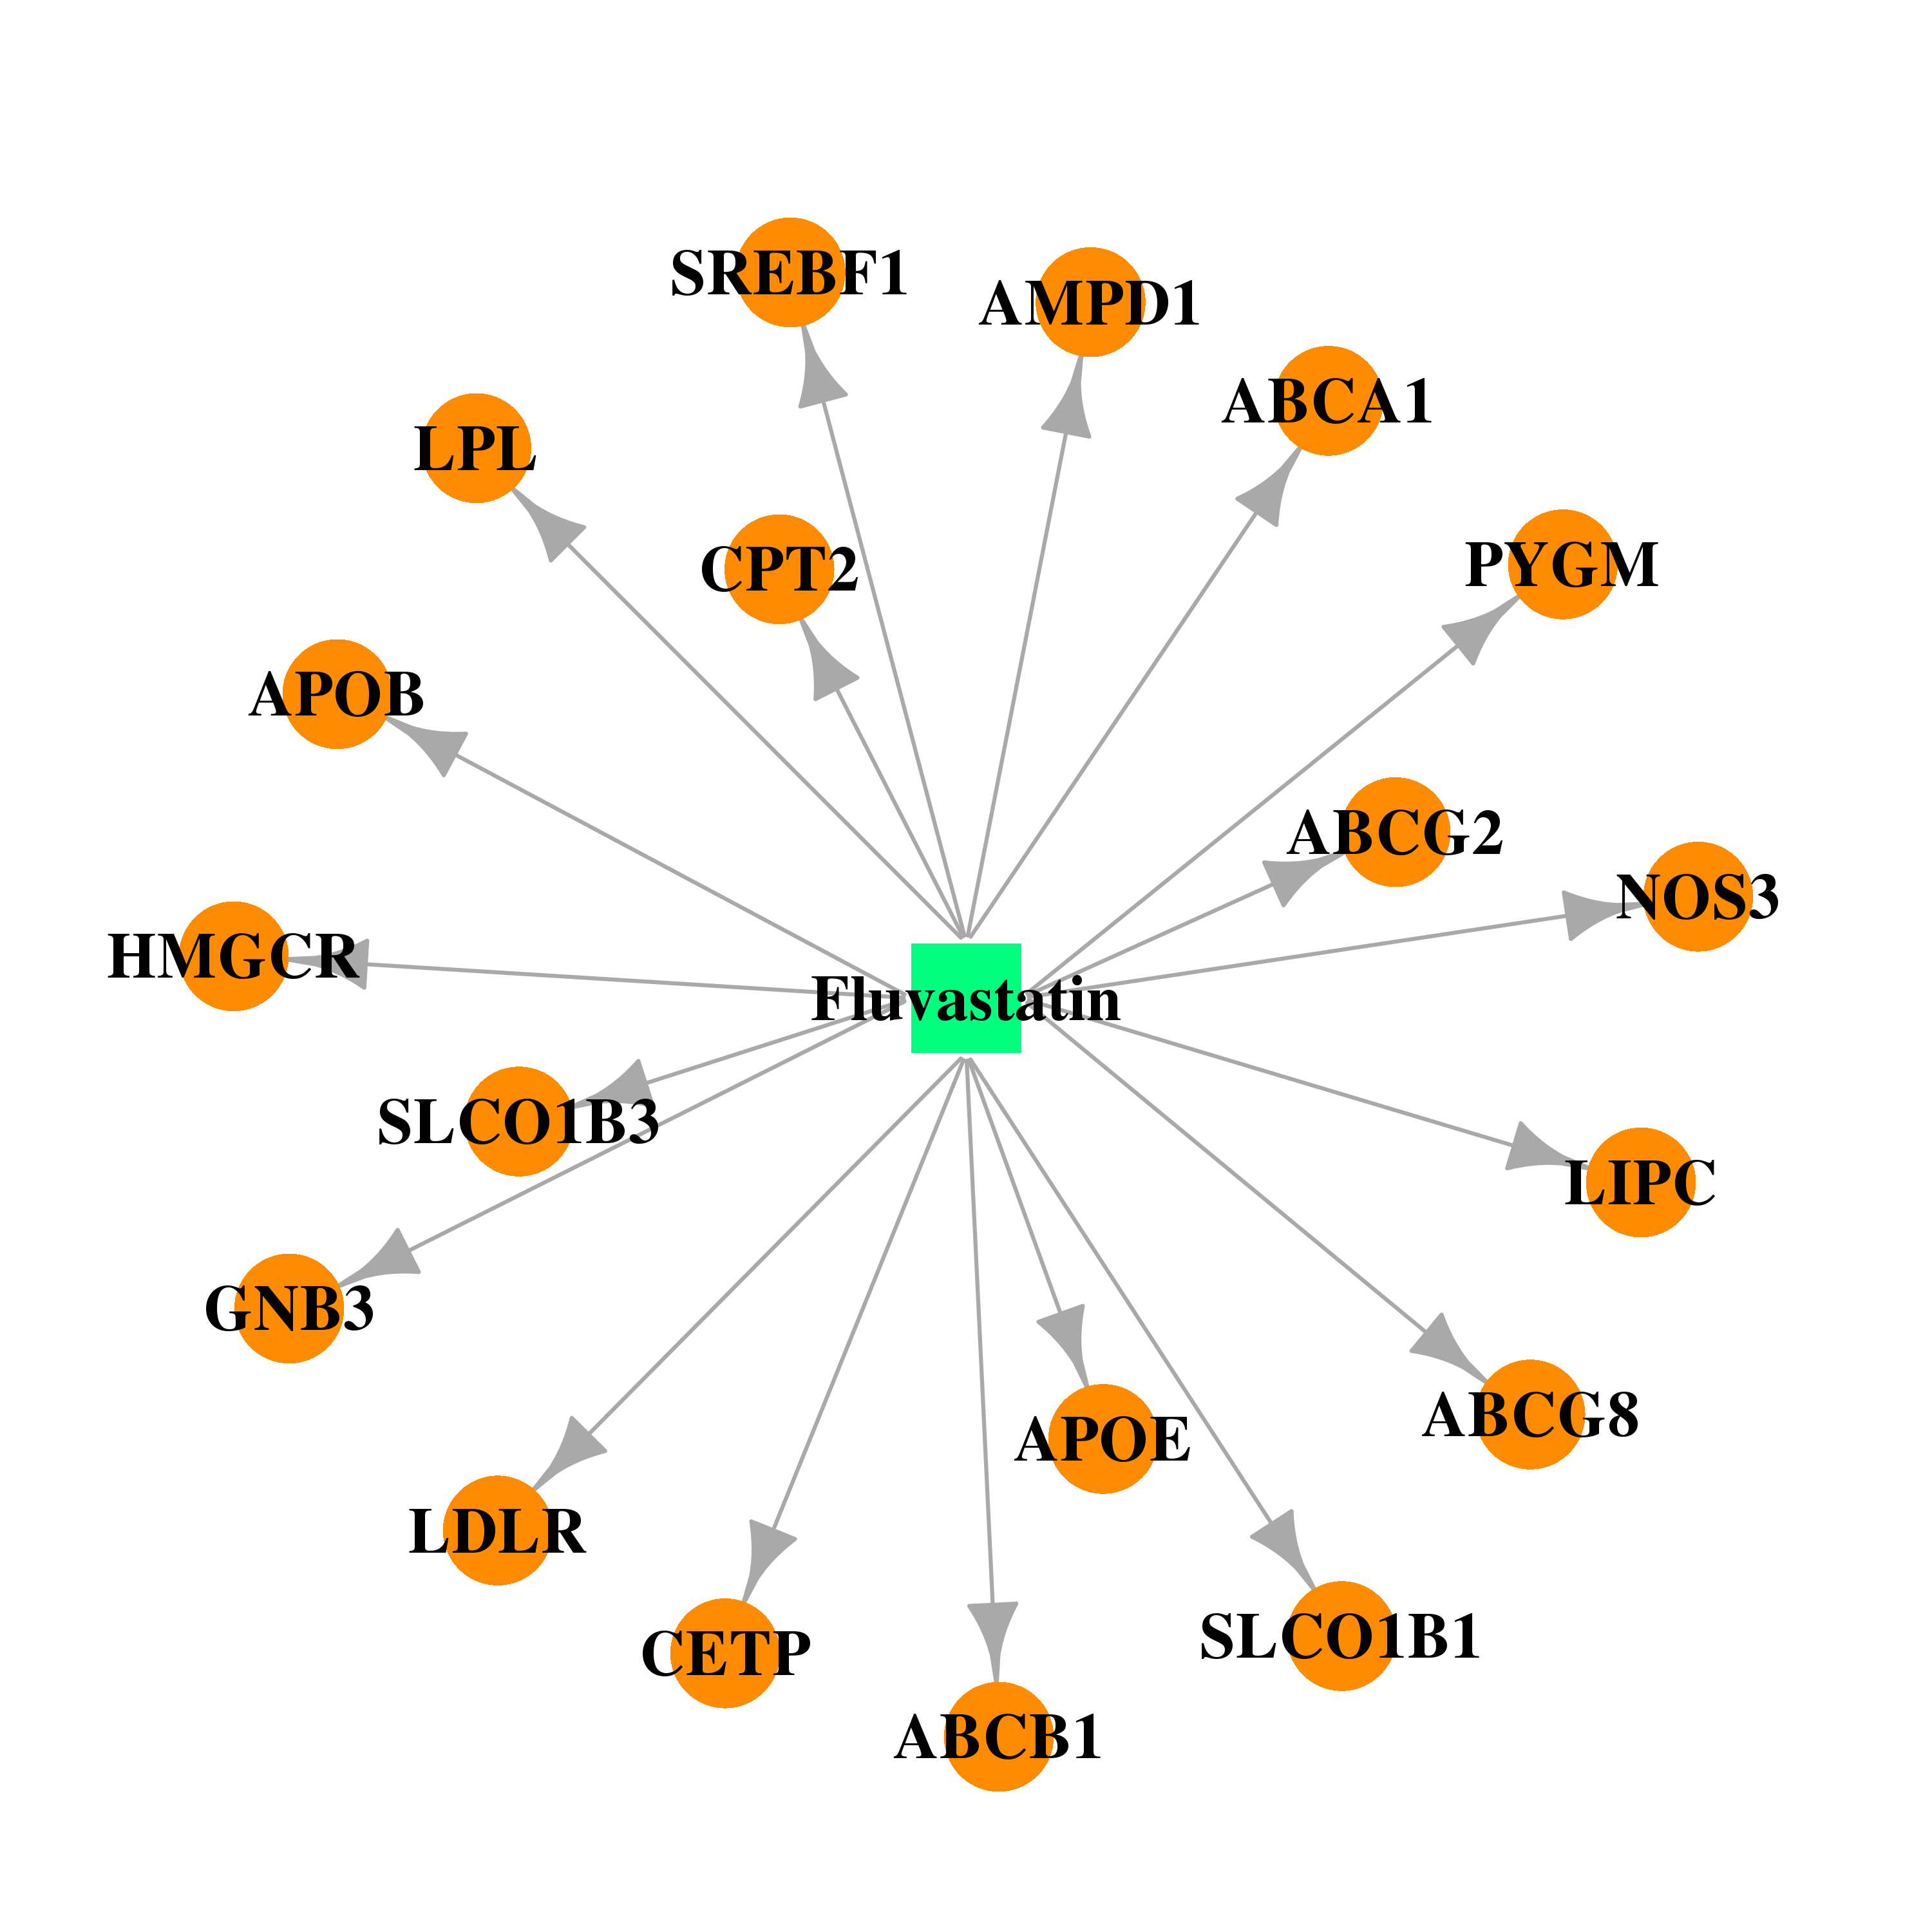 | 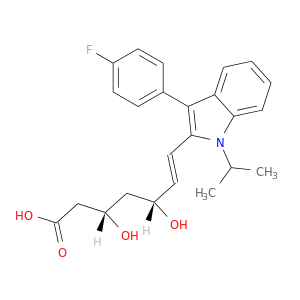 |
| DB00412 | ATP-binding cassette, sub-family A (ABC1), member 1 | approved; investigational | Rosiglitazone | 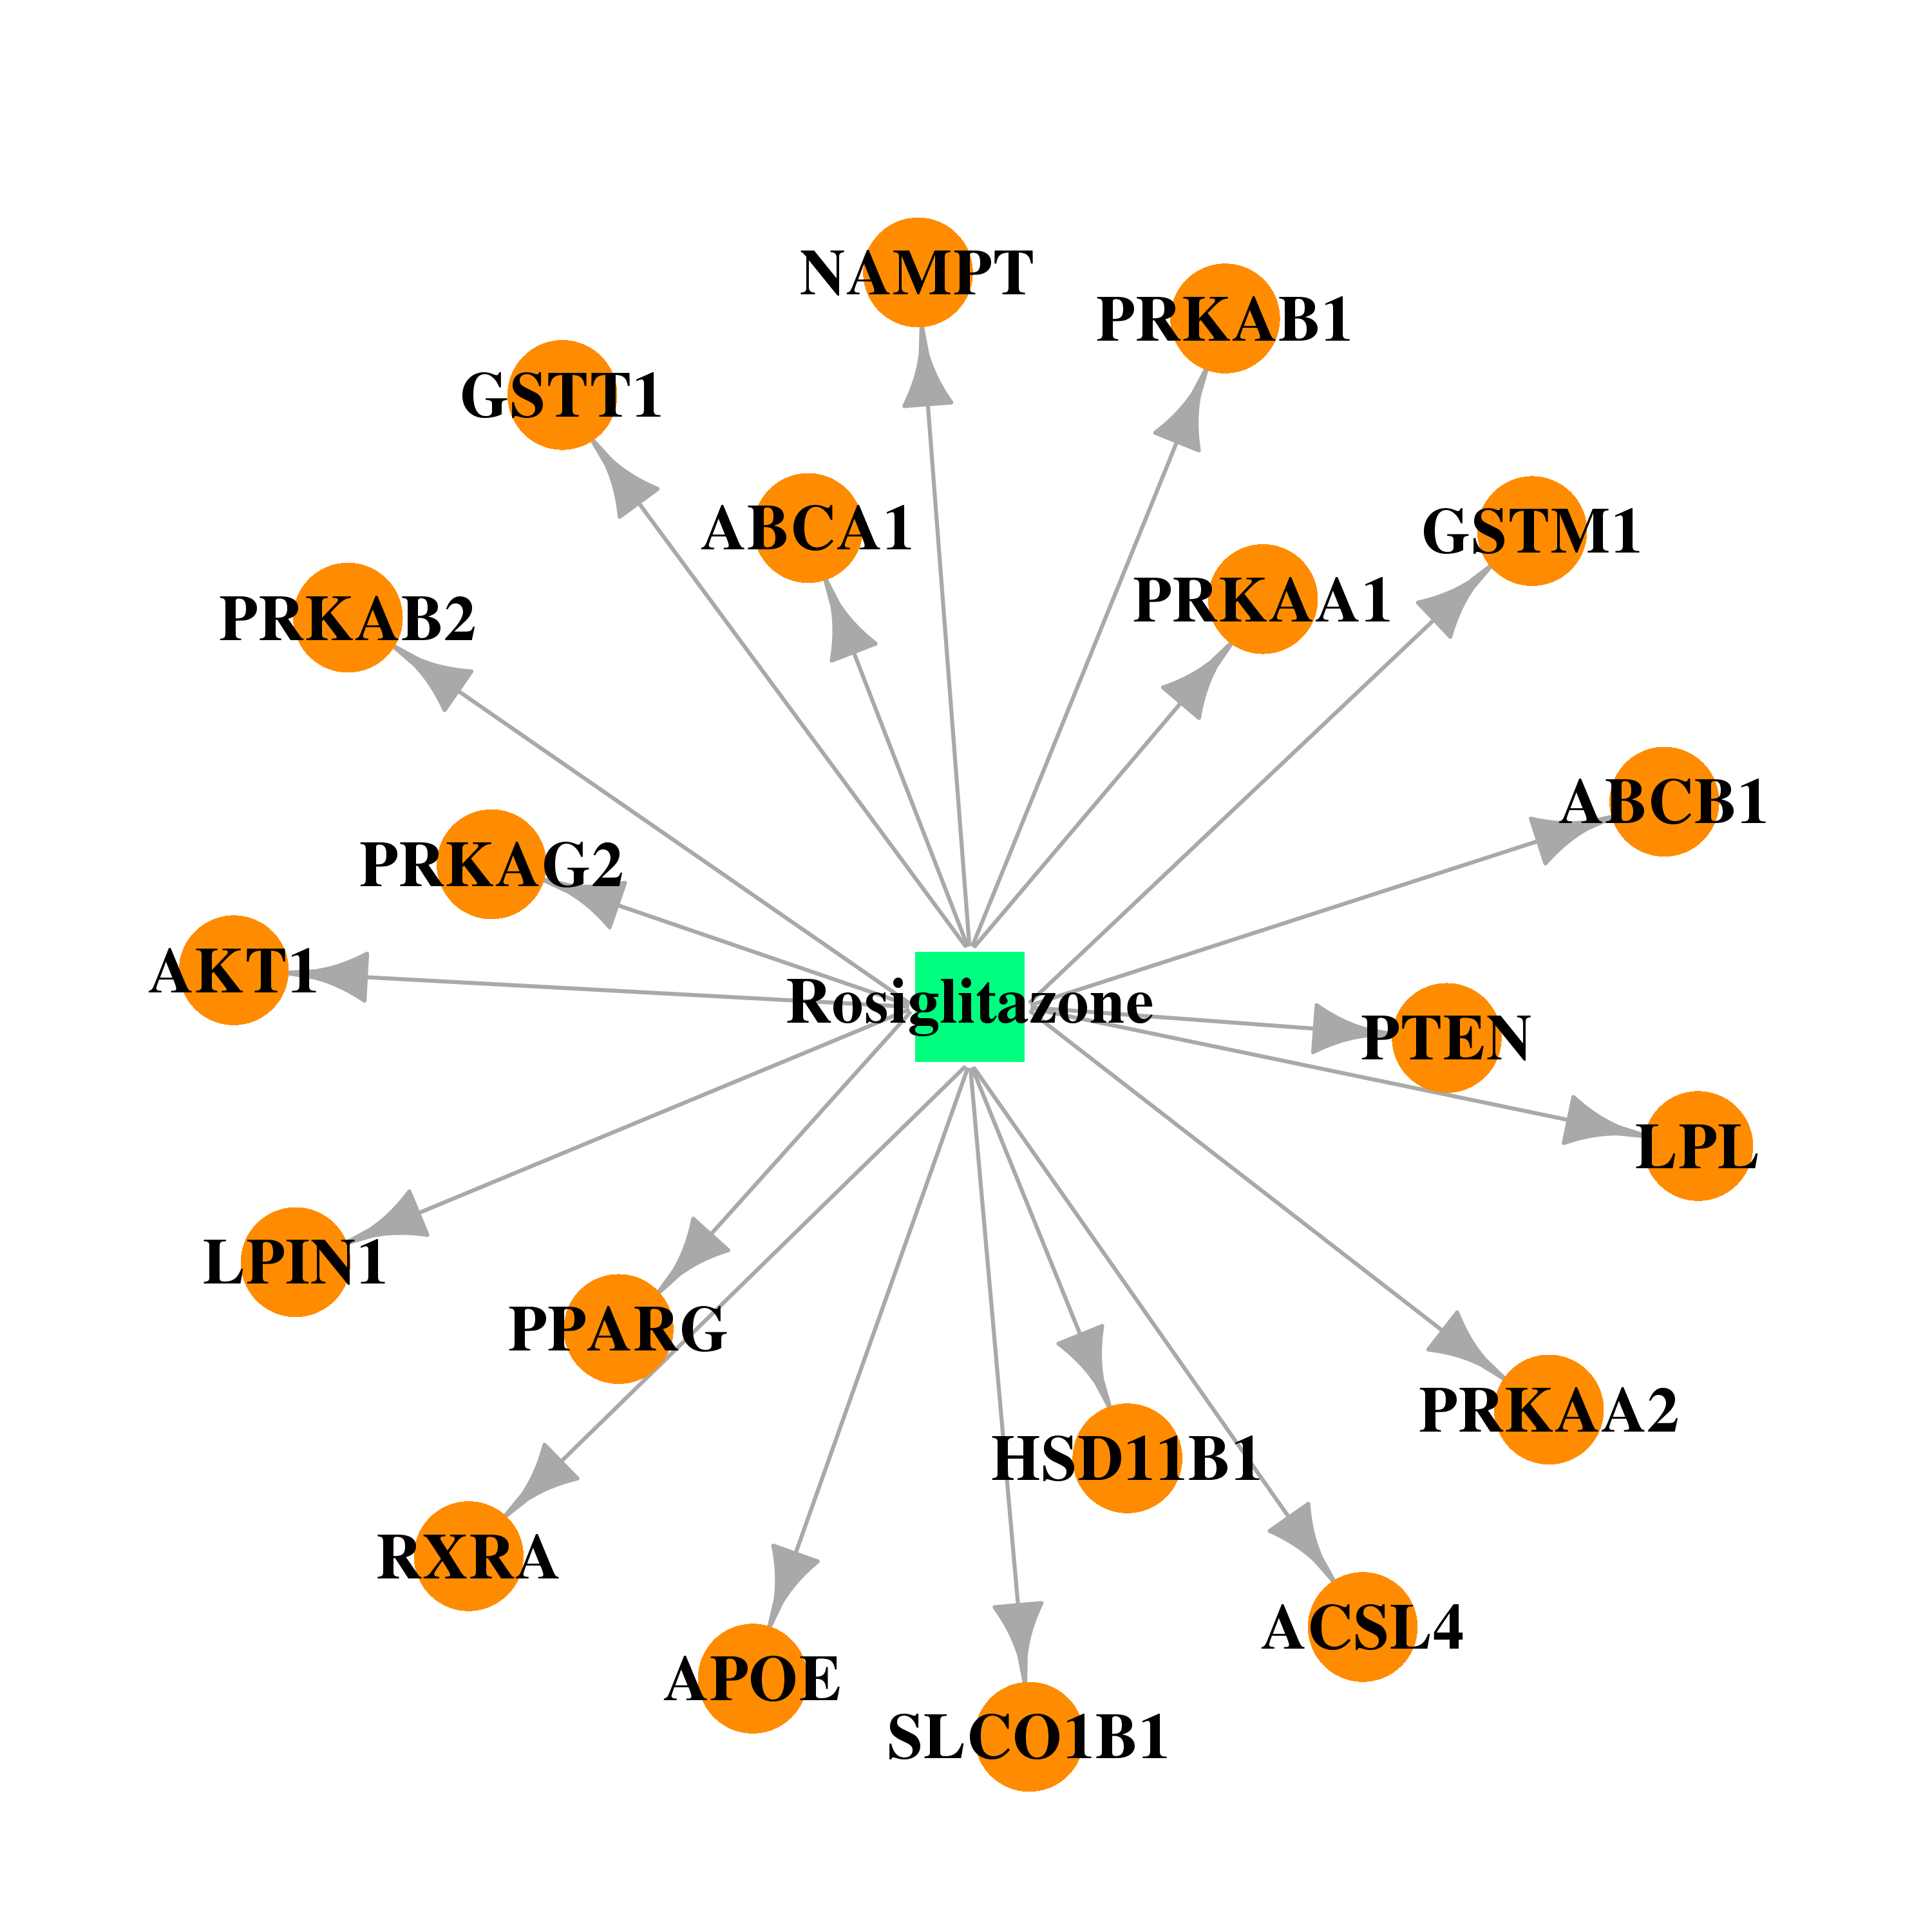 |  |
| DB00264 | ATP-binding cassette, sub-family A (ABC1), member 1 | approved; investigational | Metoprolol | 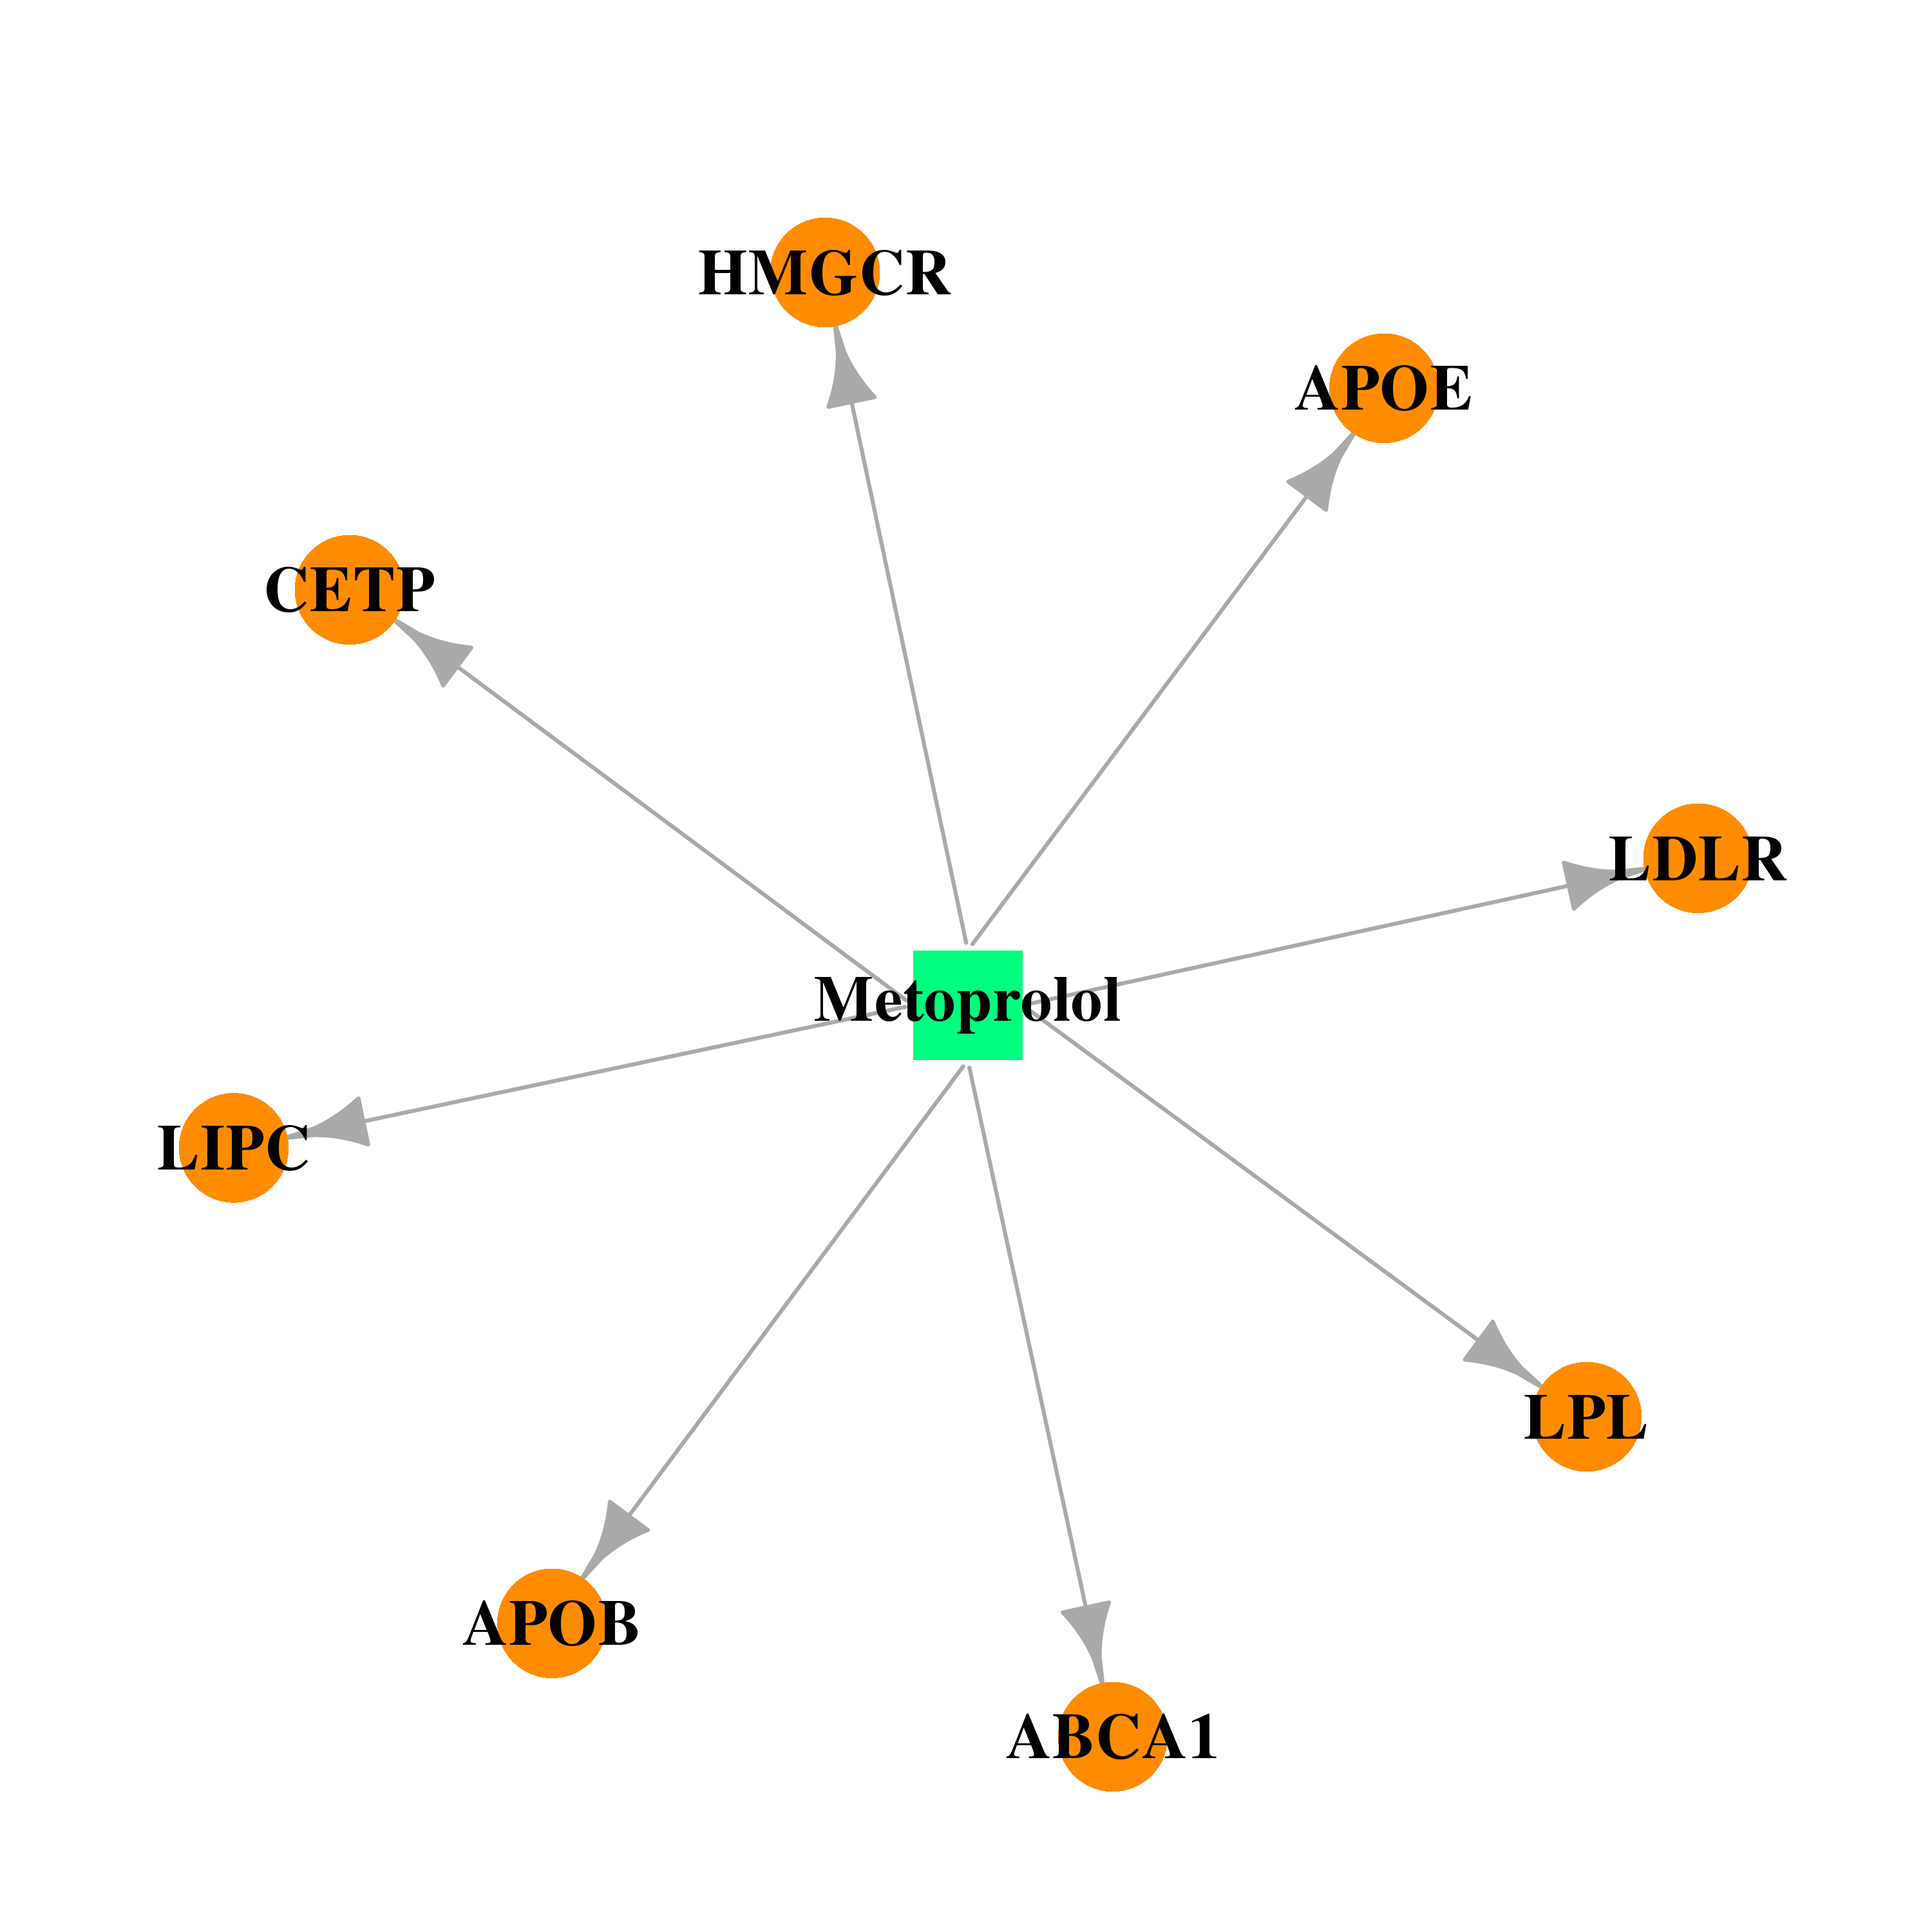 |  |
| Top |
| Cross referenced IDs for ABCA1 |
| * We obtained these cross-references from Uniprot database. It covers 150 different DBs, 18 categories. http://www.uniprot.org/help/cross_references_section |
: Open all cross reference information
|
Copyright © 2016-Present - The Univsersity of Texas Health Science Center at Houston @ |