|
||||||||||||||||||||||||||||||||||||||||||||||||||||||||||||||||||||||||||||||||||||||||||||||||||||||||||||||||||||||||||||||||||||||||||||||||||||||||||||||||||||||||||||||||||||||||||||||||||||||||||||||||||||||||||||||||||||||||||||||||||||||||||||||||||||||||||||||||||||||||||||
| |
| Phenotypic Information (metabolism pathway, cancer, disease, phenome) |
| |
| |
| Gene-Gene Network Information: Co-Expression Network, Interacting Genes & KEGG |
| |
|


| Gene Summary for B3GNT6 |
| Basic gene info. | Gene symbol | B3GNT6 |
| Gene name | UDP-GlcNAc:betaGal beta-1,3-N-acetylglucosaminyltransferase 6 (core 3 synthase) | |
| Synonyms | B3Gn-T6|BGnT-6|beta-1,3-Gn-T6|beta3Gn-T6 | |
| Cytomap | UCSC genome browser: 11q13.4 | |
| Genomic location | chr11 :76745434-76753005 | |
| Type of gene | protein-coding | |
| RefGenes | NM_138706.4, | |
| Ensembl id | ENSG00000262264 | |
| Description | UDP-GlcNAc:betaGal beta-1,3-N-acetylglucosaminyltransferase 6beta-1,3-N-acetylglucosaminyltransferase 6beta-1,3-N-acetylglucosaminyltransferase proteincore 3 synthase | |
| Modification date | 20141207 | |
| dbXrefs | MIM : 615315 | |
| HGNC : HGNC | ||
| Ensembl : ENSG00000198488 | ||
| HPRD : 16534 | ||
| Vega : OTTHUMG00000181633 | ||
| Protein | UniProt: go to UniProt's Cross Reference DB Table | |
| Expression | CleanEX: HS_B3GNT6 | |
| BioGPS: 192134 | ||
| Gene Expression Atlas: ENSG00000262264 | ||
| The Human Protein Atlas: ENSG00000262264 | ||
| Pathway | NCI Pathway Interaction Database: B3GNT6 | |
| KEGG: B3GNT6 | ||
| REACTOME: B3GNT6 | ||
| ConsensusPathDB | ||
| Pathway Commons: B3GNT6 | ||
| Metabolism | MetaCyc: B3GNT6 | |
| HUMANCyc: B3GNT6 | ||
| Regulation | Ensembl's Regulation: ENSG00000262264 | |
| miRBase: chr11 :76,745,434-76,753,005 | ||
| TargetScan: NM_138706 | ||
| cisRED: ENSG00000262264 | ||
| Context | iHOP: B3GNT6 | |
| cancer metabolism search in PubMed: B3GNT6 | ||
| UCL Cancer Institute: B3GNT6 | ||
| Assigned class in ccmGDB | C | |
| Top |
| Phenotypic Information for B3GNT6(metabolism pathway, cancer, disease, phenome) |
| Cancer | CGAP: B3GNT6 |
| Familial Cancer Database: B3GNT6 | |
| * This gene is included in those cancer gene databases. |
|
|
|
|
|
| . | ||||||||||||||||||||||||||||||||||||||||||||||||||||||||||||||||||||||||||||||||||||||||||||||||||||||||||||||||||||||||||||||||||||||||||||||||||||||||||||||||||||||||||||||||||||||||||||||||||||||||||||||||||||||||||||||||||||||||||||||||||||||||||||||||||||||||||||||||||||||
Oncogene 1 | Significant driver gene in | |||||||||||||||||||||||||||||||||||||||||||||||||||||||||||||||||||||||||||||||||||||||||||||||||||||||||||||||||||||||||||||||||||||||||||||||||||||||||||||||||||||||||||||||||||||||||||||||||||||||||||||||||||||||||||||||||||||||||||||||||||||||||||||||||||||||||||||||||||||||||||
| cf) number; DB name 1 Oncogene; http://nar.oxfordjournals.org/content/35/suppl_1/D721.long, 2 Tumor Suppressor gene; https://bioinfo.uth.edu/TSGene/, 3 Cancer Gene Census; http://www.nature.com/nrc/journal/v4/n3/abs/nrc1299.html, 4 CancerGenes; http://nar.oxfordjournals.org/content/35/suppl_1/D721.long, 5 Network of Cancer Gene; http://ncg.kcl.ac.uk/index.php, 1Therapeutic Vulnerabilities in Cancer; http://cbio.mskcc.org/cancergenomics/statius/ |
| REACTOME_METABOLISM_OF_PROTEINS | |
| OMIM | |
| Orphanet | |
| Disease | KEGG Disease: B3GNT6 |
| MedGen: B3GNT6 (Human Medical Genetics with Condition) | |
| ClinVar: B3GNT6 | |
| Phenotype | MGI: B3GNT6 (International Mouse Phenotyping Consortium) |
| PhenomicDB: B3GNT6 | |
| Mutations for B3GNT6 |
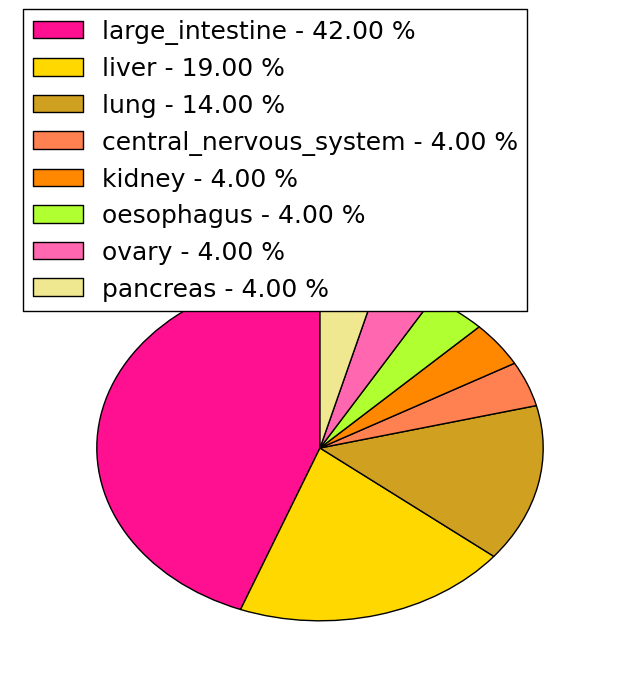
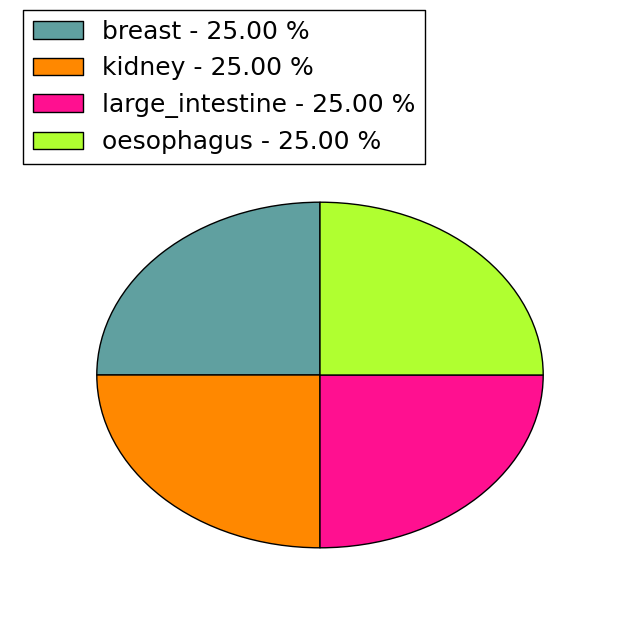
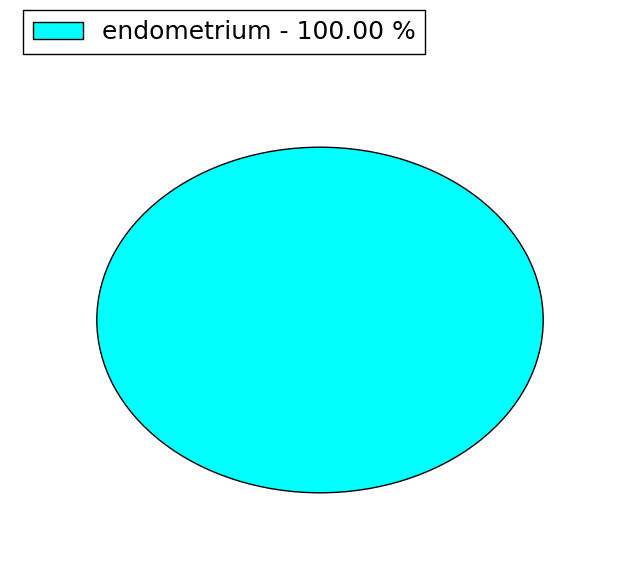
| * Under tables are showing count per each tissue to give us broad intuition about tissue specific mutation patterns.You can go to the detailed page for each mutation database's web site. |
| There's no structural variation information in COSMIC data for this gene. |
| * From mRNA Sanger sequences, Chitars2.0 arranged chimeric transcripts. This table shows B3GNT6 related fusion information. |
| ID | Head Gene | Tail Gene | Accession | Gene_a | qStart_a | qEnd_a | Chromosome_a | tStart_a | tEnd_a | Gene_a | qStart_a | qEnd_a | Chromosome_a | tStart_a | tEnd_a |
| Top |
| Mutation type/ Tissue ID | brca | cns | cerv | endome | haematopo | kidn | Lintest | liver | lung | ns | ovary | pancre | prost | skin | stoma | thyro | urina | |||
| Total # sample | 2 | |||||||||||||||||||
| GAIN (# sample) | 2 | |||||||||||||||||||
| LOSS (# sample) |
| cf) Tissue ID; Tissue type (1; Breast, 2; Central_nervous_system, 3; Cervix, 4; Endometrium, 5; Haematopoietic_and_lymphoid_tissue, 6; Kidney, 7; Large_intestine, 8; Liver, 9; Lung, 10; NS, 11; Ovary, 12; Pancreas, 13; Prostate, 14; Skin, 15; Stomach, 16; Thyroid, 17; Urinary_tract) |
| Top |
|
 |
| Top |
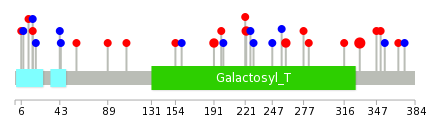
| Stat. for Non-Synonymous SNVs (# total SNVs=21) | (# total SNVs=4) |
 |  |
(# total SNVs=10) | (# total SNVs=1) |
 |  |
| Top |
| * When you move the cursor on each content, you can see more deailed mutation information on the Tooltip. Those are primary_site,primary_histology,mutation(aa),pubmedID. |
| GRCh37 position | Mutation(aa) | Unique sampleID count |
| chr11:76751604-76751604 | p.L337fs*19 | 7 |
| chr11:76751587-76751587 | p.G331D | 5 |
| chr11:76751542-76751542 | p.G317fs*39 | 3 |
| chr11:76751375-76751375 | p.S260R | 2 |
| chr11:76751166-76751166 | p.A191T | 2 |
| chr11:76751585-76751585 | p.G331fs*25 | 2 |
| chr11:76751259-76751259 | p.D222N | 2 |
| chr11:76750612-76750612 | p.R6H | 1 |
| chr11:76751646-76751646 | p.R351C | 1 |
| chr11:76750914-76750914 | p.A107T | 1 |
| Top |
|
 |
| Point Mutation/ Tissue ID | 1 | 2 | 3 | 4 | 5 | 6 | 7 | 8 | 9 | 10 | 11 | 12 | 13 | 14 | 15 | 16 | 17 | 18 | 19 | 20 |
| # sample | ||||||||||||||||||||
| # mutation | ||||||||||||||||||||
| nonsynonymous SNV | ||||||||||||||||||||
| synonymous SNV |
| cf) Tissue ID; Tissue type (1; BLCA[Bladder Urothelial Carcinoma], 2; BRCA[Breast invasive carcinoma], 3; CESC[Cervical squamous cell carcinoma and endocervical adenocarcinoma], 4; COAD[Colon adenocarcinoma], 5; GBM[Glioblastoma multiforme], 6; Glioma Low Grade, 7; HNSC[Head and Neck squamous cell carcinoma], 8; KICH[Kidney Chromophobe], 9; KIRC[Kidney renal clear cell carcinoma], 10; KIRP[Kidney renal papillary cell carcinoma], 11; LAML[Acute Myeloid Leukemia], 12; LUAD[Lung adenocarcinoma], 13; LUSC[Lung squamous cell carcinoma], 14; OV[Ovarian serous cystadenocarcinoma ], 15; PAAD[Pancreatic adenocarcinoma], 16; PRAD[Prostate adenocarcinoma], 17; SKCM[Skin Cutaneous Melanoma], 18:STAD[Stomach adenocarcinoma], 19:THCA[Thyroid carcinoma], 20:UCEC[Uterine Corpus Endometrial Carcinoma]) |
| Top |
| * We represented just top 10 SNVs. When you move the cursor on each content, you can see more deailed mutation information on the Tooltip. Those are primary_site, primary_histology, mutation(aa), pubmedID. |
| Genomic Position | Mutation(aa) | Unique sampleID count |
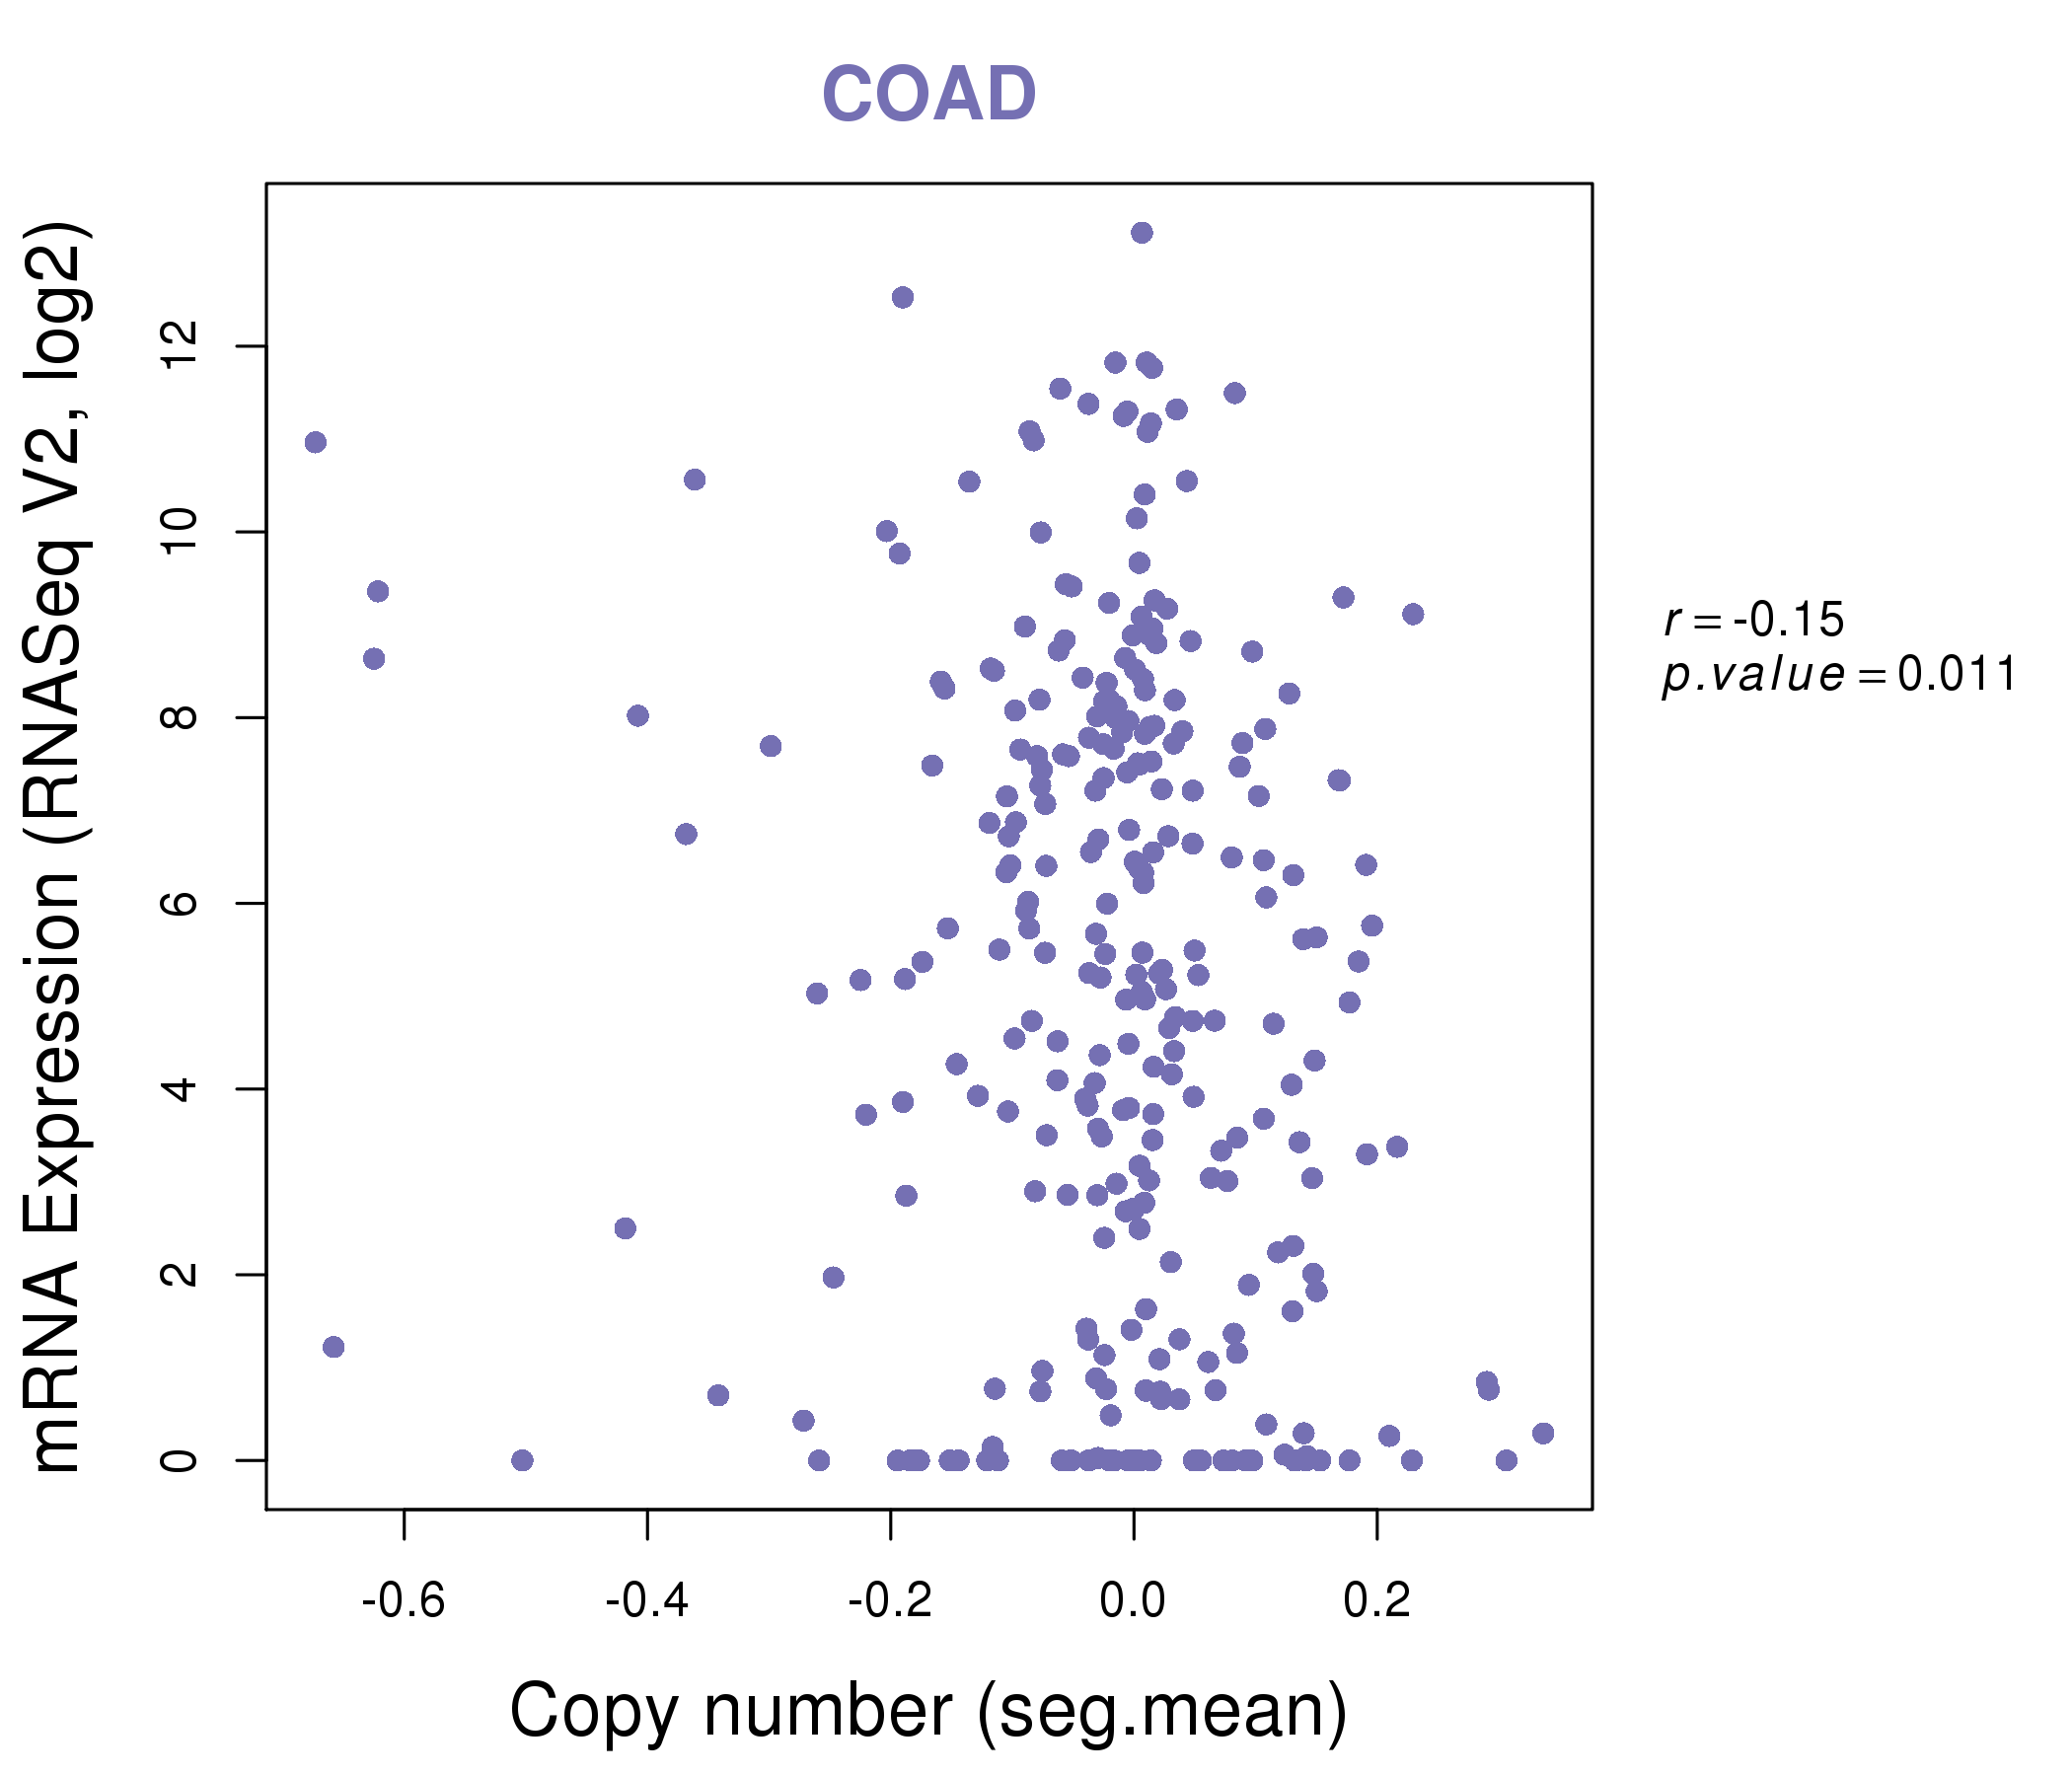
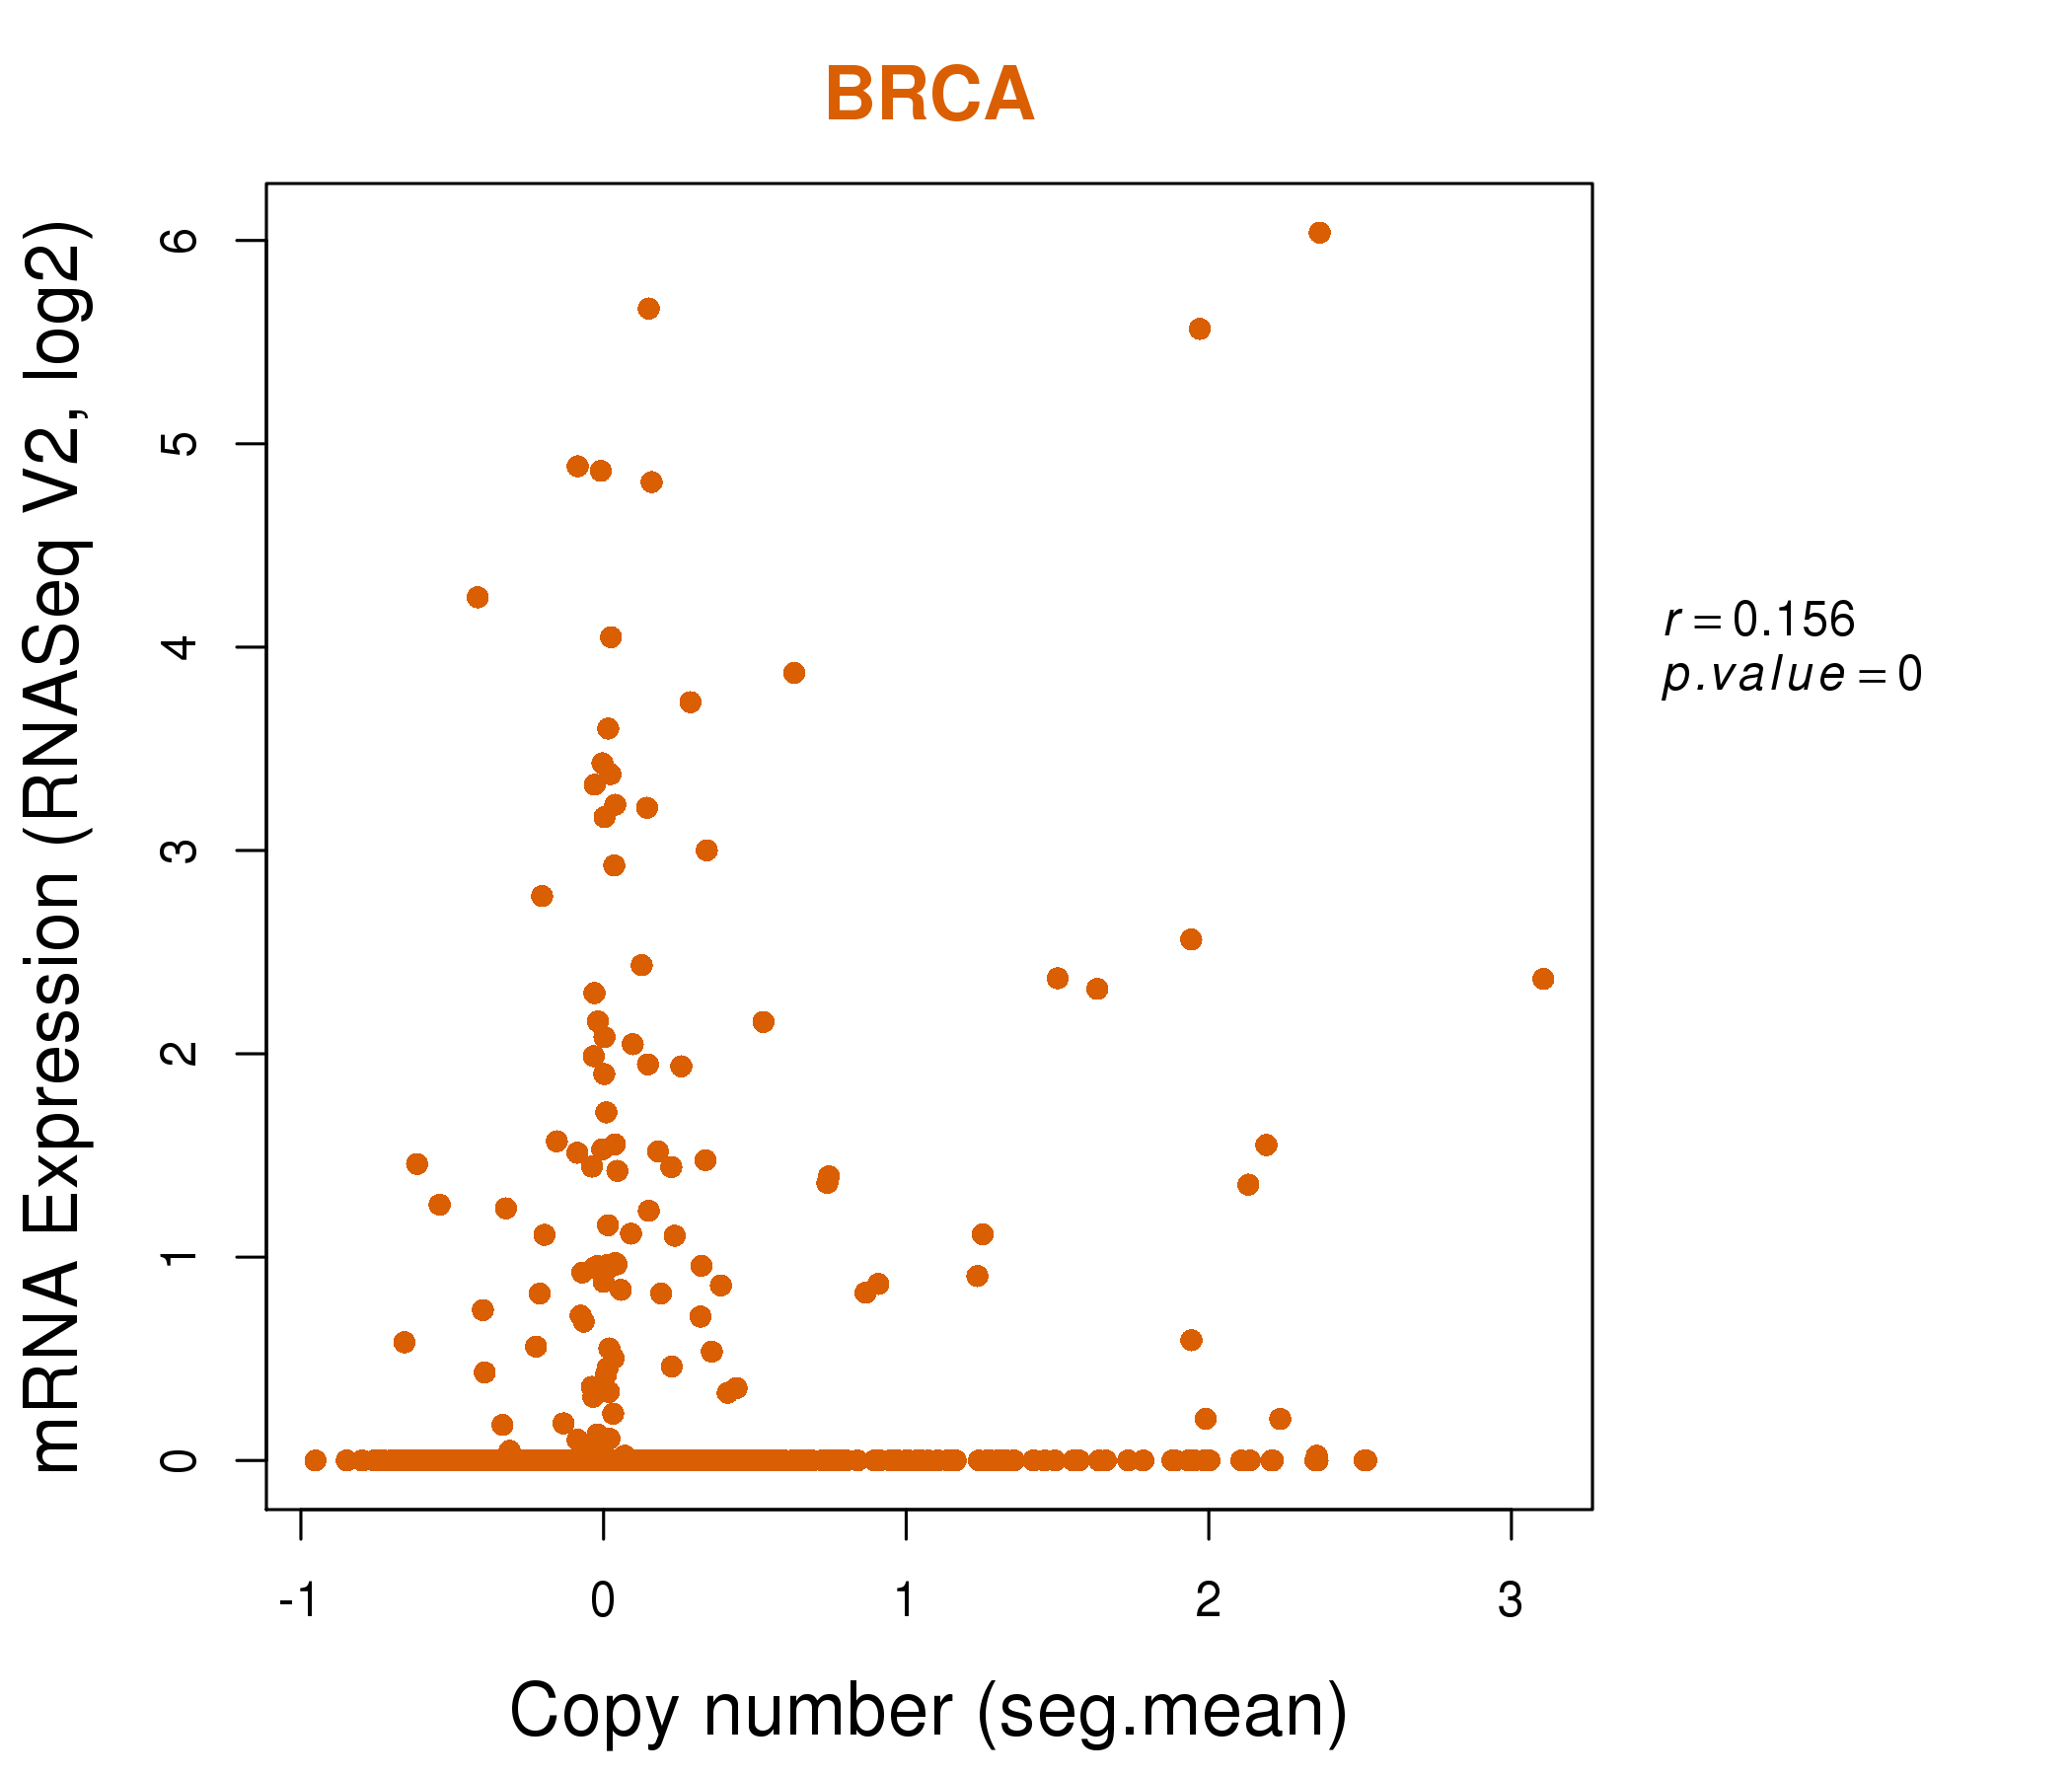
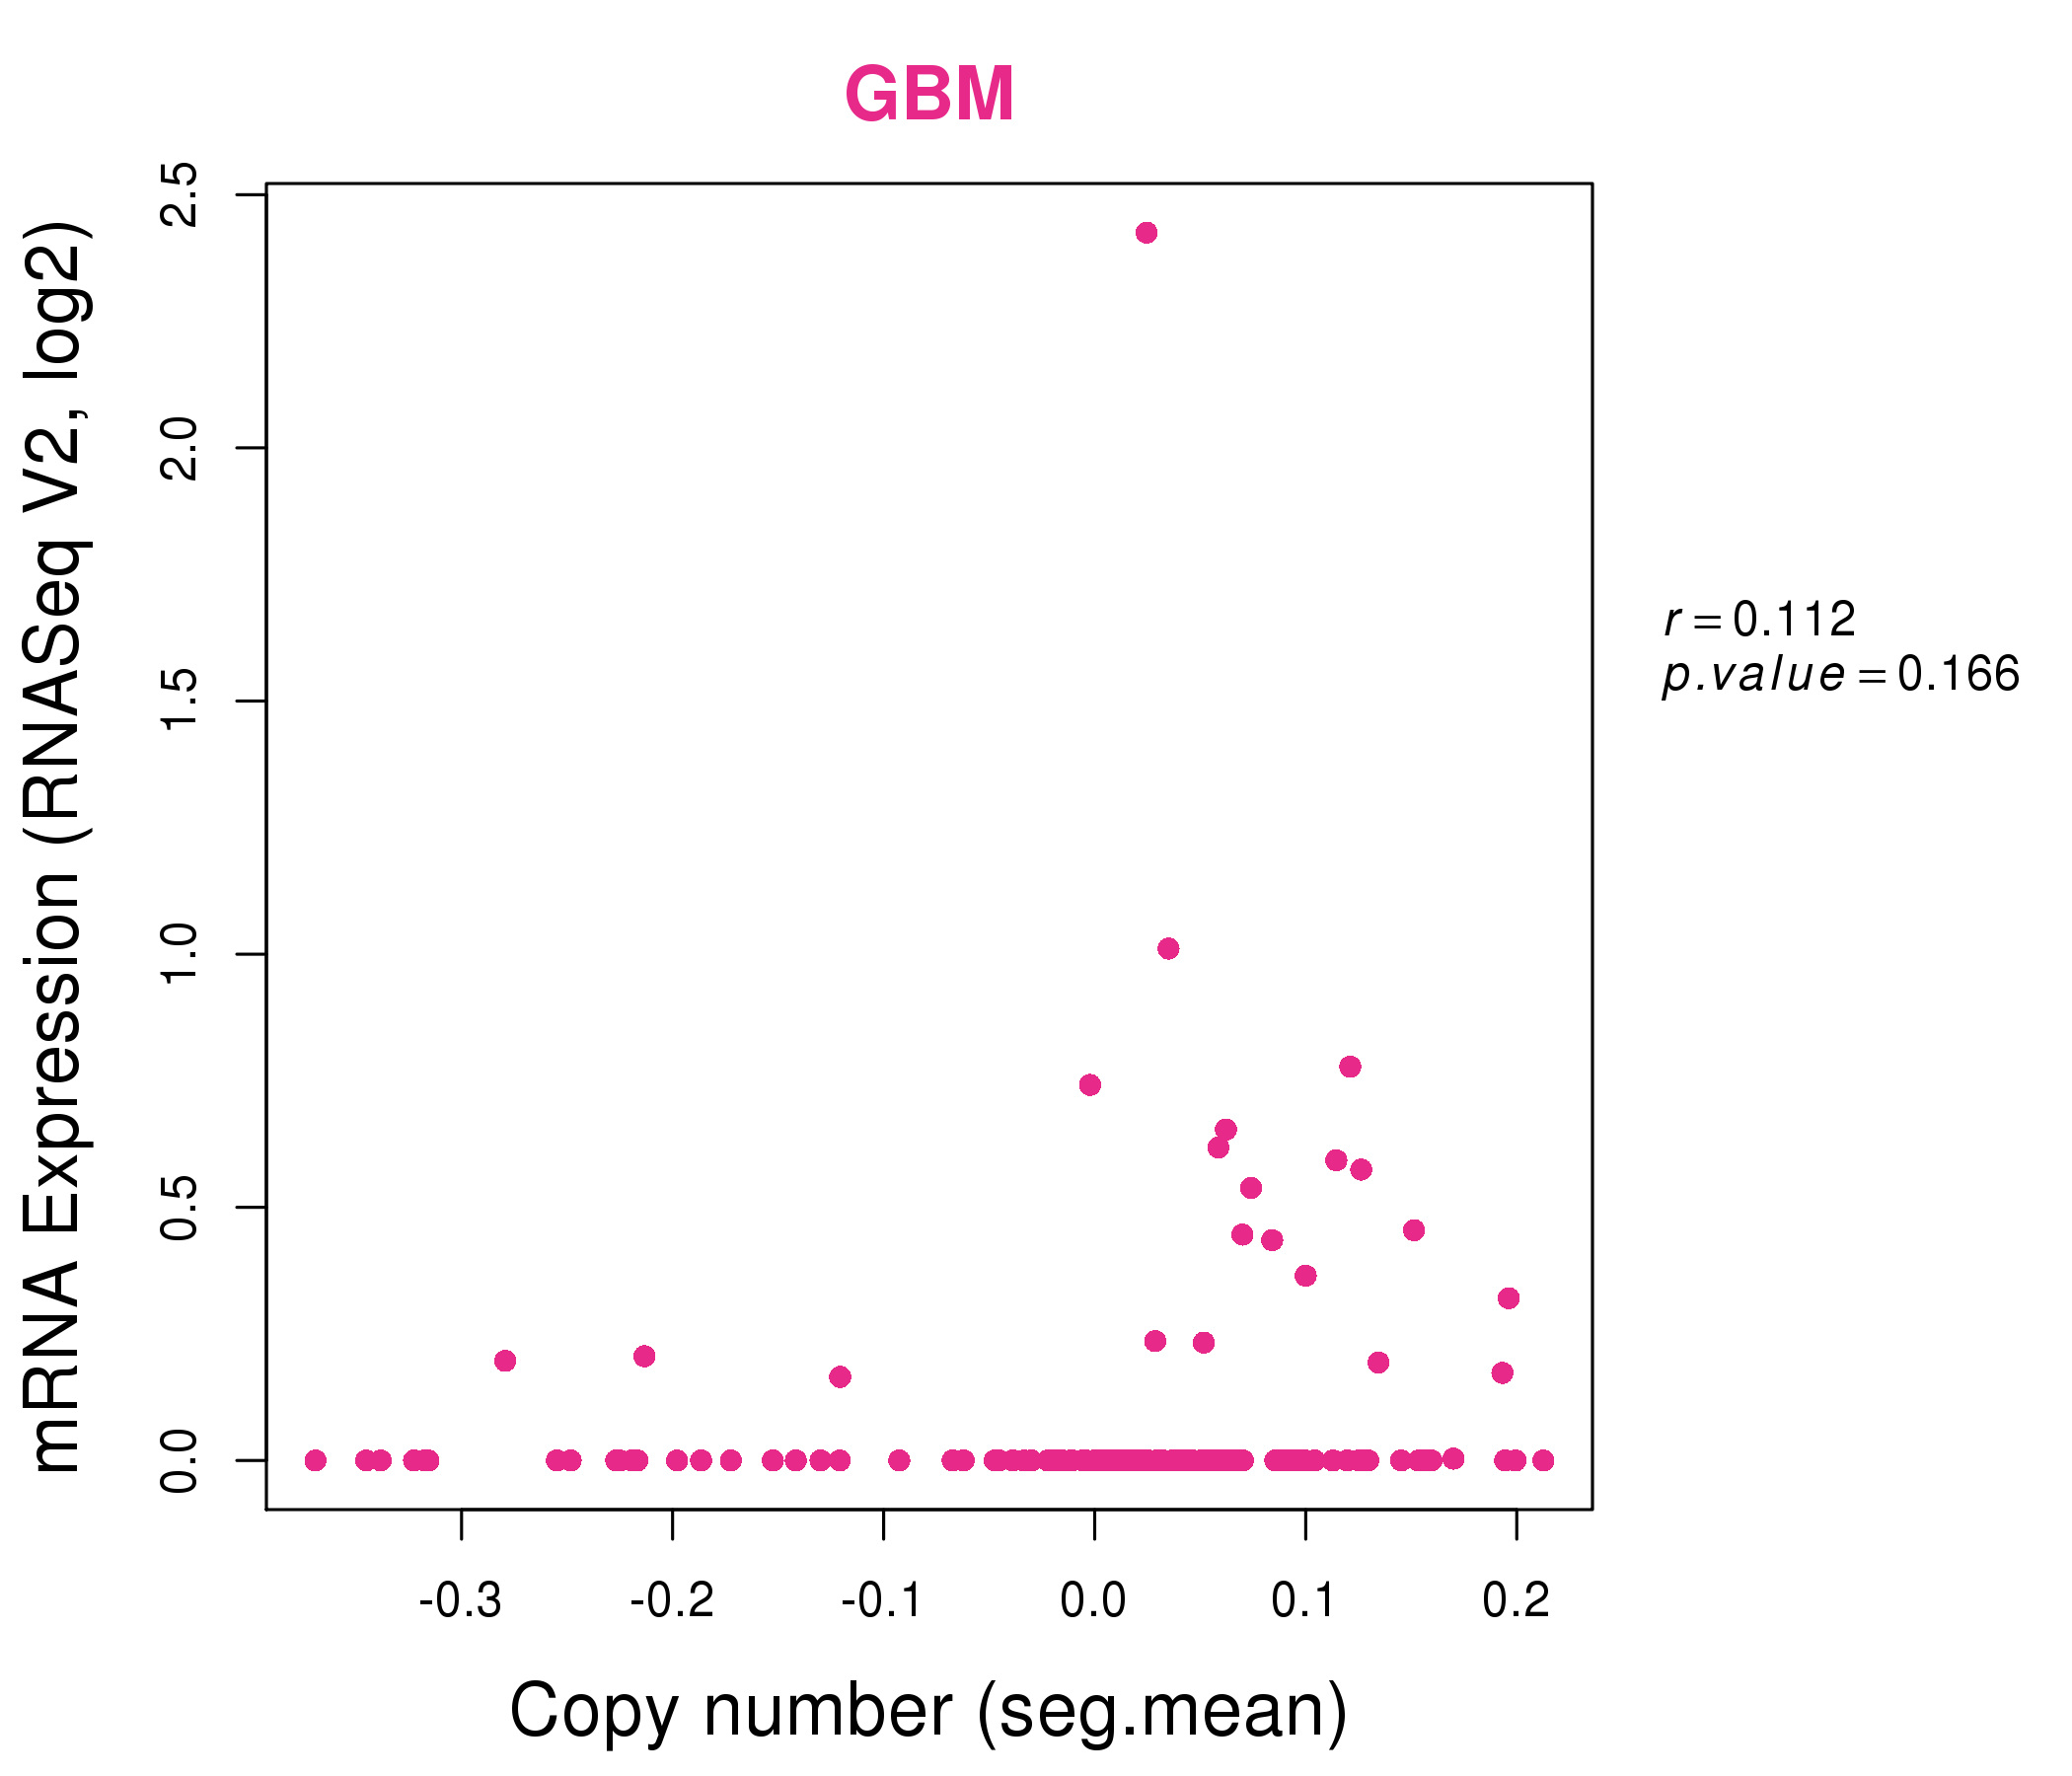
| * Copy number data were extracted from TCGA using R package TCGA-Assembler. The URLs of all public data files on TCGA DCC data server were gathered on Jan-05-2015. Function ProcessCNAData in TCGA-Assembler package was used to obtain gene-level copy number value which is calculated as the average copy number of the genomic region of a gene. |
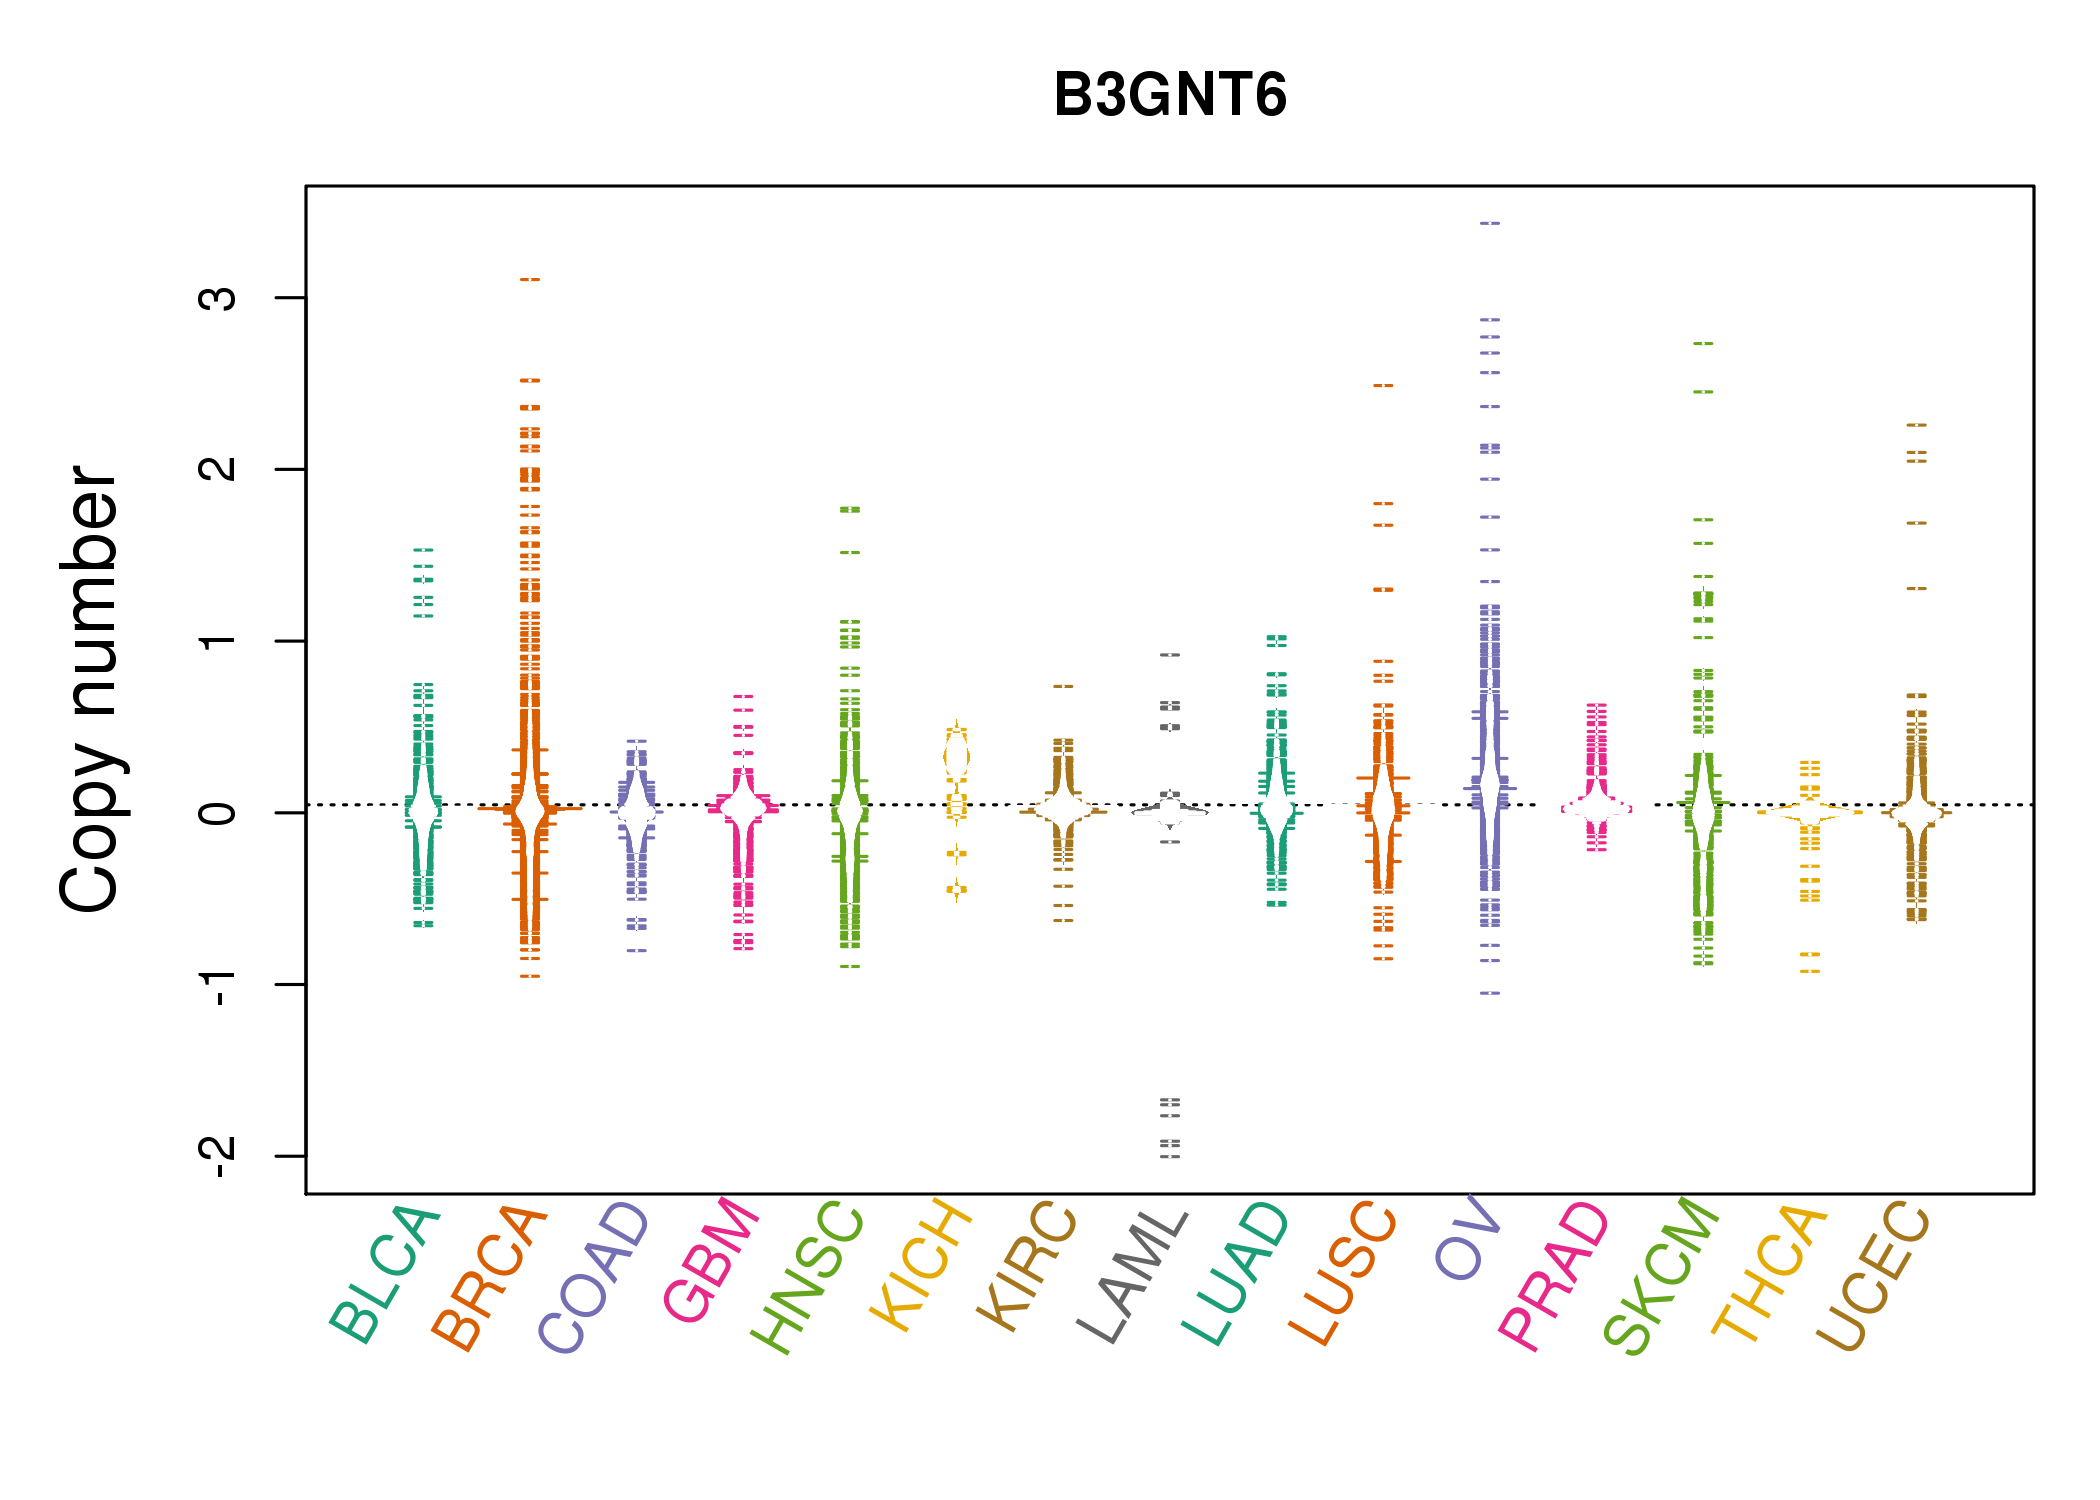 |
| cf) Tissue ID[Tissue type]: BLCA[Bladder Urothelial Carcinoma], BRCA[Breast invasive carcinoma], CESC[Cervical squamous cell carcinoma and endocervical adenocarcinoma], COAD[Colon adenocarcinoma], GBM[Glioblastoma multiforme], Glioma Low Grade, HNSC[Head and Neck squamous cell carcinoma], KICH[Kidney Chromophobe], KIRC[Kidney renal clear cell carcinoma], KIRP[Kidney renal papillary cell carcinoma], LAML[Acute Myeloid Leukemia], LUAD[Lung adenocarcinoma], LUSC[Lung squamous cell carcinoma], OV[Ovarian serous cystadenocarcinoma ], PAAD[Pancreatic adenocarcinoma], PRAD[Prostate adenocarcinoma], SKCM[Skin Cutaneous Melanoma], STAD[Stomach adenocarcinoma], THCA[Thyroid carcinoma], UCEC[Uterine Corpus Endometrial Carcinoma] |
| Top |
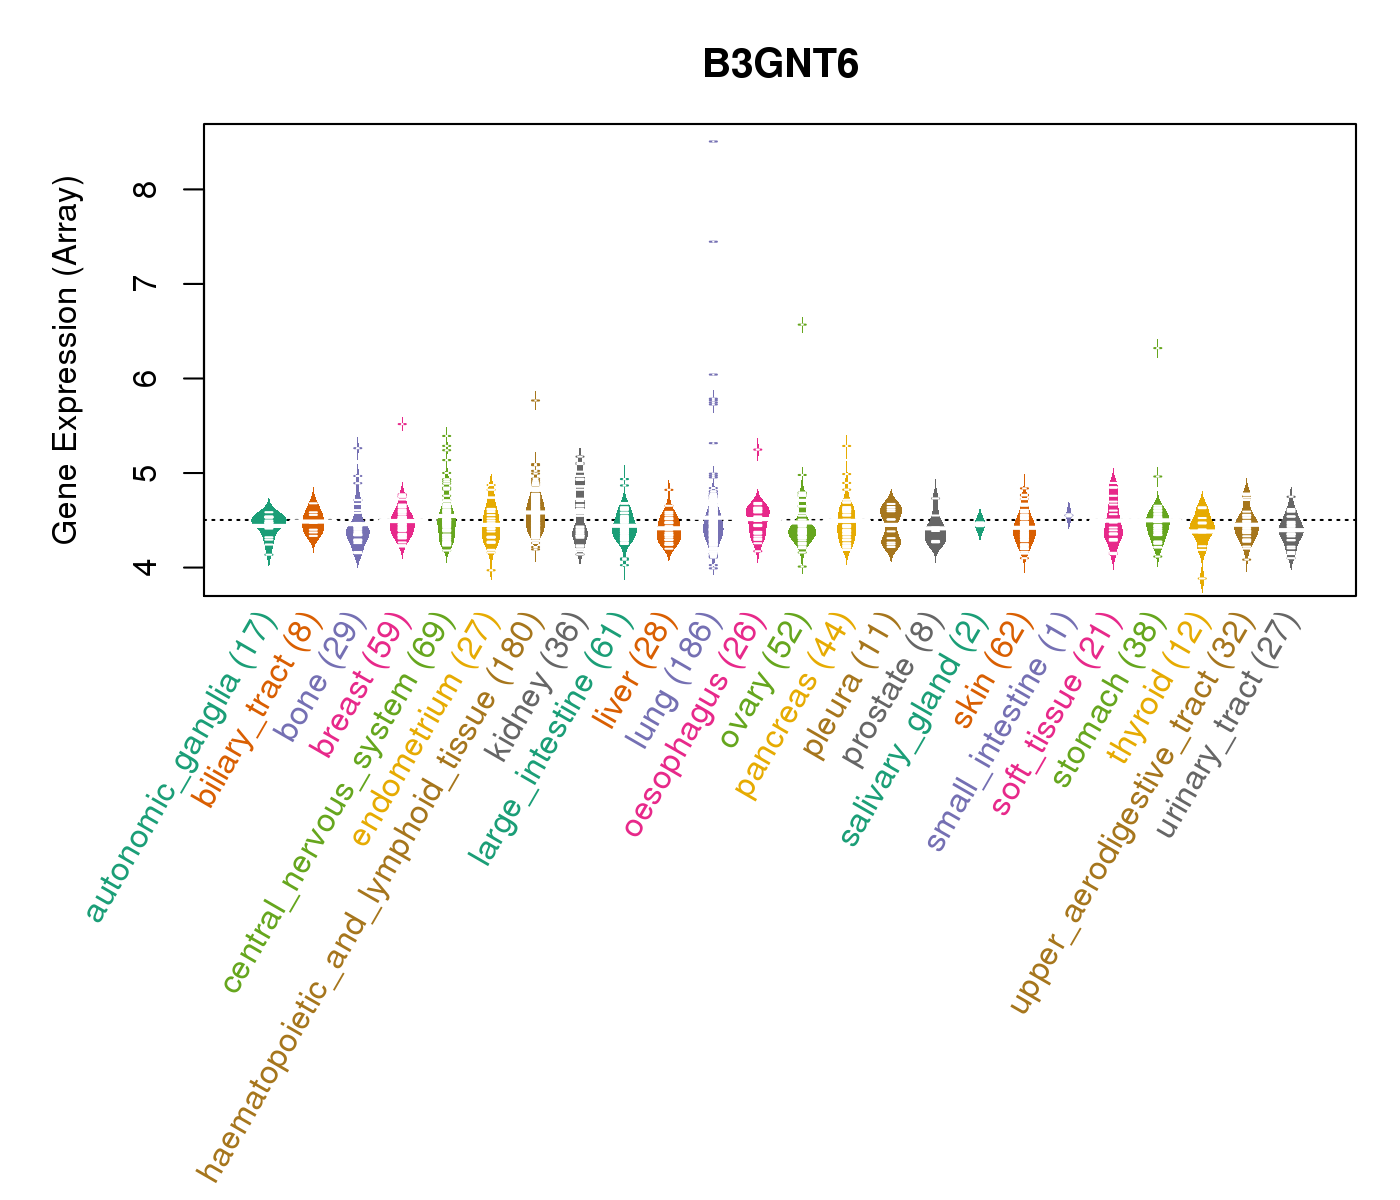
| Gene Expression for B3GNT6 |
| * CCLE gene expression data were extracted from CCLE_Expression_Entrez_2012-10-18.res: Gene-centric RMA-normalized mRNA expression data. |
 |
| * Normalized gene expression data of RNASeqV2 was extracted from TCGA using R package TCGA-Assembler. The URLs of all public data files on TCGA DCC data server were gathered at Jan-05-2015. Only eight cancer types have enough normal control samples for differential expression analysis. (t test, adjusted p<0.05 (using Benjamini-Hochberg FDR)) |
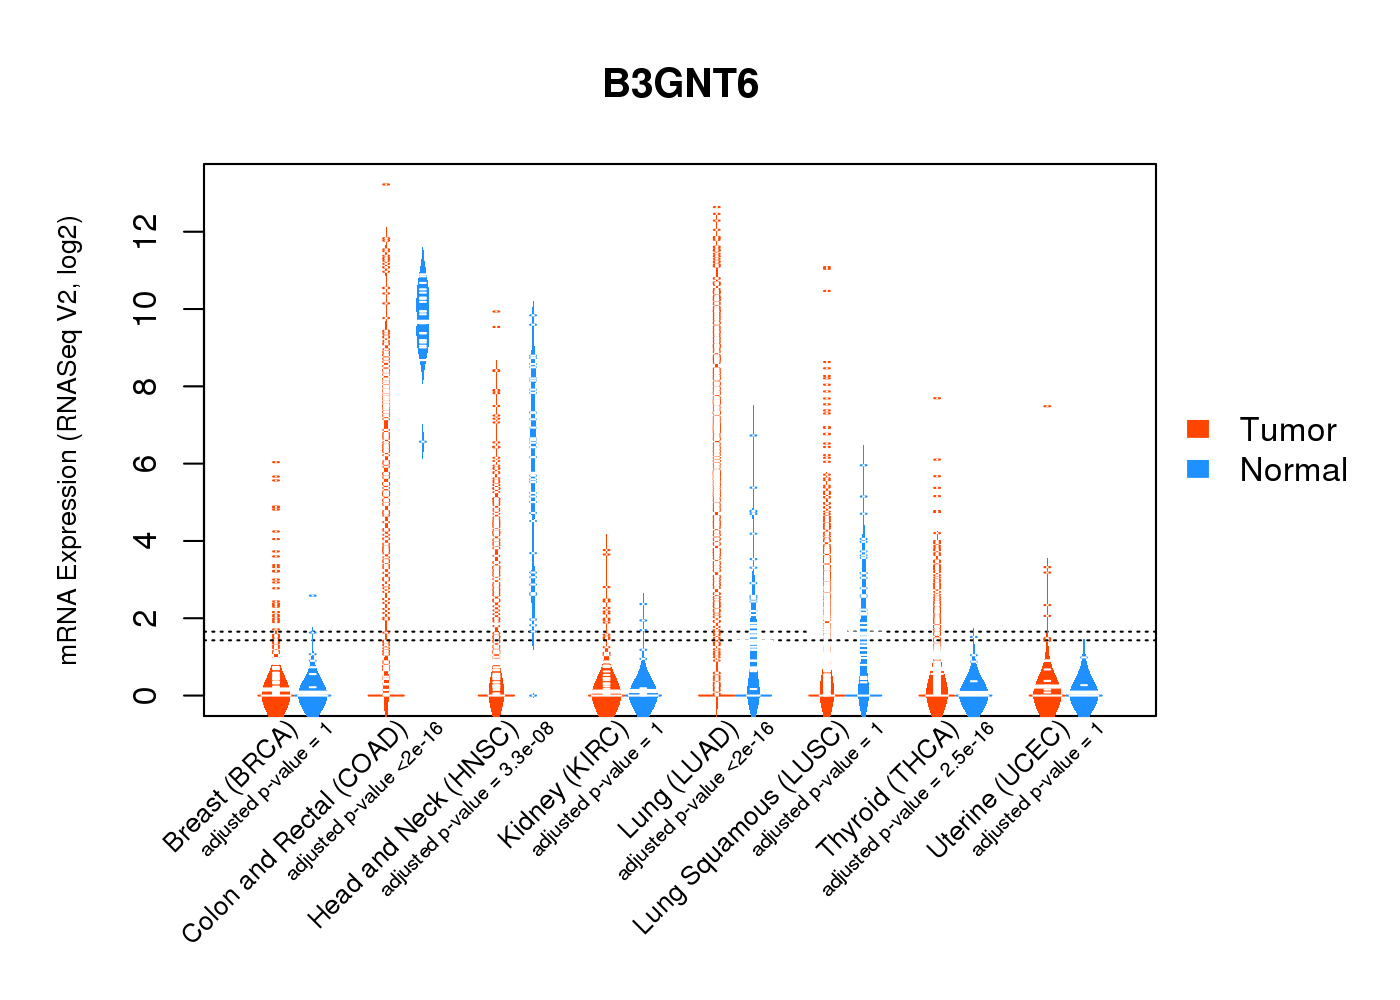 |
| Top |
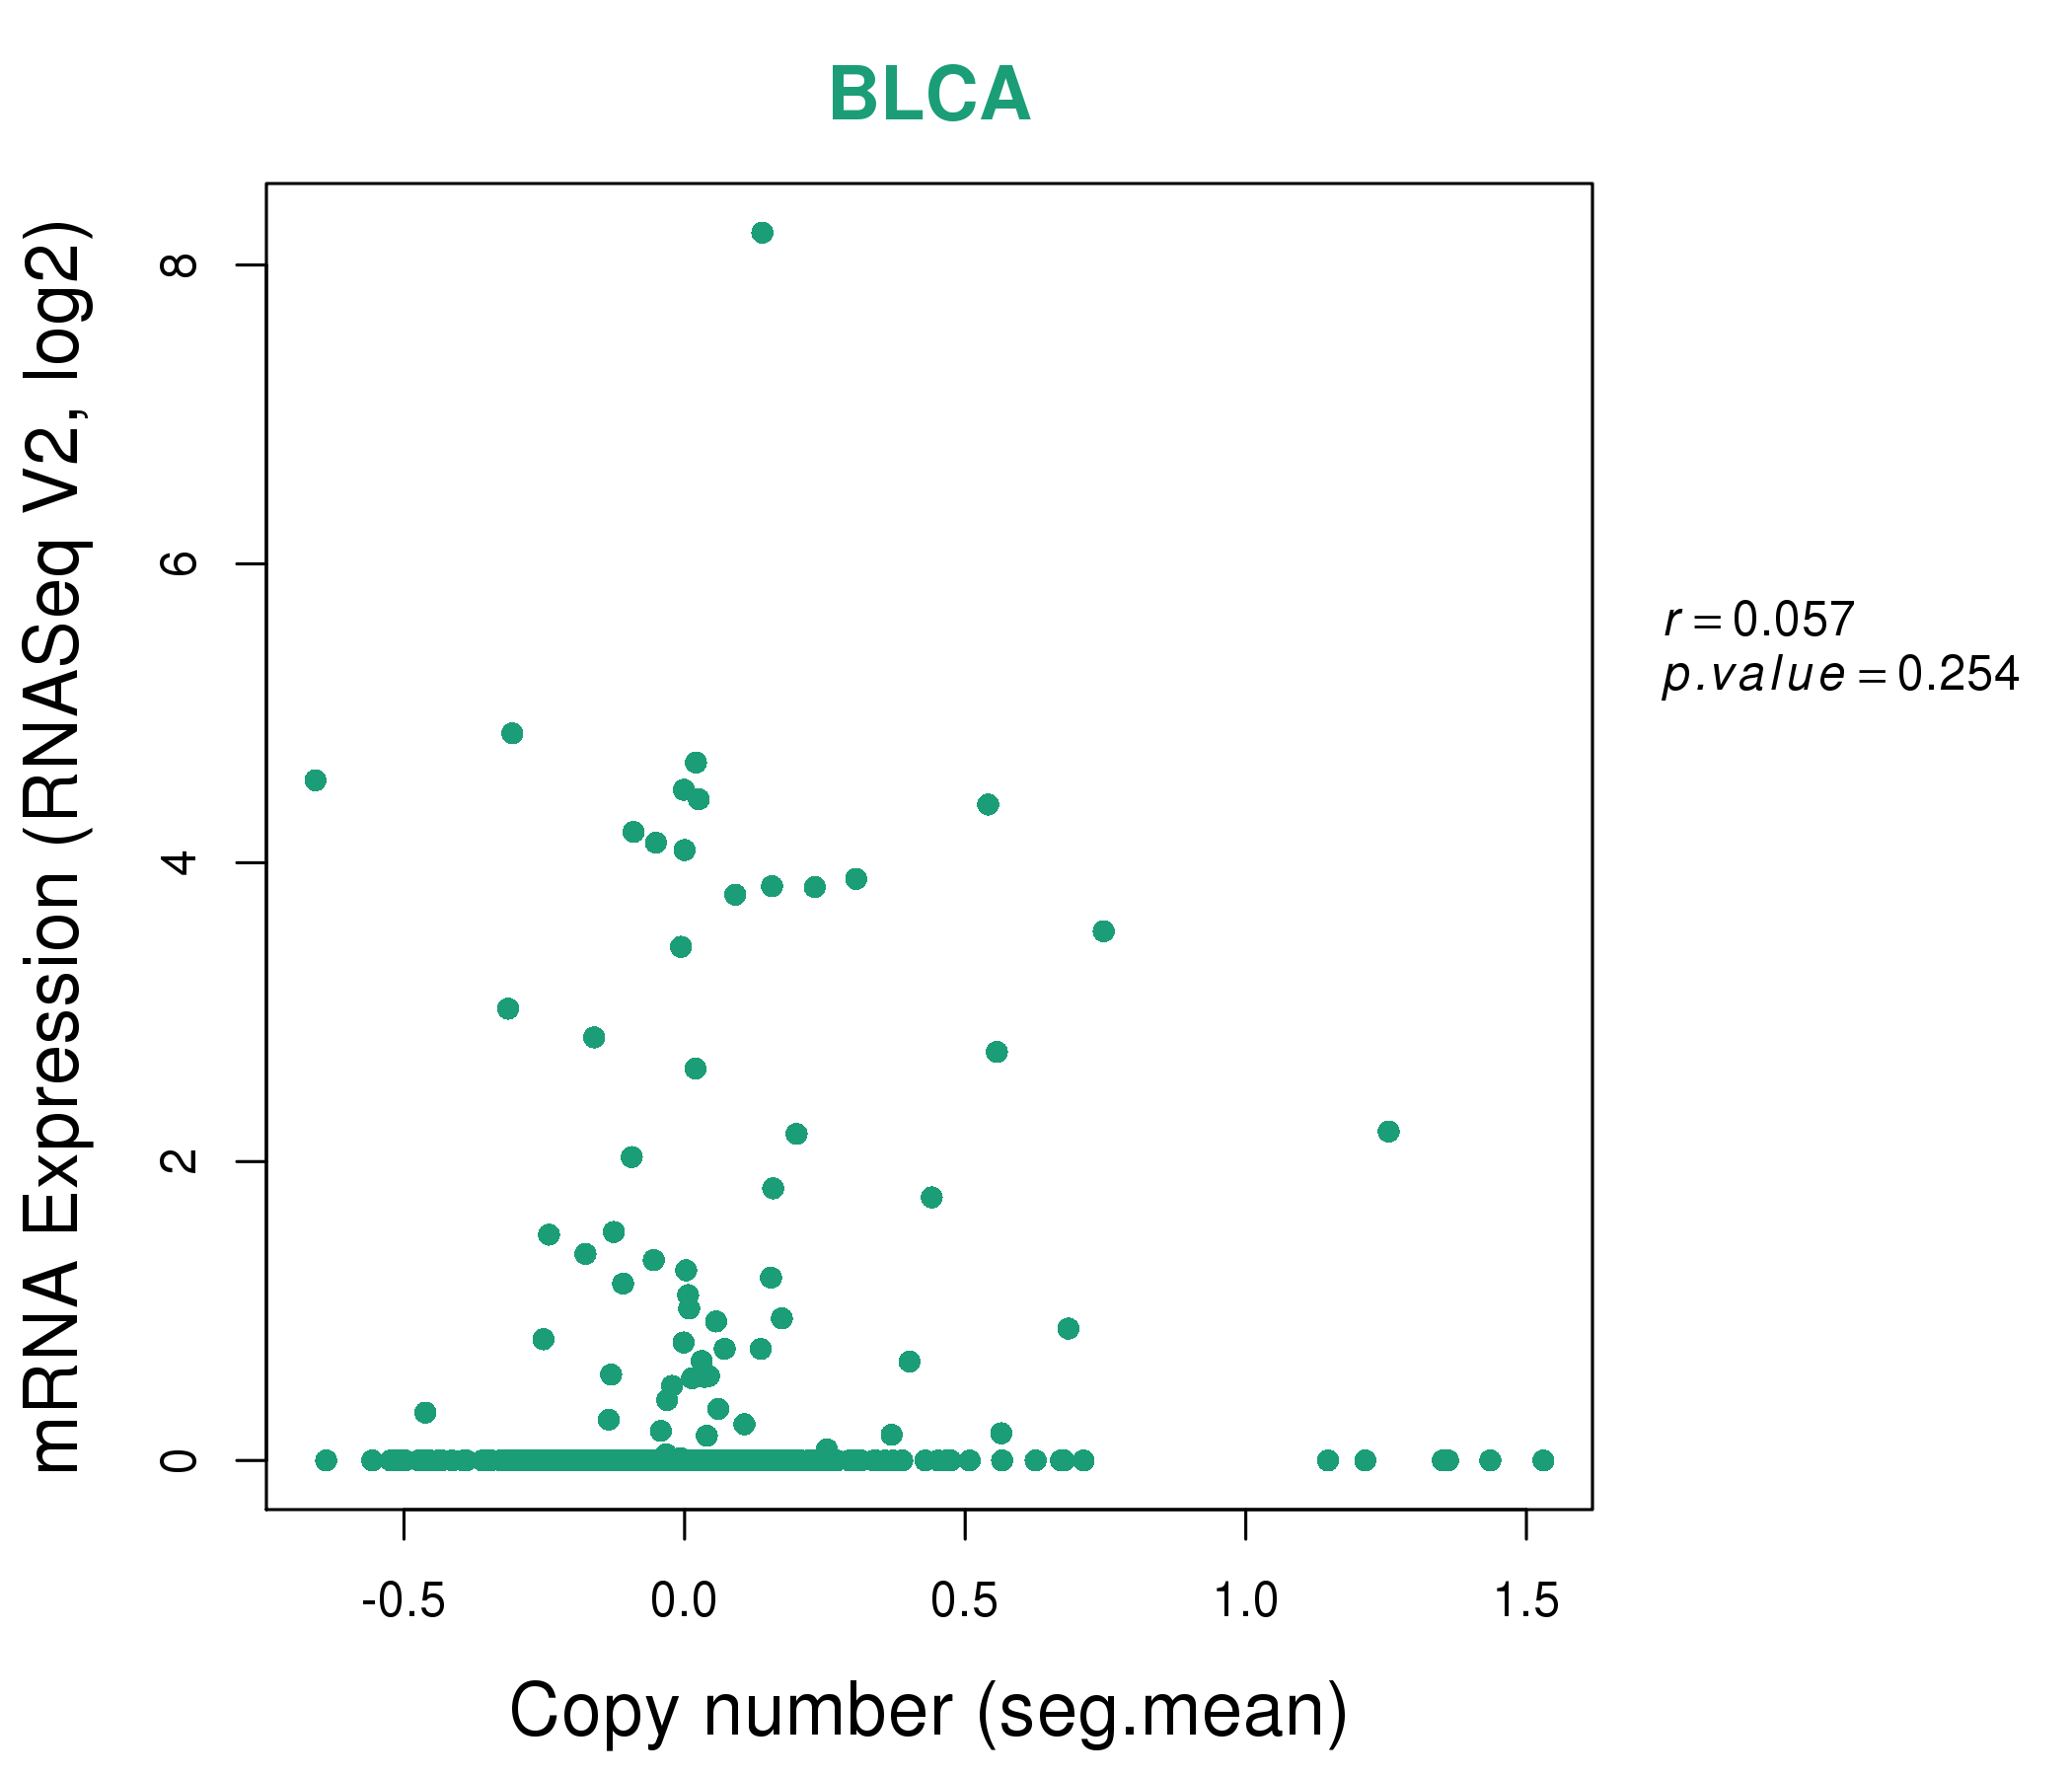
| * This plots show the correlation between CNV and gene expression. |
: Open all plots for all cancer types
 |
|
 |
|
| Top |
| Gene-Gene Network Information |
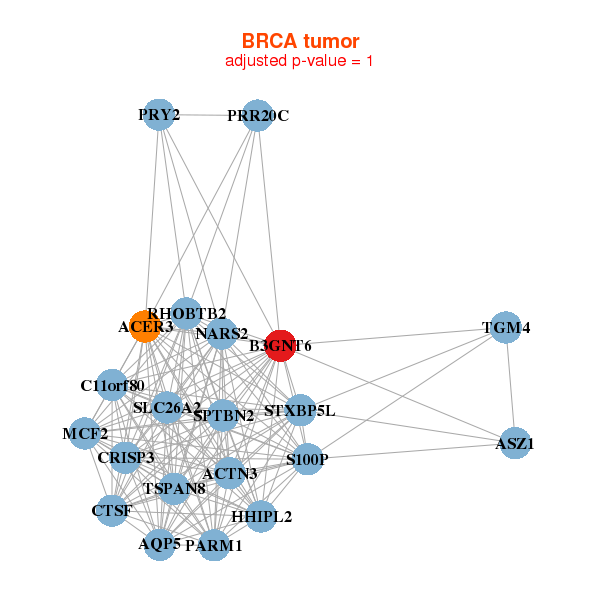
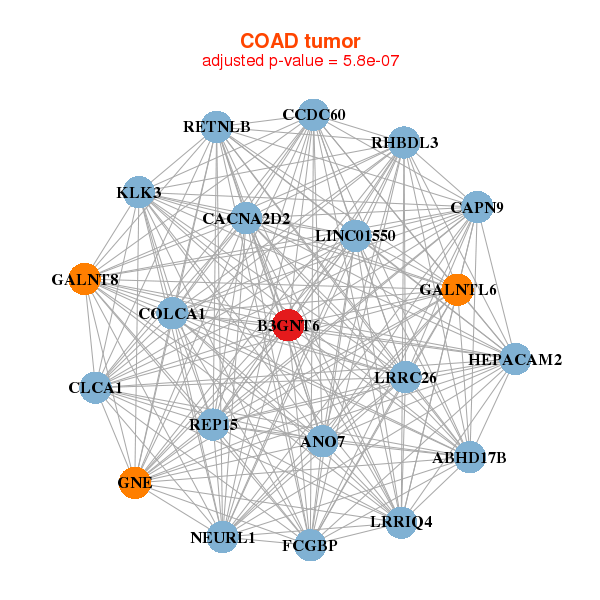
| * Co-Expression network figures were drawn using R package igraph. Only the top 20 genes with the highest correlations were shown. Red circle: input gene, orange circle: cell metabolism gene, sky circle: other gene |
: Open all plots for all cancer types
 |
|
| ACER3,ACTN3,AQP5,ASZ1,B3GNT6,C11orf80,CRISP3, CTSF,HHIPL2,MCF2,NARS2,PARM1,PRR20C,PRY2, RHOBTB2,S100P,SLC26A2,SPTBN2,STXBP5L,TGM4,TSPAN8 | ALPP,ANXA10,B3GNT6,CDHR2,GKN2,HNF4A,IGF2BP1, KRTAP13-1,MAGEA4,MSLN,NAPSA,NKX2-1,PLA2G10,BPIFA1, PSAPL1,SCGB3A2,SERPINB3,SFTA3,SFTPB,TM4SF5,TRIM15 |
 |
|
| ANO7,B3GNT6,COLCA1,LINC01550,CACNA2D2,CAPN9,CCDC60, CLCA1,ABHD17B,FCGBP,GALNT8,GALNTL6,GNE,HEPACAM2, KLK3,LRRC26,LRRIQ4,NEURL1,REP15,RETNLB,RHBDL3 | APAF1,ATOH1,B3GNT6,C15orf39,GDPGP1,CCDC88C,EIF2AK3, FCGBP,GALNT7,HES2,HIVEP3,IL23R,LOC389333,MON1B, NSF,PIK3C2B,PRR5L,SLC8B1,TMEM63B,TMEM8A,ZNF217 |
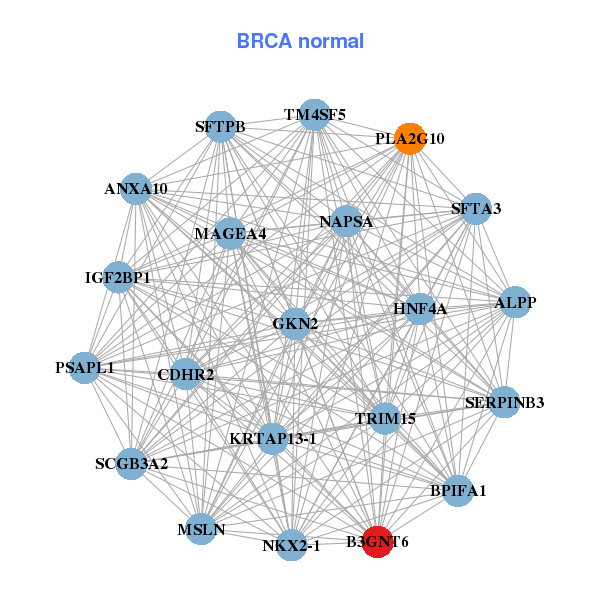
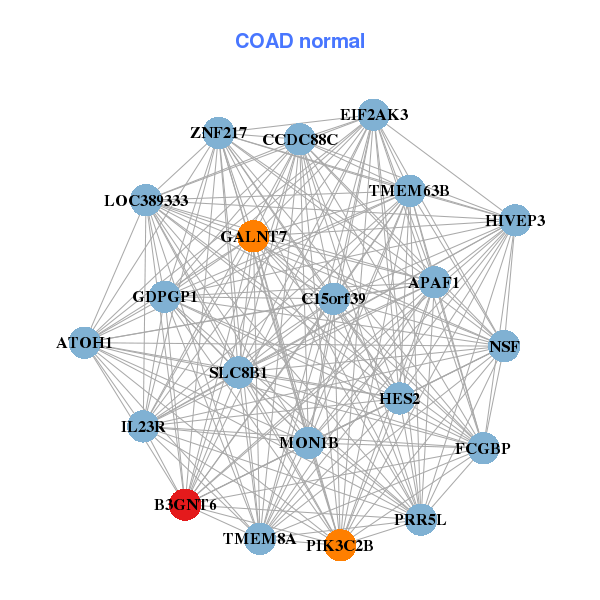
| * Co-Expression network figures were drawn using R package igraph. Only the top 20 genes with the highest correlations were shown. Red circle: input gene, orange circle: cell metabolism gene, sky circle: other gene |
: Open all plots for all cancer types
| Top |
: Open all interacting genes' information including KEGG pathway for all interacting genes from DAVID
| Top |
| Pharmacological Information for B3GNT6 |
| There's no related Drug. |
| Top |
| Cross referenced IDs for B3GNT6 |
| * We obtained these cross-references from Uniprot database. It covers 150 different DBs, 18 categories. http://www.uniprot.org/help/cross_references_section |
: Open all cross reference information
|
Copyright © 2016-Present - The Univsersity of Texas Health Science Center at Houston @ |