|
||||||||||||||||||||||||||||||||||||||||||||||||||||||||||||||||||||||||||||||||||||||||||||||||||||||||||||||||||||||||||||||||||||||||||||||||||||||||||||||||||||||||||||||||||||||||||||||||||||||||||||||||||||||||||||||||||||||||||||||||||||||||||||||||||||||||||||||||||||||||||||||||||||||||||||||||||||||||||
| |
| Phenotypic Information (metabolism pathway, cancer, disease, phenome) |
| |
| |
| Gene-Gene Network Information: Co-Expression Network, Interacting Genes & KEGG |
| |
|


| Gene Summary for EEF1D |
| Top |
| Phenotypic Information for EEF1D(metabolism pathway, cancer, disease, phenome) |
| Cancer | CGAP: EEF1D |
| Familial Cancer Database: EEF1D | |
| * This gene is included in those cancer gene databases. |
|
|
|
|
|
| . | ||||||||||||||||||||||||||||||||||||||||||||||||||||||||||||||||||||||||||||||||||||||||||||||||||||||||||||||||||||||||||||||||||||||||||||||||||||||||||||||||||||||||||||||||||||||||||||||||||||||||||||||||||||||||||||||||||||||||||||||||||||||||||||||||||||||||||||||||||||||||||||||||||||||||||||||||||||
Oncogene 1 | Significant driver gene in | |||||||||||||||||||||||||||||||||||||||||||||||||||||||||||||||||||||||||||||||||||||||||||||||||||||||||||||||||||||||||||||||||||||||||||||||||||||||||||||||||||||||||||||||||||||||||||||||||||||||||||||||||||||||||||||||||||||||||||||||||||||||||||||||||||||||||||||||||||||||||||||||||||||||||||||||||||||||||
| cf) number; DB name 1 Oncogene; http://nar.oxfordjournals.org/content/35/suppl_1/D721.long, 2 Tumor Suppressor gene; https://bioinfo.uth.edu/TSGene/, 3 Cancer Gene Census; http://www.nature.com/nrc/journal/v4/n3/abs/nrc1299.html, 4 CancerGenes; http://nar.oxfordjournals.org/content/35/suppl_1/D721.long, 5 Network of Cancer Gene; http://ncg.kcl.ac.uk/index.php, 1Therapeutic Vulnerabilities in Cancer; http://cbio.mskcc.org/cancergenomics/statius/ |
| REACTOME_METABOLISM_OF_PROTEINS | |
| OMIM | |
| Orphanet | |
| Disease | KEGG Disease: EEF1D |
| MedGen: EEF1D (Human Medical Genetics with Condition) | |
| ClinVar: EEF1D | |
| Phenotype | MGI: EEF1D (International Mouse Phenotyping Consortium) |
| PhenomicDB: EEF1D | |
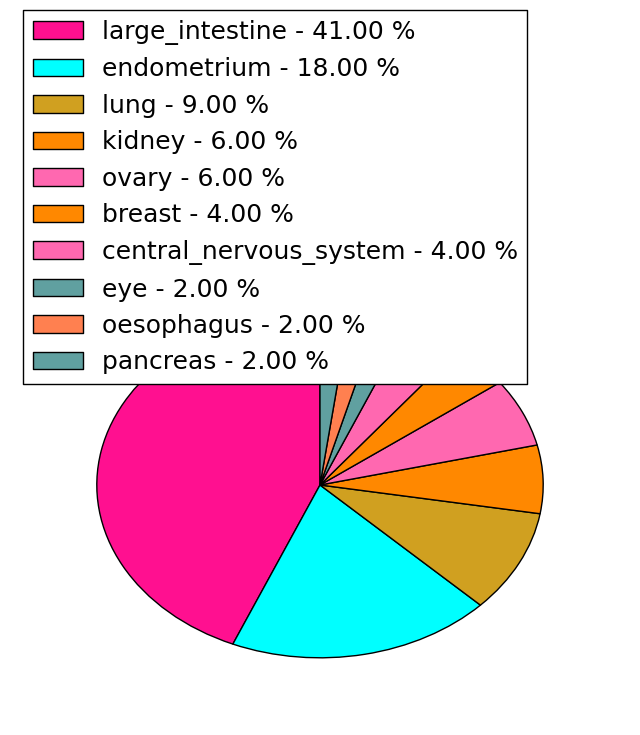
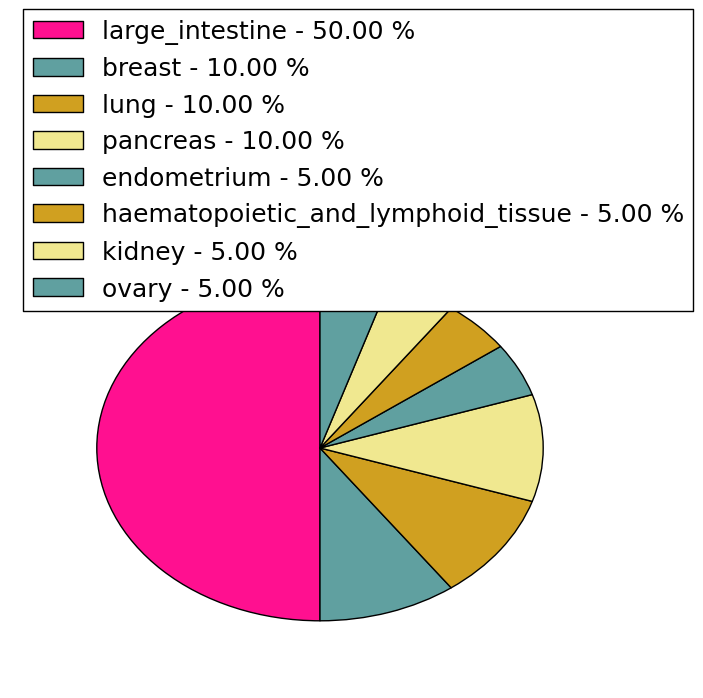
| Mutations for EEF1D |
| * Under tables are showing count per each tissue to give us broad intuition about tissue specific mutation patterns.You can go to the detailed page for each mutation database's web site. |
| There's no structural variation information in COSMIC data for this gene. |
| * From mRNA Sanger sequences, Chitars2.0 arranged chimeric transcripts. This table shows EEF1D related fusion information. |
| ID | Head Gene | Tail Gene | Accession | Gene_a | qStart_a | qEnd_a | Chromosome_a | tStart_a | tEnd_a | Gene_a | qStart_a | qEnd_a | Chromosome_a | tStart_a | tEnd_a |
| BF513928 | EEF1D | 1 | 155 | 8 | 144672143 | 144679549 | EEF1D | 151 | 519 | 8 | 144671712 | 144672080 | |
| BG004570 | XRN2 | 8 | 163 | 20 | 21311260 | 21312271 | EEF1D | 159 | 283 | 8 | 144674315 | 144674439 | |
| BG955510 | EEF1D | 1 | 201 | 8 | 144662865 | 144663465 | EEF1D | 184 | 249 | 8 | 144663430 | 144663499 | |
| DB154094 | EEF1D | 1 | 67 | 8 | 144679517 | 144679583 | UBE2L3 | 67 | 596 | 22 | 21947150 | 21976050 | |
| BQ925563 | PSMB7 | 1 | 607 | 9 | 127119210 | 127119816 | EEF1D | 608 | 855 | 8 | 144668389 | 144679566 | |
| BF912863 | SORT1 | 30 | 143 | 1 | 109856567 | 109856681 | EEF1D | 135 | 401 | 8 | 144662875 | 144668431 | |
| BI860302 | EEF1D | 1 | 295 | 8 | 144662237 | 144662830 | NFKBIB | 287 | 637 | 19 | 39398809 | 39399159 | |
| BG545390 | B2M | 2 | 100 | 15 | 45003715 | 45003812 | EEF1D | 95 | 253 | 8 | 144674959 | 144675116 | |
| BC034020 | B2M | 1 | 98 | 15 | 45003715 | 45003812 | EEF1D | 93 | 251 | 8 | 144674959 | 144675116 | |
| BC008012 | RPL30 | 43 | 415 | 8 | 99053949 | 99057600 | EEF1D | 407 | 1377 | 8 | 144661898 | 144679574 | |
| BF513932 | EEF1D | 1 | 155 | 8 | 144672143 | 144679549 | EEF1D | 151 | 493 | 8 | 144671738 | 144672080 | |
| Top |
| Mutation type/ Tissue ID | brca | cns | cerv | endome | haematopo | kidn | Lintest | liver | lung | ns | ovary | pancre | prost | skin | stoma | thyro | urina | |||
| Total # sample | 1 | |||||||||||||||||||
| GAIN (# sample) | 1 | |||||||||||||||||||
| LOSS (# sample) |
| cf) Tissue ID; Tissue type (1; Breast, 2; Central_nervous_system, 3; Cervix, 4; Endometrium, 5; Haematopoietic_and_lymphoid_tissue, 6; Kidney, 7; Large_intestine, 8; Liver, 9; Lung, 10; NS, 11; Ovary, 12; Pancreas, 13; Prostate, 14; Skin, 15; Stomach, 16; Thyroid, 17; Urinary_tract) |
| Top |
|
 |
| Top |
| Stat. for Non-Synonymous SNVs (# total SNVs=43) | (# total SNVs=20) |
 |  |
(# total SNVs=3) | (# total SNVs=0) |
 |
| Top |
| * When you move the cursor on each content, you can see more deailed mutation information on the Tooltip. Those are primary_site,primary_histology,mutation(aa),pubmedID. |
| GRCh37 position | Mutation(aa) | Unique sampleID count |
| chr8:144671244-144671244 | p.R336R | 7 |
| chr8:144671685-144671685 | p.D189E | 6 |
| chr8:144671277-144671277 | p.A325A | 2 |
| chr8:144668984-144668984 | p.I377T | 2 |
| chr8:144663466-144663466 | p.S440S | 2 |
| chr8:144668985-144668985 | p.I377F | 2 |
| chr8:144663282-144663282 | p.R477Q | 2 |
| chr8:144663283-144663283 | p.R477W | 2 |
| chr8:144662795-144662795 | p.E531K | 1 |
| chr8:144671743-144671743 | p.F170S | 1 |
| Top |
|
 |
| Point Mutation/ Tissue ID | 1 | 2 | 3 | 4 | 5 | 6 | 7 | 8 | 9 | 10 | 11 | 12 | 13 | 14 | 15 | 16 | 17 | 18 | 19 | 20 |
| # sample | 3 | 3 | 11 | 2 | 2 | 1 | 1 | 2 | 6 | 7 | ||||||||||
| # mutation | 3 | 3 | 8 | 3 | 2 | 1 | 1 | 2 | 6 | 8 | ||||||||||
| nonsynonymous SNV | 1 | 1 | 6 | 2 | 1 | 1 | 1 | 4 | 7 | |||||||||||
| synonymous SNV | 2 | 2 | 2 | 1 | 1 | 2 | 2 | 1 |
| cf) Tissue ID; Tissue type (1; BLCA[Bladder Urothelial Carcinoma], 2; BRCA[Breast invasive carcinoma], 3; CESC[Cervical squamous cell carcinoma and endocervical adenocarcinoma], 4; COAD[Colon adenocarcinoma], 5; GBM[Glioblastoma multiforme], 6; Glioma Low Grade, 7; HNSC[Head and Neck squamous cell carcinoma], 8; KICH[Kidney Chromophobe], 9; KIRC[Kidney renal clear cell carcinoma], 10; KIRP[Kidney renal papillary cell carcinoma], 11; LAML[Acute Myeloid Leukemia], 12; LUAD[Lung adenocarcinoma], 13; LUSC[Lung squamous cell carcinoma], 14; OV[Ovarian serous cystadenocarcinoma ], 15; PAAD[Pancreatic adenocarcinoma], 16; PRAD[Prostate adenocarcinoma], 17; SKCM[Skin Cutaneous Melanoma], 18:STAD[Stomach adenocarcinoma], 19:THCA[Thyroid carcinoma], 20:UCEC[Uterine Corpus Endometrial Carcinoma]) |
| Top |
| * We represented just top 10 SNVs. When you move the cursor on each content, you can see more deailed mutation information on the Tooltip. Those are primary_site, primary_histology, mutation(aa), pubmedID. |
| Genomic Position | Mutation(aa) | Unique sampleID count |
| chr8:144663400 | p.R87Q,EEF1D | 2 |
| chr8:144668984 | p.I11T,EEF1D | 2 |
| chr8:144668985 | p.R87W,EEF1D | 2 |
| chr8:144663282 | p.I11V,EEF1D | 2 |
| chr8:144663283 | p.G72G,EEF1D | 2 |
| chr8:144668960 | p.V230V,EEF1D | 1 |
| chr8:144662334 | p.S62G,EEF1D | 1 |
| chr8:144672048 | p.V178M,EEF1D | 1 |
| chr8:144663405 | p.Y214Y,EEF1D | 1 |
| chr8:144668979 | p.G48C,EEF1D | 1 |
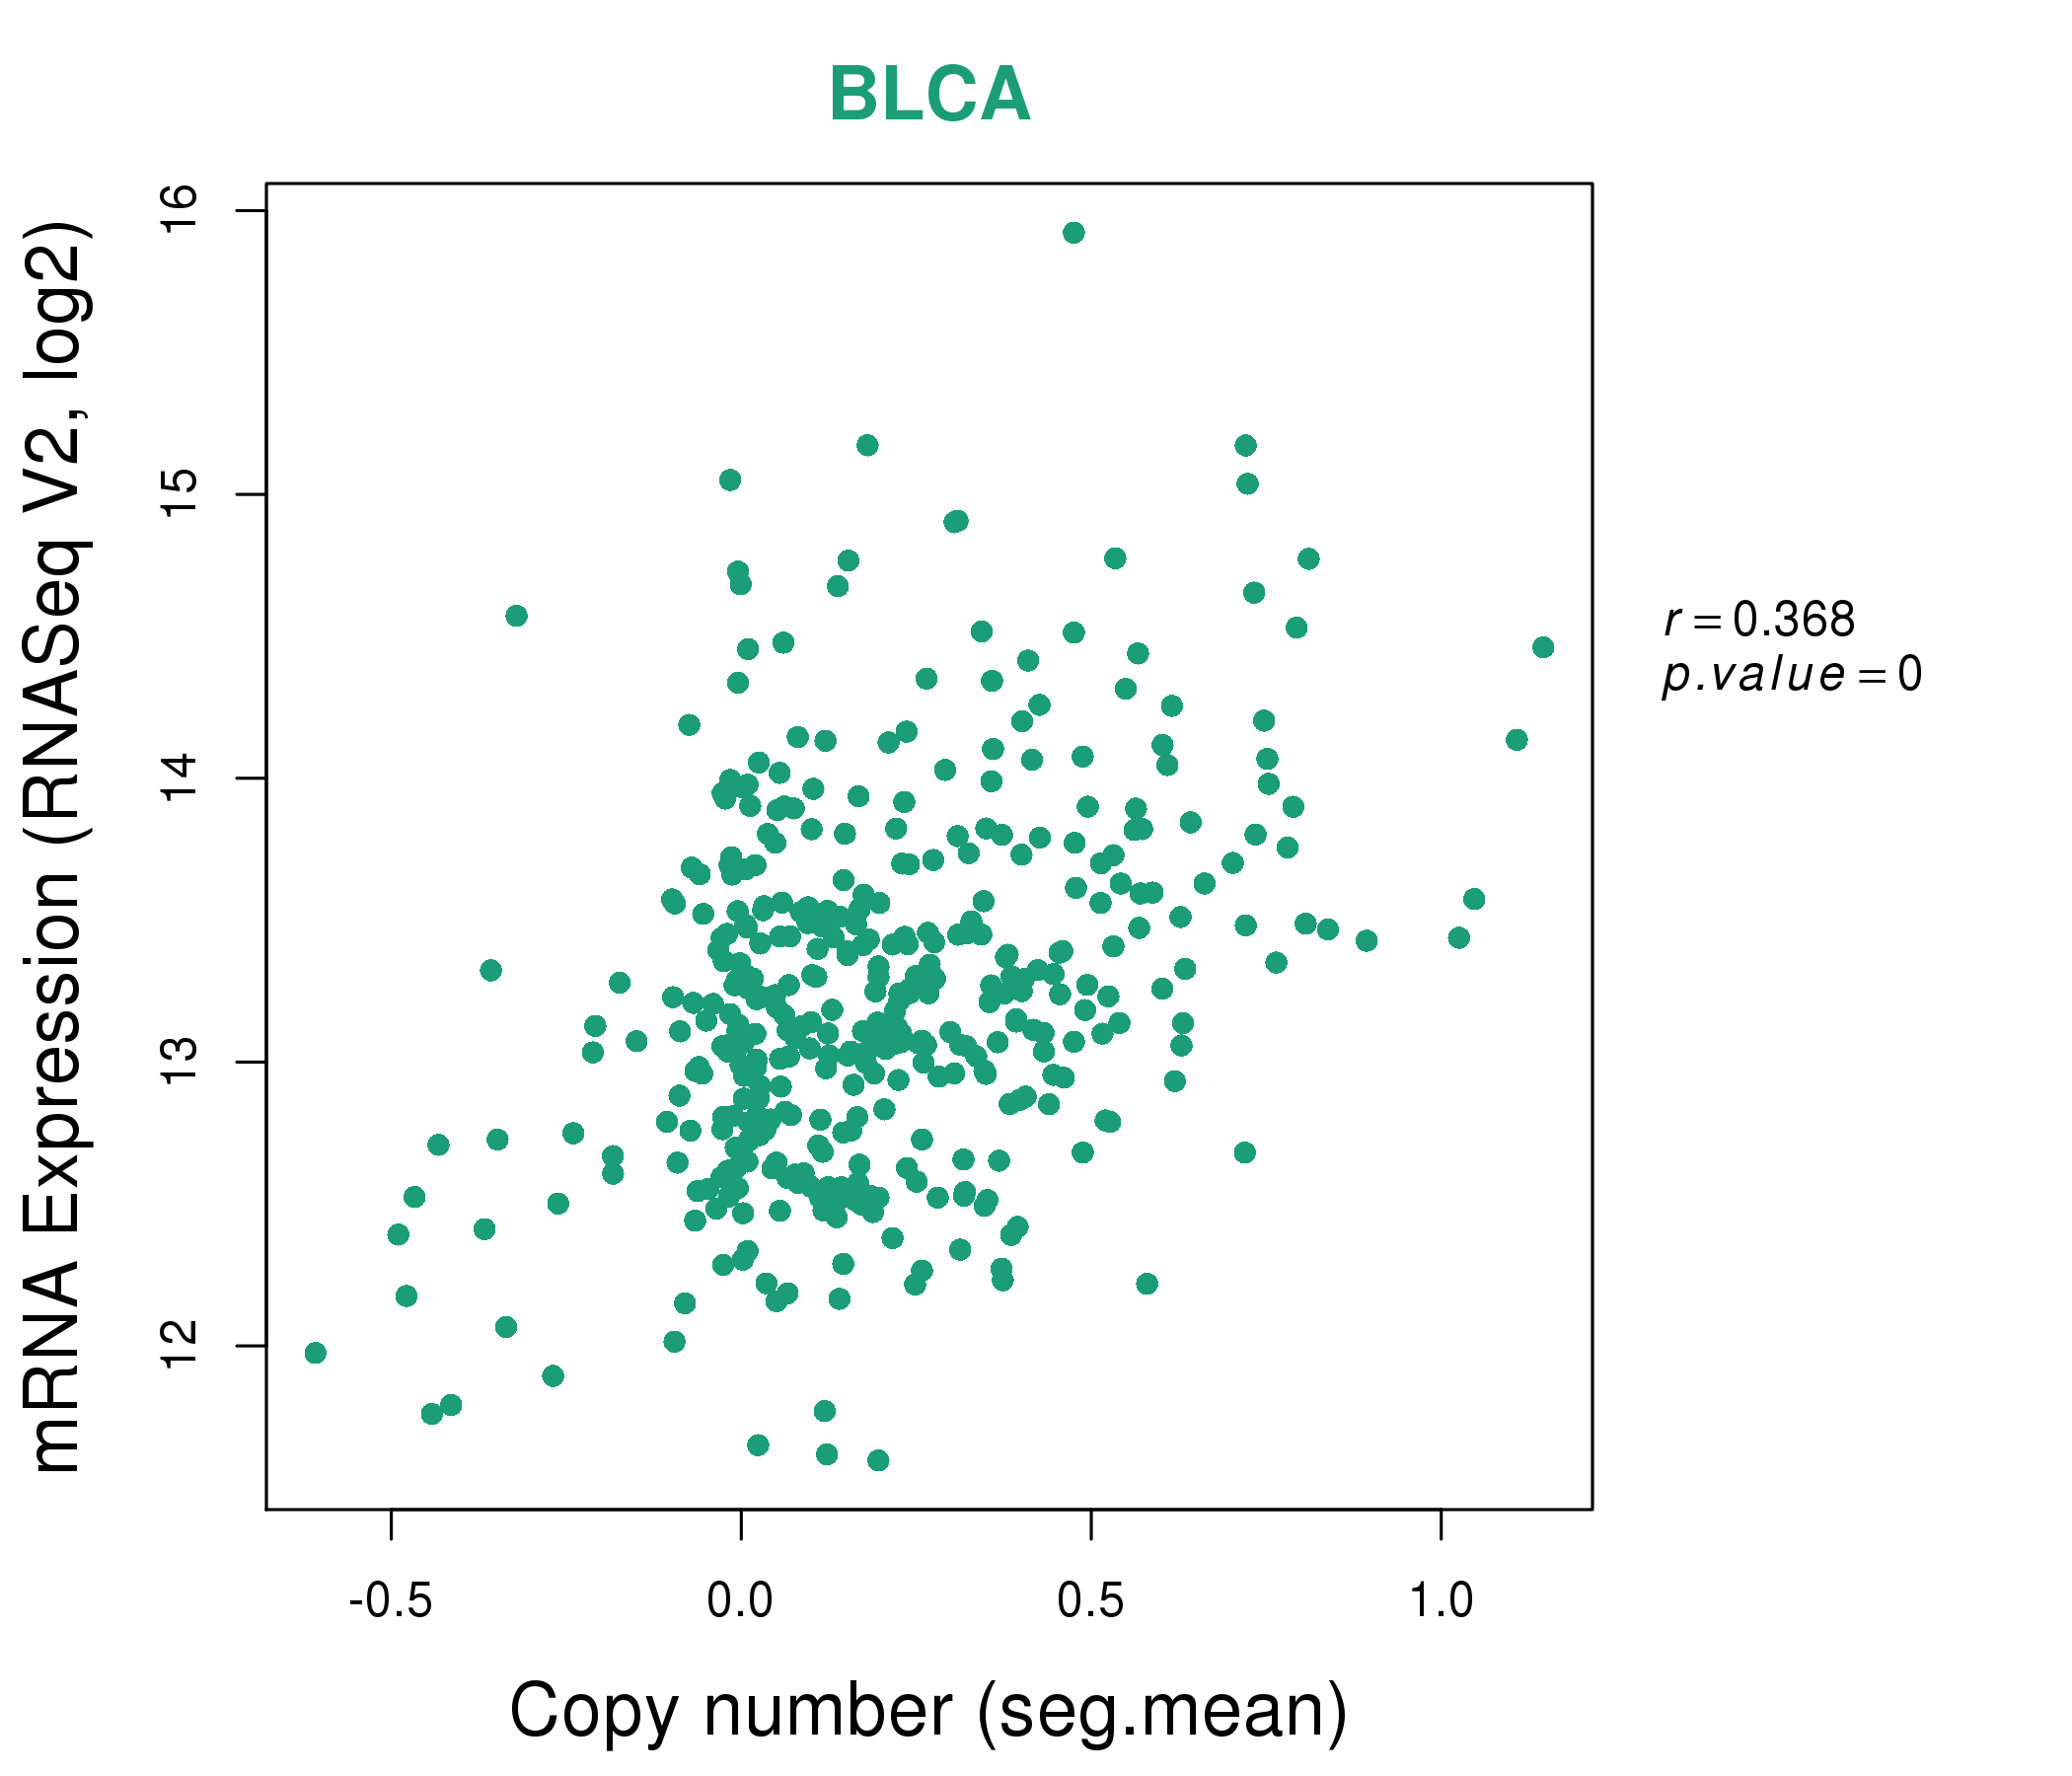
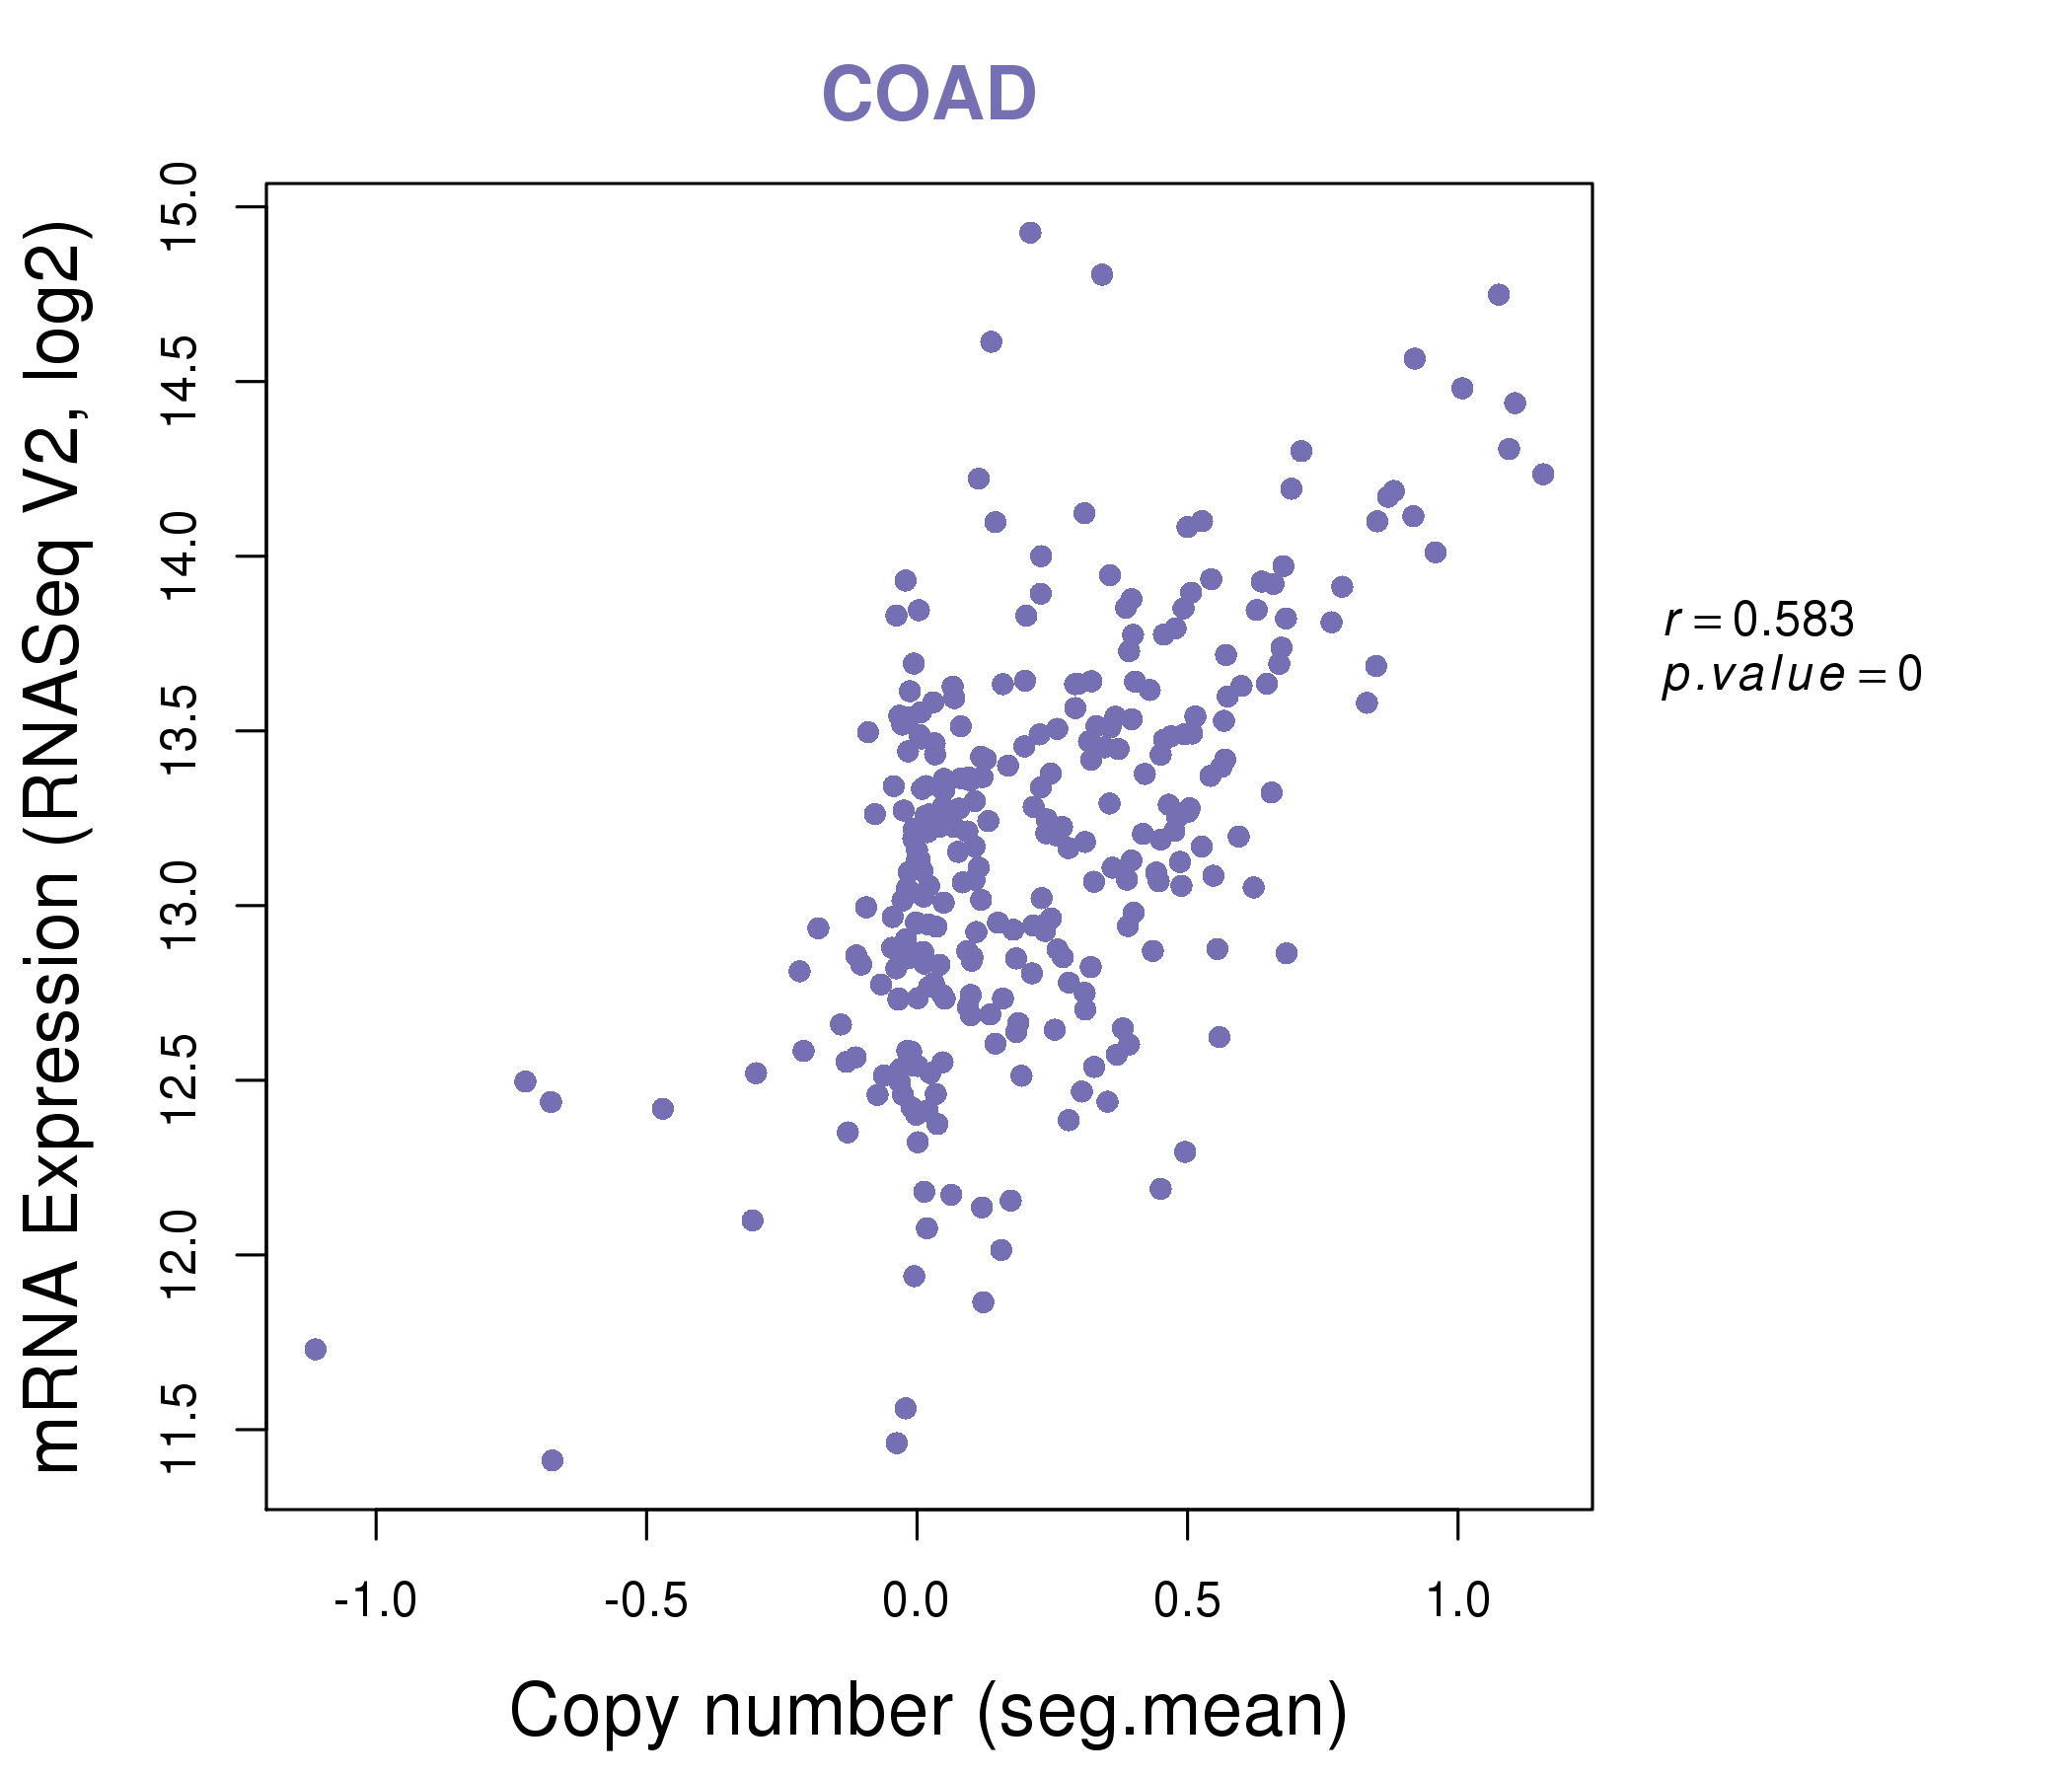
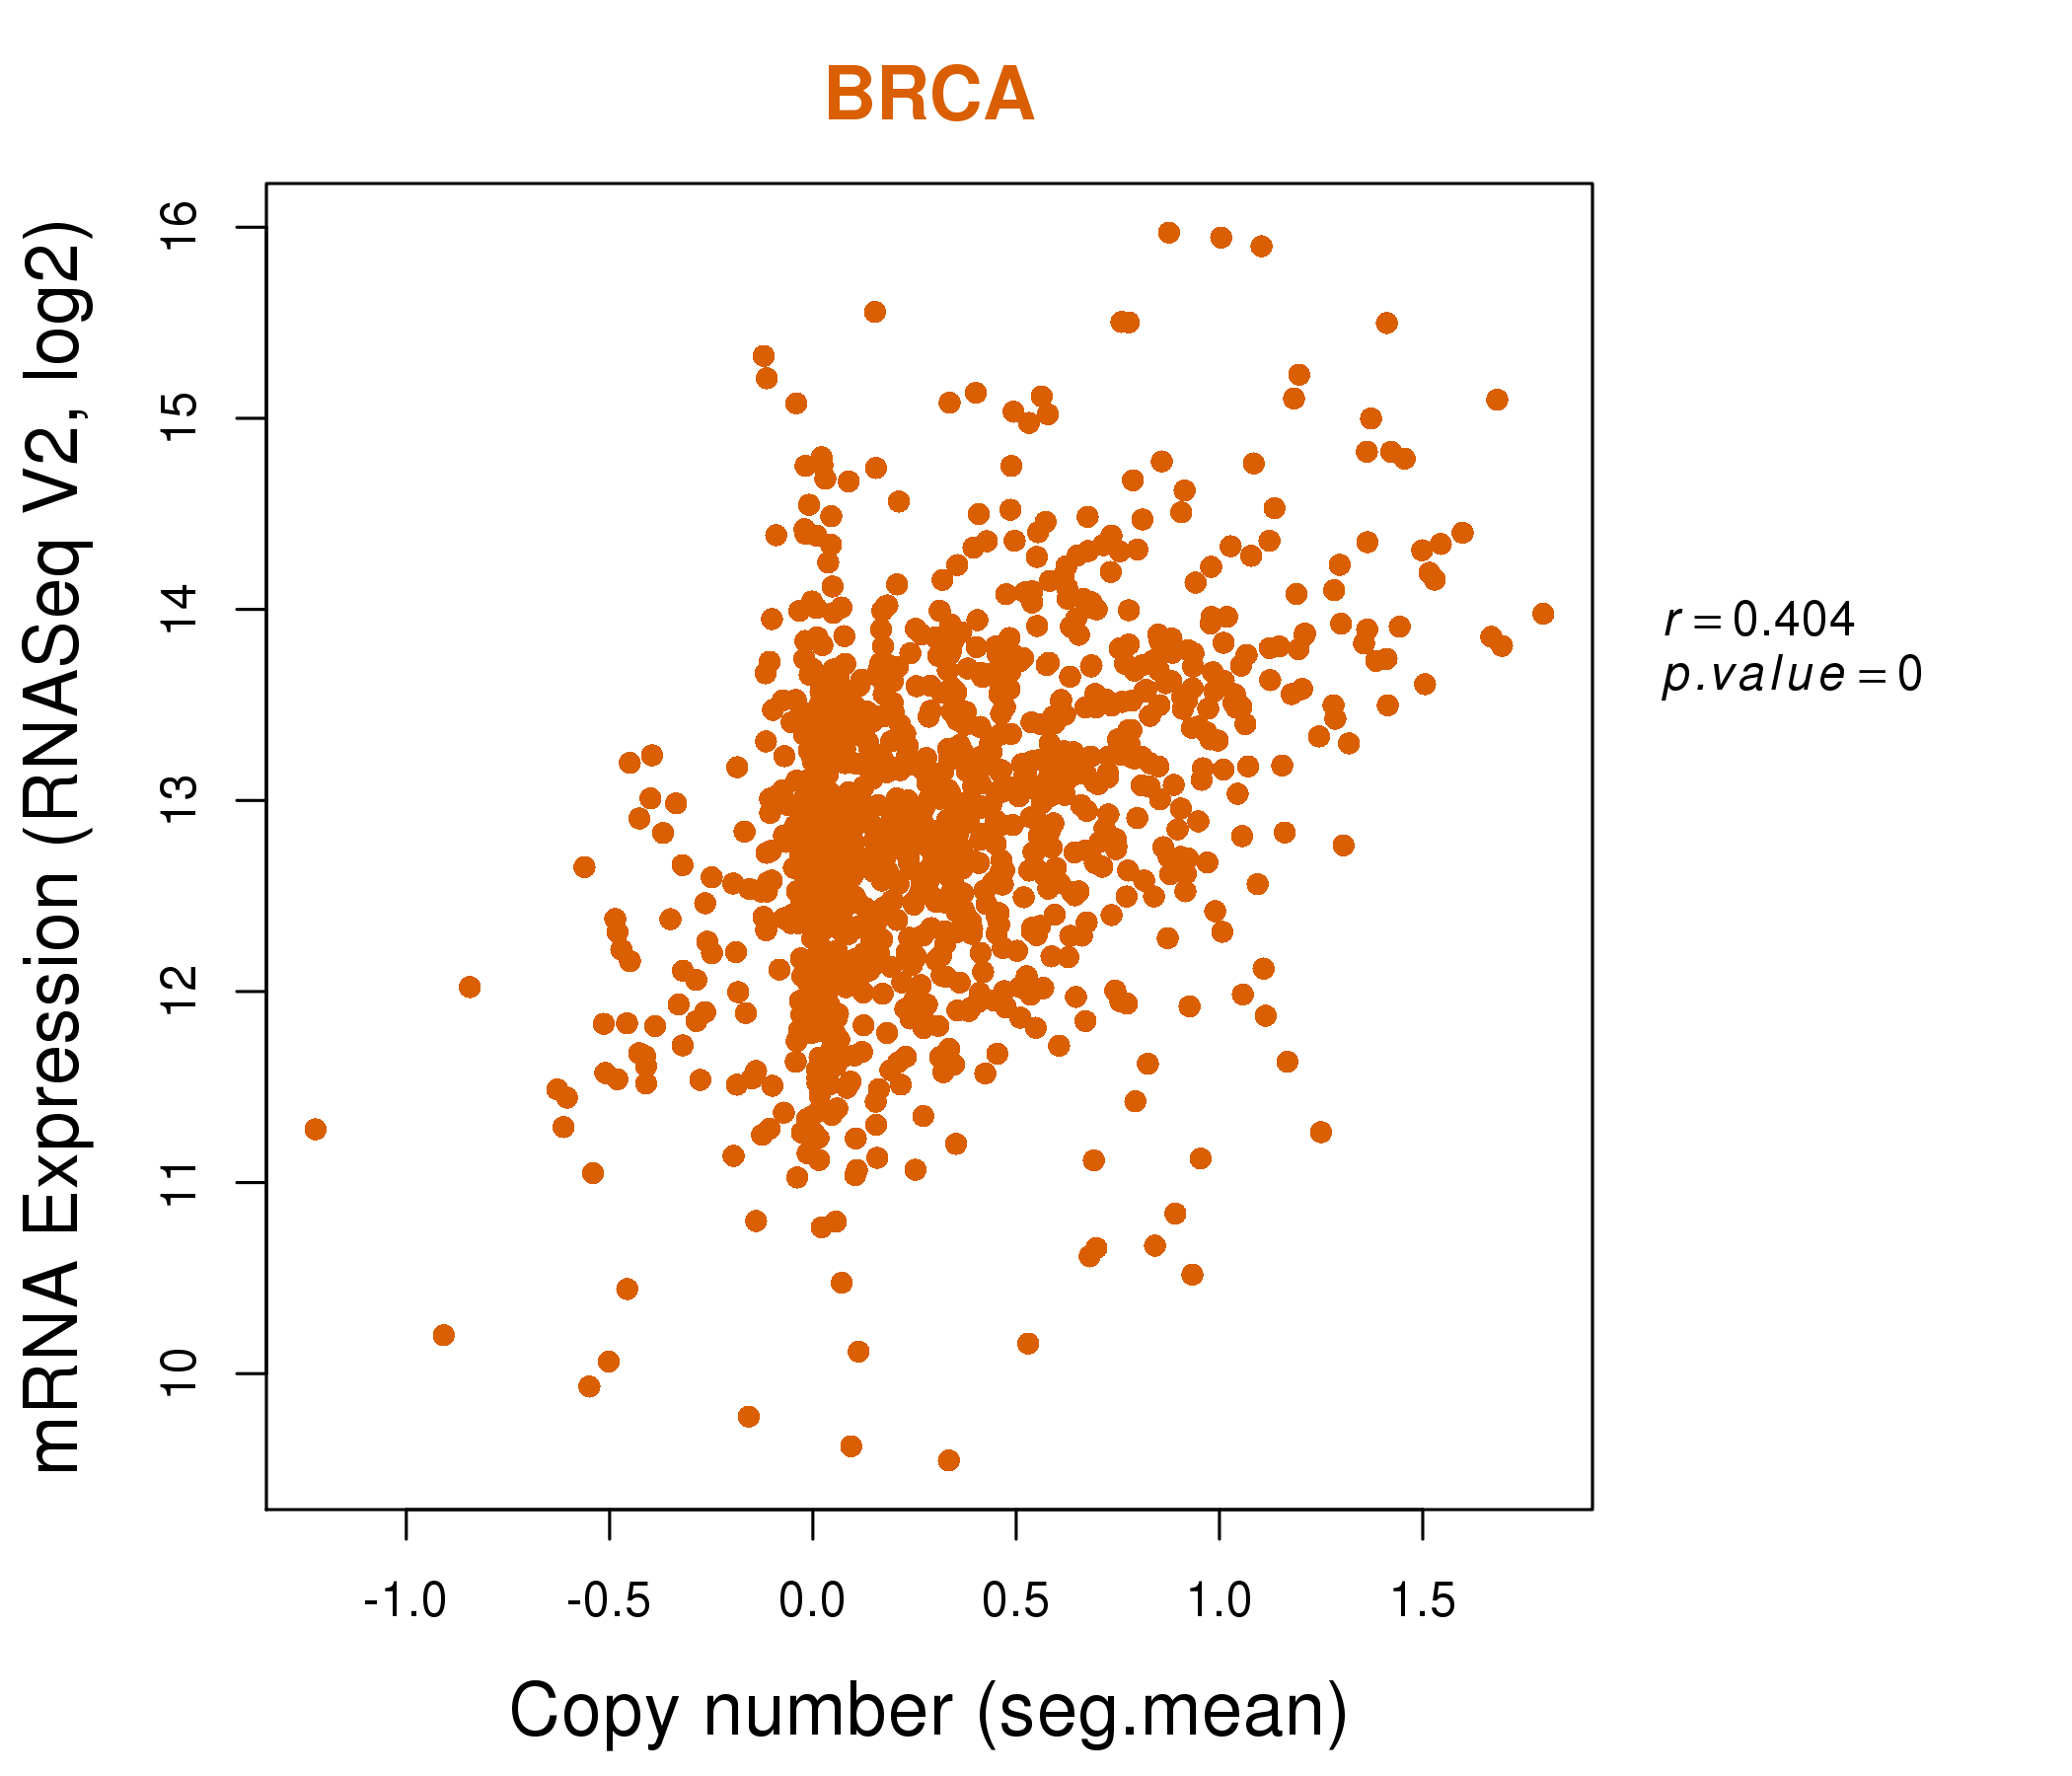
| * Copy number data were extracted from TCGA using R package TCGA-Assembler. The URLs of all public data files on TCGA DCC data server were gathered on Jan-05-2015. Function ProcessCNAData in TCGA-Assembler package was used to obtain gene-level copy number value which is calculated as the average copy number of the genomic region of a gene. |
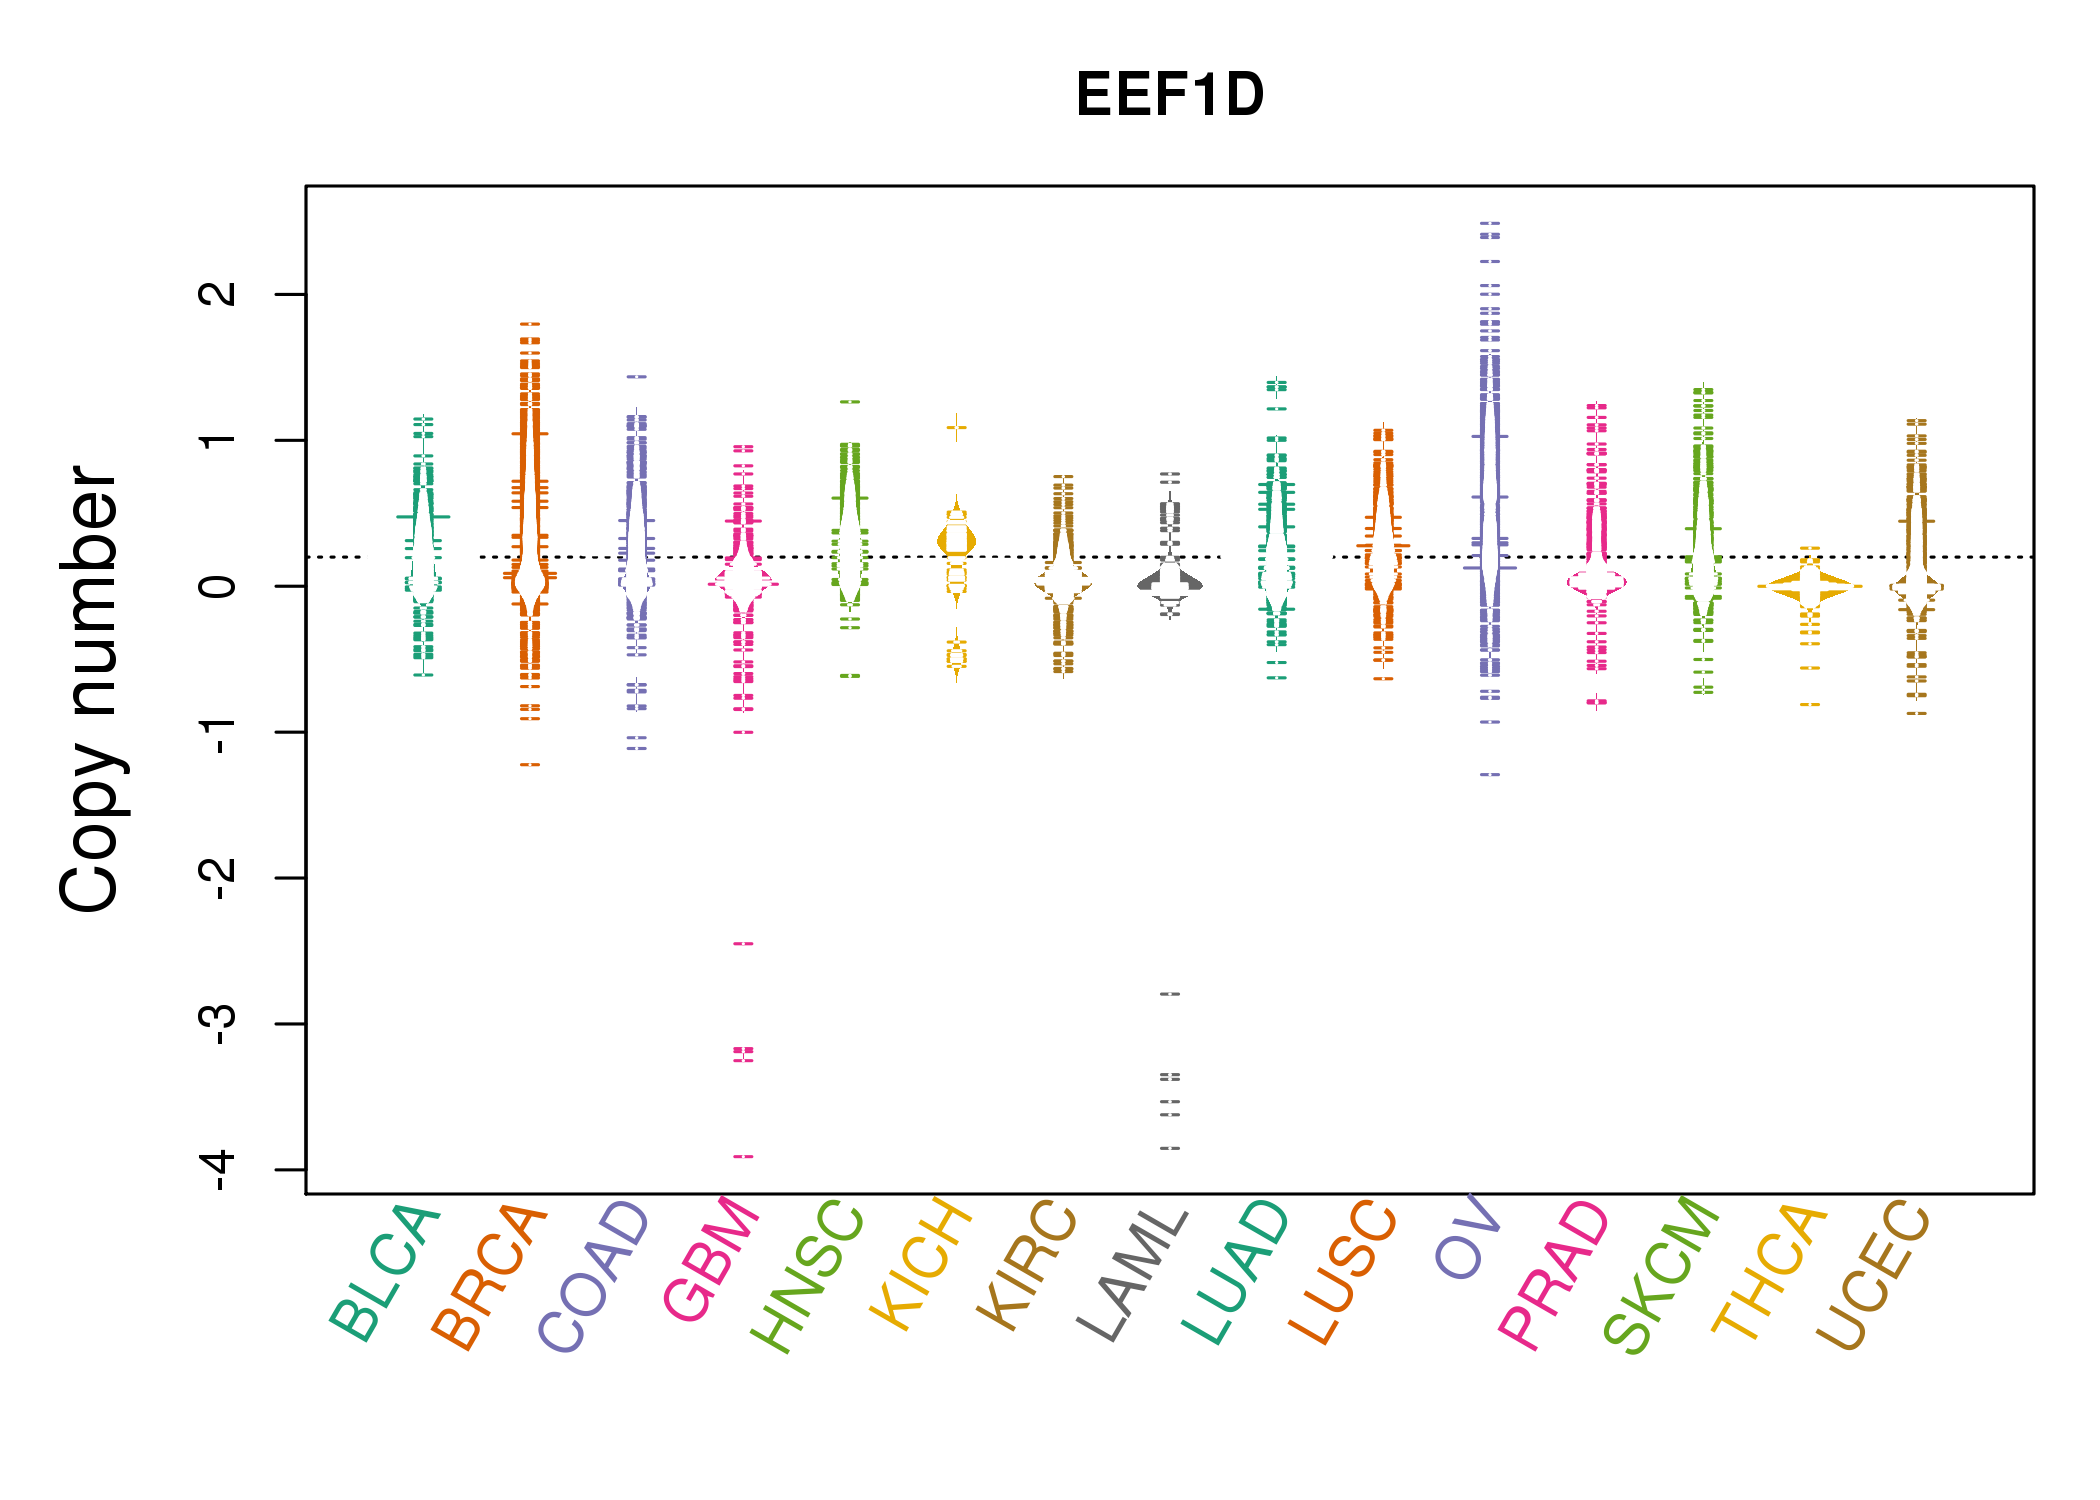 |
| cf) Tissue ID[Tissue type]: BLCA[Bladder Urothelial Carcinoma], BRCA[Breast invasive carcinoma], CESC[Cervical squamous cell carcinoma and endocervical adenocarcinoma], COAD[Colon adenocarcinoma], GBM[Glioblastoma multiforme], Glioma Low Grade, HNSC[Head and Neck squamous cell carcinoma], KICH[Kidney Chromophobe], KIRC[Kidney renal clear cell carcinoma], KIRP[Kidney renal papillary cell carcinoma], LAML[Acute Myeloid Leukemia], LUAD[Lung adenocarcinoma], LUSC[Lung squamous cell carcinoma], OV[Ovarian serous cystadenocarcinoma ], PAAD[Pancreatic adenocarcinoma], PRAD[Prostate adenocarcinoma], SKCM[Skin Cutaneous Melanoma], STAD[Stomach adenocarcinoma], THCA[Thyroid carcinoma], UCEC[Uterine Corpus Endometrial Carcinoma] |
| Top |
| Gene Expression for EEF1D |
| * CCLE gene expression data were extracted from CCLE_Expression_Entrez_2012-10-18.res: Gene-centric RMA-normalized mRNA expression data. |
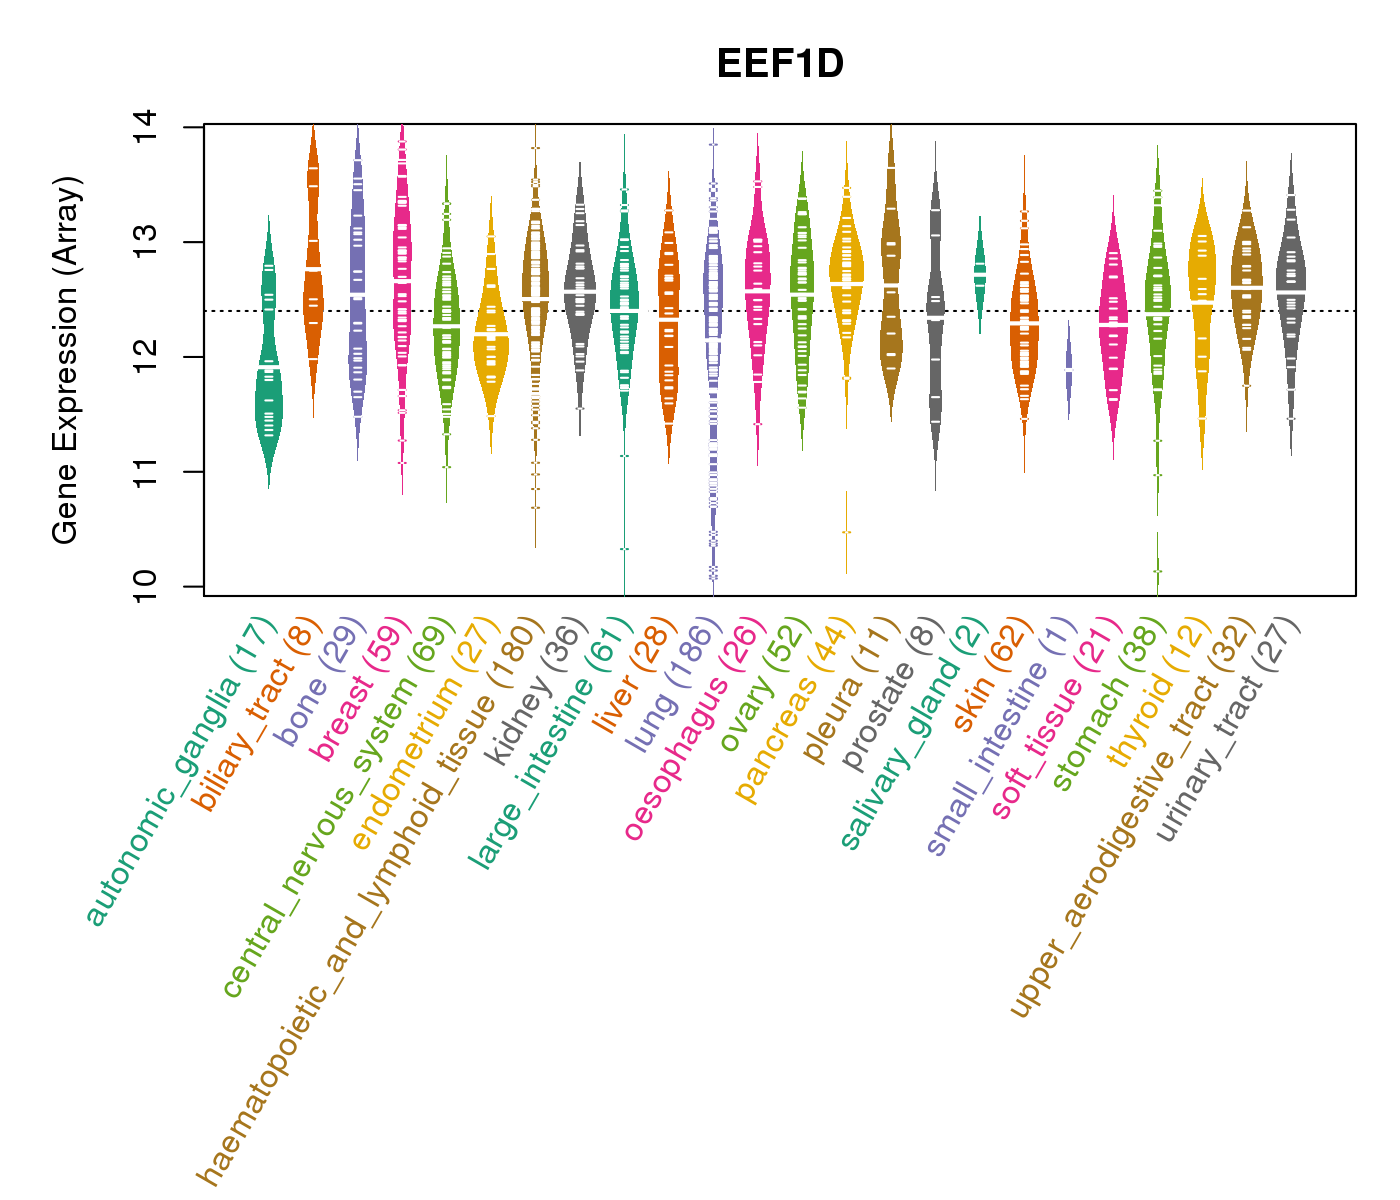 |
| * Normalized gene expression data of RNASeqV2 was extracted from TCGA using R package TCGA-Assembler. The URLs of all public data files on TCGA DCC data server were gathered at Jan-05-2015. Only eight cancer types have enough normal control samples for differential expression analysis. (t test, adjusted p<0.05 (using Benjamini-Hochberg FDR)) |
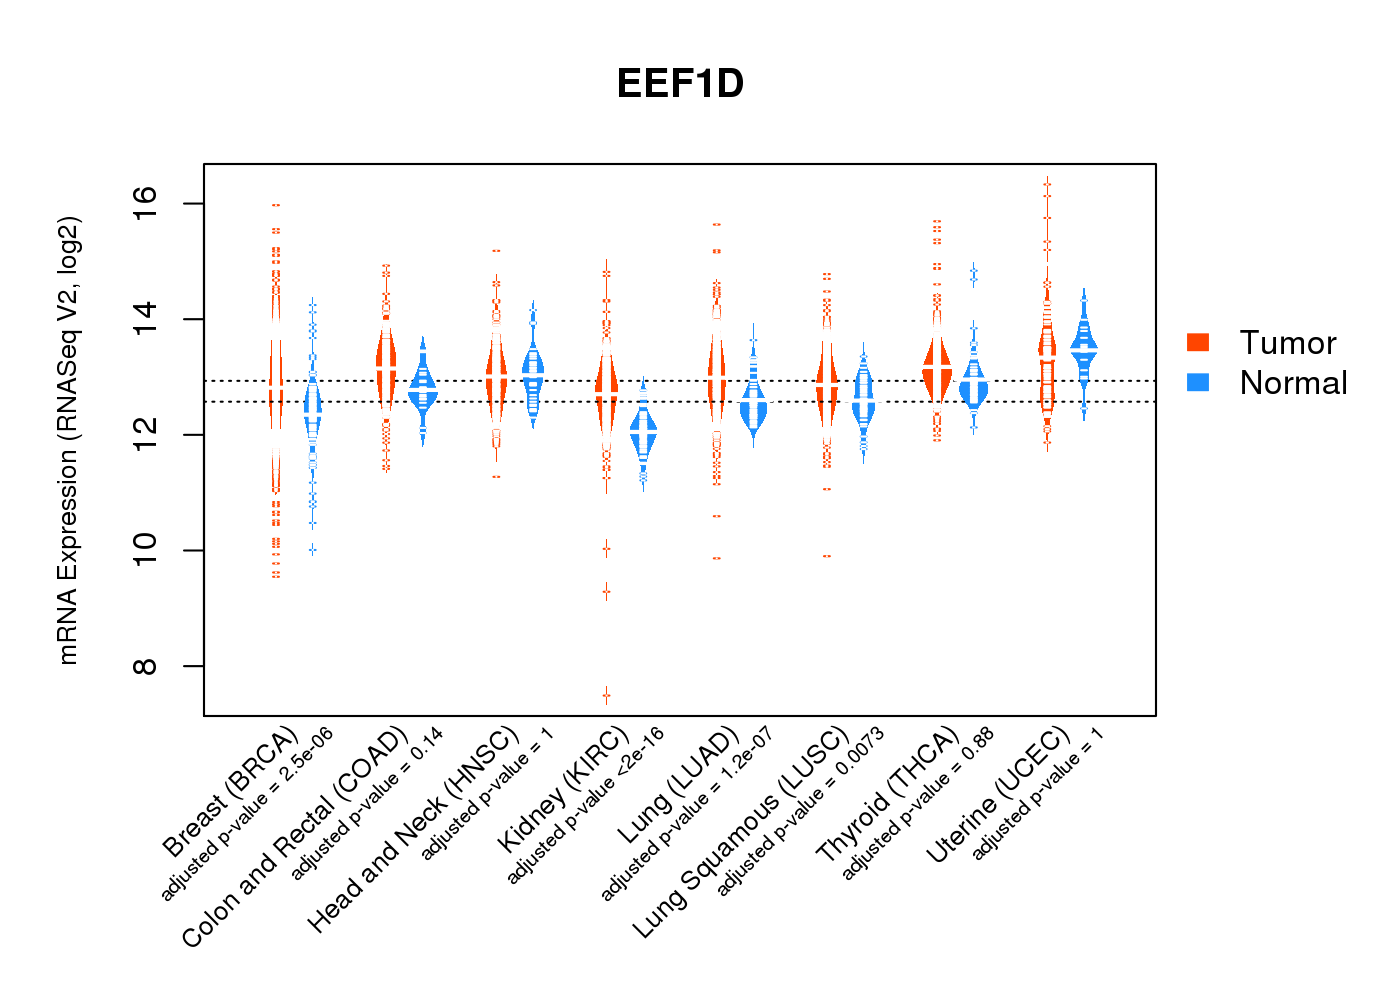 |
| Top |
| * This plots show the correlation between CNV and gene expression. |
: Open all plots for all cancer types
 |
|
 |
|

| Top |
| Gene-Gene Network Information |
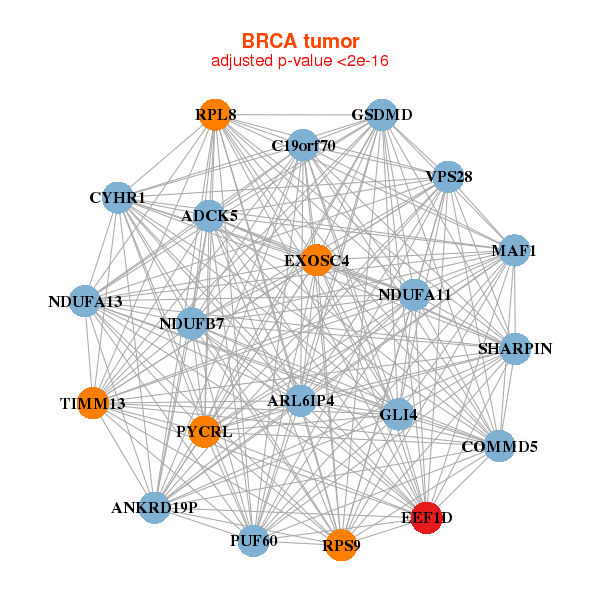
| * Co-Expression network figures were drawn using R package igraph. Only the top 20 genes with the highest correlations were shown. Red circle: input gene, orange circle: cell metabolism gene, sky circle: other gene |
: Open all plots for all cancer types
 |
|
| ADCK5,ANKRD19P,ARL6IP4,C19orf70,COMMD5,CYHR1,EEF1D, EXOSC4,GLI4,GSDMD,MAF1,NDUFA11,NDUFA13,NDUFB7, PUF60,PYCRL,RPL8,RPS9,SHARPIN,TIMM13,VPS28 | BRMS1,C12orf10,DGCR6L,EDF1,EEF1D,EIF3G,MZT2B, FAU,MRPS26,NFKBIL1,NT5C,POLR2F,PQBP1,PRDX5, PRPF31,RFXANK,RPS15,RUVBL2,SDHAF1,STRA13,SURF2 |
 |
|
| BOP1,HGH1,COMMD5,CYC1,CYHR1,EEF1D,EIF3E, EIF3H,EXOSC4,GPAA1,HSF1,MAF1,NDUFB9,PUF60, PYCRL,RPL30,RPL8,RPS20,SHARPIN,TATDN1,TOP1MT | ARL2,C10orf35,COPRS,C20orf27,FAM229B,CAMK1,COPS7A, CUEDC2,DRAP1,EEF1D,EMD,FAM195B,IGFBP7,NDNL2, NT5C3B,PRMT2,R3HCC1,IFT22,SELM,SNRPN,UBE2D4 |

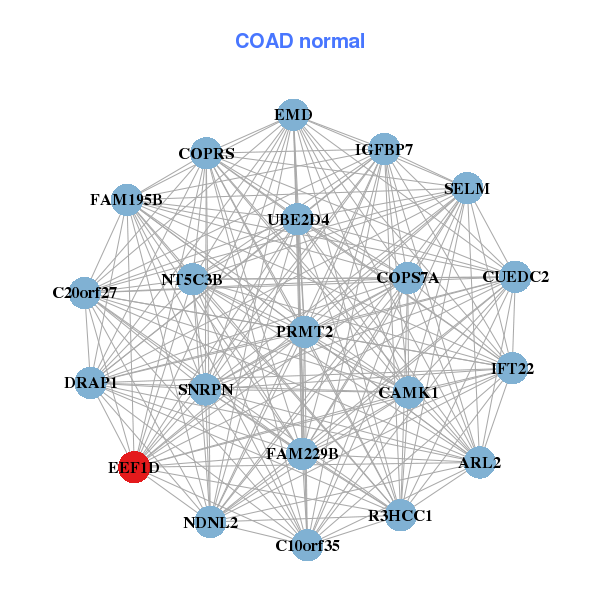
| * Co-Expression network figures were drawn using R package igraph. Only the top 20 genes with the highest correlations were shown. Red circle: input gene, orange circle: cell metabolism gene, sky circle: other gene |
: Open all plots for all cancer types
| Top |
: Open all interacting genes' information including KEGG pathway for all interacting genes from DAVID
| Top |
| Pharmacological Information for EEF1D |
| There's no related Drug. |
| Top |
| Cross referenced IDs for EEF1D |
| * We obtained these cross-references from Uniprot database. It covers 150 different DBs, 18 categories. http://www.uniprot.org/help/cross_references_section |
: Open all cross reference information
|
Copyright © 2016-Present - The Univsersity of Texas Health Science Center at Houston @ |