|
||||||||||||||||||||||||||||||||||||||||||||||||||||||||||||||||||||||||||||||||||||||||||||||||||||||||||||||||||||||||||||||||||||||||||||||||||||||||||||||||||||||||||||||||||||||||||||||||||||||||||||||||||||||||||||||||||||||||||||||||||||||||||||||||||||||||||||||||||||||||||||||||||||||||||||||||||||||||||
| |
| Phenotypic Information (metabolism pathway, cancer, disease, phenome) |
| |
| |
| Gene-Gene Network Information: Co-Expression Network, Interacting Genes & KEGG |
| |
|


| Gene Summary for EEF1G |
| Basic gene info. | Gene symbol | EEF1G |
| Gene name | eukaryotic translation elongation factor 1 gamma | |
| Synonyms | EF1G|GIG35 | |
| Cytomap | UCSC genome browser: 11q12.3 | |
| Genomic location | chr11 :62327072-62341460 | |
| Type of gene | protein-coding | |
| RefGenes | NM_001404.4, | |
| Ensembl id | ENSG00000254772 | |
| Description | EF-1-gammaPRO1608eEF-1B gammaelongation factor 1-gammapancreatic tumor-related proteintranslation elongation factor eEF-1 gamma chain | |
| Modification date | 20141207 | |
| dbXrefs | MIM : 130593 | |
| HGNC : HGNC | ||
| Ensembl : ENSG00000254772 | ||
| HPRD : 11745 | ||
| Vega : OTTHUMG00000167567 | ||
| Protein | UniProt: go to UniProt's Cross Reference DB Table | |
| Expression | CleanEX: HS_EEF1G | |
| BioGPS: 1937 | ||
| Gene Expression Atlas: ENSG00000254772 | ||
| The Human Protein Atlas: ENSG00000254772 | ||
| Pathway | NCI Pathway Interaction Database: EEF1G | |
| KEGG: EEF1G | ||
| REACTOME: EEF1G | ||
| ConsensusPathDB | ||
| Pathway Commons: EEF1G | ||
| Metabolism | MetaCyc: EEF1G | |
| HUMANCyc: EEF1G | ||
| Regulation | Ensembl's Regulation: ENSG00000254772 | |
| miRBase: chr11 :62,327,072-62,341,460 | ||
| TargetScan: NM_001404 | ||
| cisRED: ENSG00000254772 | ||
| Context | iHOP: EEF1G | |
| cancer metabolism search in PubMed: EEF1G | ||
| UCL Cancer Institute: EEF1G | ||
| Assigned class in ccmGDB | C | |
| Top |
| Phenotypic Information for EEF1G(metabolism pathway, cancer, disease, phenome) |
| Cancer | CGAP: EEF1G |
| Familial Cancer Database: EEF1G | |
| * This gene is included in those cancer gene databases. |
|
|
|
|
|
| . | ||||||||||||||||||||||||||||||||||||||||||||||||||||||||||||||||||||||||||||||||||||||||||||||||||||||||||||||||||||||||||||||||||||||||||||||||||||||||||||||||||||||||||||||||||||||||||||||||||||||||||||||||||||||||||||||||||||||||||||||||||||||||||||||||||||||||||||||||||||||||||||||||||||||||||||||||||||
Oncogene 1 | Significant driver gene in | |||||||||||||||||||||||||||||||||||||||||||||||||||||||||||||||||||||||||||||||||||||||||||||||||||||||||||||||||||||||||||||||||||||||||||||||||||||||||||||||||||||||||||||||||||||||||||||||||||||||||||||||||||||||||||||||||||||||||||||||||||||||||||||||||||||||||||||||||||||||||||||||||||||||||||||||||||||||||
| cf) number; DB name 1 Oncogene; http://nar.oxfordjournals.org/content/35/suppl_1/D721.long, 2 Tumor Suppressor gene; https://bioinfo.uth.edu/TSGene/, 3 Cancer Gene Census; http://www.nature.com/nrc/journal/v4/n3/abs/nrc1299.html, 4 CancerGenes; http://nar.oxfordjournals.org/content/35/suppl_1/D721.long, 5 Network of Cancer Gene; http://ncg.kcl.ac.uk/index.php, 1Therapeutic Vulnerabilities in Cancer; http://cbio.mskcc.org/cancergenomics/statius/ |
| REACTOME_METABOLISM_OF_PROTEINS | |
| OMIM | |
| Orphanet | |
| Disease | KEGG Disease: EEF1G |
| MedGen: EEF1G (Human Medical Genetics with Condition) | |
| ClinVar: EEF1G | |
| Phenotype | MGI: EEF1G (International Mouse Phenotyping Consortium) |
| PhenomicDB: EEF1G | |
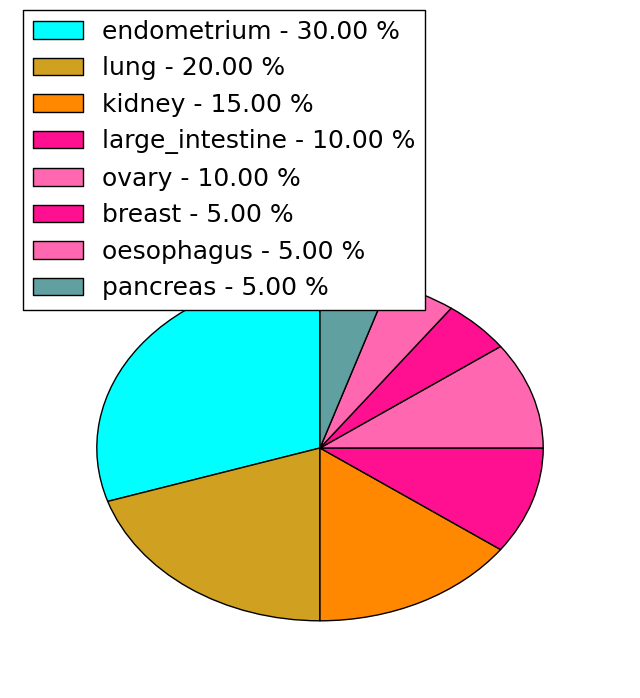
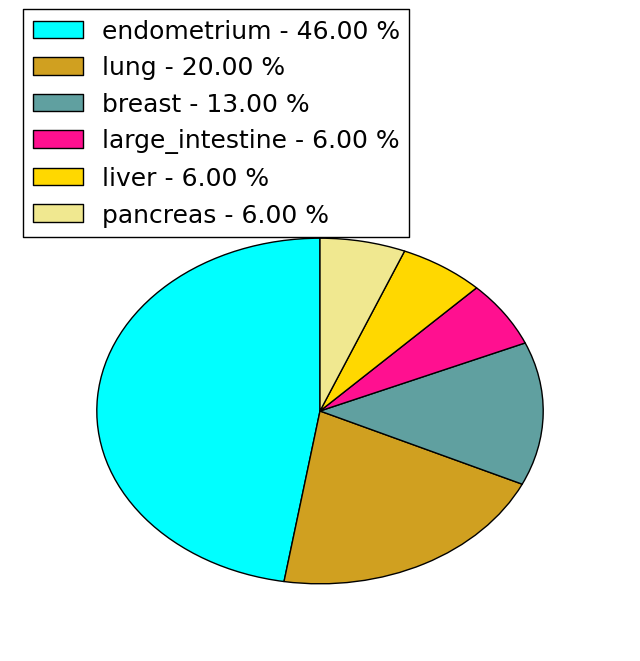
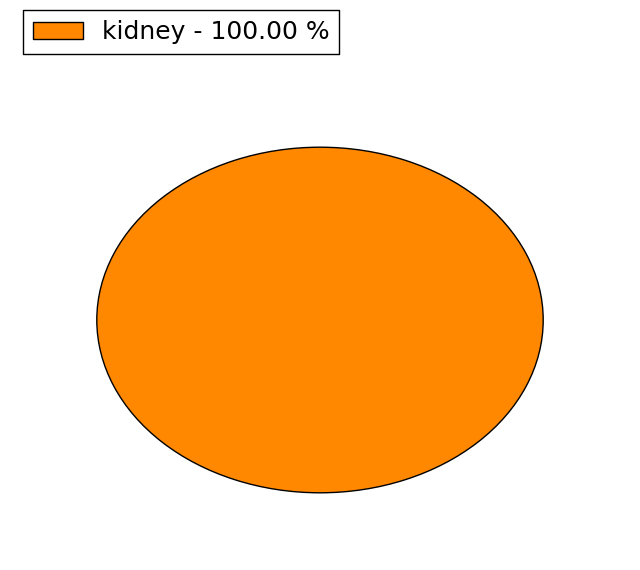
| Mutations for EEF1G |
| * Under tables are showing count per each tissue to give us broad intuition about tissue specific mutation patterns.You can go to the detailed page for each mutation database's web site. |
| - Statistics for Tissue and Mutation type | Top |
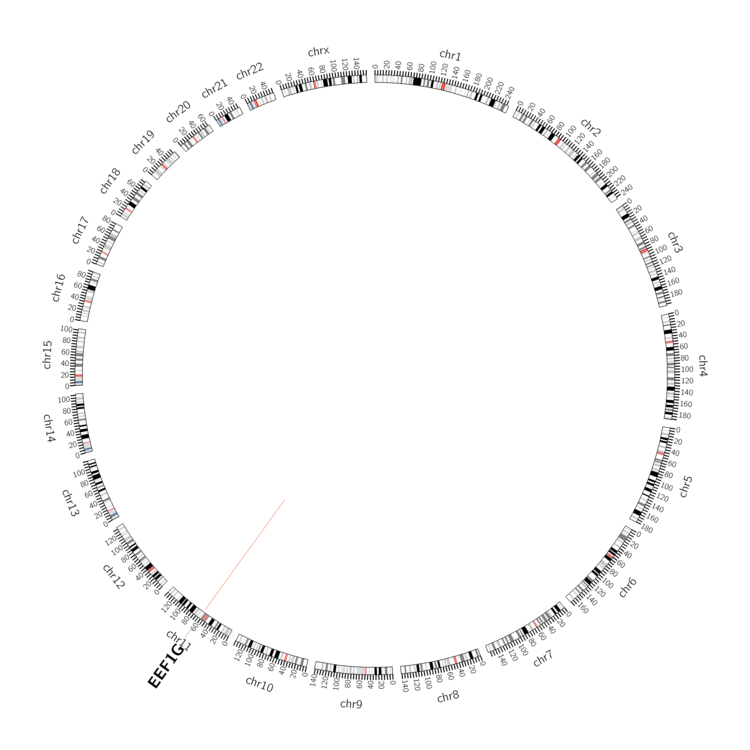 |
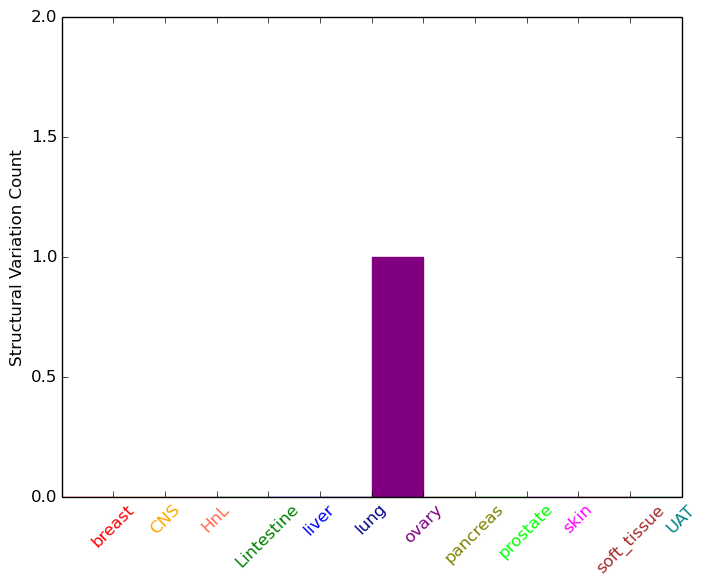
| - For Inter-chromosomal Variations |
| There's no inter-chromosomal structural variation. |
| - For Intra-chromosomal Variations |
| * Intra-chromosomal variantions includes 'intrachromosomal amplicon to amplicon', 'intrachromosomal amplicon to non-amplified dna', 'intrachromosomal deletion', 'intrachromosomal fold-back inversion', 'intrachromosomal inversion', 'intrachromosomal tandem duplication', 'Intrachromosomal unknown type', 'intrachromosomal with inverted orientation', 'intrachromosomal with non-inverted orientation'. |
 |
| Sample | Symbol_a | Chr_a | Start_a | End_a | Symbol_b | Chr_b | Start_b | End_b |
| ovary | EEF1G | chr11 | 62329116 | 62329136 | EEF1G | chr11 | 62329279 | 62329299 |
| cf) Tissue number; Tissue name (1;Breast, 2;Central_nervous_system, 3;Haematopoietic_and_lymphoid_tissue, 4;Large_intestine, 5;Liver, 6;Lung, 7;Ovary, 8;Pancreas, 9;Prostate, 10;Skin, 11;Soft_tissue, 12;Upper_aerodigestive_tract) |
| * From mRNA Sanger sequences, Chitars2.0 arranged chimeric transcripts. This table shows EEF1G related fusion information. |
| ID | Head Gene | Tail Gene | Accession | Gene_a | qStart_a | qEnd_a | Chromosome_a | tStart_a | tEnd_a | Gene_a | qStart_a | qEnd_a | Chromosome_a | tStart_a | tEnd_a |
| BI046948 | EEF1G | 13 | 126 | 11 | 62334929 | 62338479 | EEF1G | 121 | 405 | 11 | 62334964 | 62339115 | |
| BP392614 | EEF1G | 1 | 190 | 11 | 62334337 | 62334914 | TOX2 | 191 | 501 | 20 | 42697942 | 42698252 | |
| Top |
| Mutation type/ Tissue ID | brca | cns | cerv | endome | haematopo | kidn | Lintest | liver | lung | ns | ovary | pancre | prost | skin | stoma | thyro | urina | |||
| Total # sample | 1 | |||||||||||||||||||
| GAIN (# sample) | 1 | |||||||||||||||||||
| LOSS (# sample) |
| cf) Tissue ID; Tissue type (1; Breast, 2; Central_nervous_system, 3; Cervix, 4; Endometrium, 5; Haematopoietic_and_lymphoid_tissue, 6; Kidney, 7; Large_intestine, 8; Liver, 9; Lung, 10; NS, 11; Ovary, 12; Pancreas, 13; Prostate, 14; Skin, 15; Stomach, 16; Thyroid, 17; Urinary_tract) |
| Top |
|
 |
| Top |
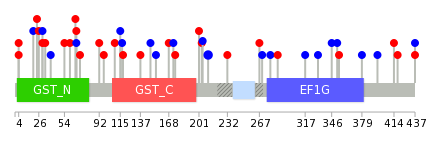
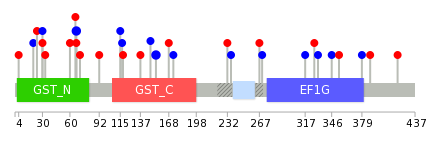
| Stat. for Non-Synonymous SNVs (# total SNVs=20) | (# total SNVs=15) |
 |  |
(# total SNVs=1) | (# total SNVs=0) |
 |
| Top |
| * When you move the cursor on each content, you can see more deailed mutation information on the Tooltip. Those are primary_site,primary_histology,mutation(aa),pubmedID. |
| GRCh37 position | Mutation(aa) | Unique sampleID count |
| chr11:62339344-62339344 | p.F67L | 2 |
| chr11:62327791-62327791 | p.E331E | 1 |
| chr11:62340139-62340139 | p.R30C | 1 |
| chr11:62335000-62335000 | p.V175I | 1 |
| chr11:62327154-62327154 | p.K437K | 1 |
| chr11:62339101-62339101 | p.Q97K | 1 |
| chr11:62327833-62327833 | p.D317D | 1 |
| chr11:62340145-62340145 | p.Q28* | 1 |
| chr11:62338440-62338440 | p.K173K | 1 |
| chr11:62327156-62327156 | p.K437E | 1 |
| Top |
|
 |
| Point Mutation/ Tissue ID | 1 | 2 | 3 | 4 | 5 | 6 | 7 | 8 | 9 | 10 | 11 | 12 | 13 | 14 | 15 | 16 | 17 | 18 | 19 | 20 |
| # sample | 2 | 2 | 1 | 1 | 1 | 2 | 3 | 8 | 11 | |||||||||||
| # mutation | 2 | 1 | 1 | 1 | 2 | 2 | 3 | 7 | 13 | |||||||||||
| nonsynonymous SNV | 2 | 1 | 1 | 1 | 1 | 2 | 1 | 3 | 6 | |||||||||||
| synonymous SNV | 1 | 1 | 2 | 4 | 7 |
| cf) Tissue ID; Tissue type (1; BLCA[Bladder Urothelial Carcinoma], 2; BRCA[Breast invasive carcinoma], 3; CESC[Cervical squamous cell carcinoma and endocervical adenocarcinoma], 4; COAD[Colon adenocarcinoma], 5; GBM[Glioblastoma multiforme], 6; Glioma Low Grade, 7; HNSC[Head and Neck squamous cell carcinoma], 8; KICH[Kidney Chromophobe], 9; KIRC[Kidney renal clear cell carcinoma], 10; KIRP[Kidney renal papillary cell carcinoma], 11; LAML[Acute Myeloid Leukemia], 12; LUAD[Lung adenocarcinoma], 13; LUSC[Lung squamous cell carcinoma], 14; OV[Ovarian serous cystadenocarcinoma ], 15; PAAD[Pancreatic adenocarcinoma], 16; PRAD[Prostate adenocarcinoma], 17; SKCM[Skin Cutaneous Melanoma], 18:STAD[Stomach adenocarcinoma], 19:THCA[Thyroid carcinoma], 20:UCEC[Uterine Corpus Endometrial Carcinoma]) |
| Top |
| * We represented just top 10 SNVs. When you move the cursor on each content, you can see more deailed mutation information on the Tooltip. Those are primary_site, primary_histology, mutation(aa), pubmedID. |
| Genomic Position | Mutation(aa) | Unique sampleID count |
| chr11:62339344 | p.F67F | 3 |
| chr11:62338497 | p.G154G | 2 |
| chr11:62334427 | p.T148T | 1 |
| chr11:62339332 | p.S418F | 1 |
| chr11:62327212 | p.R137Q | 1 |
| chr11:62334440 | p.P388Q | 1 |
| chr11:62327302 | p.L118V | 1 |
| chr11:62338440 | p.G379G | 1 |
| chr11:62339348 | p.T117T | 1 |
| chr11:62327559 | p.K354N | 1 |
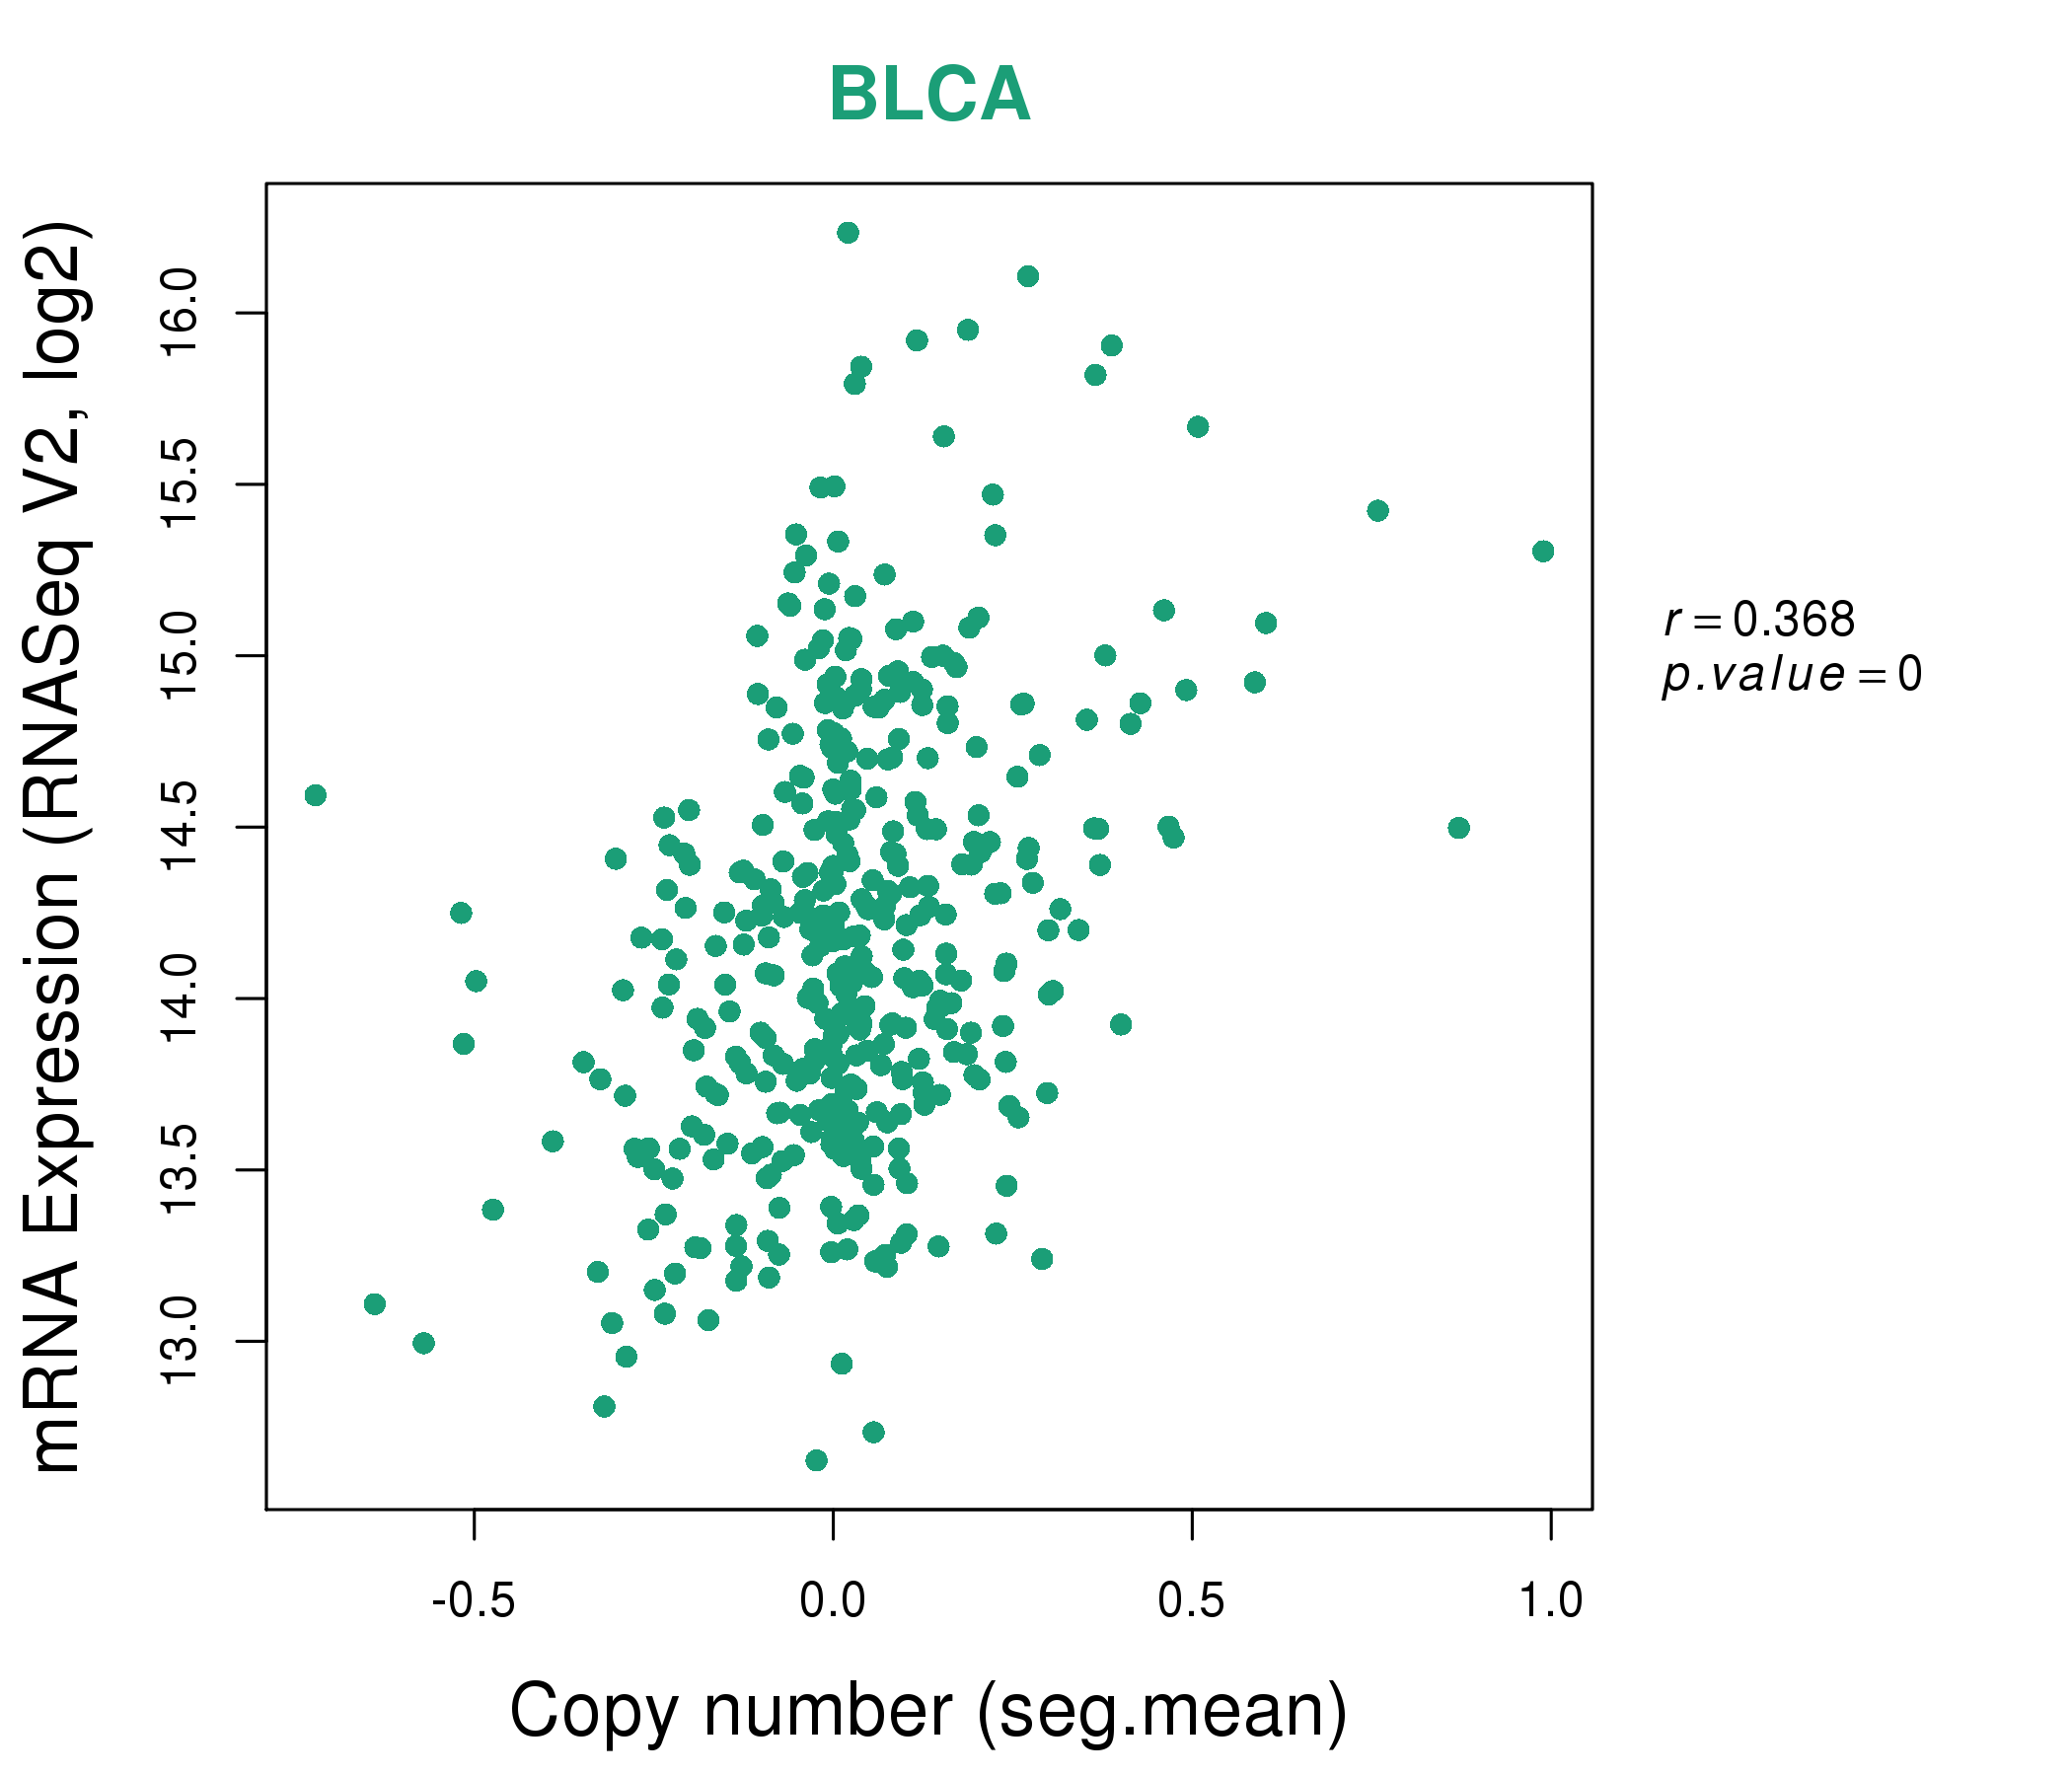
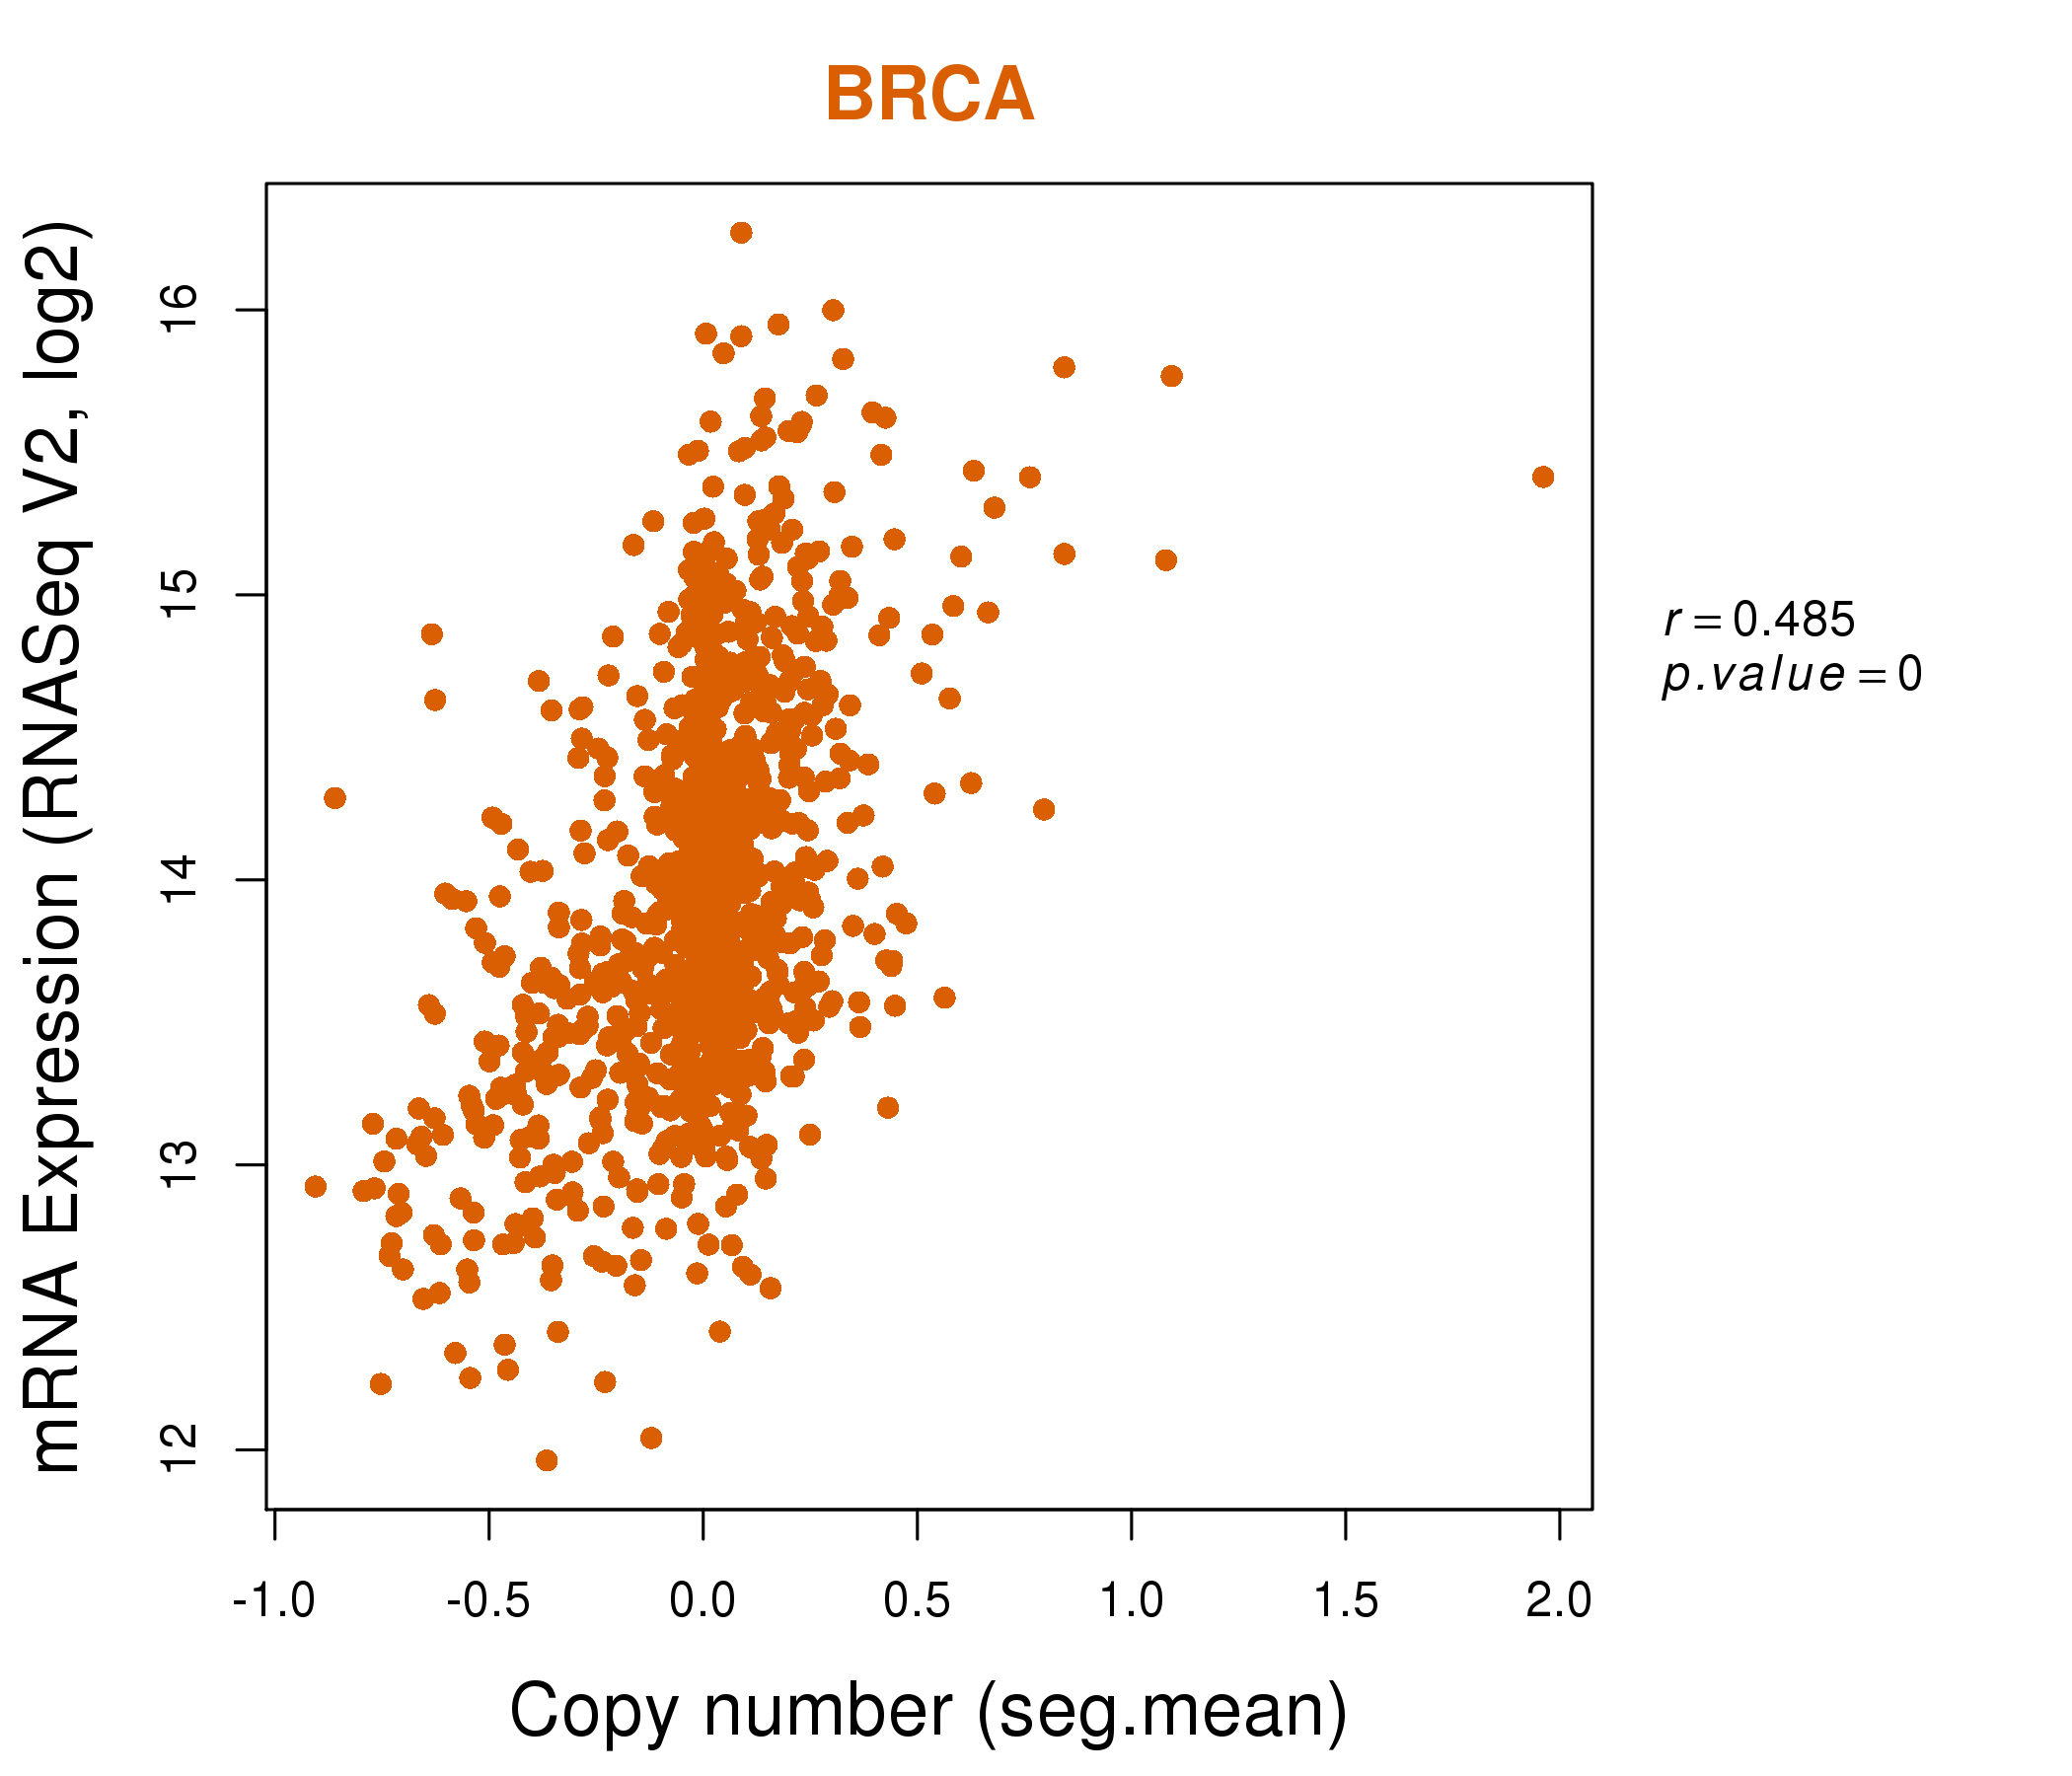
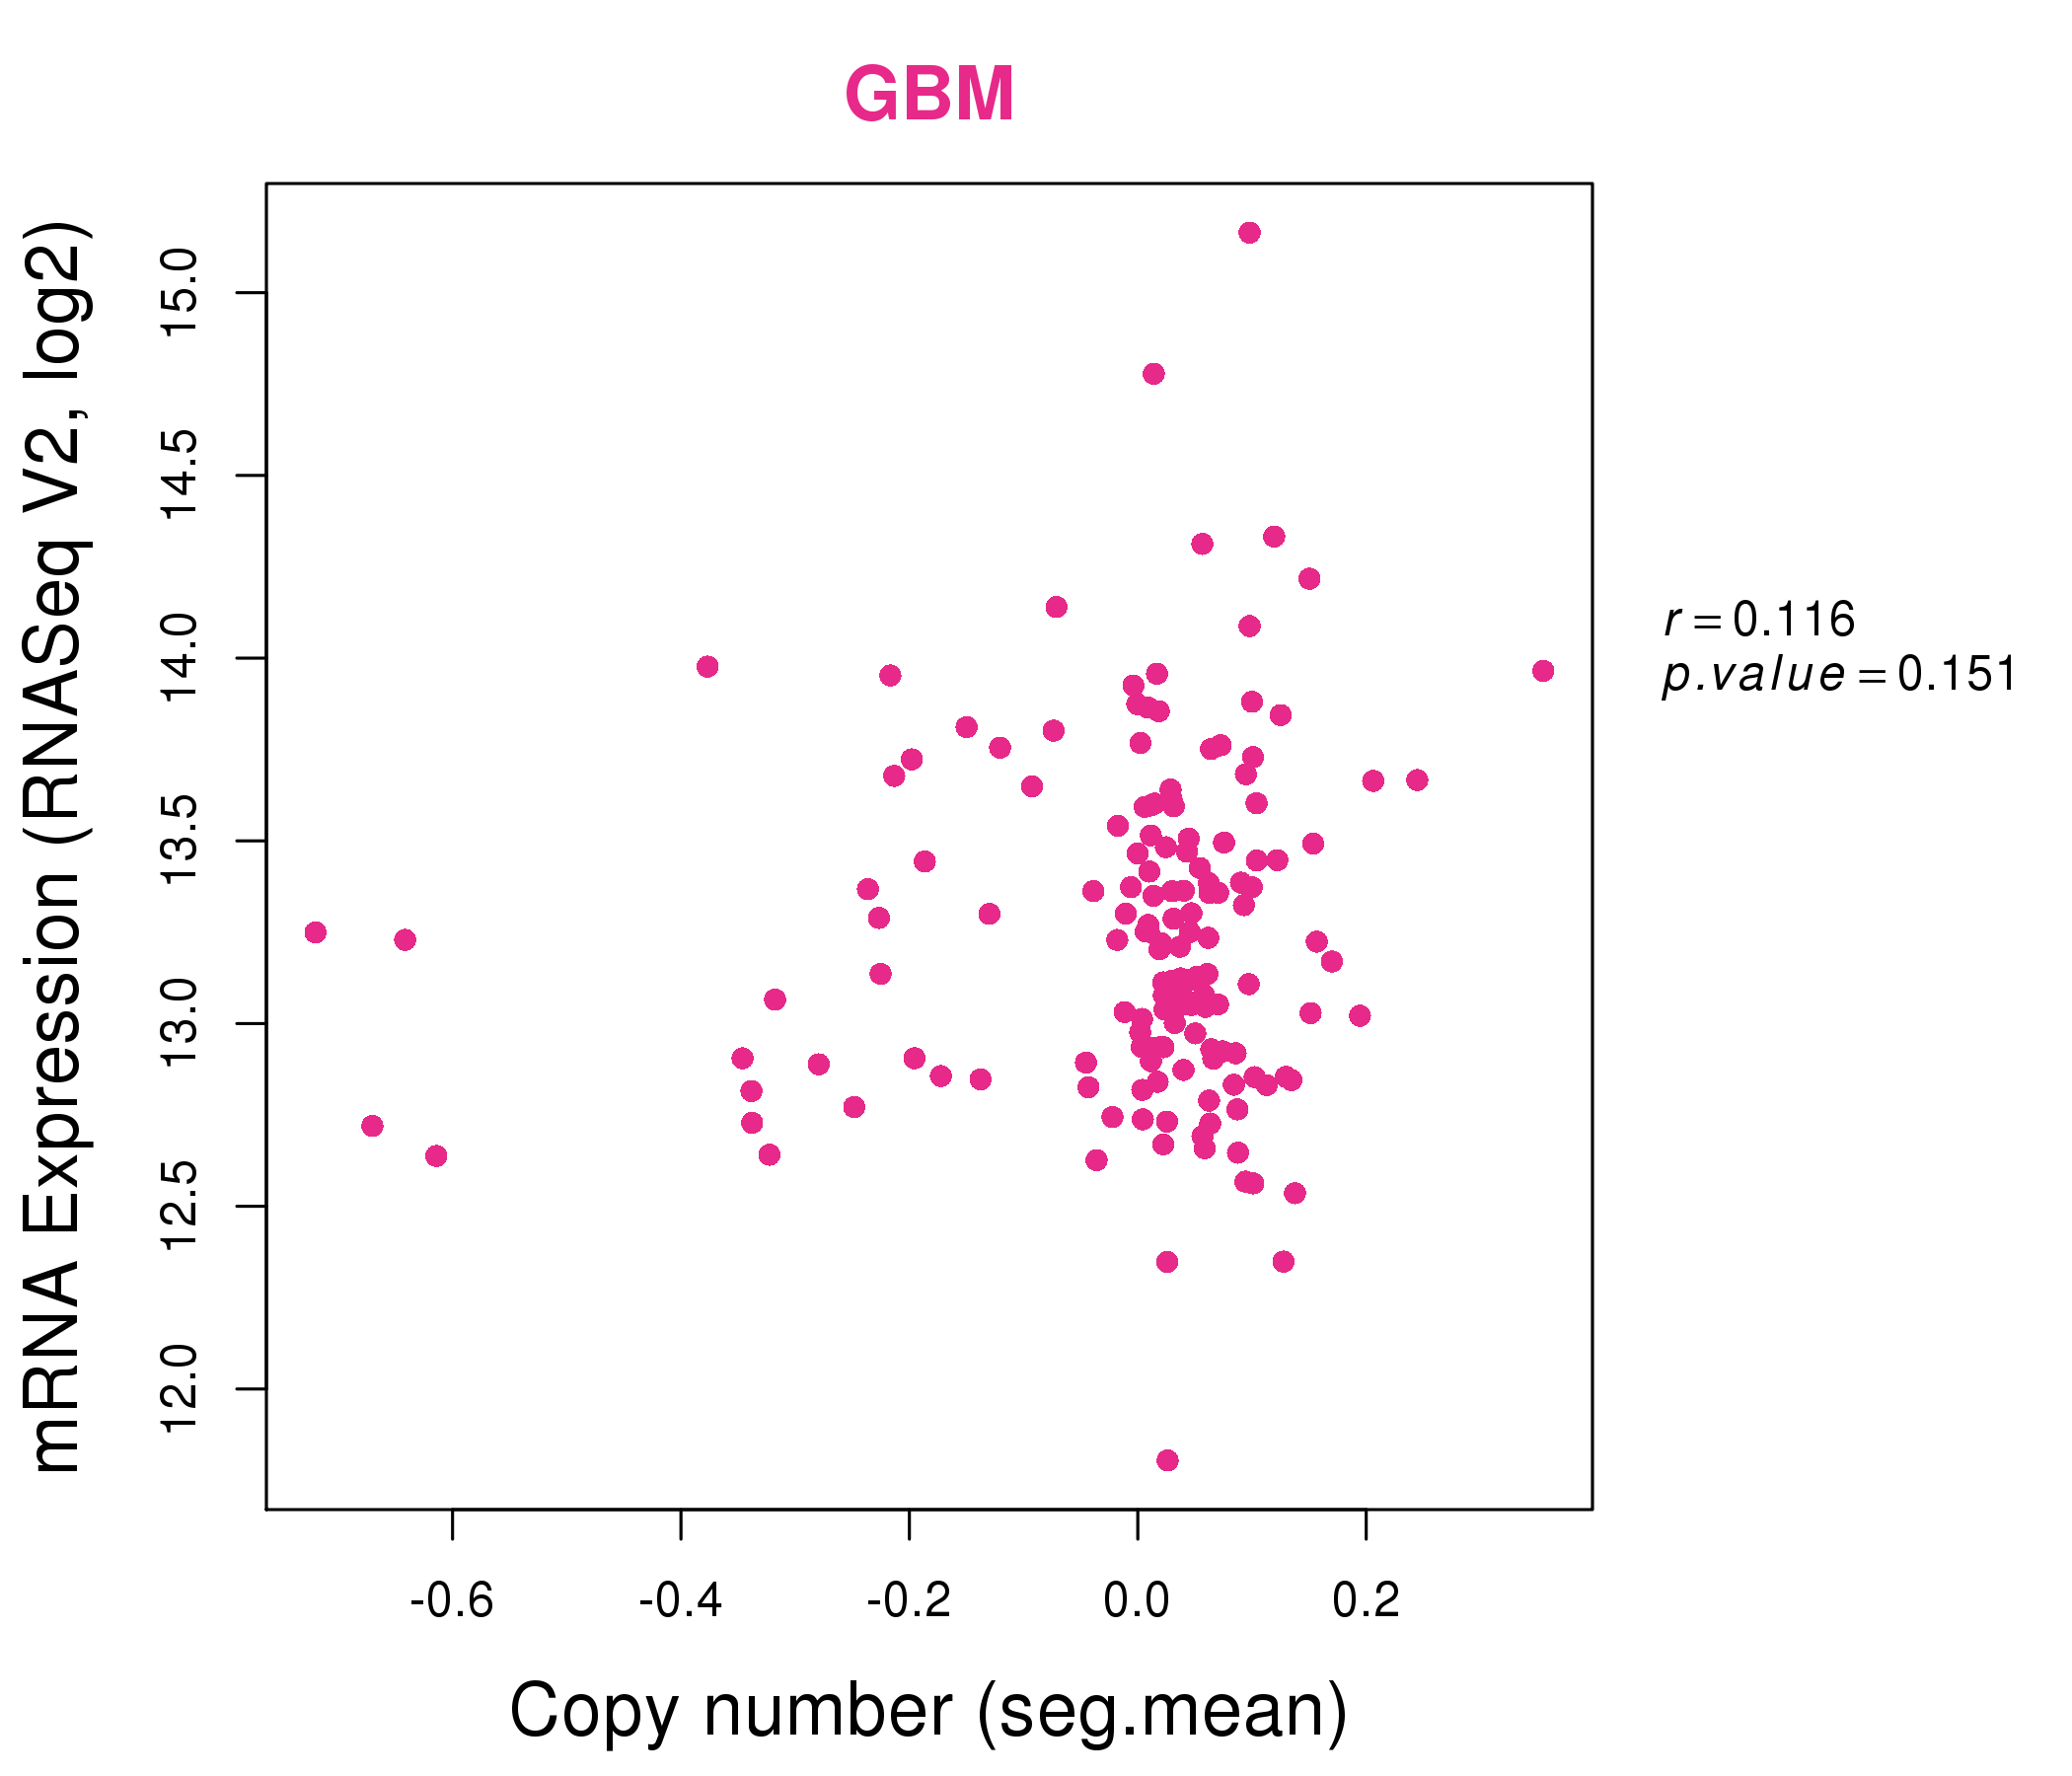
| * Copy number data were extracted from TCGA using R package TCGA-Assembler. The URLs of all public data files on TCGA DCC data server were gathered on Jan-05-2015. Function ProcessCNAData in TCGA-Assembler package was used to obtain gene-level copy number value which is calculated as the average copy number of the genomic region of a gene. |
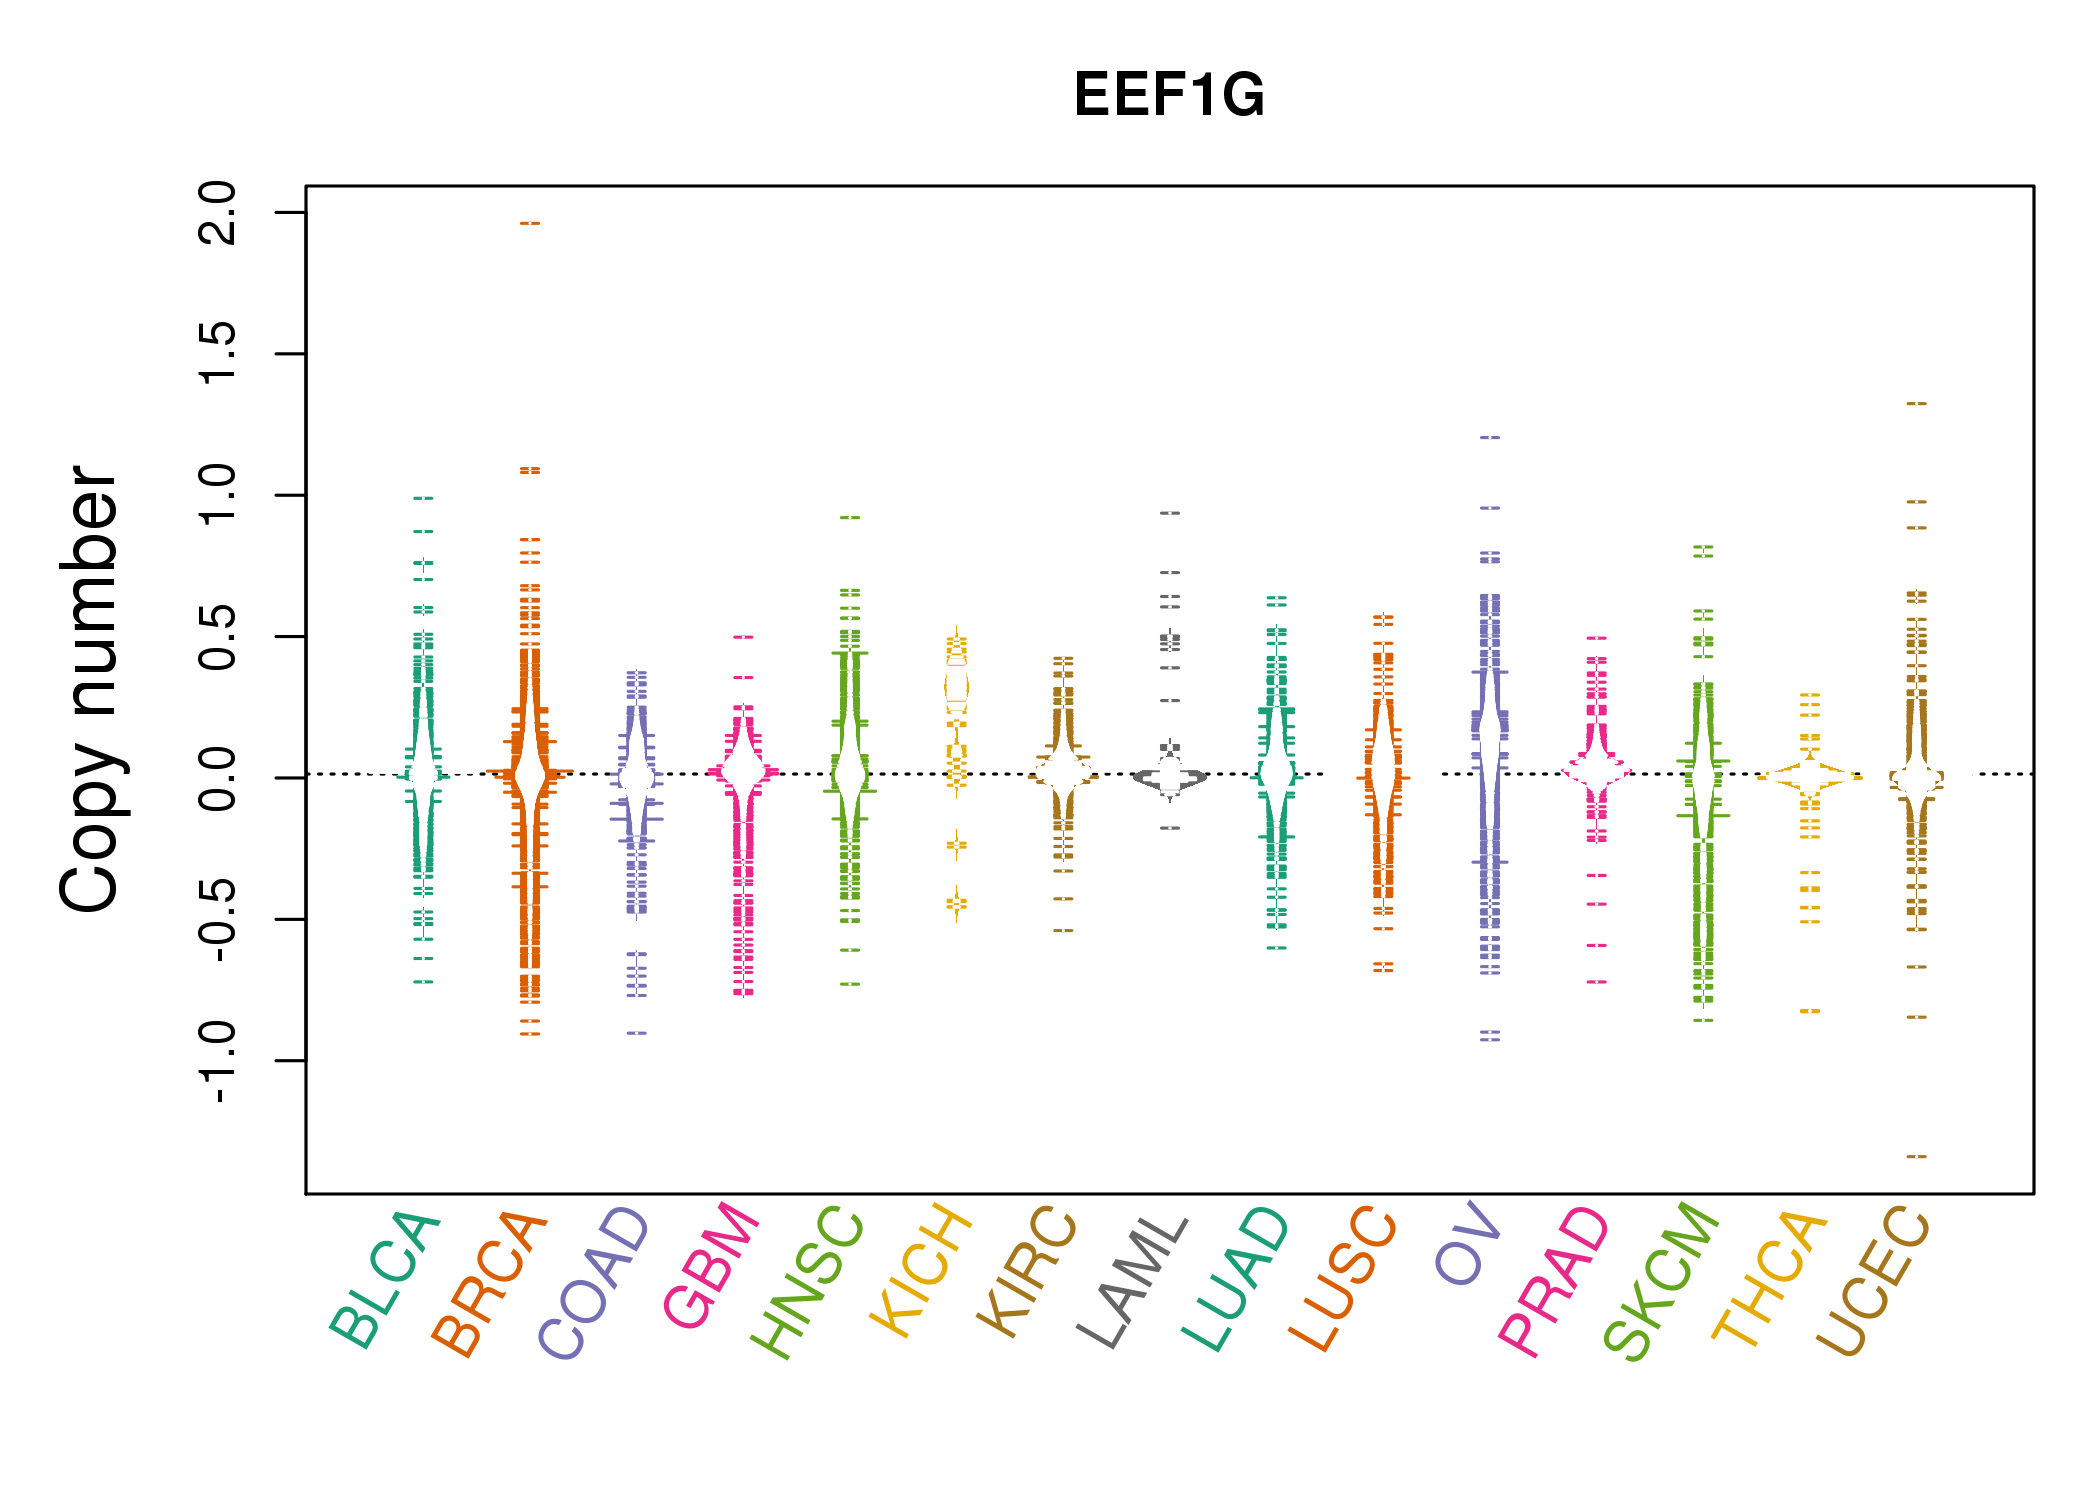 |
| cf) Tissue ID[Tissue type]: BLCA[Bladder Urothelial Carcinoma], BRCA[Breast invasive carcinoma], CESC[Cervical squamous cell carcinoma and endocervical adenocarcinoma], COAD[Colon adenocarcinoma], GBM[Glioblastoma multiforme], Glioma Low Grade, HNSC[Head and Neck squamous cell carcinoma], KICH[Kidney Chromophobe], KIRC[Kidney renal clear cell carcinoma], KIRP[Kidney renal papillary cell carcinoma], LAML[Acute Myeloid Leukemia], LUAD[Lung adenocarcinoma], LUSC[Lung squamous cell carcinoma], OV[Ovarian serous cystadenocarcinoma ], PAAD[Pancreatic adenocarcinoma], PRAD[Prostate adenocarcinoma], SKCM[Skin Cutaneous Melanoma], STAD[Stomach adenocarcinoma], THCA[Thyroid carcinoma], UCEC[Uterine Corpus Endometrial Carcinoma] |
| Top |
| Gene Expression for EEF1G |
| * CCLE gene expression data were extracted from CCLE_Expression_Entrez_2012-10-18.res: Gene-centric RMA-normalized mRNA expression data. |
 |
| * Normalized gene expression data of RNASeqV2 was extracted from TCGA using R package TCGA-Assembler. The URLs of all public data files on TCGA DCC data server were gathered at Jan-05-2015. Only eight cancer types have enough normal control samples for differential expression analysis. (t test, adjusted p<0.05 (using Benjamini-Hochberg FDR)) |
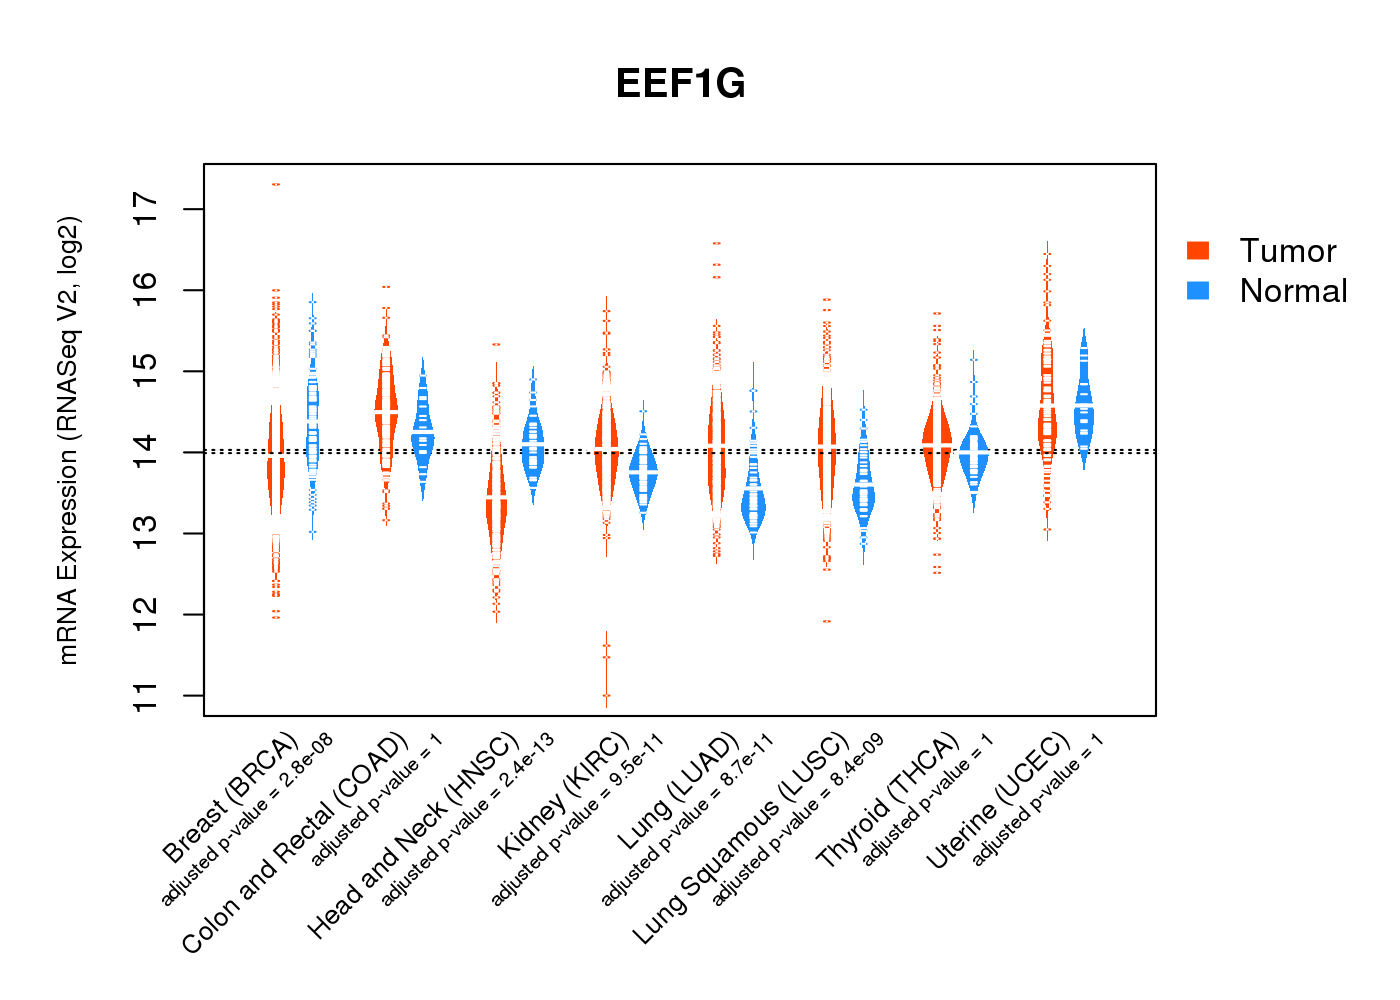 |
| Top |
| * This plots show the correlation between CNV and gene expression. |
: Open all plots for all cancer types
 |
|
 |
|
| Top |
| Gene-Gene Network Information |
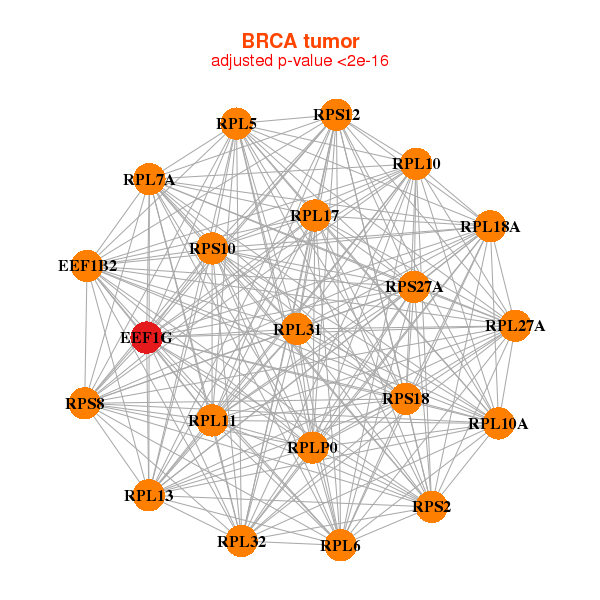
| * Co-Expression network figures were drawn using R package igraph. Only the top 20 genes with the highest correlations were shown. Red circle: input gene, orange circle: cell metabolism gene, sky circle: other gene |
: Open all plots for all cancer types
 |
|
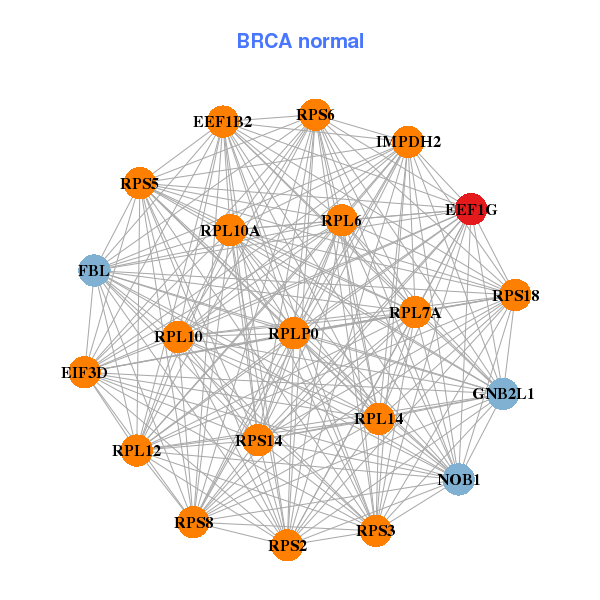
| EEF1B2,EEF1G,RPL10,RPL10A,RPL11,RPL13,RPL17, RPL18A,RPL27A,RPL31,RPL32,RPL5,RPL6,RPL7A, RPLP0,RPS10,RPS12,RPS18,RPS2,RPS27A,RPS8 | EEF1B2,EEF1G,EIF3D,FBL,GNB2L1,IMPDH2,NOB1, RPL10,RPL10A,RPL12,RPL14,RPL6,RPL7A,RPLP0, RPS14,RPS18,RPS2,RPS3,RPS5,RPS6,RPS8 |
 |
|
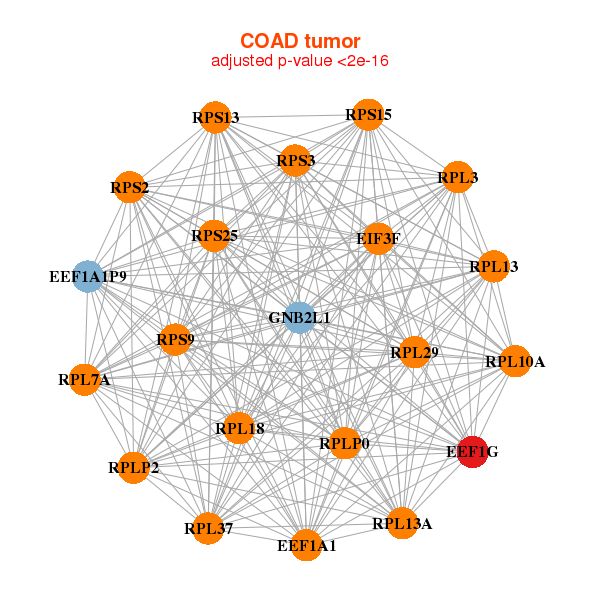
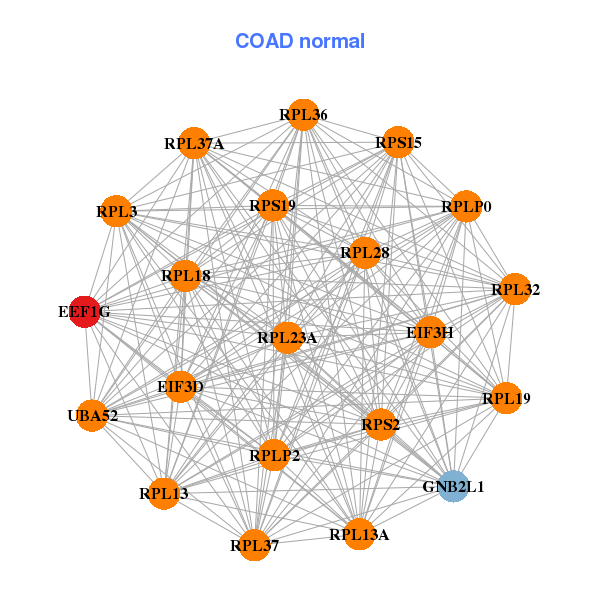
| EEF1A1,EEF1A1P9,EEF1G,EIF3F,GNB2L1,RPL10A,RPL13, RPL13A,RPL18,RPL29,RPL3,RPL37,RPL7A,RPLP0, RPLP2,RPS13,RPS15,RPS25,RPS2,RPS3,RPS9 | EEF1G,EIF3D,EIF3H,GNB2L1,RPL13,RPL13A,RPL18, RPL19,RPL23A,RPL28,RPL32,RPL3,RPL36,RPL37, RPL37A,RPLP0,RPLP2,RPS15,RPS19,RPS2,UBA52 |
| * Co-Expression network figures were drawn using R package igraph. Only the top 20 genes with the highest correlations were shown. Red circle: input gene, orange circle: cell metabolism gene, sky circle: other gene |
: Open all plots for all cancer types
| Top |
: Open all interacting genes' information including KEGG pathway for all interacting genes from DAVID
| Top |
| Pharmacological Information for EEF1G |
| There's no related Drug. |
| Top |
| Cross referenced IDs for EEF1G |
| * We obtained these cross-references from Uniprot database. It covers 150 different DBs, 18 categories. http://www.uniprot.org/help/cross_references_section |
: Open all cross reference information
|
Copyright © 2016-Present - The Univsersity of Texas Health Science Center at Houston @ |