|
|||||||||||||||||||||||||||||||||||||||||||||||||||||||||||||||||||||||||||||||||||||||||||||||||||||||||||||||||||||||||||||||||||||||||||||||||||||||||||||||||||||||||||||||||||||||||||||||||||||||||||||||||||||||||||||||||||||||||||||||||||||||||||||||||||||||||||||||||||||||||||||||||||||||||||||||||||||||||||||||||||||||||||||
| |
| Phenotypic Information (metabolism pathway, cancer, disease, phenome) |
| |
| |
| Gene-Gene Network Information: Co-Expression Network, Interacting Genes & KEGG |
| |
|


| Gene Summary for EHHADH |
| Basic gene info. | Gene symbol | EHHADH |
| Gene name | enoyl-CoA, hydratase/3-hydroxyacyl CoA dehydrogenase | |
| Synonyms | ECHD|FRTS3|L-PBE|LBFP|LBP|PBFE | |
| Cytomap | UCSC genome browser: 3q26.3-q28 | |
| Genomic location | chr3 :184908411-184971886 | |
| Type of gene | protein-coding | |
| RefGenes | NM_001166415.1, NM_001966.3, | |
| Ensembl id | ENSG00000113790 | |
| Description | 3,2-trans-enoyl-CoA isomeraseL-3-hydroxyacyl-CoA dehydrogenaseL-bifunctional protein, peroxisomalPBEenoyl-Coenzyme A, hydratase/3-hydroxyacyl Coenzyme A dehydrogenaseperoxisomal bifunctional enzymeperoxisomal enoyl-CoA hydratase | |
| Modification date | 20141207 | |
| dbXrefs | MIM : 607037 | |
| HGNC : HGNC | ||
| Ensembl : ENSG00000113790 | ||
| HPRD : 06125 | ||
| Vega : OTTHUMG00000156698 | ||
| Protein | UniProt: go to UniProt's Cross Reference DB Table | |
| Expression | CleanEX: HS_EHHADH | |
| BioGPS: 1962 | ||
| Gene Expression Atlas: ENSG00000113790 | ||
| The Human Protein Atlas: ENSG00000113790 | ||
| Pathway | NCI Pathway Interaction Database: EHHADH | |
| KEGG: EHHADH | ||
| REACTOME: EHHADH | ||
| ConsensusPathDB | ||
| Pathway Commons: EHHADH | ||
| Metabolism | MetaCyc: EHHADH | |
| HUMANCyc: EHHADH | ||
| Regulation | Ensembl's Regulation: ENSG00000113790 | |
| miRBase: chr3 :184,908,411-184,971,886 | ||
| TargetScan: NM_001166415 | ||
| cisRED: ENSG00000113790 | ||
| Context | iHOP: EHHADH | |
| cancer metabolism search in PubMed: EHHADH | ||
| UCL Cancer Institute: EHHADH | ||
| Assigned class in ccmGDB | C | |
| Top |
| Phenotypic Information for EHHADH(metabolism pathway, cancer, disease, phenome) |
| Cancer | CGAP: EHHADH |
| Familial Cancer Database: EHHADH | |
| * This gene is included in those cancer gene databases. |
|
|
|
|
|
|
| |||||||||||||||||||||||||||||||||||||||||||||||||||||||||||||||||||||||||||||||||||||||||||||||||||||||||||||||||||||||||||||||||||||||||||||||||||||||||||||||||||||||||||||||||||||||||||||||||||||||||||||||||||||||||||||||||||||||||||||||||||||||||||||||||||||||||||||||||||||||||||||||||||||||||||||||||||||||||||||||||||||||
Oncogene 1 | Significant driver gene in | ||||||||||||||||||||||||||||||||||||||||||||||||||||||||||||||||||||||||||||||||||||||||||||||||||||||||||||||||||||||||||||||||||||||||||||||||||||||||||||||||||||||||||||||||||||||||||||||||||||||||||||||||||||||||||||||||||||||||||||||||||||||||||||||||||||||||||||||||||||||||||||||||||||||||||||||||||||||||||||||||||||||||||||
| cf) number; DB name 1 Oncogene; http://nar.oxfordjournals.org/content/35/suppl_1/D721.long, 2 Tumor Suppressor gene; https://bioinfo.uth.edu/TSGene/, 3 Cancer Gene Census; http://www.nature.com/nrc/journal/v4/n3/abs/nrc1299.html, 4 CancerGenes; http://nar.oxfordjournals.org/content/35/suppl_1/D721.long, 5 Network of Cancer Gene; http://ncg.kcl.ac.uk/index.php, 1Therapeutic Vulnerabilities in Cancer; http://cbio.mskcc.org/cancergenomics/statius/ |
| KEGG_FATTY_ACID_METABOLISM KEGG_TRYPTOPHAN_METABOLISM KEGG_BETA_ALANINE_METABOLISM KEGG_PROPANOATE_METABOLISM KEGG_BUTANOATE_METABOLISM | |
| OMIM | |
| Orphanet | |
| Disease | KEGG Disease: EHHADH |
| MedGen: EHHADH (Human Medical Genetics with Condition) | |
| ClinVar: EHHADH | |
| Phenotype | MGI: EHHADH (International Mouse Phenotyping Consortium) |
| PhenomicDB: EHHADH | |
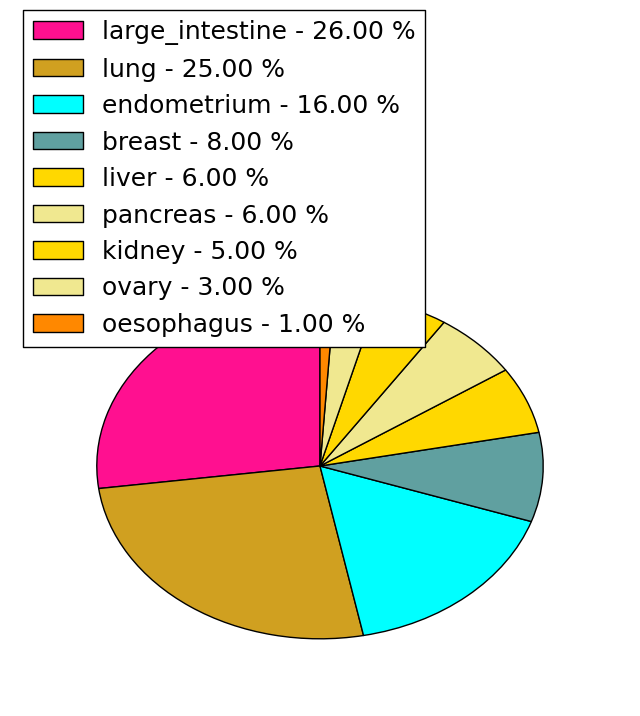
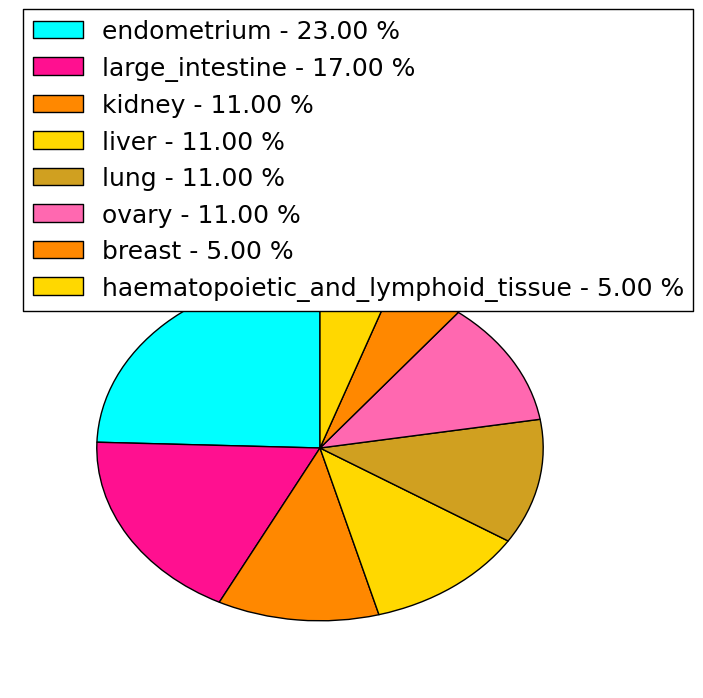
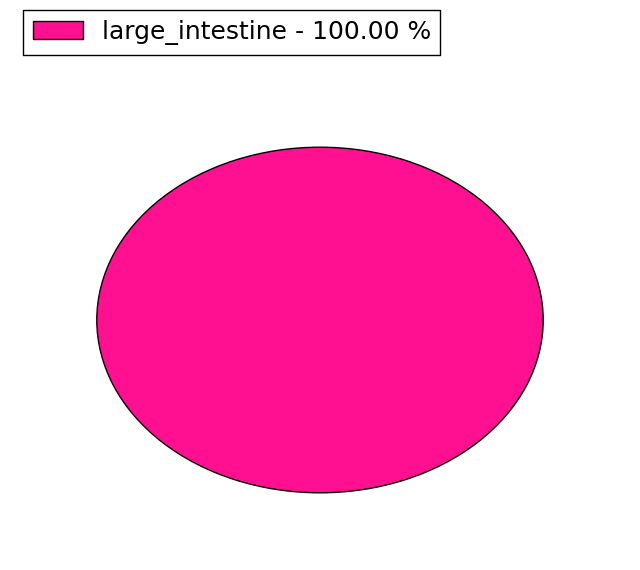
| Mutations for EHHADH |
| * Under tables are showing count per each tissue to give us broad intuition about tissue specific mutation patterns.You can go to the detailed page for each mutation database's web site. |
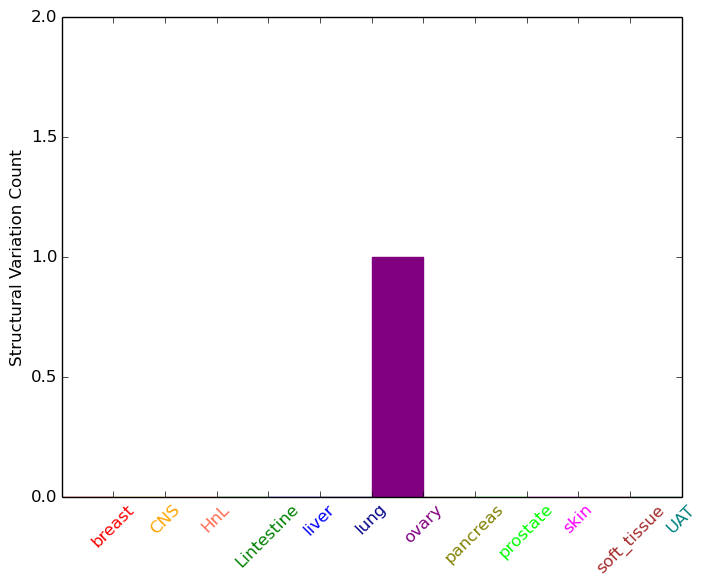
| - Statistics for Tissue and Mutation type | Top |
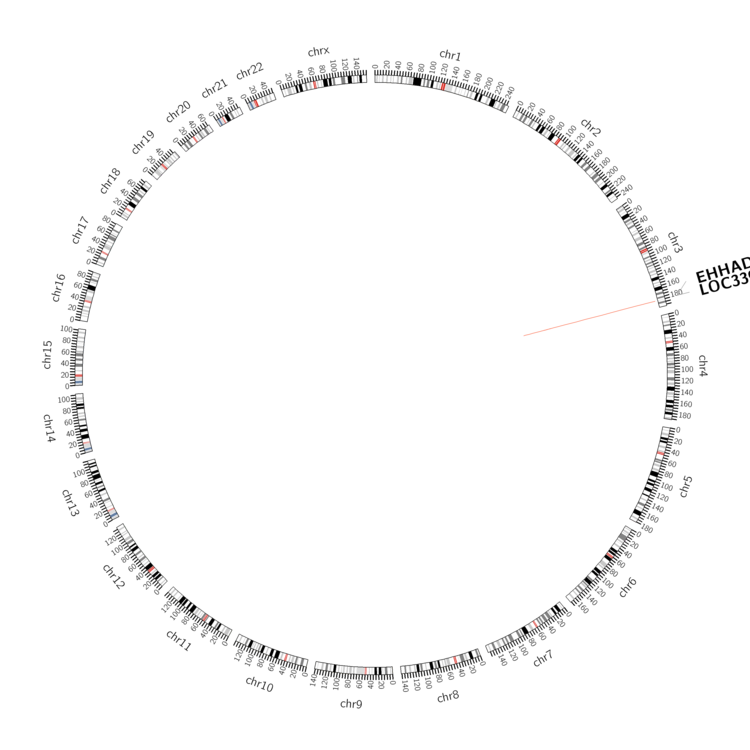 |
| - For Inter-chromosomal Variations |
| There's no inter-chromosomal structural variation. |
| - For Intra-chromosomal Variations |
| * Intra-chromosomal variantions includes 'intrachromosomal amplicon to amplicon', 'intrachromosomal amplicon to non-amplified dna', 'intrachromosomal deletion', 'intrachromosomal fold-back inversion', 'intrachromosomal inversion', 'intrachromosomal tandem duplication', 'Intrachromosomal unknown type', 'intrachromosomal with inverted orientation', 'intrachromosomal with non-inverted orientation'. |
 |
| Sample | Symbol_a | Chr_a | Start_a | End_a | Symbol_b | Chr_b | Start_b | End_b |
| ovary | EHHADH | chr3 | 184938150 | 184938170 | LOC339926 | chr3 | 184901294 | 184901314 |
| cf) Tissue number; Tissue name (1;Breast, 2;Central_nervous_system, 3;Haematopoietic_and_lymphoid_tissue, 4;Large_intestine, 5;Liver, 6;Lung, 7;Ovary, 8;Pancreas, 9;Prostate, 10;Skin, 11;Soft_tissue, 12;Upper_aerodigestive_tract) |
| * From mRNA Sanger sequences, Chitars2.0 arranged chimeric transcripts. This table shows EHHADH related fusion information. |
| ID | Head Gene | Tail Gene | Accession | Gene_a | qStart_a | qEnd_a | Chromosome_a | tStart_a | tEnd_a | Gene_a | qStart_a | qEnd_a | Chromosome_a | tStart_a | tEnd_a |
| Top |
| Mutation type/ Tissue ID | brca | cns | cerv | endome | haematopo | kidn | Lintest | liver | lung | ns | ovary | pancre | prost | skin | stoma | thyro | urina | |||
| Total # sample | 2 | 1 | ||||||||||||||||||
| GAIN (# sample) | 1 | 1 | ||||||||||||||||||
| LOSS (# sample) | 1 |
| cf) Tissue ID; Tissue type (1; Breast, 2; Central_nervous_system, 3; Cervix, 4; Endometrium, 5; Haematopoietic_and_lymphoid_tissue, 6; Kidney, 7; Large_intestine, 8; Liver, 9; Lung, 10; NS, 11; Ovary, 12; Pancreas, 13; Prostate, 14; Skin, 15; Stomach, 16; Thyroid, 17; Urinary_tract) |
| Top |
|
 |
| Top |
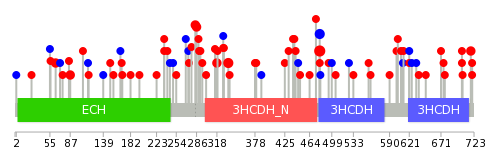
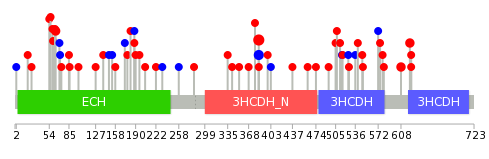
| Stat. for Non-Synonymous SNVs (# total SNVs=60) | (# total SNVs=17) |
 |  |
(# total SNVs=2) | (# total SNVs=0) |
 |
| Top |
| * When you move the cursor on each content, you can see more deailed mutation information on the Tooltip. Those are primary_site,primary_histology,mutation(aa),pubmedID. |
| GRCh37 position | Mutation(aa) | Unique sampleID count |
| chr3:184910747-184910747 | p.V480A | 5 |
| chr3:184911179-184911179 | p.A336V | 3 |
| chr3:184910746-184910746 | p.V480V | 3 |
| chr3:184953239-184953239 | p.R64C | 2 |
| chr3:184966195-184966195 | p.? | 2 |
| chr3:184922258-184922258 | p.G286R | 2 |
| chr3:184922264-184922264 | p.P284S | 2 |
| chr3:184966307-184966307 | p.? | 2 |
| chr3:184911232-184911232 | p.R318S | 2 |
| chr3:184953170-184953170 | p.E87K | 2 |
| Top |
|
 |
| Point Mutation/ Tissue ID | 1 | 2 | 3 | 4 | 5 | 6 | 7 | 8 | 9 | 10 | 11 | 12 | 13 | 14 | 15 | 16 | 17 | 18 | 19 | 20 |
| # sample | 1 | 4 | 13 | 1 | 2 | 1 | 1 | 10 | 4 | 3 | 2 | 9 | 6 | 12 | ||||||
| # mutation | 1 | 4 | 8 | 1 | 2 | 1 | 1 | 11 | 4 | 3 | 2 | 8 | 7 | 13 | ||||||
| nonsynonymous SNV | 1 | 3 | 7 | 1 | 2 | 11 | 1 | 2 | 2 | 7 | 5 | 9 | ||||||||
| synonymous SNV | 1 | 1 | 1 | 1 | 3 | 1 | 1 | 2 | 4 |
| cf) Tissue ID; Tissue type (1; BLCA[Bladder Urothelial Carcinoma], 2; BRCA[Breast invasive carcinoma], 3; CESC[Cervical squamous cell carcinoma and endocervical adenocarcinoma], 4; COAD[Colon adenocarcinoma], 5; GBM[Glioblastoma multiforme], 6; Glioma Low Grade, 7; HNSC[Head and Neck squamous cell carcinoma], 8; KICH[Kidney Chromophobe], 9; KIRC[Kidney renal clear cell carcinoma], 10; KIRP[Kidney renal papillary cell carcinoma], 11; LAML[Acute Myeloid Leukemia], 12; LUAD[Lung adenocarcinoma], 13; LUSC[Lung squamous cell carcinoma], 14; OV[Ovarian serous cystadenocarcinoma ], 15; PAAD[Pancreatic adenocarcinoma], 16; PRAD[Prostate adenocarcinoma], 17; SKCM[Skin Cutaneous Melanoma], 18:STAD[Stomach adenocarcinoma], 19:THCA[Thyroid carcinoma], 20:UCEC[Uterine Corpus Endometrial Carcinoma]) |
| Top |
| * We represented just top 10 SNVs. When you move the cursor on each content, you can see more deailed mutation information on the Tooltip. Those are primary_site, primary_histology, mutation(aa), pubmedID. |
| Genomic Position | Mutation(aa) | Unique sampleID count |
| chr3:184910747 | p.V384A,EHHADH | 5 |
| chr3:184910746 | p.V384V,EHHADH | 3 |
| chr3:184910074 | p.R64C | 2 |
| chr3:184953239 | p.S622F,EHHADH | 2 |
| chr3:184910033 | p.Q608H,EHHADH | 2 |
| chr3:184910704 | p.E581D,EHHADH | 1 |
| chr3:184936028 | p.R474L,EHHADH | 1 |
| chr3:184911202 | p.R222S,EHHADH | 1 |
| chr3:184910352 | p.L73I,EHHADH | 1 |
| chr3:184922367 | p.V579A,EHHADH | 1 |
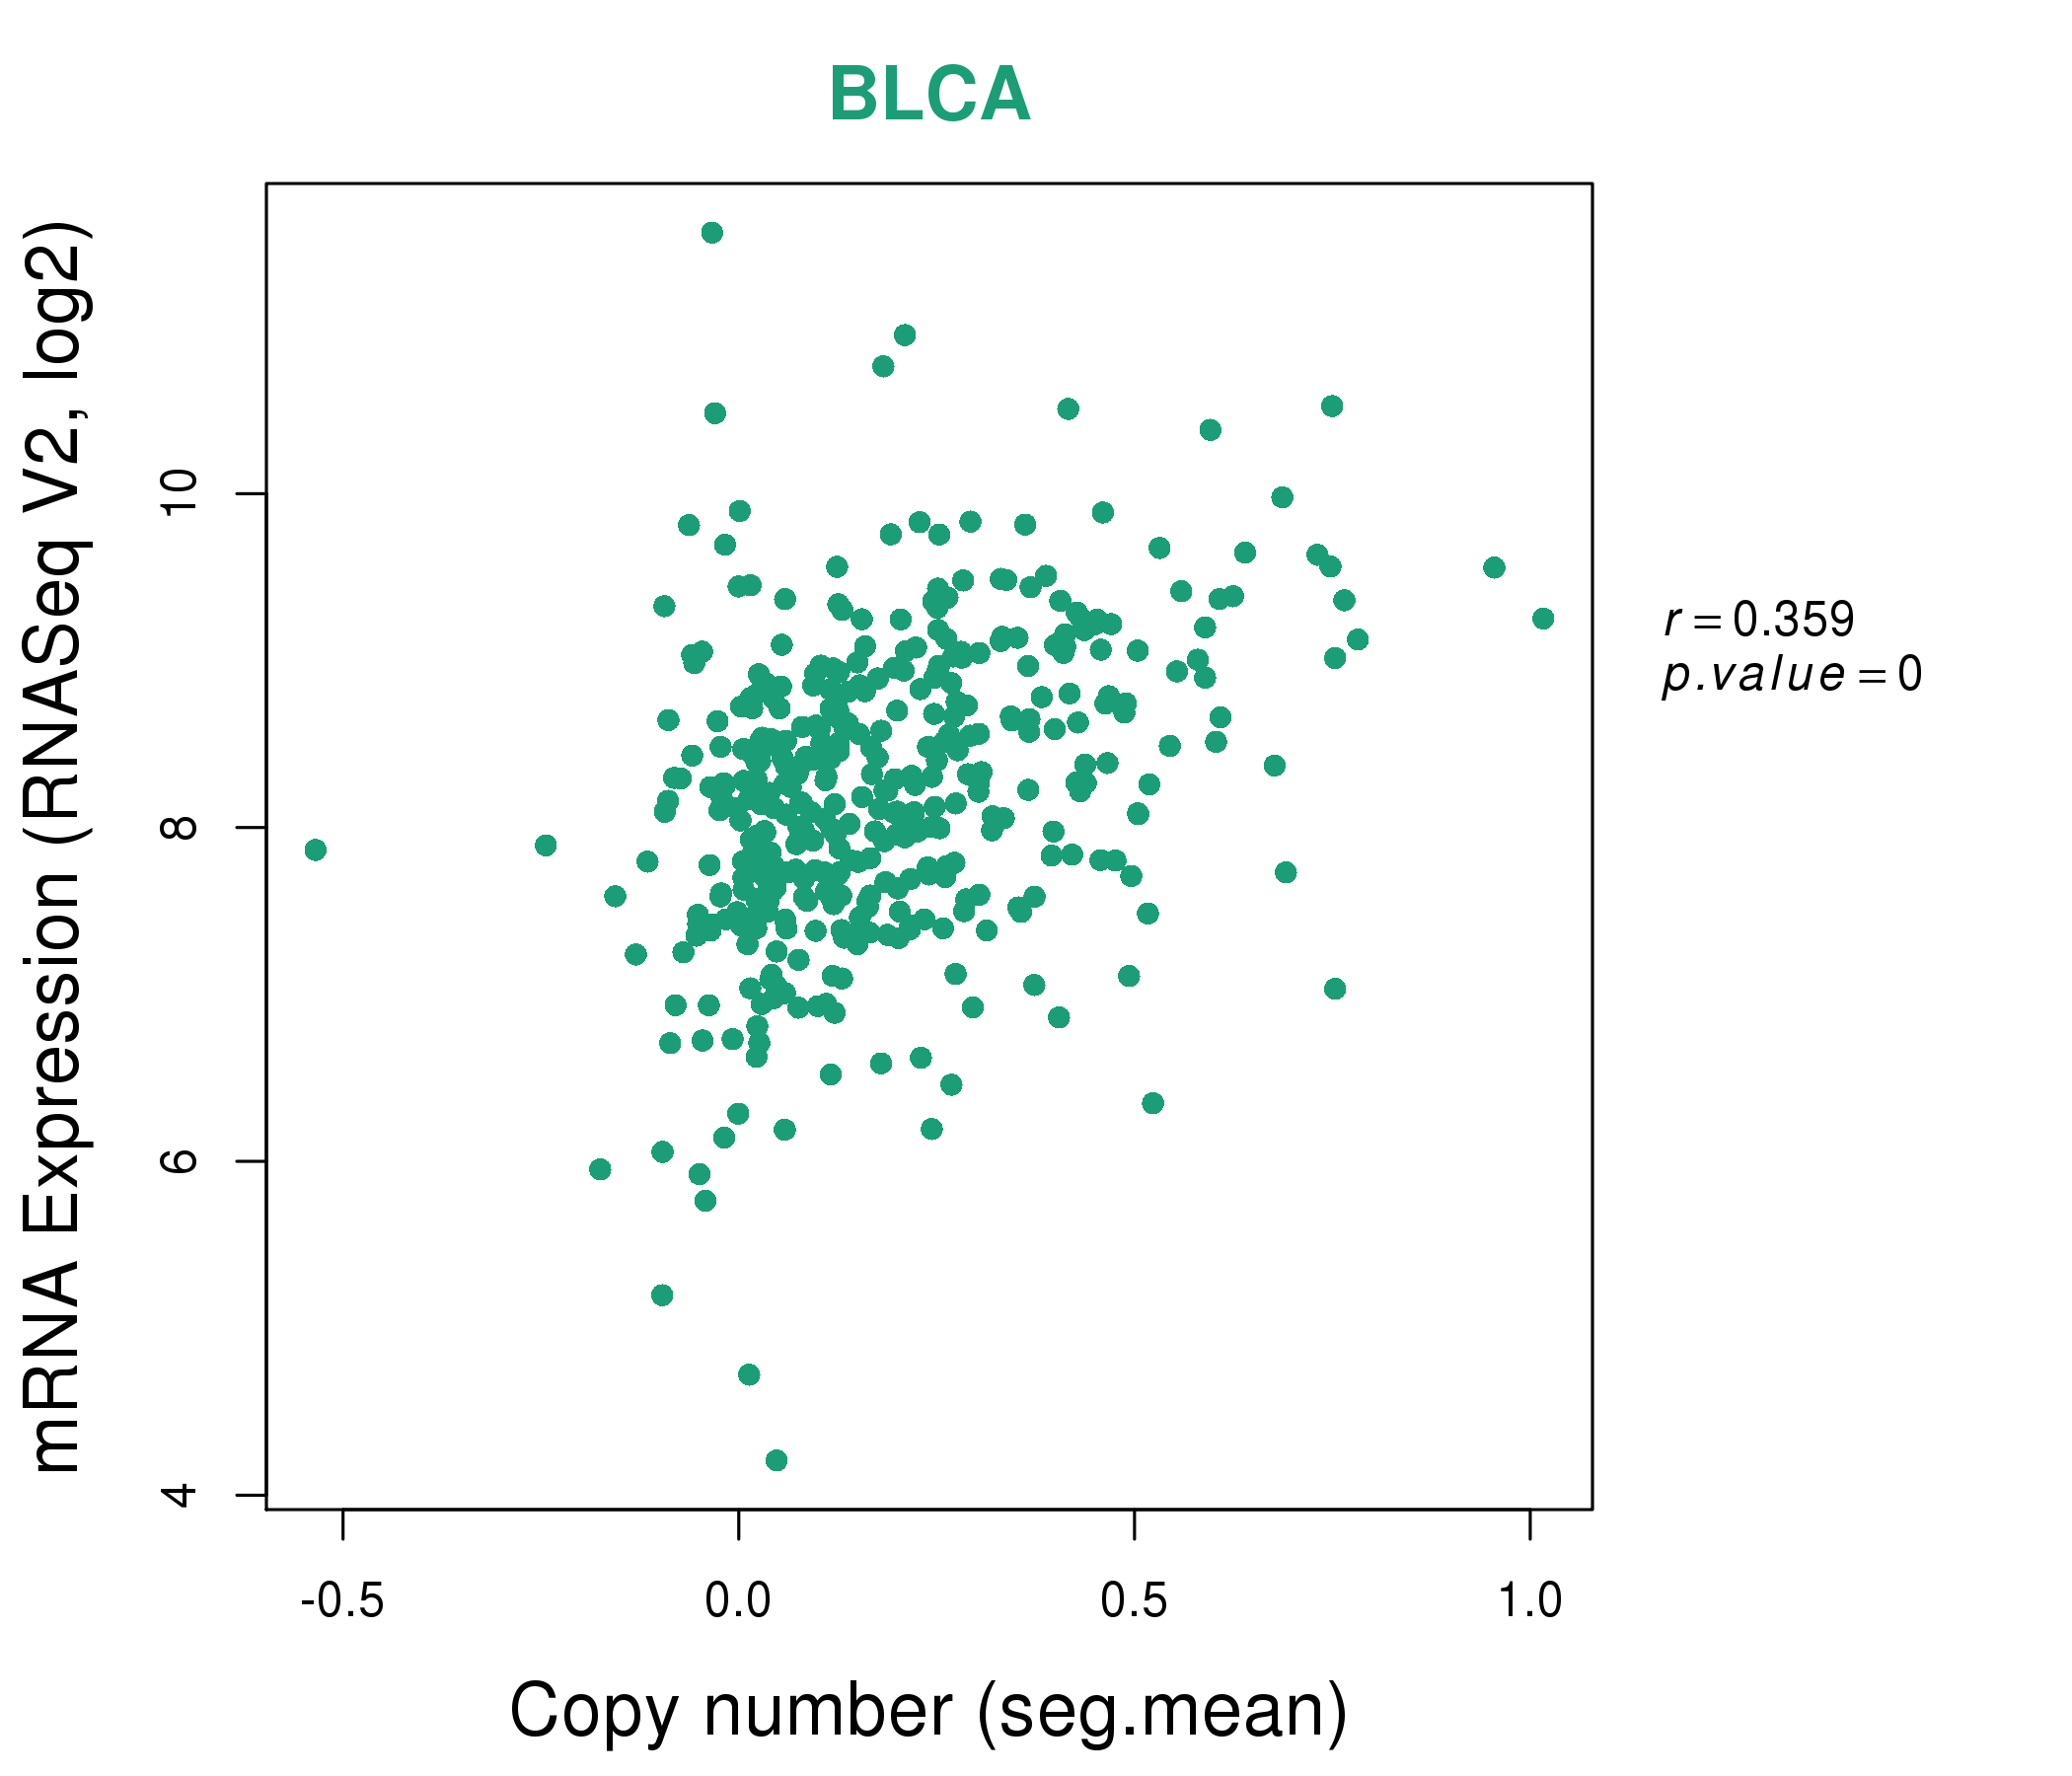
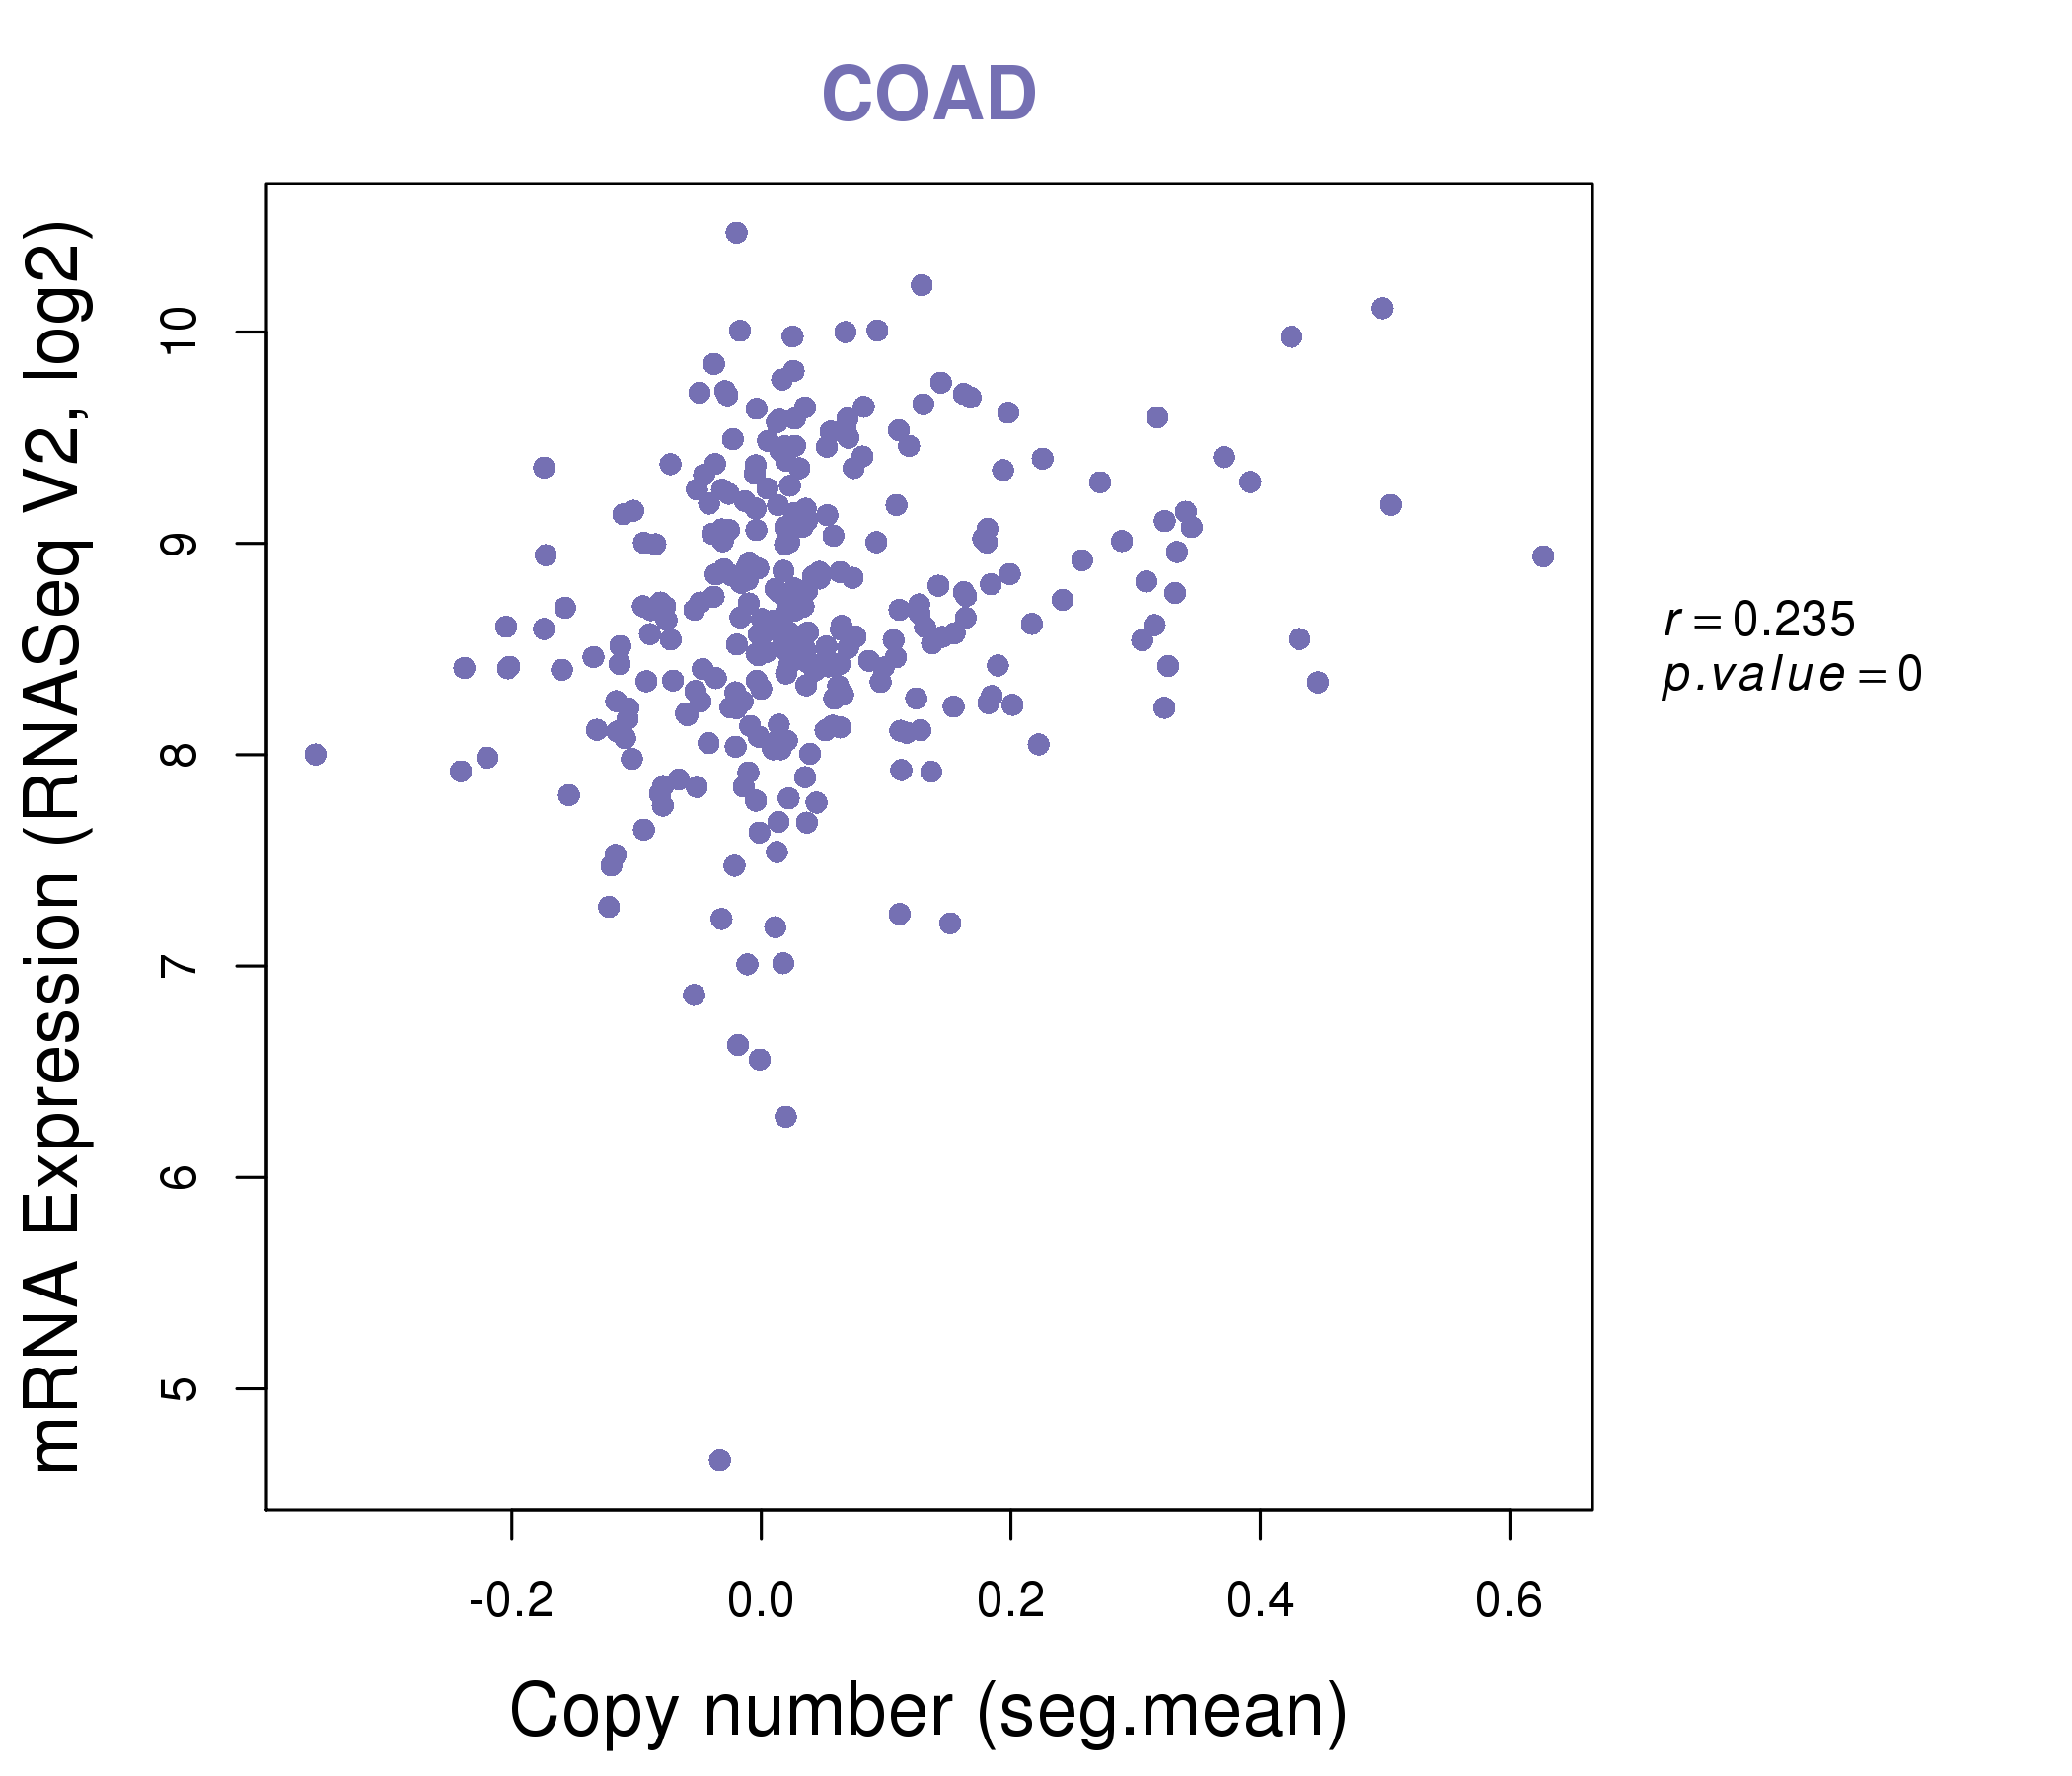
| * Copy number data were extracted from TCGA using R package TCGA-Assembler. The URLs of all public data files on TCGA DCC data server were gathered on Jan-05-2015. Function ProcessCNAData in TCGA-Assembler package was used to obtain gene-level copy number value which is calculated as the average copy number of the genomic region of a gene. |
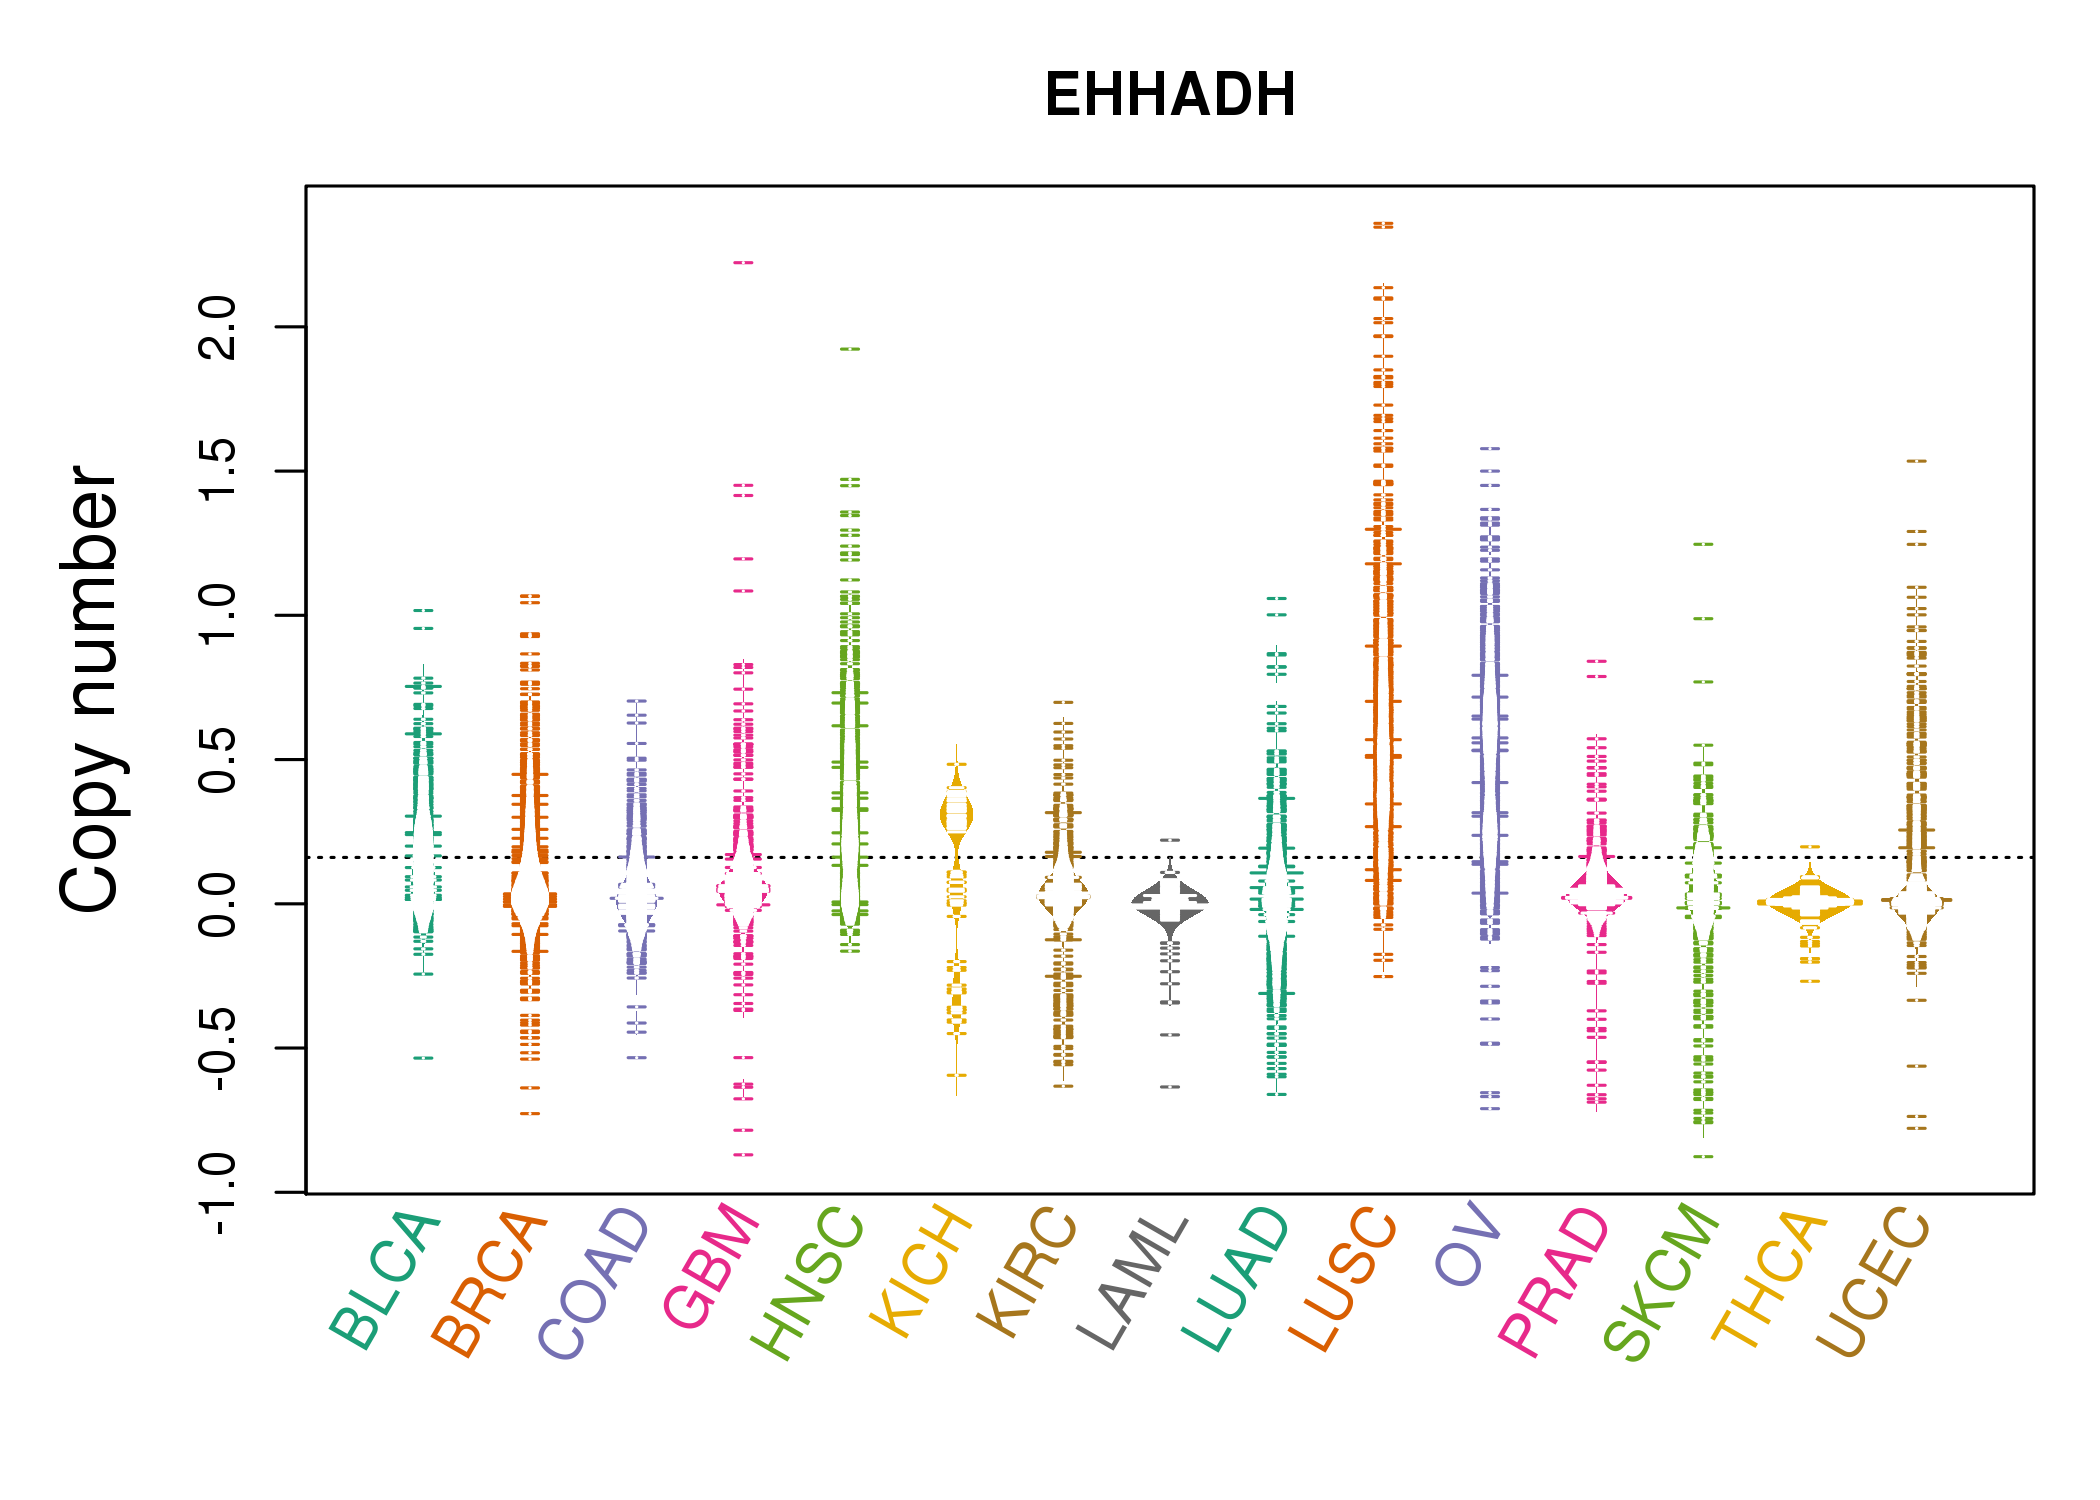 |
| cf) Tissue ID[Tissue type]: BLCA[Bladder Urothelial Carcinoma], BRCA[Breast invasive carcinoma], CESC[Cervical squamous cell carcinoma and endocervical adenocarcinoma], COAD[Colon adenocarcinoma], GBM[Glioblastoma multiforme], Glioma Low Grade, HNSC[Head and Neck squamous cell carcinoma], KICH[Kidney Chromophobe], KIRC[Kidney renal clear cell carcinoma], KIRP[Kidney renal papillary cell carcinoma], LAML[Acute Myeloid Leukemia], LUAD[Lung adenocarcinoma], LUSC[Lung squamous cell carcinoma], OV[Ovarian serous cystadenocarcinoma ], PAAD[Pancreatic adenocarcinoma], PRAD[Prostate adenocarcinoma], SKCM[Skin Cutaneous Melanoma], STAD[Stomach adenocarcinoma], THCA[Thyroid carcinoma], UCEC[Uterine Corpus Endometrial Carcinoma] |
| Top |
| Gene Expression for EHHADH |
| * CCLE gene expression data were extracted from CCLE_Expression_Entrez_2012-10-18.res: Gene-centric RMA-normalized mRNA expression data. |
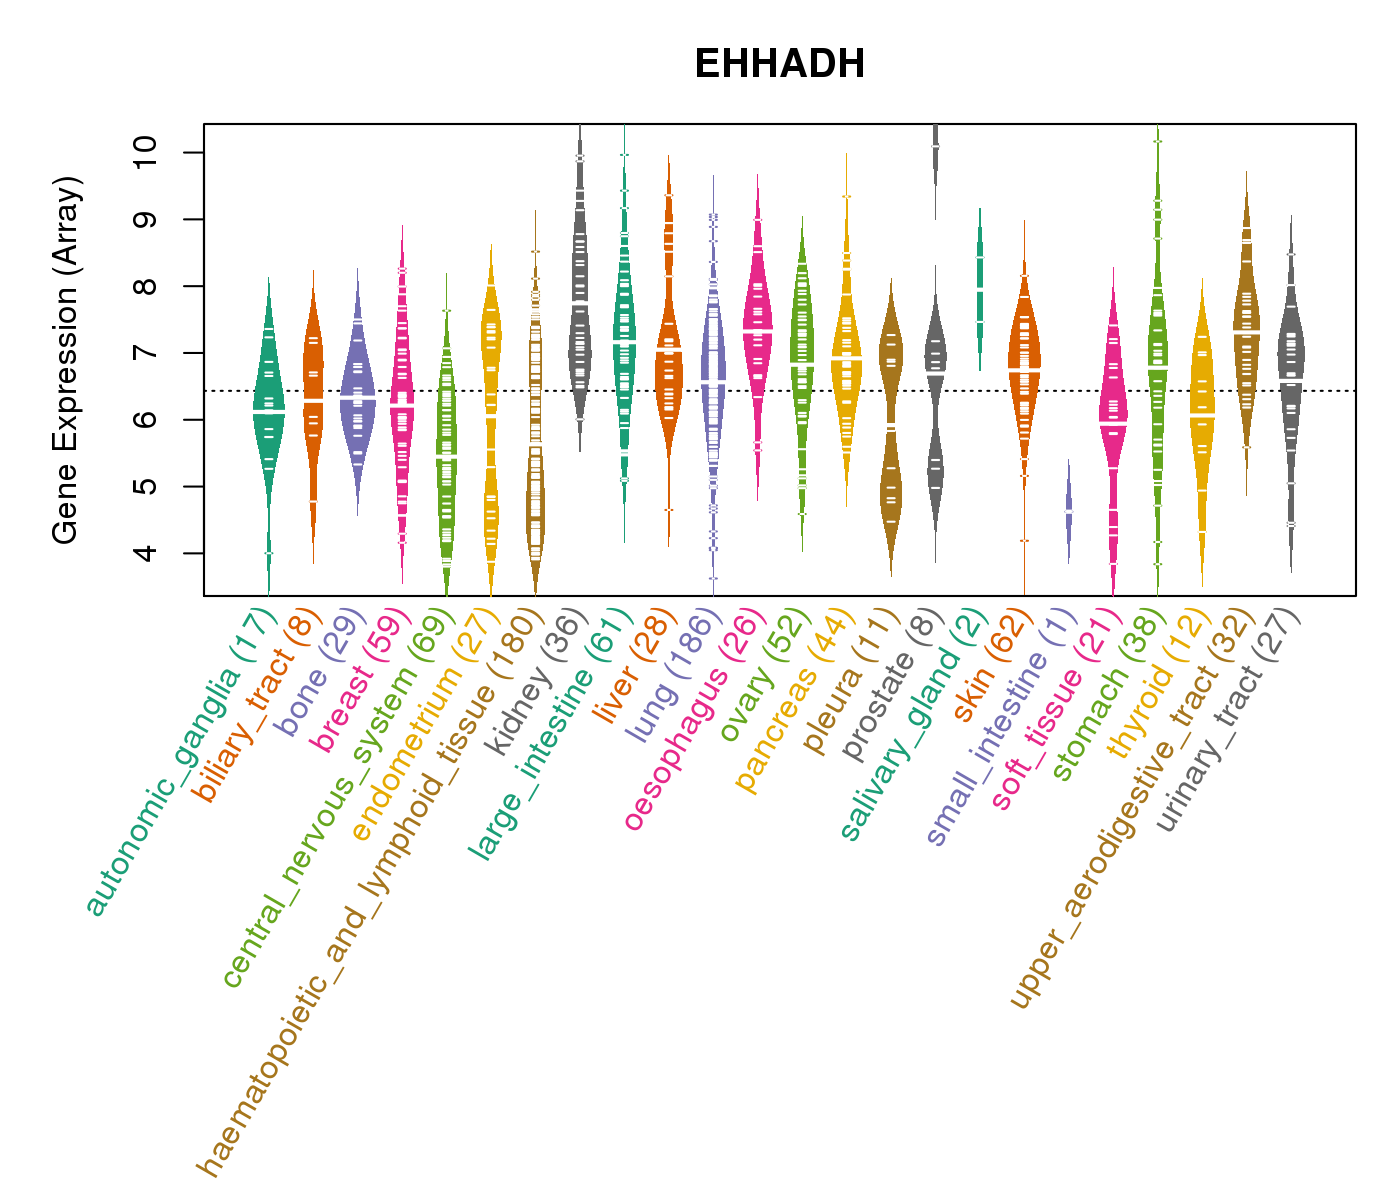 |
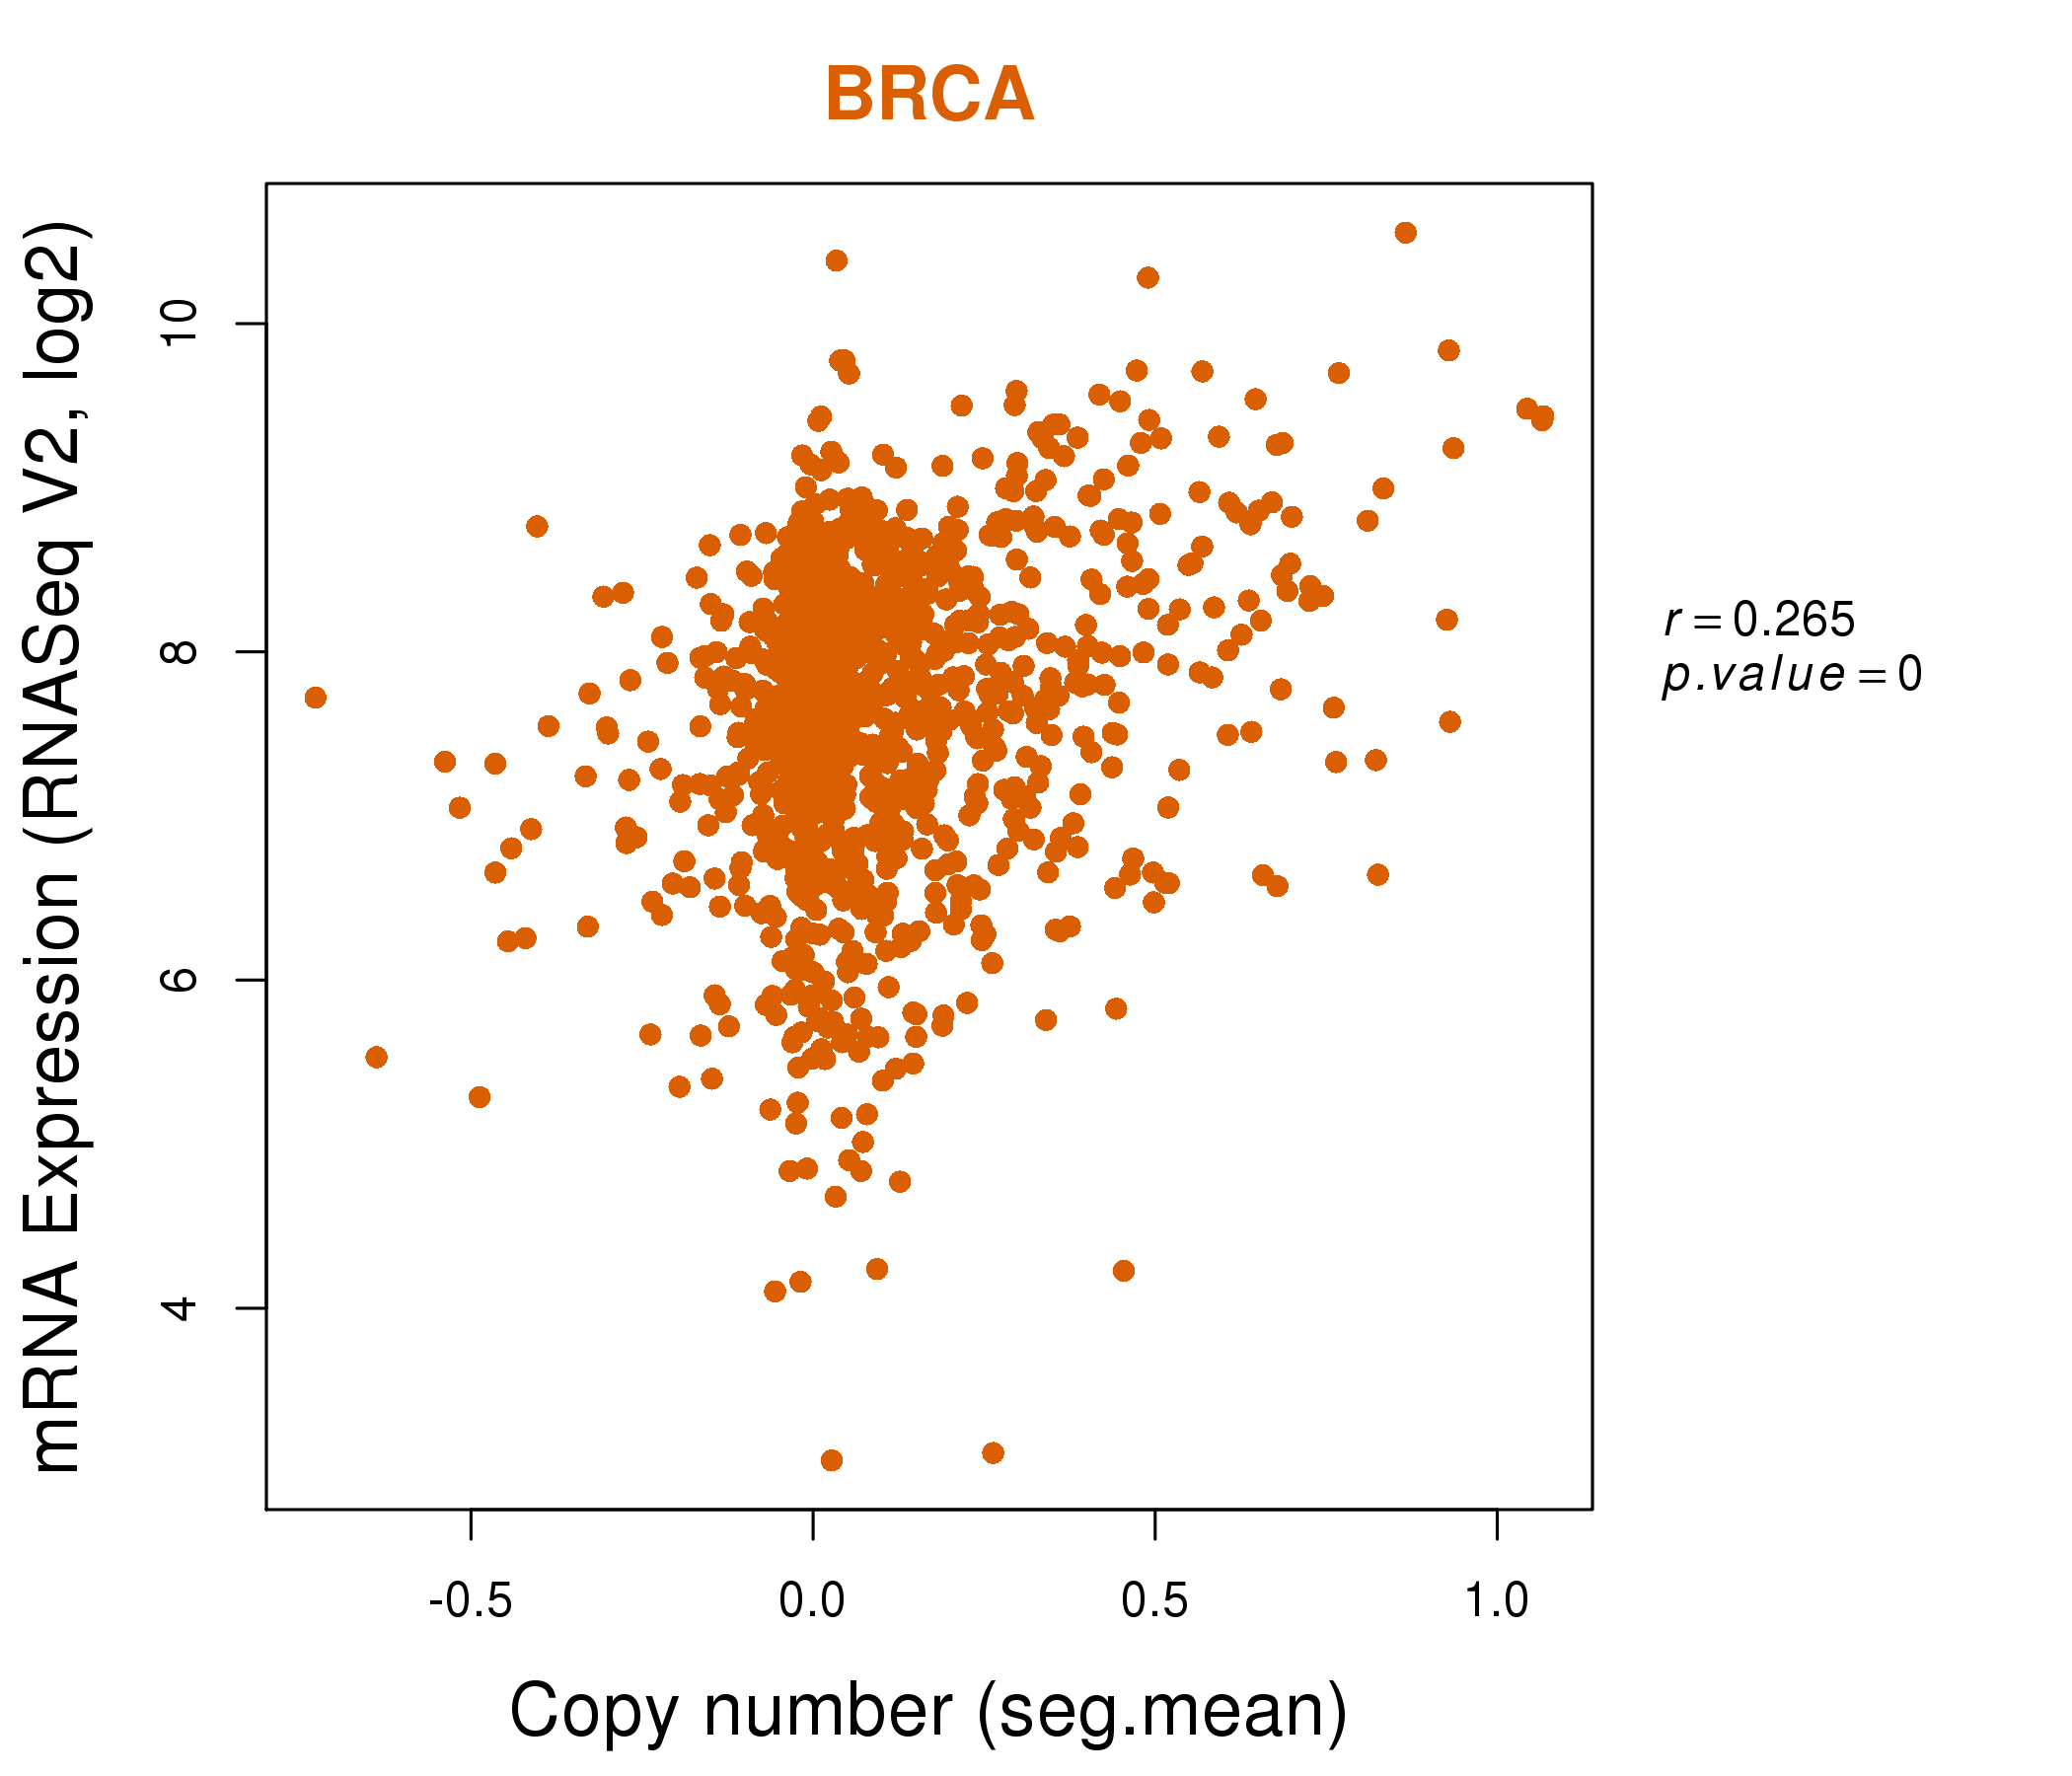
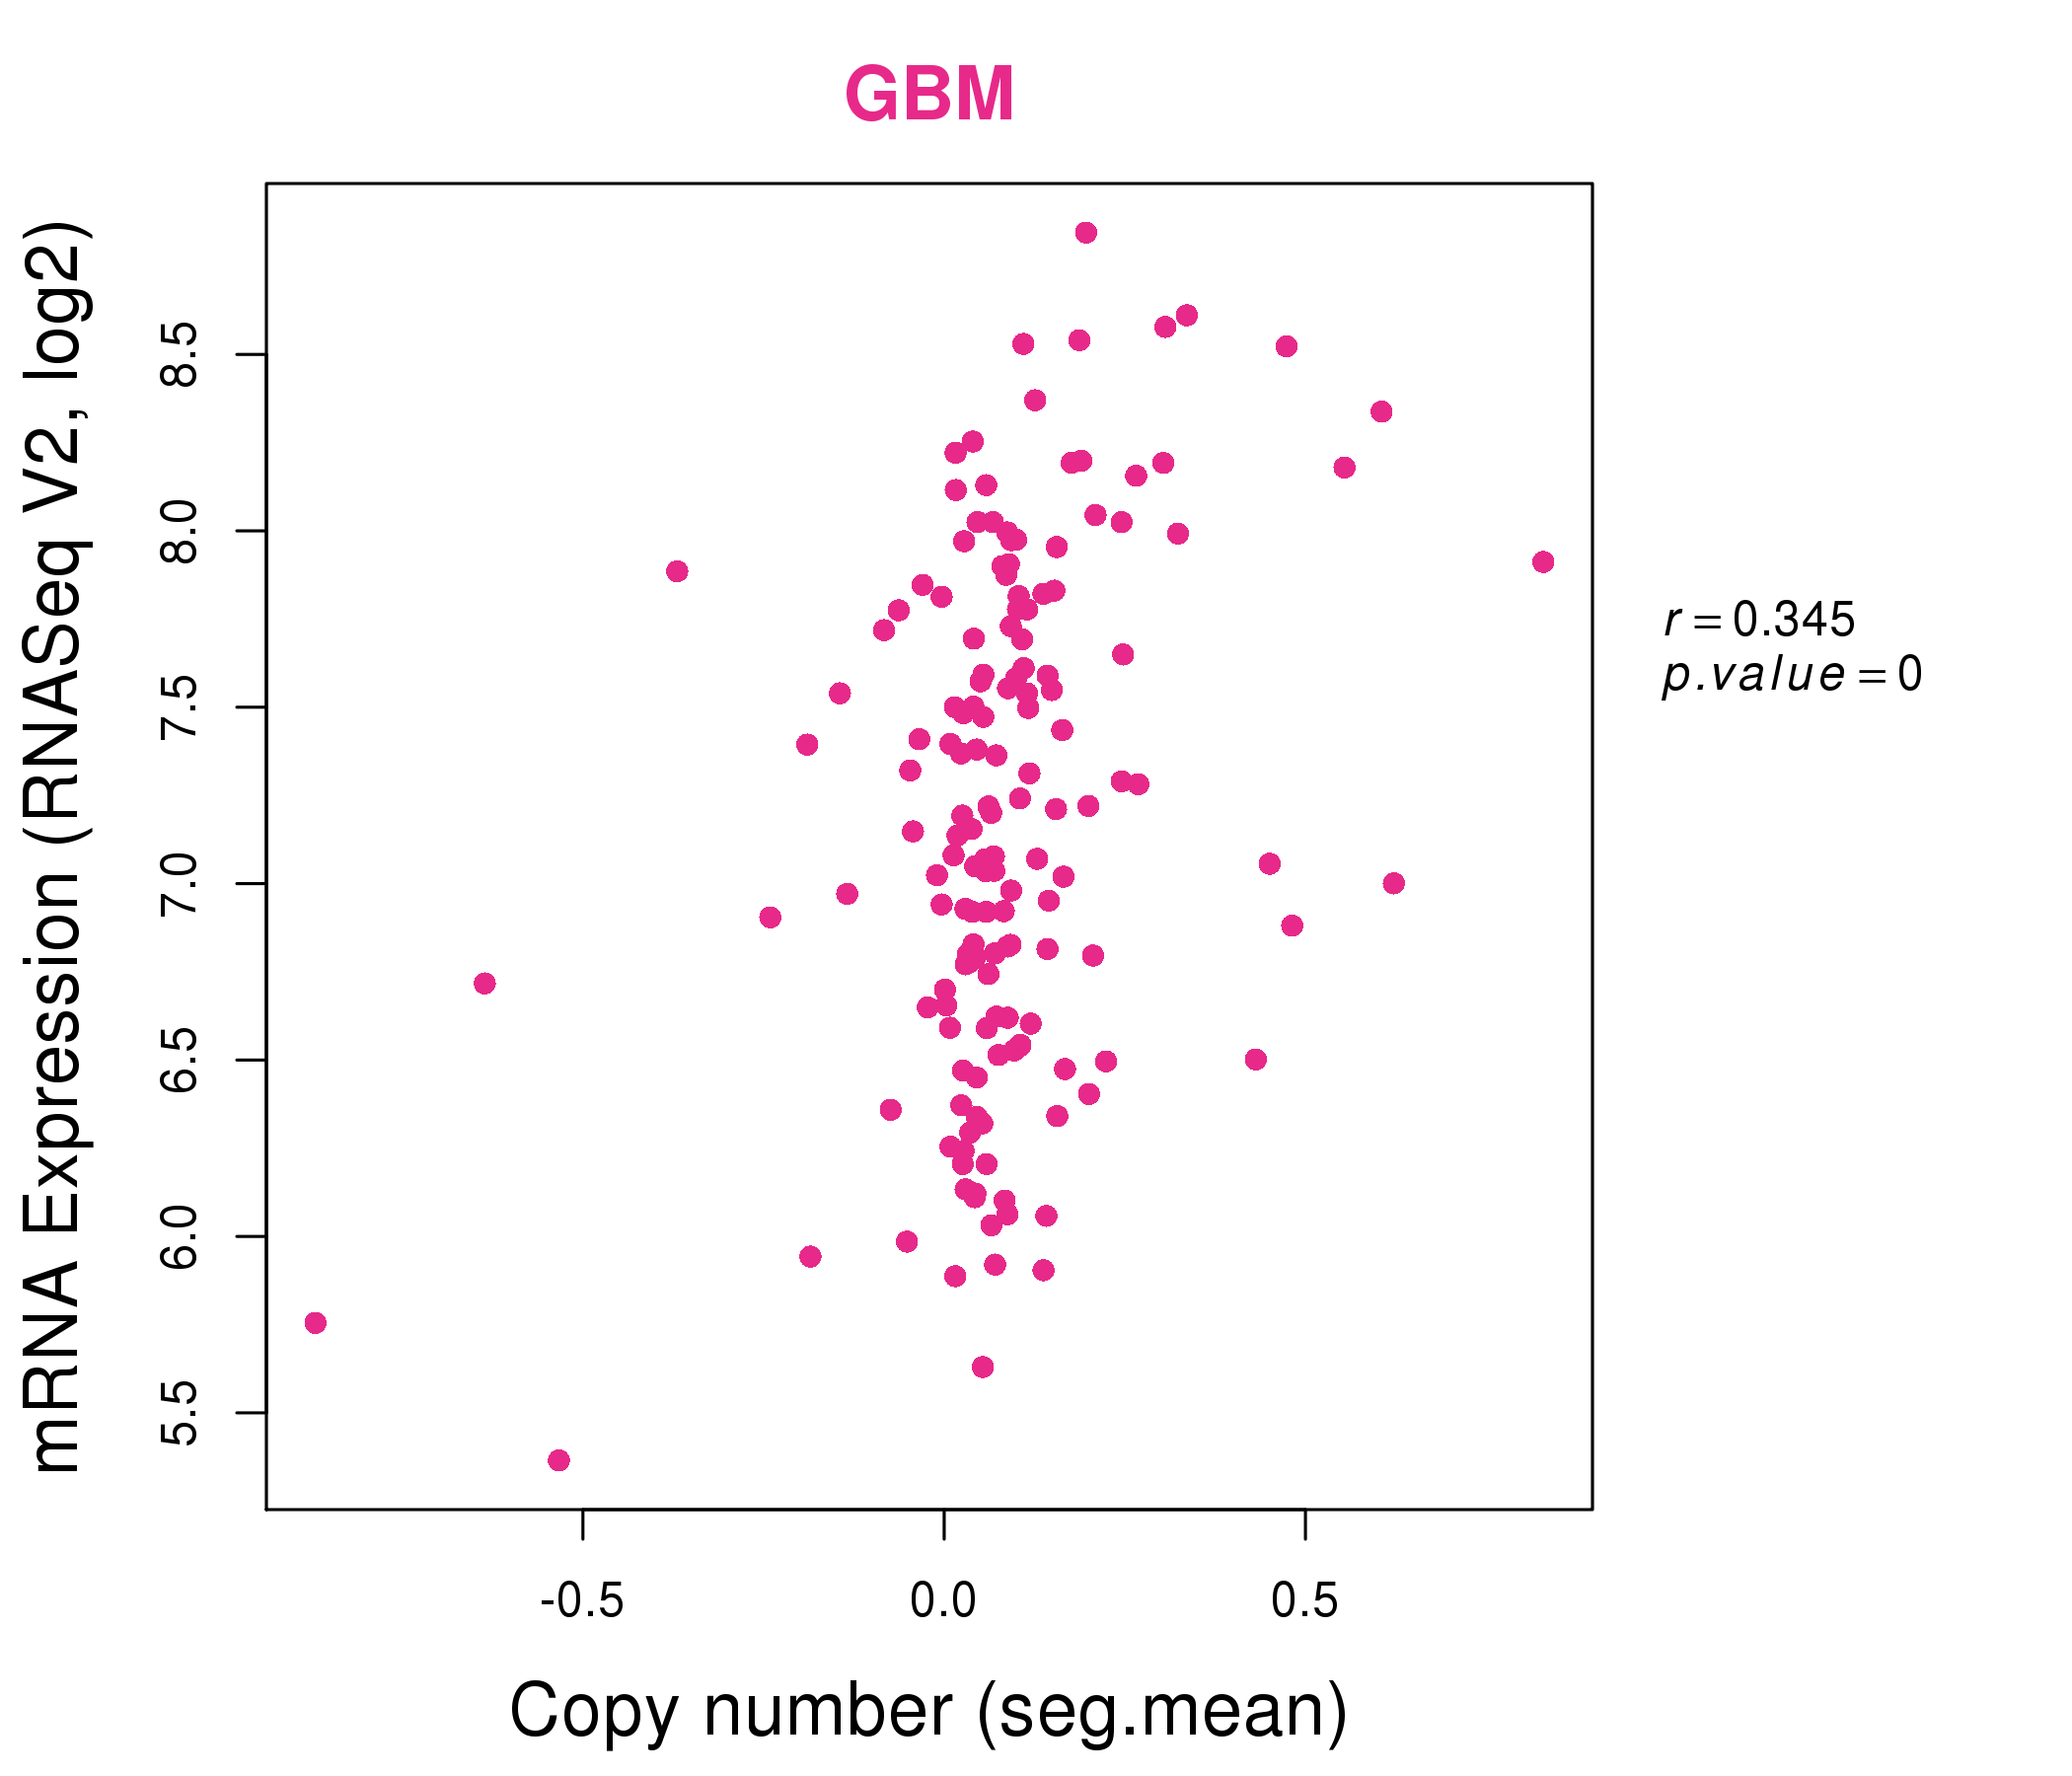
| * Normalized gene expression data of RNASeqV2 was extracted from TCGA using R package TCGA-Assembler. The URLs of all public data files on TCGA DCC data server were gathered at Jan-05-2015. Only eight cancer types have enough normal control samples for differential expression analysis. (t test, adjusted p<0.05 (using Benjamini-Hochberg FDR)) |
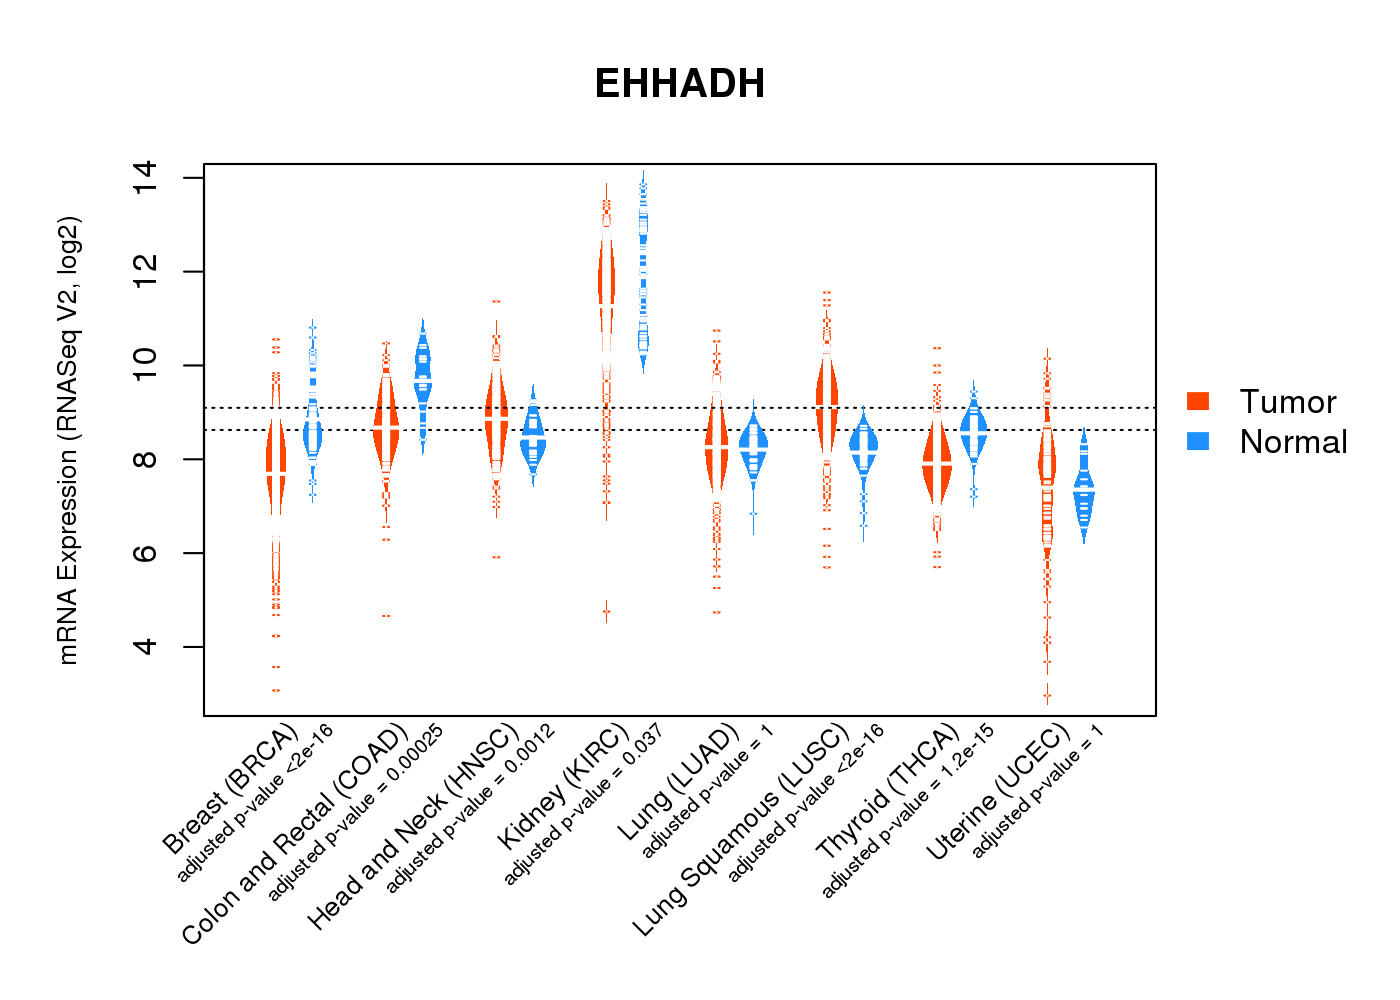 |
| Top |
| * This plots show the correlation between CNV and gene expression. |
: Open all plots for all cancer types
 |
|
 |
|
| Top |
| Gene-Gene Network Information |
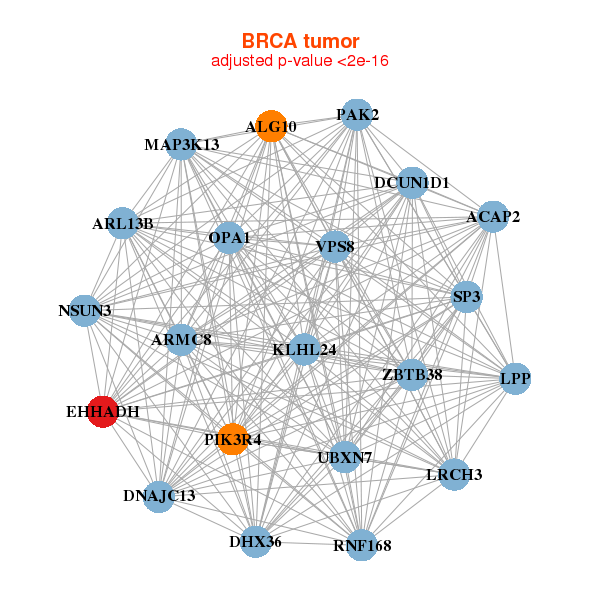
| * Co-Expression network figures were drawn using R package igraph. Only the top 20 genes with the highest correlations were shown. Red circle: input gene, orange circle: cell metabolism gene, sky circle: other gene |
: Open all plots for all cancer types
 |
| ||||
| ACAP2,ALG10,ARL13B,ARMC8,DCUN1D1,DHX36,DNAJC13, EHHADH,KLHL24,LPP,LRCH3,MAP3K13,NSUN3,OPA1, PAK2,PIK3R4,RNF168,SP3,UBXN7,VPS8,ZBTB38 | ABCD2,ACAD11,ADIPOQ,ADRBK2,ANO6,CD36,COL4A3BP, EHHADH,FZD4,GNAI1,HRASLS5,KCNIP2,LPL,PCYOX1, PDE3B,PEX19,PRKAR2B,RHOBTB3,SIK2,SLC16A7,SORT1 | ||||
 |
| ||||
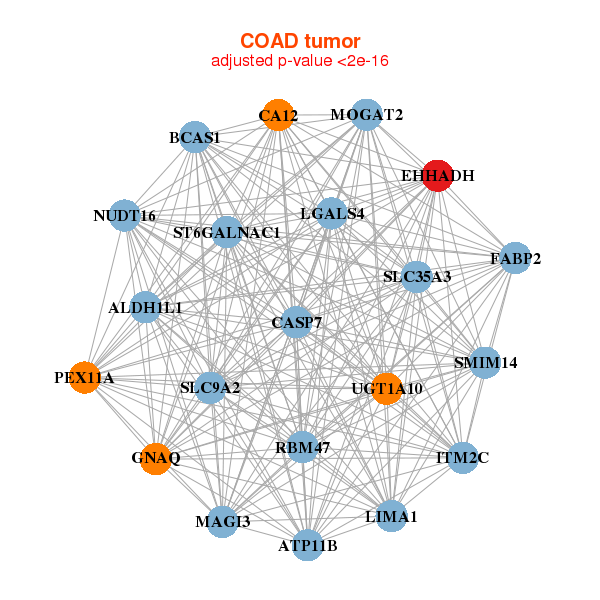
| ALDH1L1,ATP11B,BCAS1,SMIM14,CA12,CASP7,EHHADH, FABP2,GNAQ,ITM2C,LGALS4,LIMA1,MAGI3,MOGAT2, NUDT16,PEX11A,RBM47,SLC35A3,SLC9A2,ST6GALNAC1,UGT1A10 | ADRA2A,AGFG2,ASAP3,CDH17,EHHADH,GJB2,HARS2, HMGB3,IQGAP2,KCNV1,KIFAP3,NAALADL2,OPN3,PAPSS2, PEX11A,STK38,TFRC,UGDH,UGT1A10,UGT1A8,WDR78 |

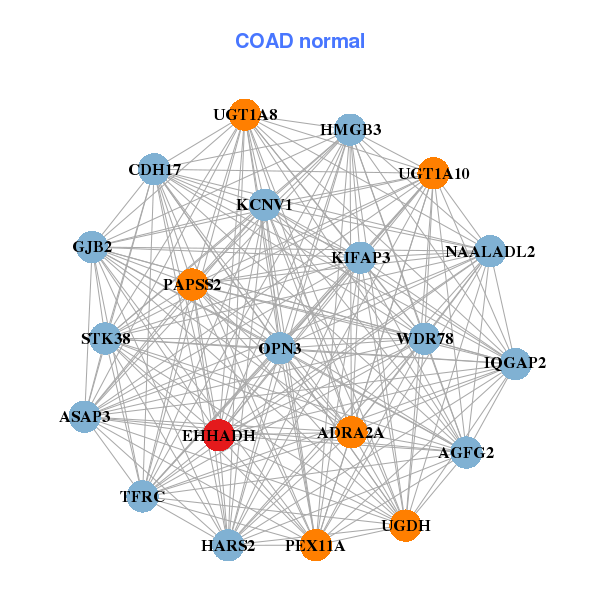
| * Co-Expression network figures were drawn using R package igraph. Only the top 20 genes with the highest correlations were shown. Red circle: input gene, orange circle: cell metabolism gene, sky circle: other gene |
: Open all plots for all cancer types
| Top |
: Open all interacting genes' information including KEGG pathway for all interacting genes from DAVID
| Top |
| Pharmacological Information for EHHADH |
| DB Category | DB Name | DB's ID and Url link |
| * Gene Centered Interaction Network. |
 |
| * Drug Centered Interaction Network. |
| DrugBank ID | Target Name | Drug Groups | Generic Name | Drug Centered Network | Drug Structure |
| DB00157 | enoyl-CoA, hydratase/3-hydroxyacyl CoA dehydrogenase | approved; nutraceutical | NADH |  |  |
| Top |
| Cross referenced IDs for EHHADH |
| * We obtained these cross-references from Uniprot database. It covers 150 different DBs, 18 categories. http://www.uniprot.org/help/cross_references_section |
: Open all cross reference information
|
Copyright © 2016-Present - The Univsersity of Texas Health Science Center at Houston @ |