|
|||||||||||||||||||||||||||||||||||||||||||||||||||||||||||||||||||||||||||||||||||||||||||||||||||||||||||||||||||||||||||||||||||||||||||||||||||||||||||||||||||||||||||||||||||||||||||||||||||||||||||||||||||||||||||||||||||||||||||||||||||||||||||||||||||||||||||||||||||||||||||||||||||||||||||||||||||||||||||||||||||||||||||||
| |
| Phenotypic Information (metabolism pathway, cancer, disease, phenome) |
| |
| |
| Gene-Gene Network Information: Co-Expression Network, Interacting Genes & KEGG |
| |
|


| Gene Summary for DCP1B |
| Basic gene info. | Gene symbol | DCP1B |
| Gene name | decapping mRNA 1B | |
| Synonyms | DCP1|hDcp1b | |
| Cytomap | UCSC genome browser: 12p13.33 | |
| Genomic location | chr12 :2055213-2113677 | |
| Type of gene | protein-coding | |
| RefGenes | NM_152640.3, | |
| Ensembl id | ENSG00000151065 | |
| Description | DCP1 decapping enzyme homolog Bdecapping enzyme hDcp1bmRNA-decapping enzyme 1B | |
| Modification date | 20141207 | |
| dbXrefs | MIM : 609843 | |
| HGNC : HGNC | ||
| Ensembl : ENSG00000151065 | ||
| Vega : OTTHUMG00000168113 | ||
| Protein | UniProt: go to UniProt's Cross Reference DB Table | |
| Expression | CleanEX: HS_DCP1B | |
| BioGPS: 196513 | ||
| Gene Expression Atlas: ENSG00000151065 | ||
| The Human Protein Atlas: ENSG00000151065 | ||
| Pathway | NCI Pathway Interaction Database: DCP1B | |
| KEGG: DCP1B | ||
| REACTOME: DCP1B | ||
| ConsensusPathDB | ||
| Pathway Commons: DCP1B | ||
| Metabolism | MetaCyc: DCP1B | |
| HUMANCyc: DCP1B | ||
| Regulation | Ensembl's Regulation: ENSG00000151065 | |
| miRBase: chr12 :2,055,213-2,113,677 | ||
| TargetScan: NM_152640 | ||
| cisRED: ENSG00000151065 | ||
| Context | iHOP: DCP1B | |
| cancer metabolism search in PubMed: DCP1B | ||
| UCL Cancer Institute: DCP1B | ||
| Assigned class in ccmGDB | C | |
| Top |
| Phenotypic Information for DCP1B(metabolism pathway, cancer, disease, phenome) |
| Cancer | CGAP: DCP1B |
| Familial Cancer Database: DCP1B | |
| * This gene is included in those cancer gene databases. |
|
|
|
|
|
| . | |||||||||||||||||||||||||||||||||||||||||||||||||||||||||||||||||||||||||||||||||||||||||||||||||||||||||||||||||||||||||||||||||||||||||||||||||||||||||||||||||||||||||||||||||||||||||||||||||||||||||||||||||||||||||||||||||||||||||||||||||||||||||||||||||||||||||||||||||||||||||||||||||||||||||||||||||||||||||||||||||||||||
Oncogene 1 | Significant driver gene in | ||||||||||||||||||||||||||||||||||||||||||||||||||||||||||||||||||||||||||||||||||||||||||||||||||||||||||||||||||||||||||||||||||||||||||||||||||||||||||||||||||||||||||||||||||||||||||||||||||||||||||||||||||||||||||||||||||||||||||||||||||||||||||||||||||||||||||||||||||||||||||||||||||||||||||||||||||||||||||||||||||||||||||||
| cf) number; DB name 1 Oncogene; http://nar.oxfordjournals.org/content/35/suppl_1/D721.long, 2 Tumor Suppressor gene; https://bioinfo.uth.edu/TSGene/, 3 Cancer Gene Census; http://www.nature.com/nrc/journal/v4/n3/abs/nrc1299.html, 4 CancerGenes; http://nar.oxfordjournals.org/content/35/suppl_1/D721.long, 5 Network of Cancer Gene; http://ncg.kcl.ac.uk/index.php, 1Therapeutic Vulnerabilities in Cancer; http://cbio.mskcc.org/cancergenomics/statius/ |
| REACTOME_METABOLISM_OF_MRNA REACTOME_METABOLISM_OF_RNA | |
| OMIM | |
| Orphanet | |
| Disease | KEGG Disease: DCP1B |
| MedGen: DCP1B (Human Medical Genetics with Condition) | |
| ClinVar: DCP1B | |
| Phenotype | MGI: DCP1B (International Mouse Phenotyping Consortium) |
| PhenomicDB: DCP1B | |
| Mutations for DCP1B |
| * Under tables are showing count per each tissue to give us broad intuition about tissue specific mutation patterns.You can go to the detailed page for each mutation database's web site. |
| - Statistics for Tissue and Mutation type | Top |
 |
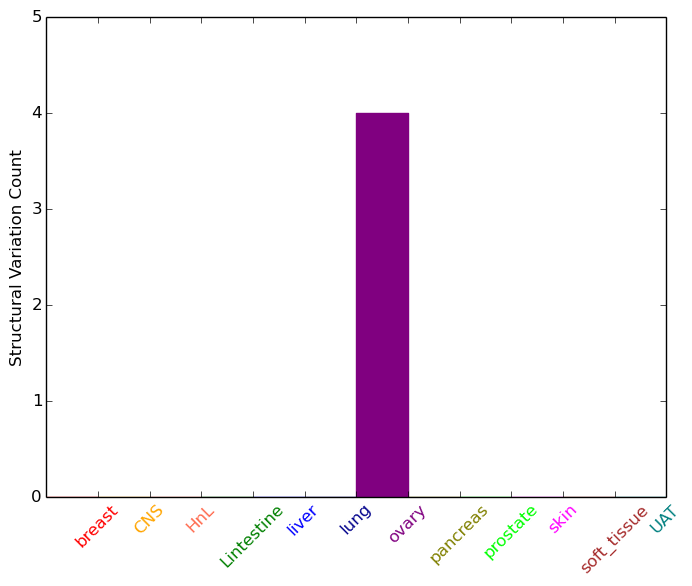
| - For Inter-chromosomal Variations |
| * Inter-chromosomal variantions includes 'interchromosomal amplicon to amplicon', 'interchromosomal amplicon to non-amplified dna', 'interchromosomal insertion', 'Interchromosomal unknown type'. |
 |
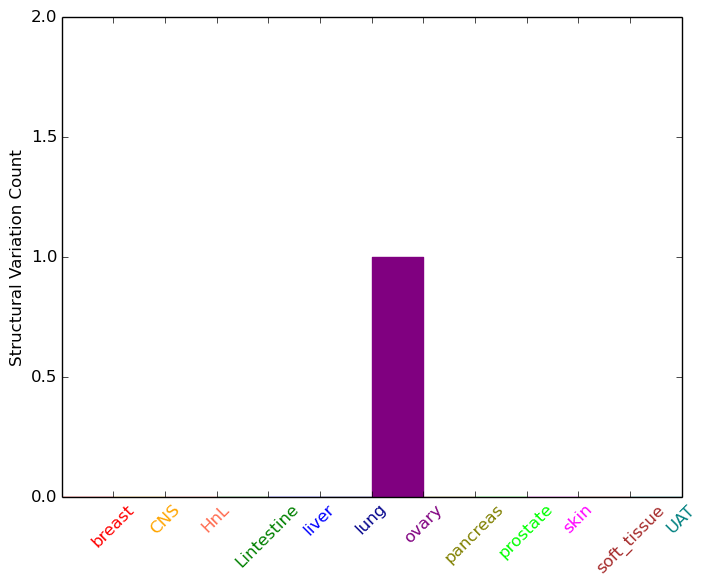
| - For Intra-chromosomal Variations |
| * Intra-chromosomal variantions includes 'intrachromosomal amplicon to amplicon', 'intrachromosomal amplicon to non-amplified dna', 'intrachromosomal deletion', 'intrachromosomal fold-back inversion', 'intrachromosomal inversion', 'intrachromosomal tandem duplication', 'Intrachromosomal unknown type', 'intrachromosomal with inverted orientation', 'intrachromosomal with non-inverted orientation'. |
 |
| Sample | Symbol_a | Chr_a | Start_a | End_a | Symbol_b | Chr_b | Start_b | End_b |
| ovary | DCP1B | chr12 | 2065596 | 2065616 | FLJ35024 | chr9 | 2585759 | 2585779 |
| ovary | DCP1B | chr12 | 2099003 | 2099023 | DCP1B | chr12 | 2098011 | 2098031 |
| cf) Tissue number; Tissue name (1;Breast, 2;Central_nervous_system, 3;Haematopoietic_and_lymphoid_tissue, 4;Large_intestine, 5;Liver, 6;Lung, 7;Ovary, 8;Pancreas, 9;Prostate, 10;Skin, 11;Soft_tissue, 12;Upper_aerodigestive_tract) |
| * From mRNA Sanger sequences, Chitars2.0 arranged chimeric transcripts. This table shows DCP1B related fusion information. |
| ID | Head Gene | Tail Gene | Accession | Gene_a | qStart_a | qEnd_a | Chromosome_a | tStart_a | tEnd_a | Gene_a | qStart_a | qEnd_a | Chromosome_a | tStart_a | tEnd_a |
| AW262847 | PPP5C | 1 | 70 | 19 | 46894039 | 46894108 | DCP1B | 60 | 332 | 12 | 2062251 | 2064666 | |
| Top |
| Mutation type/ Tissue ID | brca | cns | cerv | endome | haematopo | kidn | Lintest | liver | lung | ns | ovary | pancre | prost | skin | stoma | thyro | urina | |||
| Total # sample | 2 | 1 | 2 | |||||||||||||||||
| GAIN (# sample) | 2 | 1 | 2 | |||||||||||||||||
| LOSS (# sample) |
| cf) Tissue ID; Tissue type (1; Breast, 2; Central_nervous_system, 3; Cervix, 4; Endometrium, 5; Haematopoietic_and_lymphoid_tissue, 6; Kidney, 7; Large_intestine, 8; Liver, 9; Lung, 10; NS, 11; Ovary, 12; Pancreas, 13; Prostate, 14; Skin, 15; Stomach, 16; Thyroid, 17; Urinary_tract) |
| Top |
|
 |
| Top |
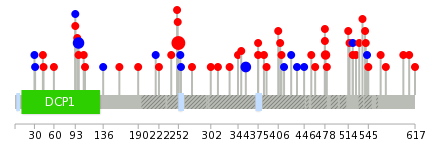
| Stat. for Non-Synonymous SNVs (# total SNVs=49) | (# total SNVs=19) |
 |  |
(# total SNVs=0) | (# total SNVs=8) |
 |
| Top |
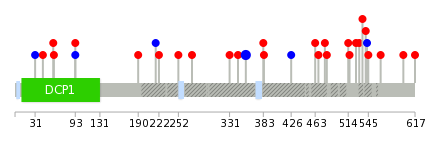
| * When you move the cursor on each content, you can see more deailed mutation information on the Tooltip. Those are primary_site,primary_histology,mutation(aa),pubmedID. |
| GRCh37 position | Mutation(aa) | Unique sampleID count |
| chr12:2062350-2062350 | p.Q252H | 18 |
| chr12:2102455-2102455 | p.P98P | 6 |
| chr12:2062038-2062038 | p.F356F | 4 |
| chr12:2062323-2062324 | p.Q261_E262insQ | 4 |
| chr12:2062353-2062354 | p.H251_Q252insG | 3 |
| chr12:2061671-2061671 | p.V479M | 2 |
| chr12:2061728-2061728 | p.Q460* | 2 |
| chr12:2061735-2061735 | p.Q457H | 1 |
| chr12:2064624-2064624 | p.Q209* | 1 |
| chr12:2061982-2061982 | p.A375V | 1 |
| Top |
|
 |
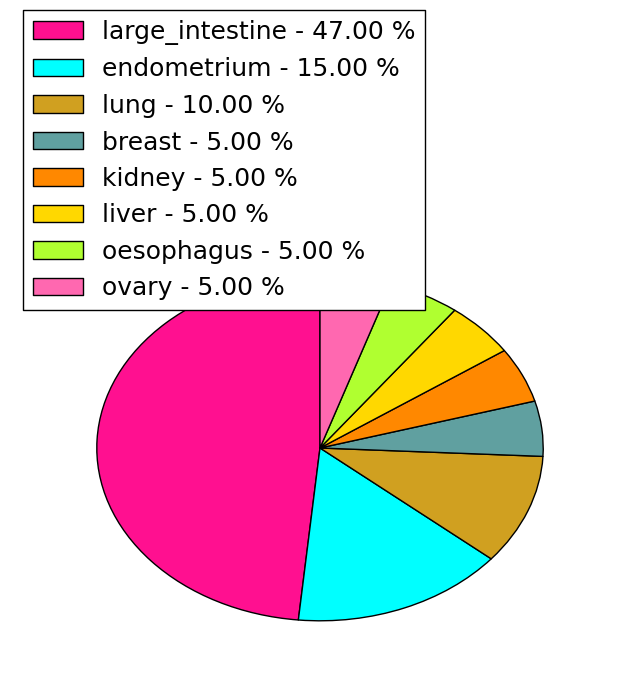
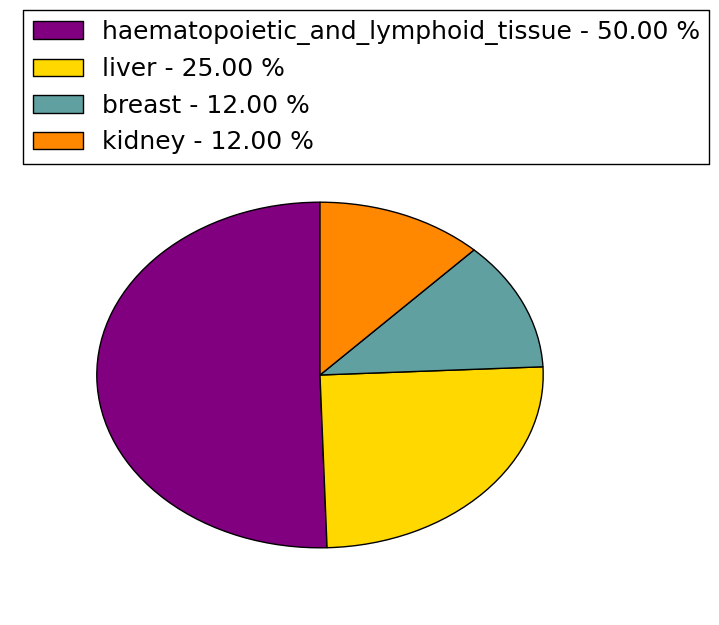
| Point Mutation/ Tissue ID | 1 | 2 | 3 | 4 | 5 | 6 | 7 | 8 | 9 | 10 | 11 | 12 | 13 | 14 | 15 | 16 | 17 | 18 | 19 | 20 |
| # sample | 2 | 1 | 6 | 3 | 1 | 6 | 1 | 4 | 3 | 6 | ||||||||||
| # mutation | 2 | 1 | 6 | 3 | 1 | 6 | 1 | 4 | 4 | 6 | ||||||||||
| nonsynonymous SNV | 2 | 5 | 3 | 1 | 6 | 2 | 4 | 3 | ||||||||||||
| synonymous SNV | 1 | 1 | 1 | 2 | 3 |
| cf) Tissue ID; Tissue type (1; BLCA[Bladder Urothelial Carcinoma], 2; BRCA[Breast invasive carcinoma], 3; CESC[Cervical squamous cell carcinoma and endocervical adenocarcinoma], 4; COAD[Colon adenocarcinoma], 5; GBM[Glioblastoma multiforme], 6; Glioma Low Grade, 7; HNSC[Head and Neck squamous cell carcinoma], 8; KICH[Kidney Chromophobe], 9; KIRC[Kidney renal clear cell carcinoma], 10; KIRP[Kidney renal papillary cell carcinoma], 11; LAML[Acute Myeloid Leukemia], 12; LUAD[Lung adenocarcinoma], 13; LUSC[Lung squamous cell carcinoma], 14; OV[Ovarian serous cystadenocarcinoma ], 15; PAAD[Pancreatic adenocarcinoma], 16; PRAD[Prostate adenocarcinoma], 17; SKCM[Skin Cutaneous Melanoma], 18:STAD[Stomach adenocarcinoma], 19:THCA[Thyroid carcinoma], 20:UCEC[Uterine Corpus Endometrial Carcinoma]) |
| Top |
| * We represented just top 10 SNVs. When you move the cursor on each content, you can see more deailed mutation information on the Tooltip. Those are primary_site, primary_histology, mutation(aa), pubmedID. |
| Genomic Position | Mutation(aa) | Unique sampleID count |
| chr12:2062038 | p.F356F | 3 |
| chr12:2062350 | p.Q426Q | 1 |
| chr12:2055431 | p.I31I | 1 |
| chr12:2061674 | p.R384C | 1 |
| chr12:2062441 | p.M617V | 1 |
| chr12:2058335 | p.N383H | 1 |
| chr12:2061703 | p.I599V | 1 |
| chr12:2064598 | p.I564V | 1 |
| chr12:2058392 | p.R344C | 1 |
| chr12:2061719 | p.L545F | 1 |
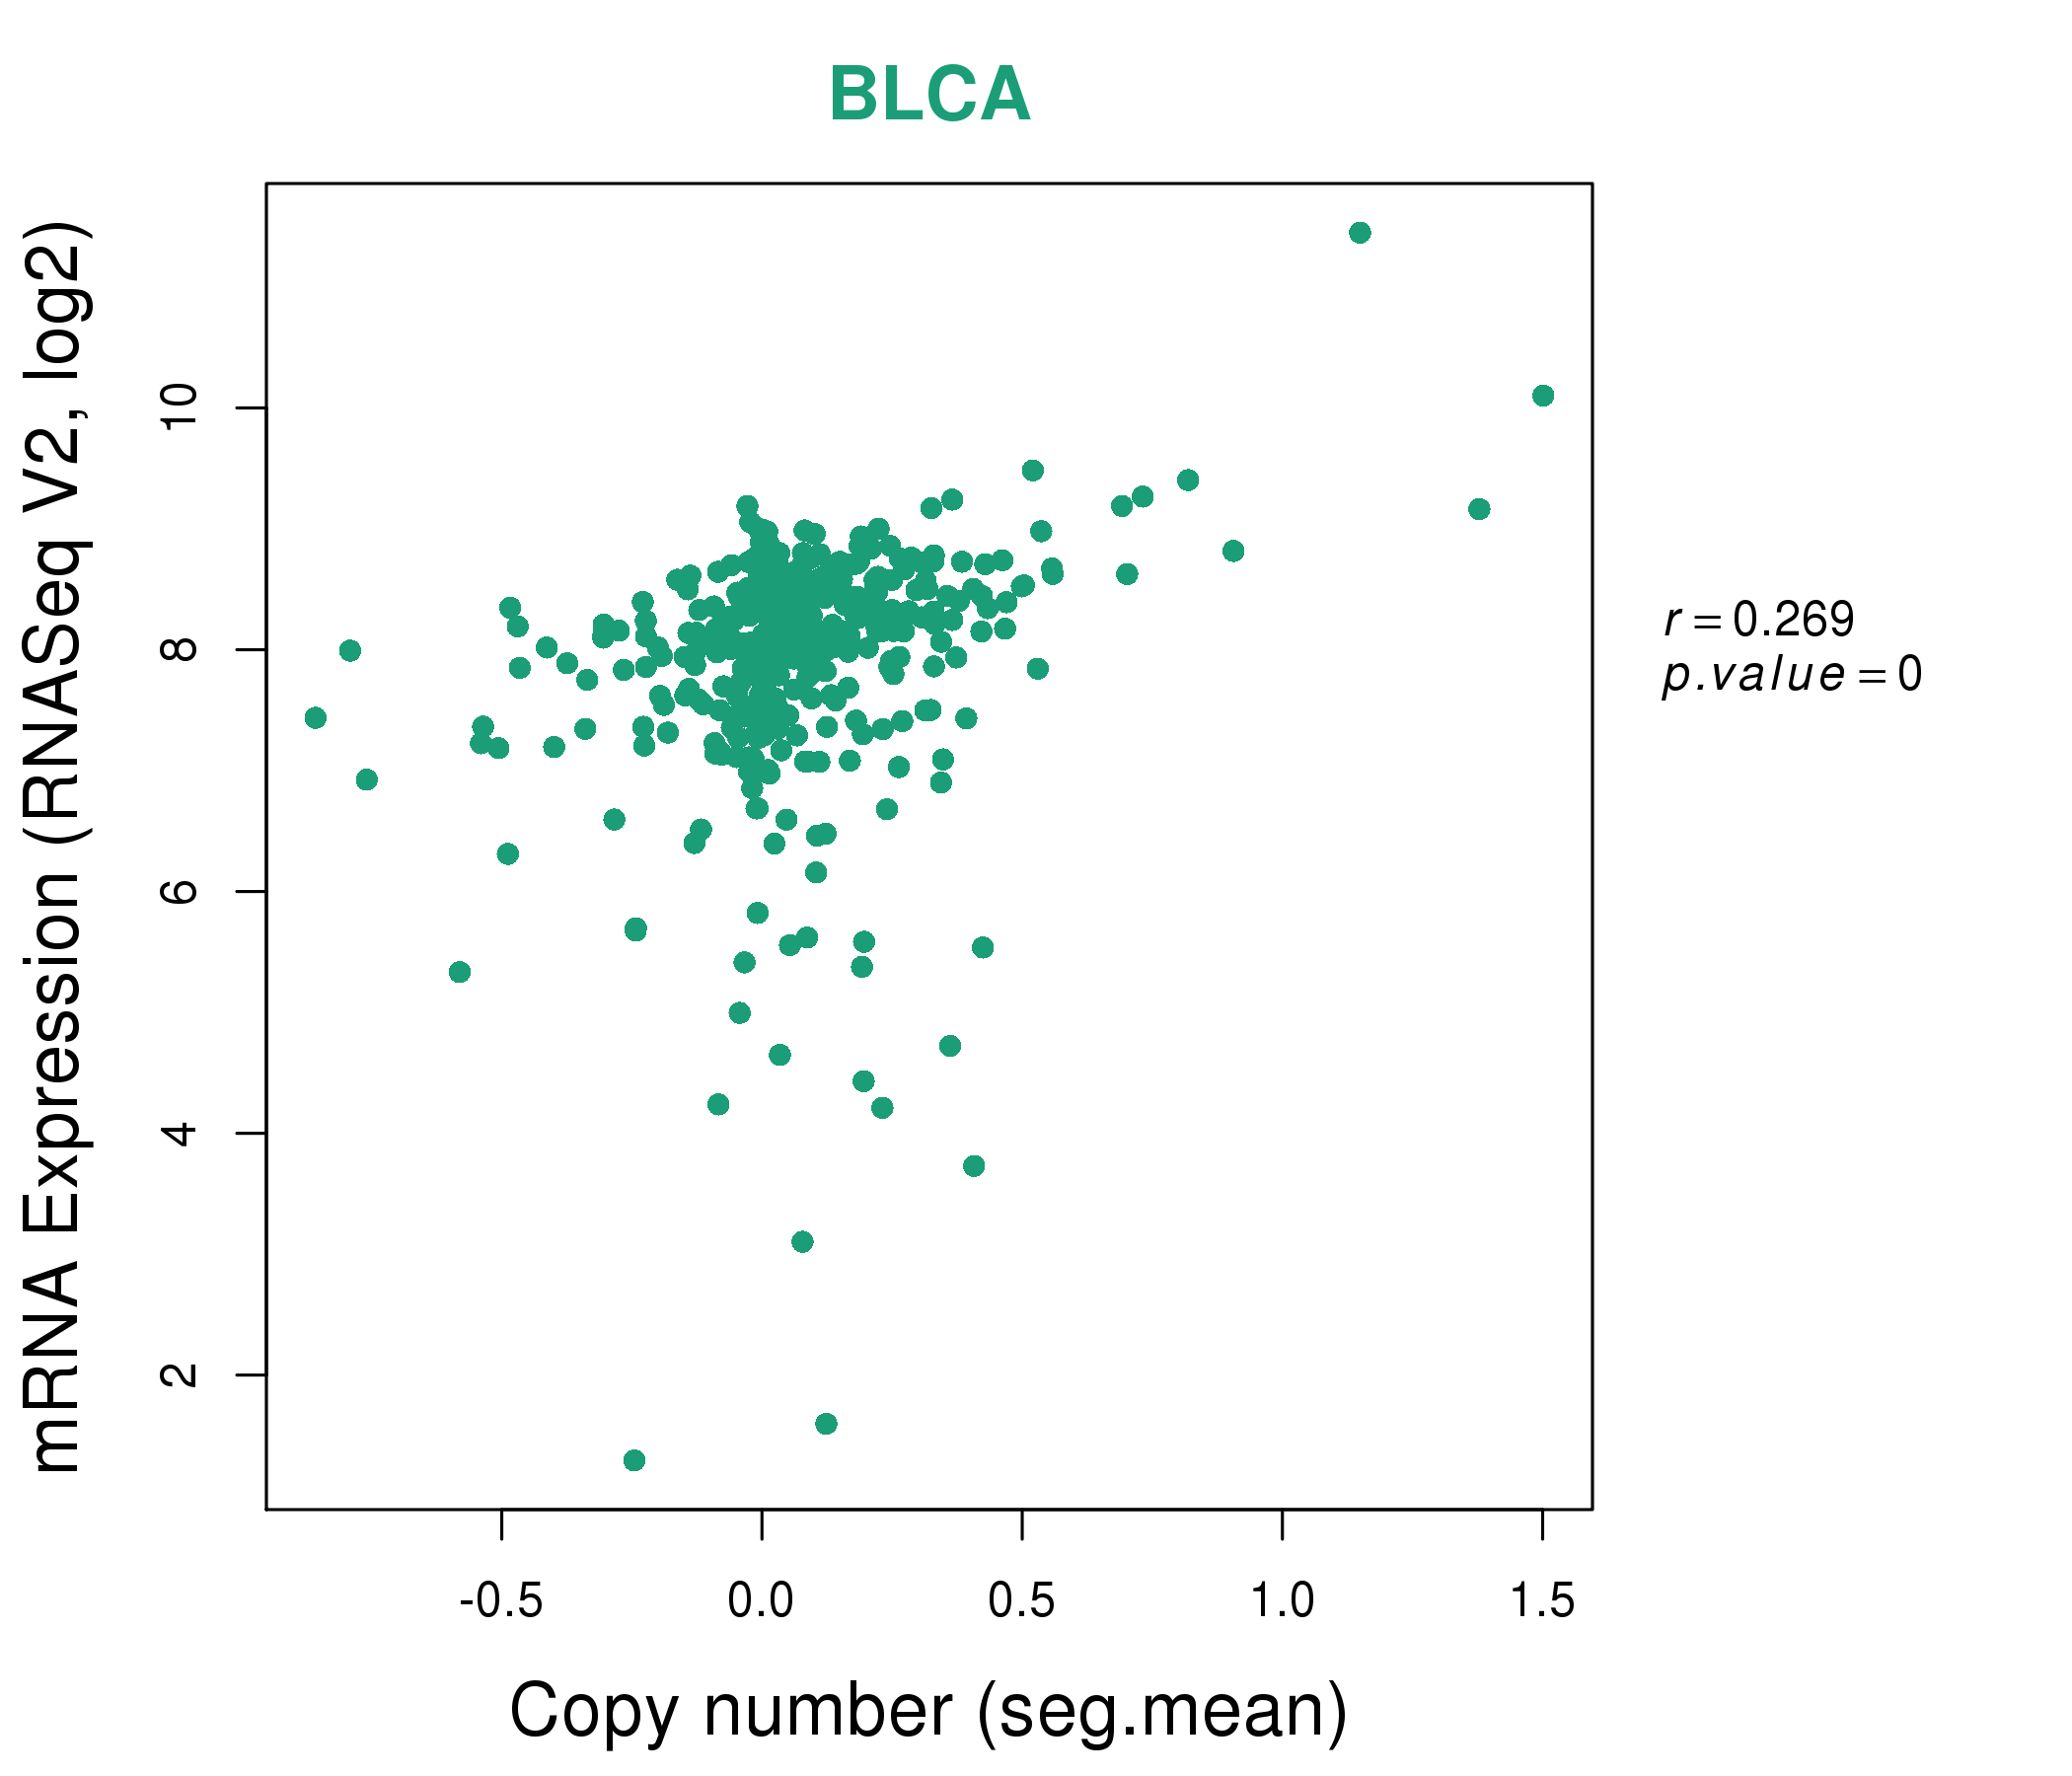
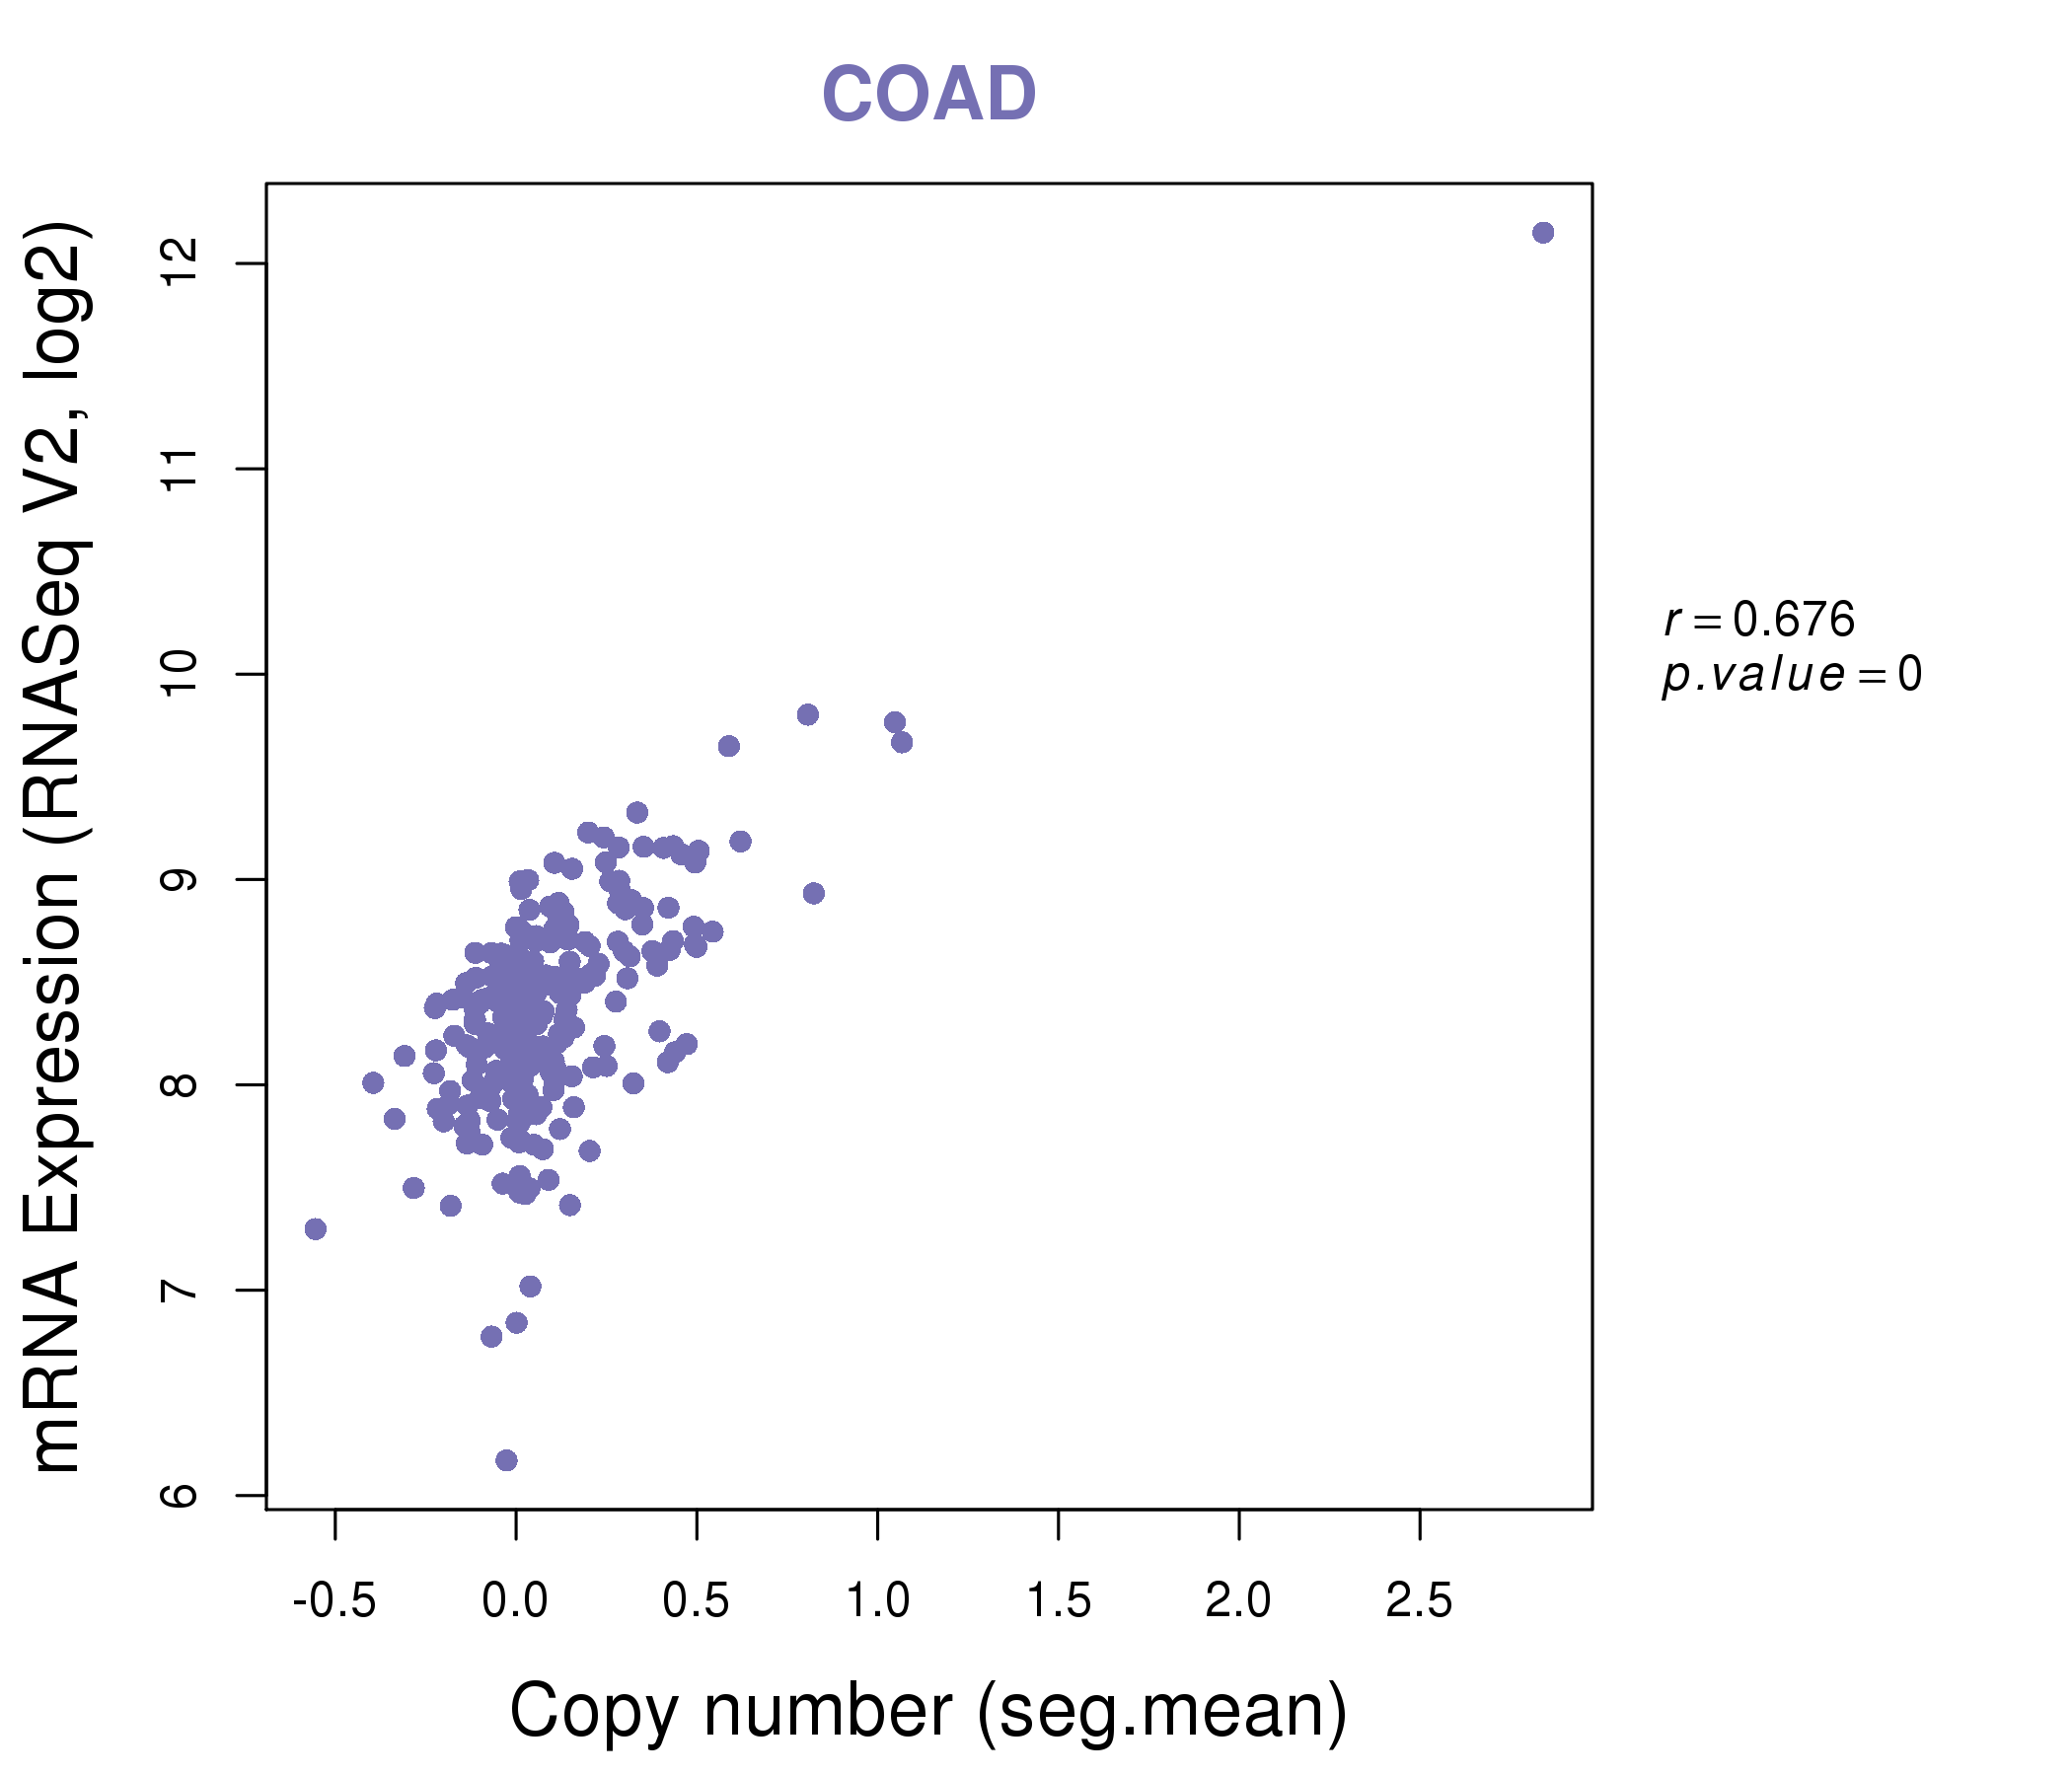
| * Copy number data were extracted from TCGA using R package TCGA-Assembler. The URLs of all public data files on TCGA DCC data server were gathered on Jan-05-2015. Function ProcessCNAData in TCGA-Assembler package was used to obtain gene-level copy number value which is calculated as the average copy number of the genomic region of a gene. |
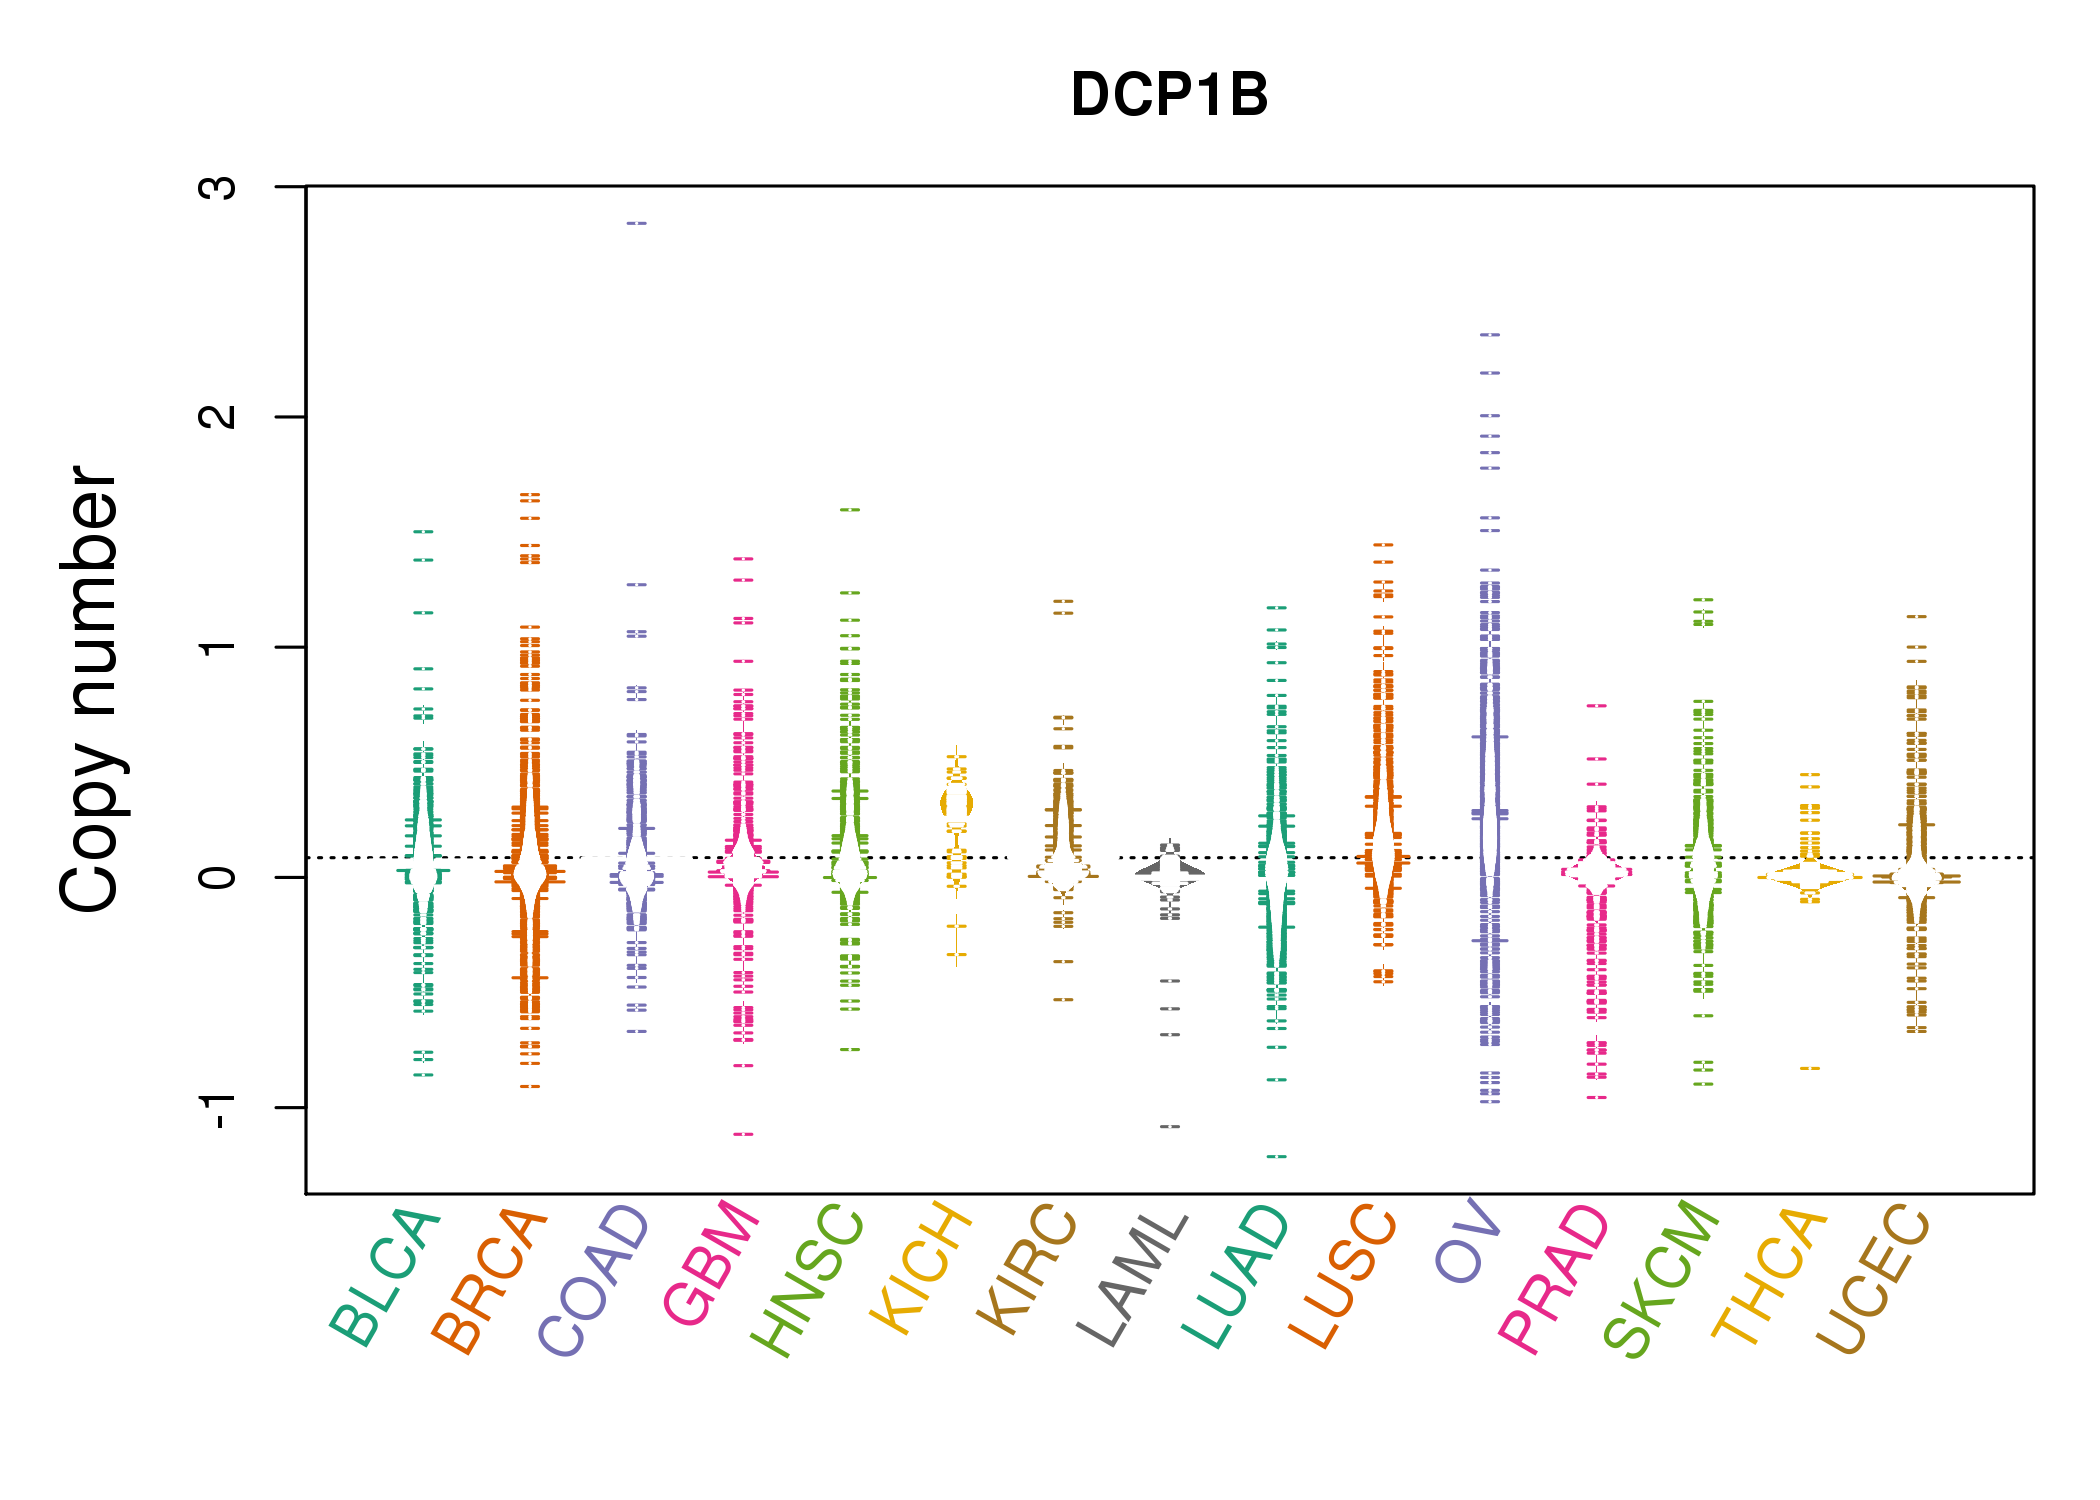 |
| cf) Tissue ID[Tissue type]: BLCA[Bladder Urothelial Carcinoma], BRCA[Breast invasive carcinoma], CESC[Cervical squamous cell carcinoma and endocervical adenocarcinoma], COAD[Colon adenocarcinoma], GBM[Glioblastoma multiforme], Glioma Low Grade, HNSC[Head and Neck squamous cell carcinoma], KICH[Kidney Chromophobe], KIRC[Kidney renal clear cell carcinoma], KIRP[Kidney renal papillary cell carcinoma], LAML[Acute Myeloid Leukemia], LUAD[Lung adenocarcinoma], LUSC[Lung squamous cell carcinoma], OV[Ovarian serous cystadenocarcinoma ], PAAD[Pancreatic adenocarcinoma], PRAD[Prostate adenocarcinoma], SKCM[Skin Cutaneous Melanoma], STAD[Stomach adenocarcinoma], THCA[Thyroid carcinoma], UCEC[Uterine Corpus Endometrial Carcinoma] |
| Top |
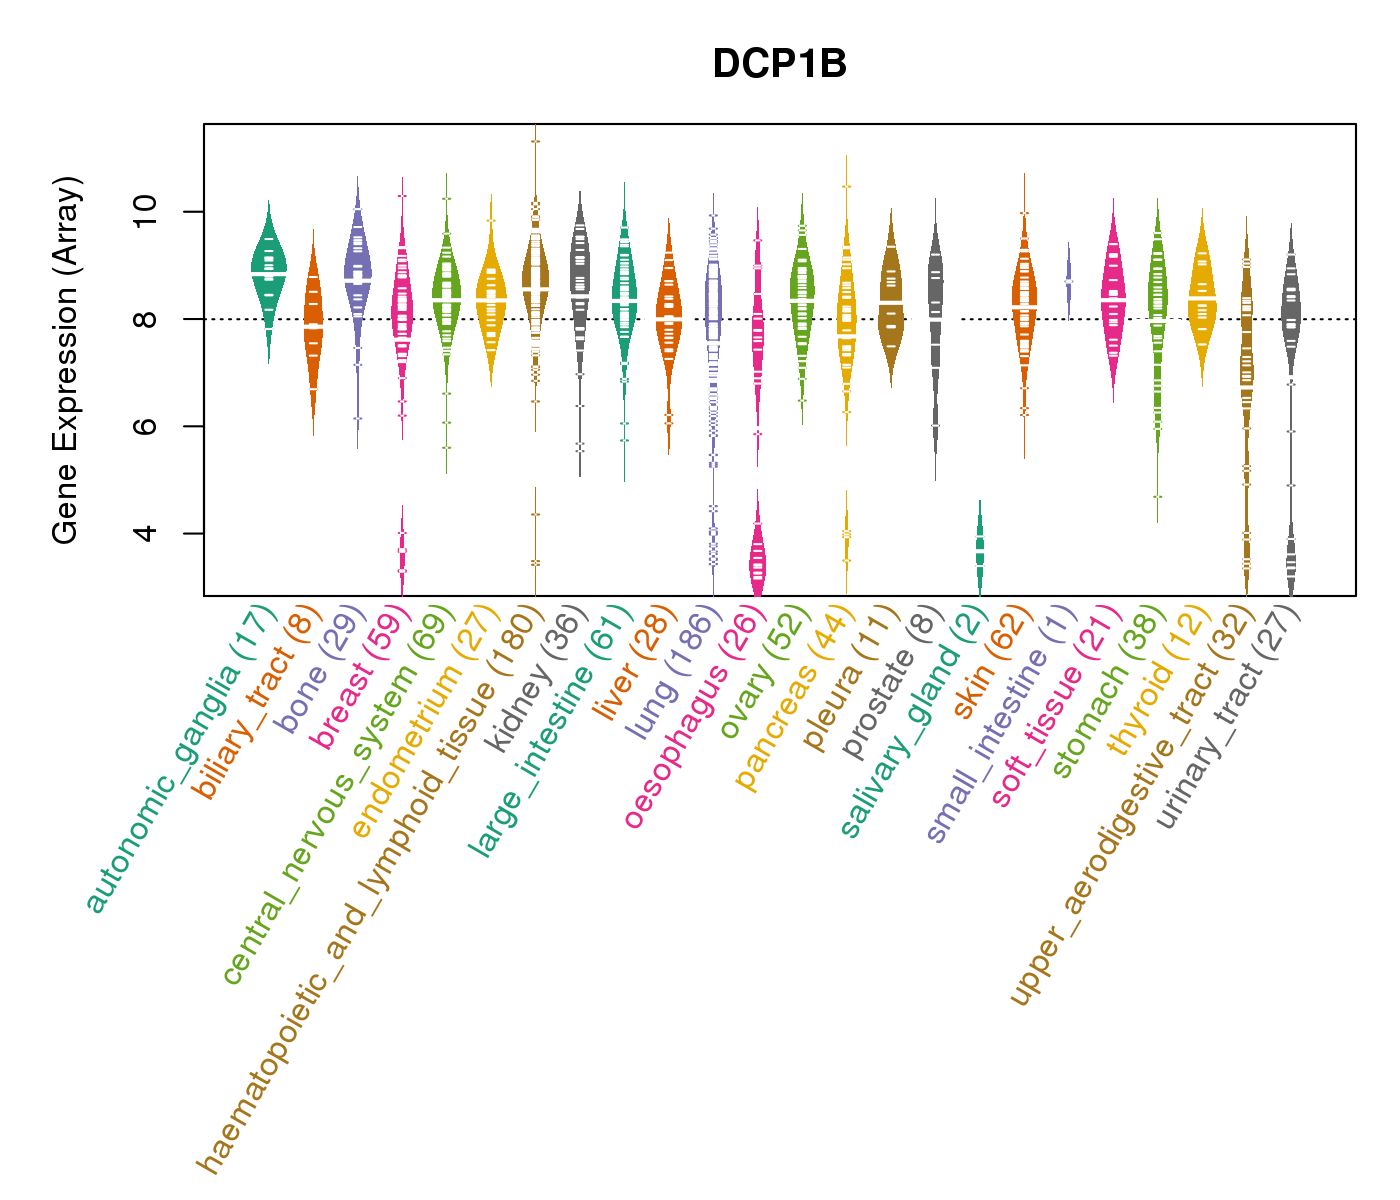
| Gene Expression for DCP1B |
| * CCLE gene expression data were extracted from CCLE_Expression_Entrez_2012-10-18.res: Gene-centric RMA-normalized mRNA expression data. |
 |
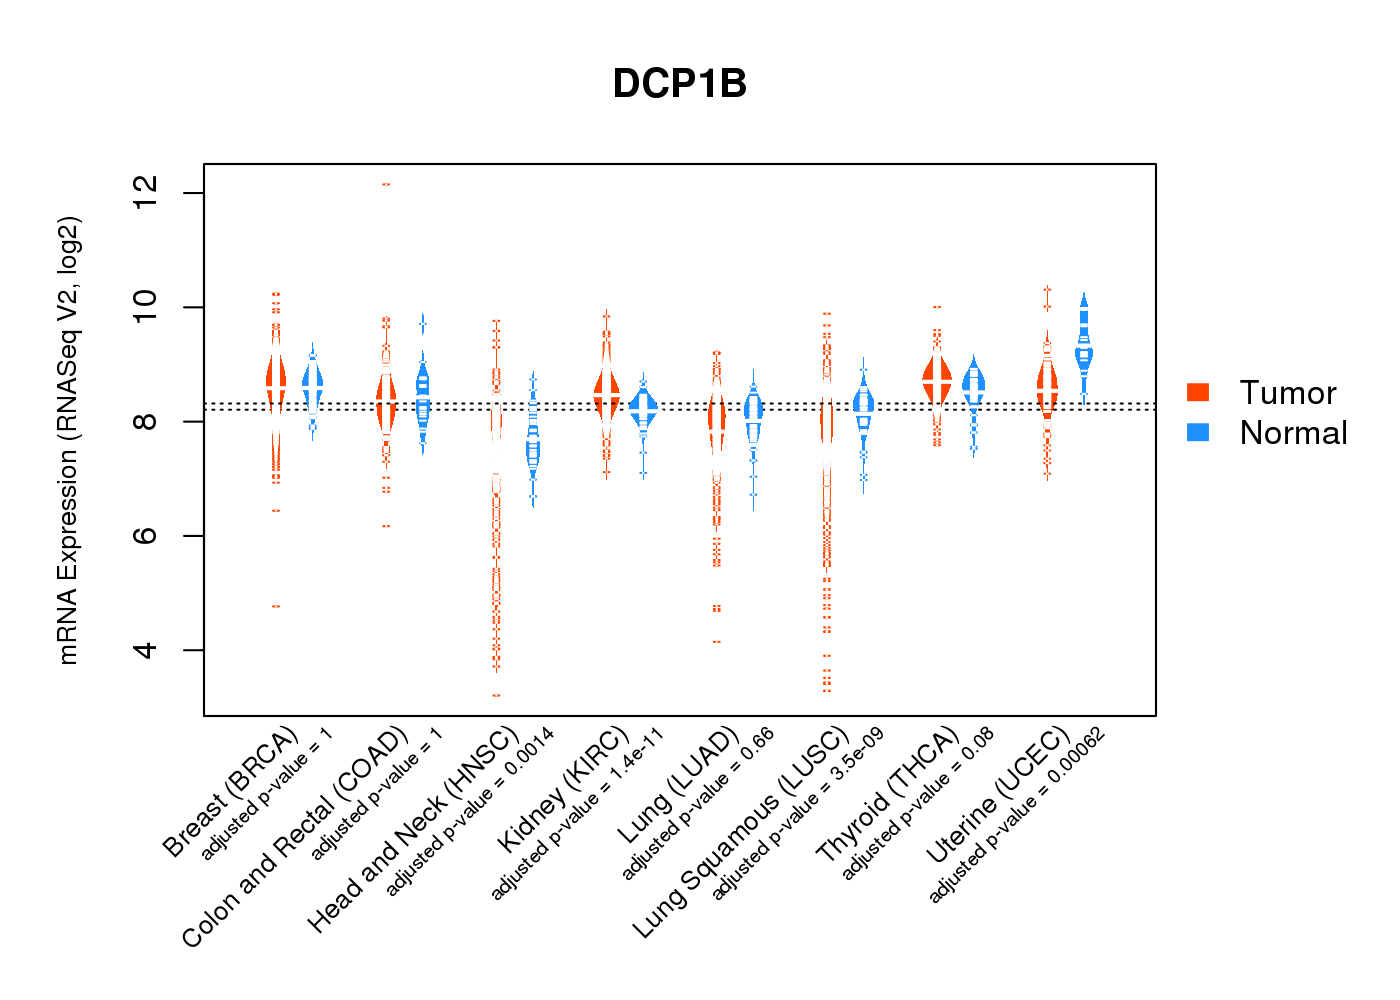
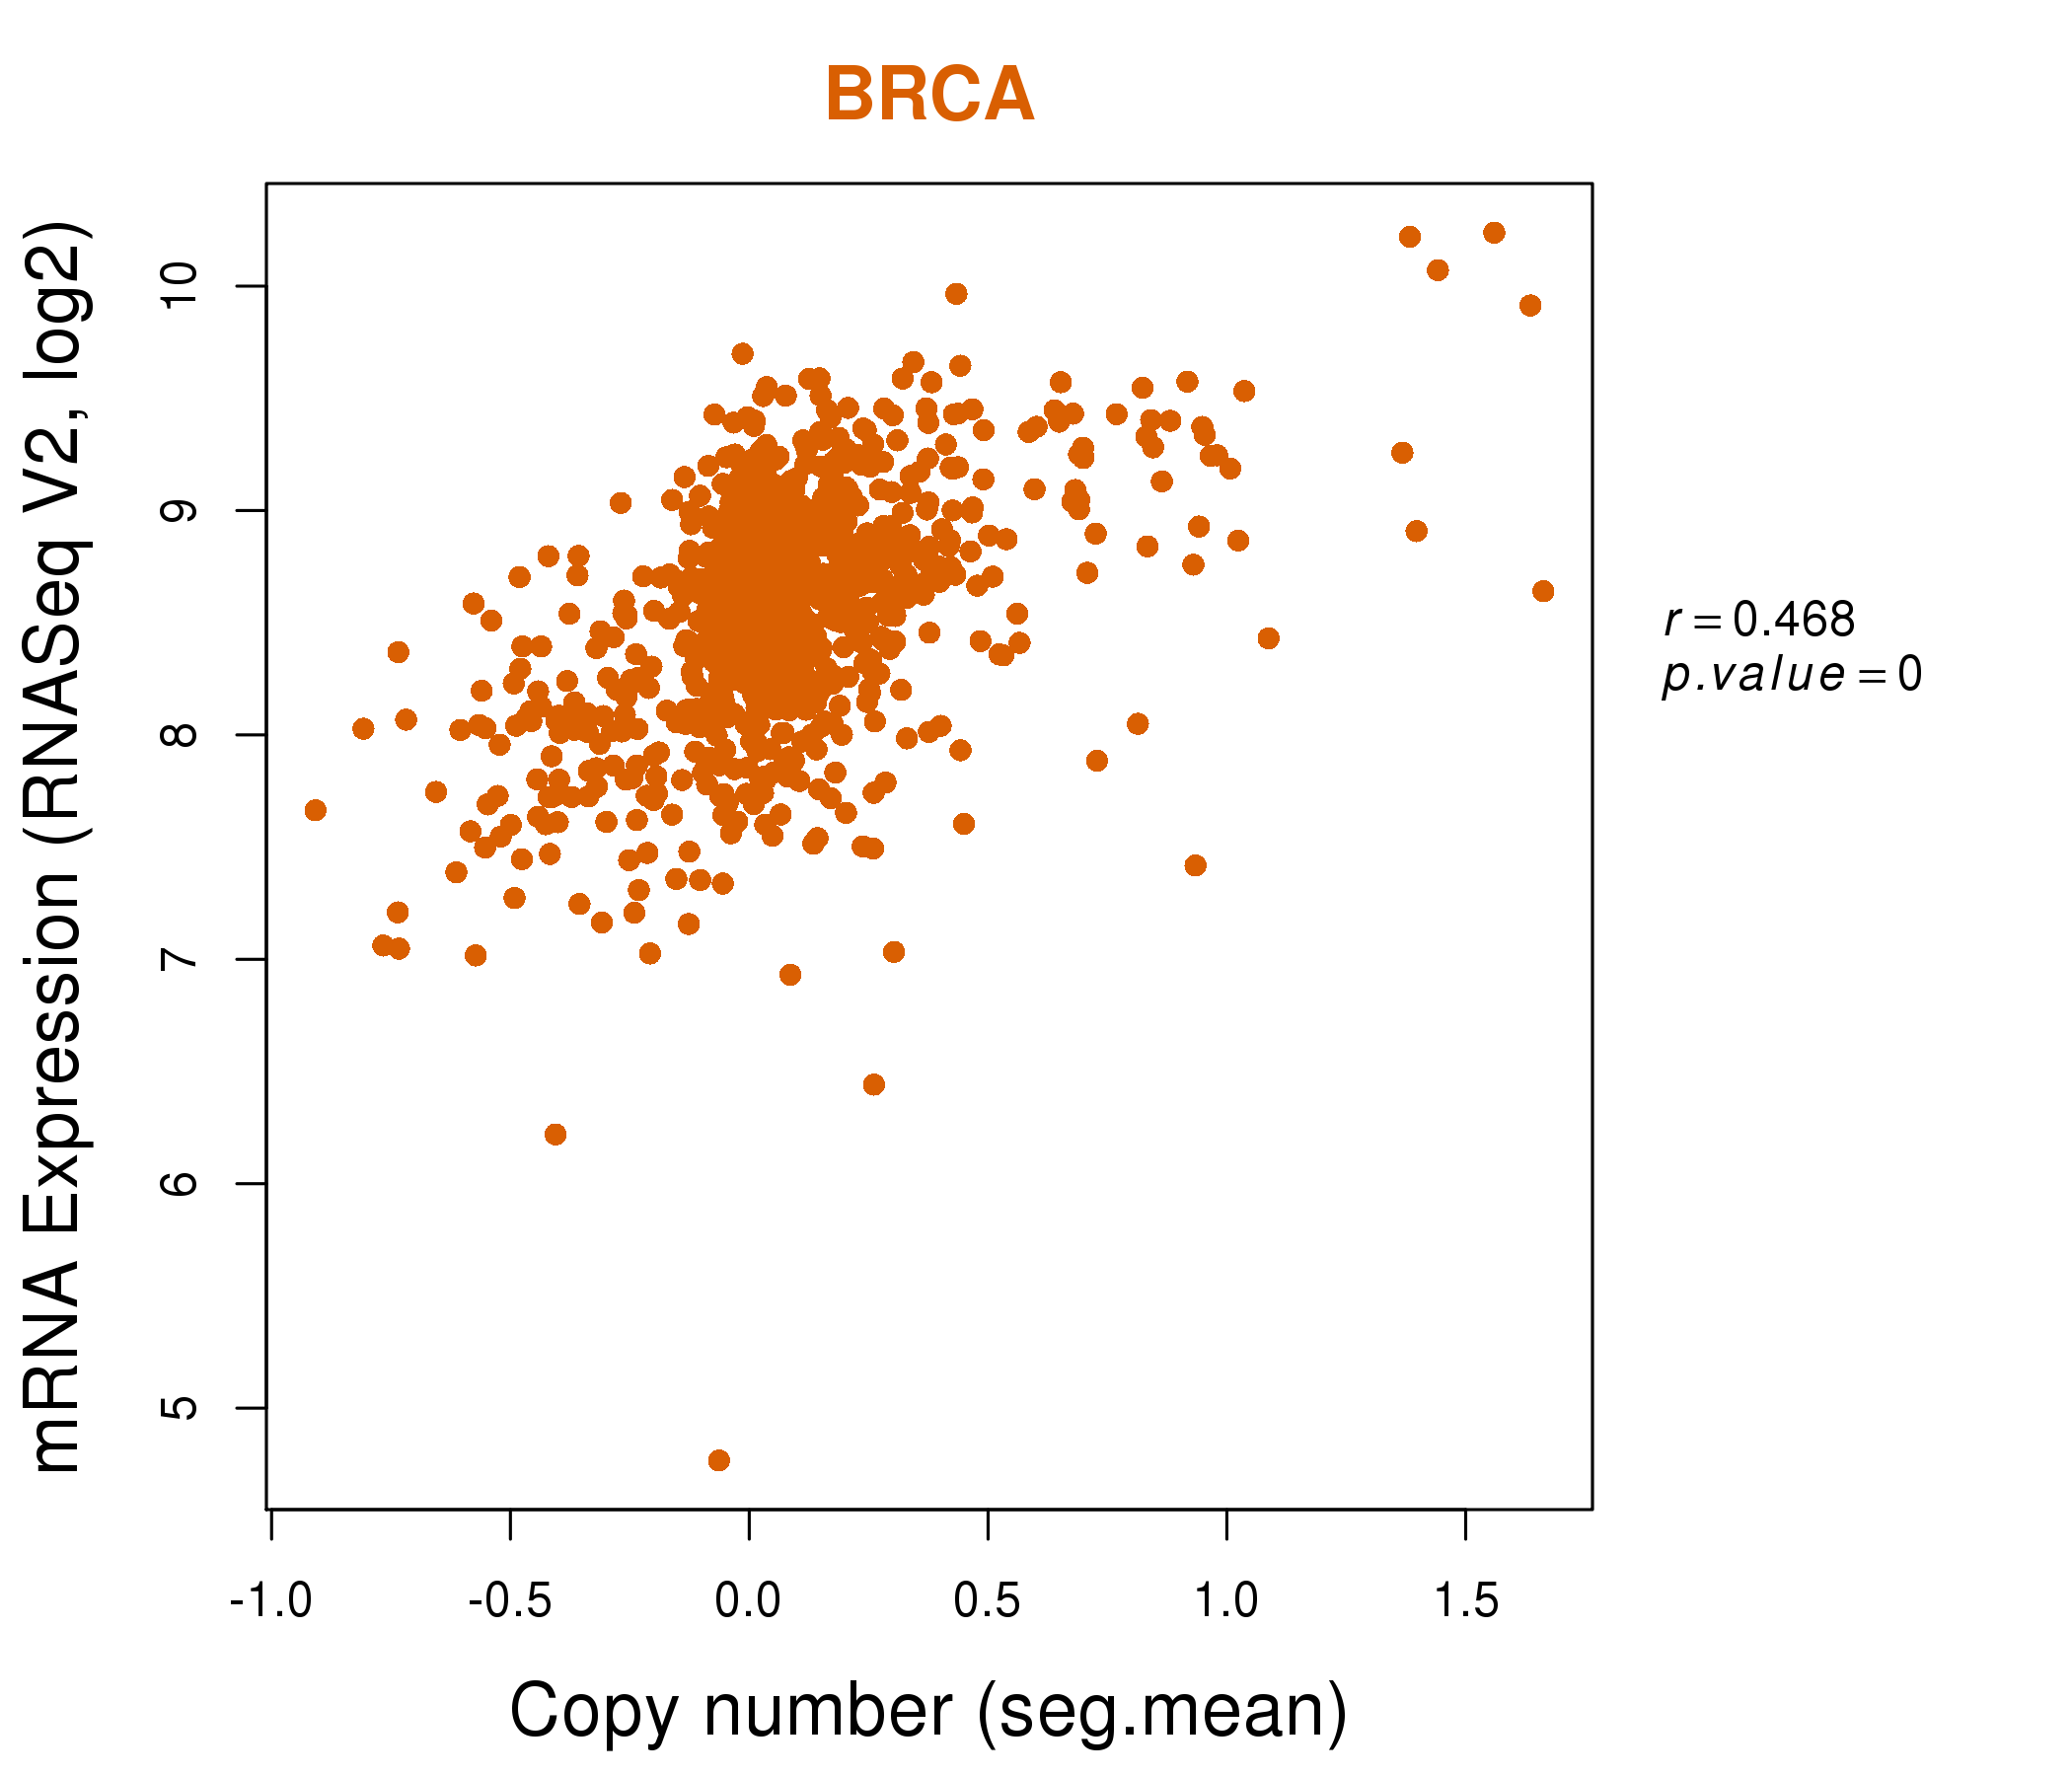
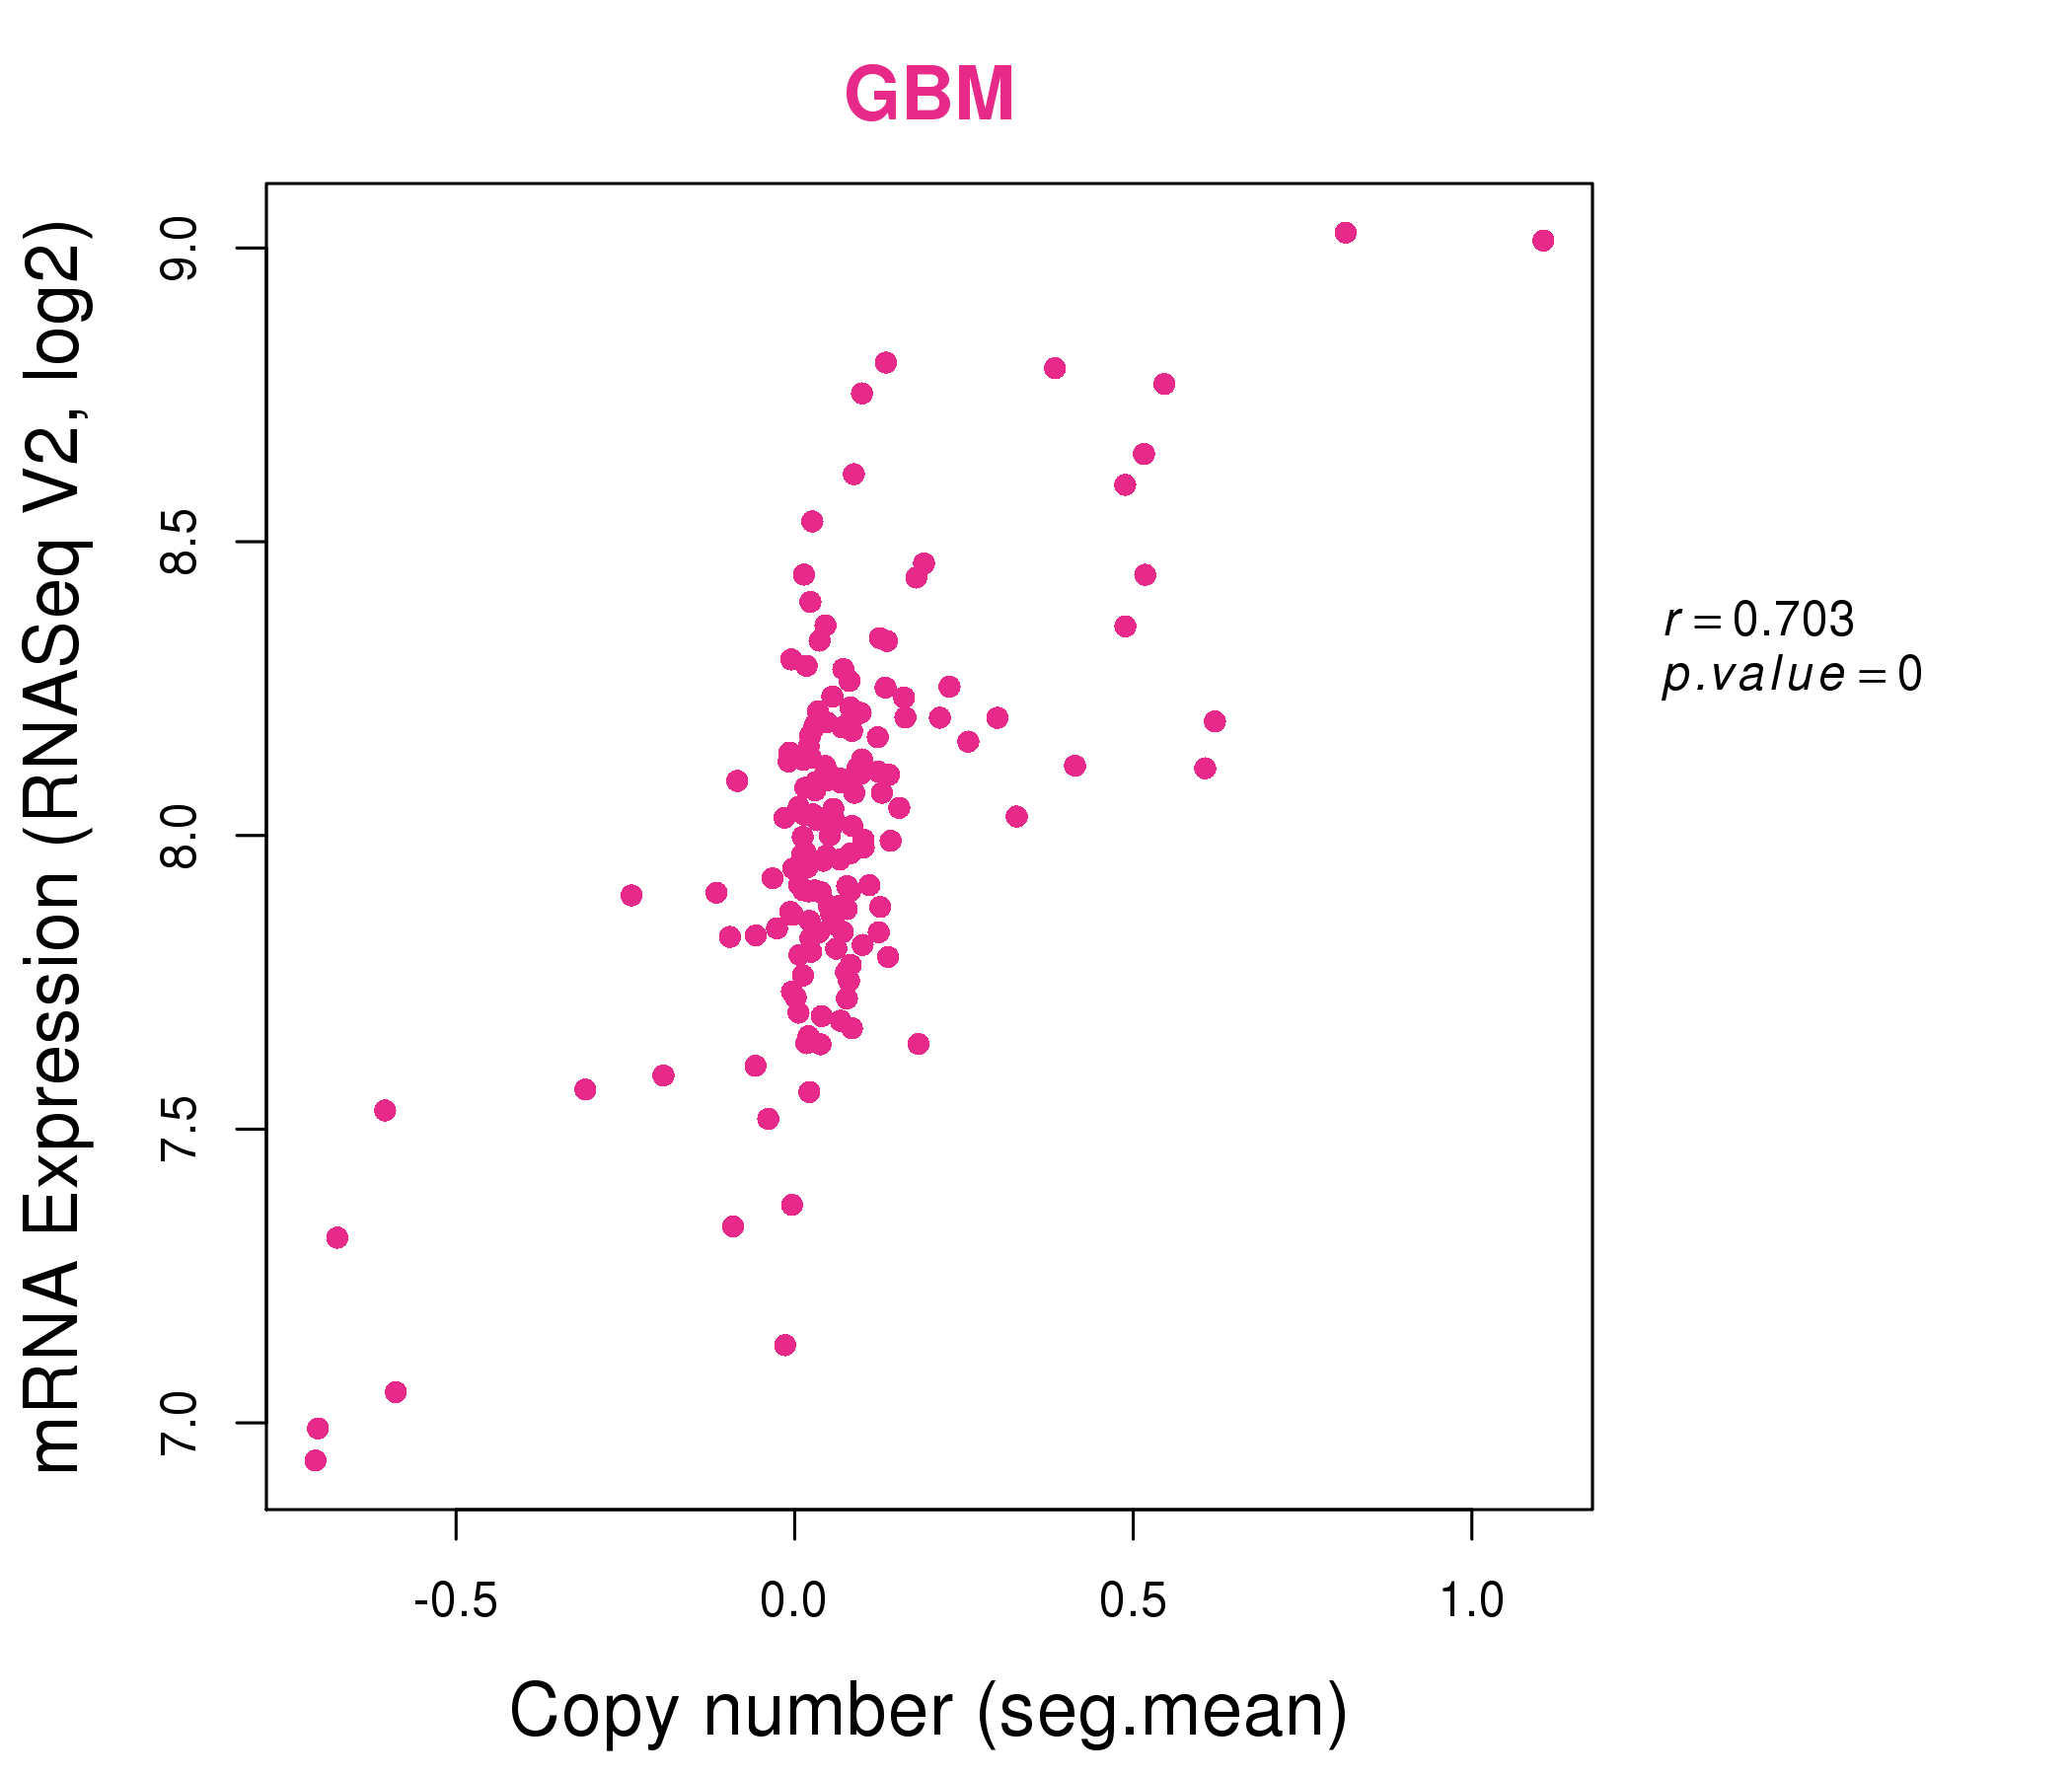
| * Normalized gene expression data of RNASeqV2 was extracted from TCGA using R package TCGA-Assembler. The URLs of all public data files on TCGA DCC data server were gathered at Jan-05-2015. Only eight cancer types have enough normal control samples for differential expression analysis. (t test, adjusted p<0.05 (using Benjamini-Hochberg FDR)) |
 |
| Top |
| * This plots show the correlation between CNV and gene expression. |
: Open all plots for all cancer types
 |
|
 |
|
| Top |
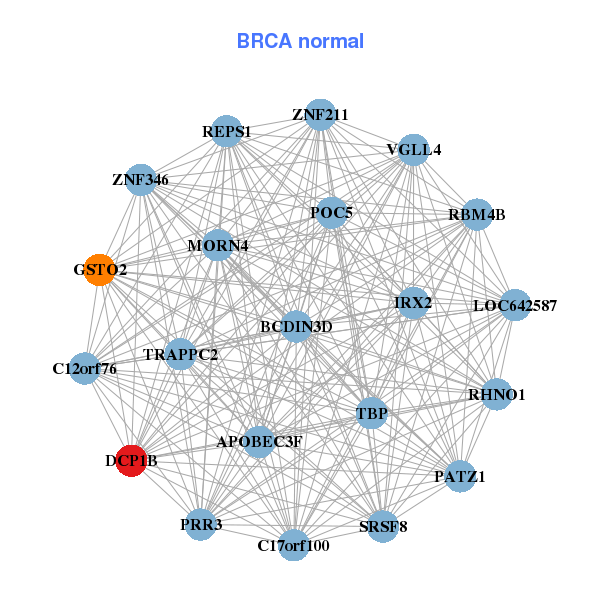
| Gene-Gene Network Information |
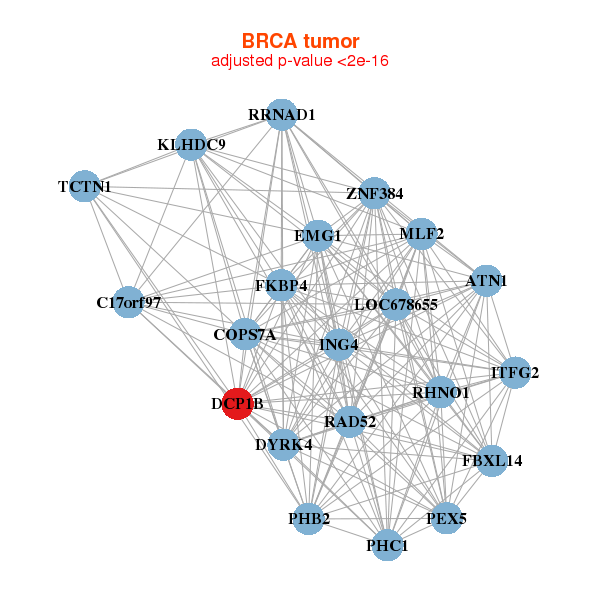
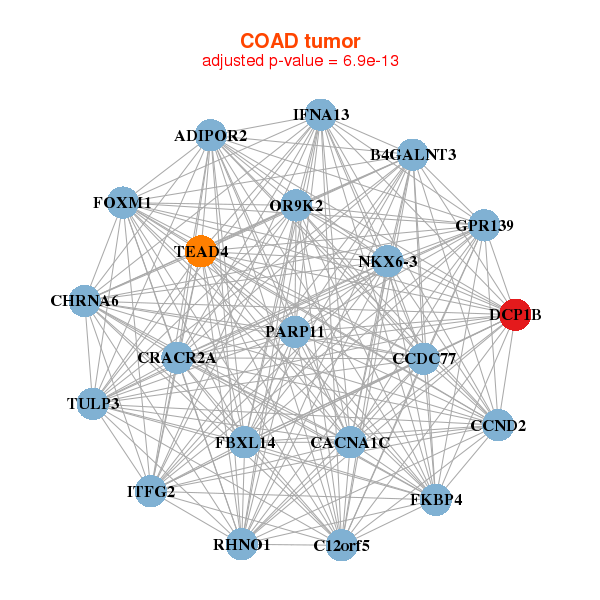
| * Co-Expression network figures were drawn using R package igraph. Only the top 20 genes with the highest correlations were shown. Red circle: input gene, orange circle: cell metabolism gene, sky circle: other gene |
: Open all plots for all cancer types
 |
| ||||
| ATN1,RHNO1,C17orf97,RRNAD1,COPS7A,DCP1B,DYRK4, EMG1,FBXL14,FKBP4,ING4,ITFG2,KLHDC9,LOC678655, MLF2,PEX5,PHB2,PHC1,RAD52,TCTN1,ZNF384 | APOBEC3F,BCDIN3D,RHNO1,C12orf76,C17orf100,DCP1B,GSTO2, IRX2,LOC642587,MORN4,PATZ1,POC5,PRR3,RBM4B, REPS1,SRSF8,TBP,TRAPPC2,VGLL4,ZNF211,ZNF346 | ||||
 |
| ||||
| ADIPOR2,B4GALNT3,RHNO1,C12orf5,CACNA1C,CCDC77,CCND2, CHRNA6,DCP1B,CRACR2A,FBXL14,FKBP4,FOXM1,GPR139, IFNA13,ITFG2,NKX6-3,OR9K2,PARP11,TEAD4,TULP3 | ABHD8,BEND5,C3orf18,CLUAP1,DCP1B,DPF2,HLX, KLHDC8B,KLHL22,LOC441869,LZTS2,PGM5P2,PHLDA3,RBM43, RRAS,RTN2,SNAPC2,THAP8,TRAM1L1,TSPY26P,ZNF174 |
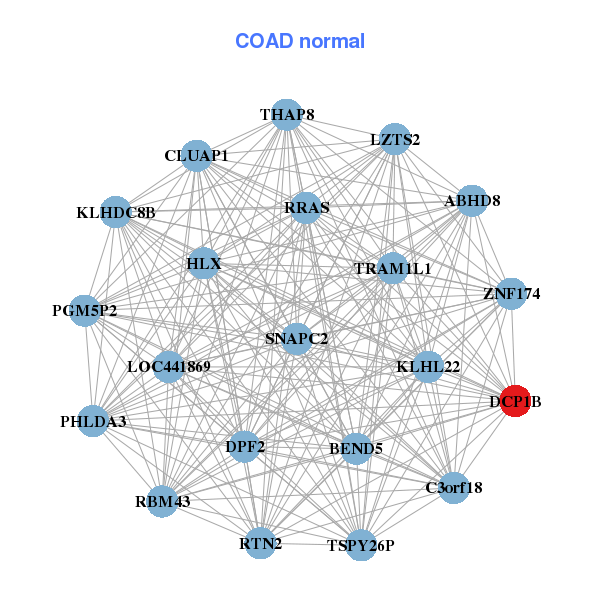
| * Co-Expression network figures were drawn using R package igraph. Only the top 20 genes with the highest correlations were shown. Red circle: input gene, orange circle: cell metabolism gene, sky circle: other gene |
: Open all plots for all cancer types
| Top |
: Open all interacting genes' information including KEGG pathway for all interacting genes from DAVID
| Top |
| Pharmacological Information for DCP1B |
| DB Category | DB Name | DB's ID and Url link |
| * Gene Centered Interaction Network. |
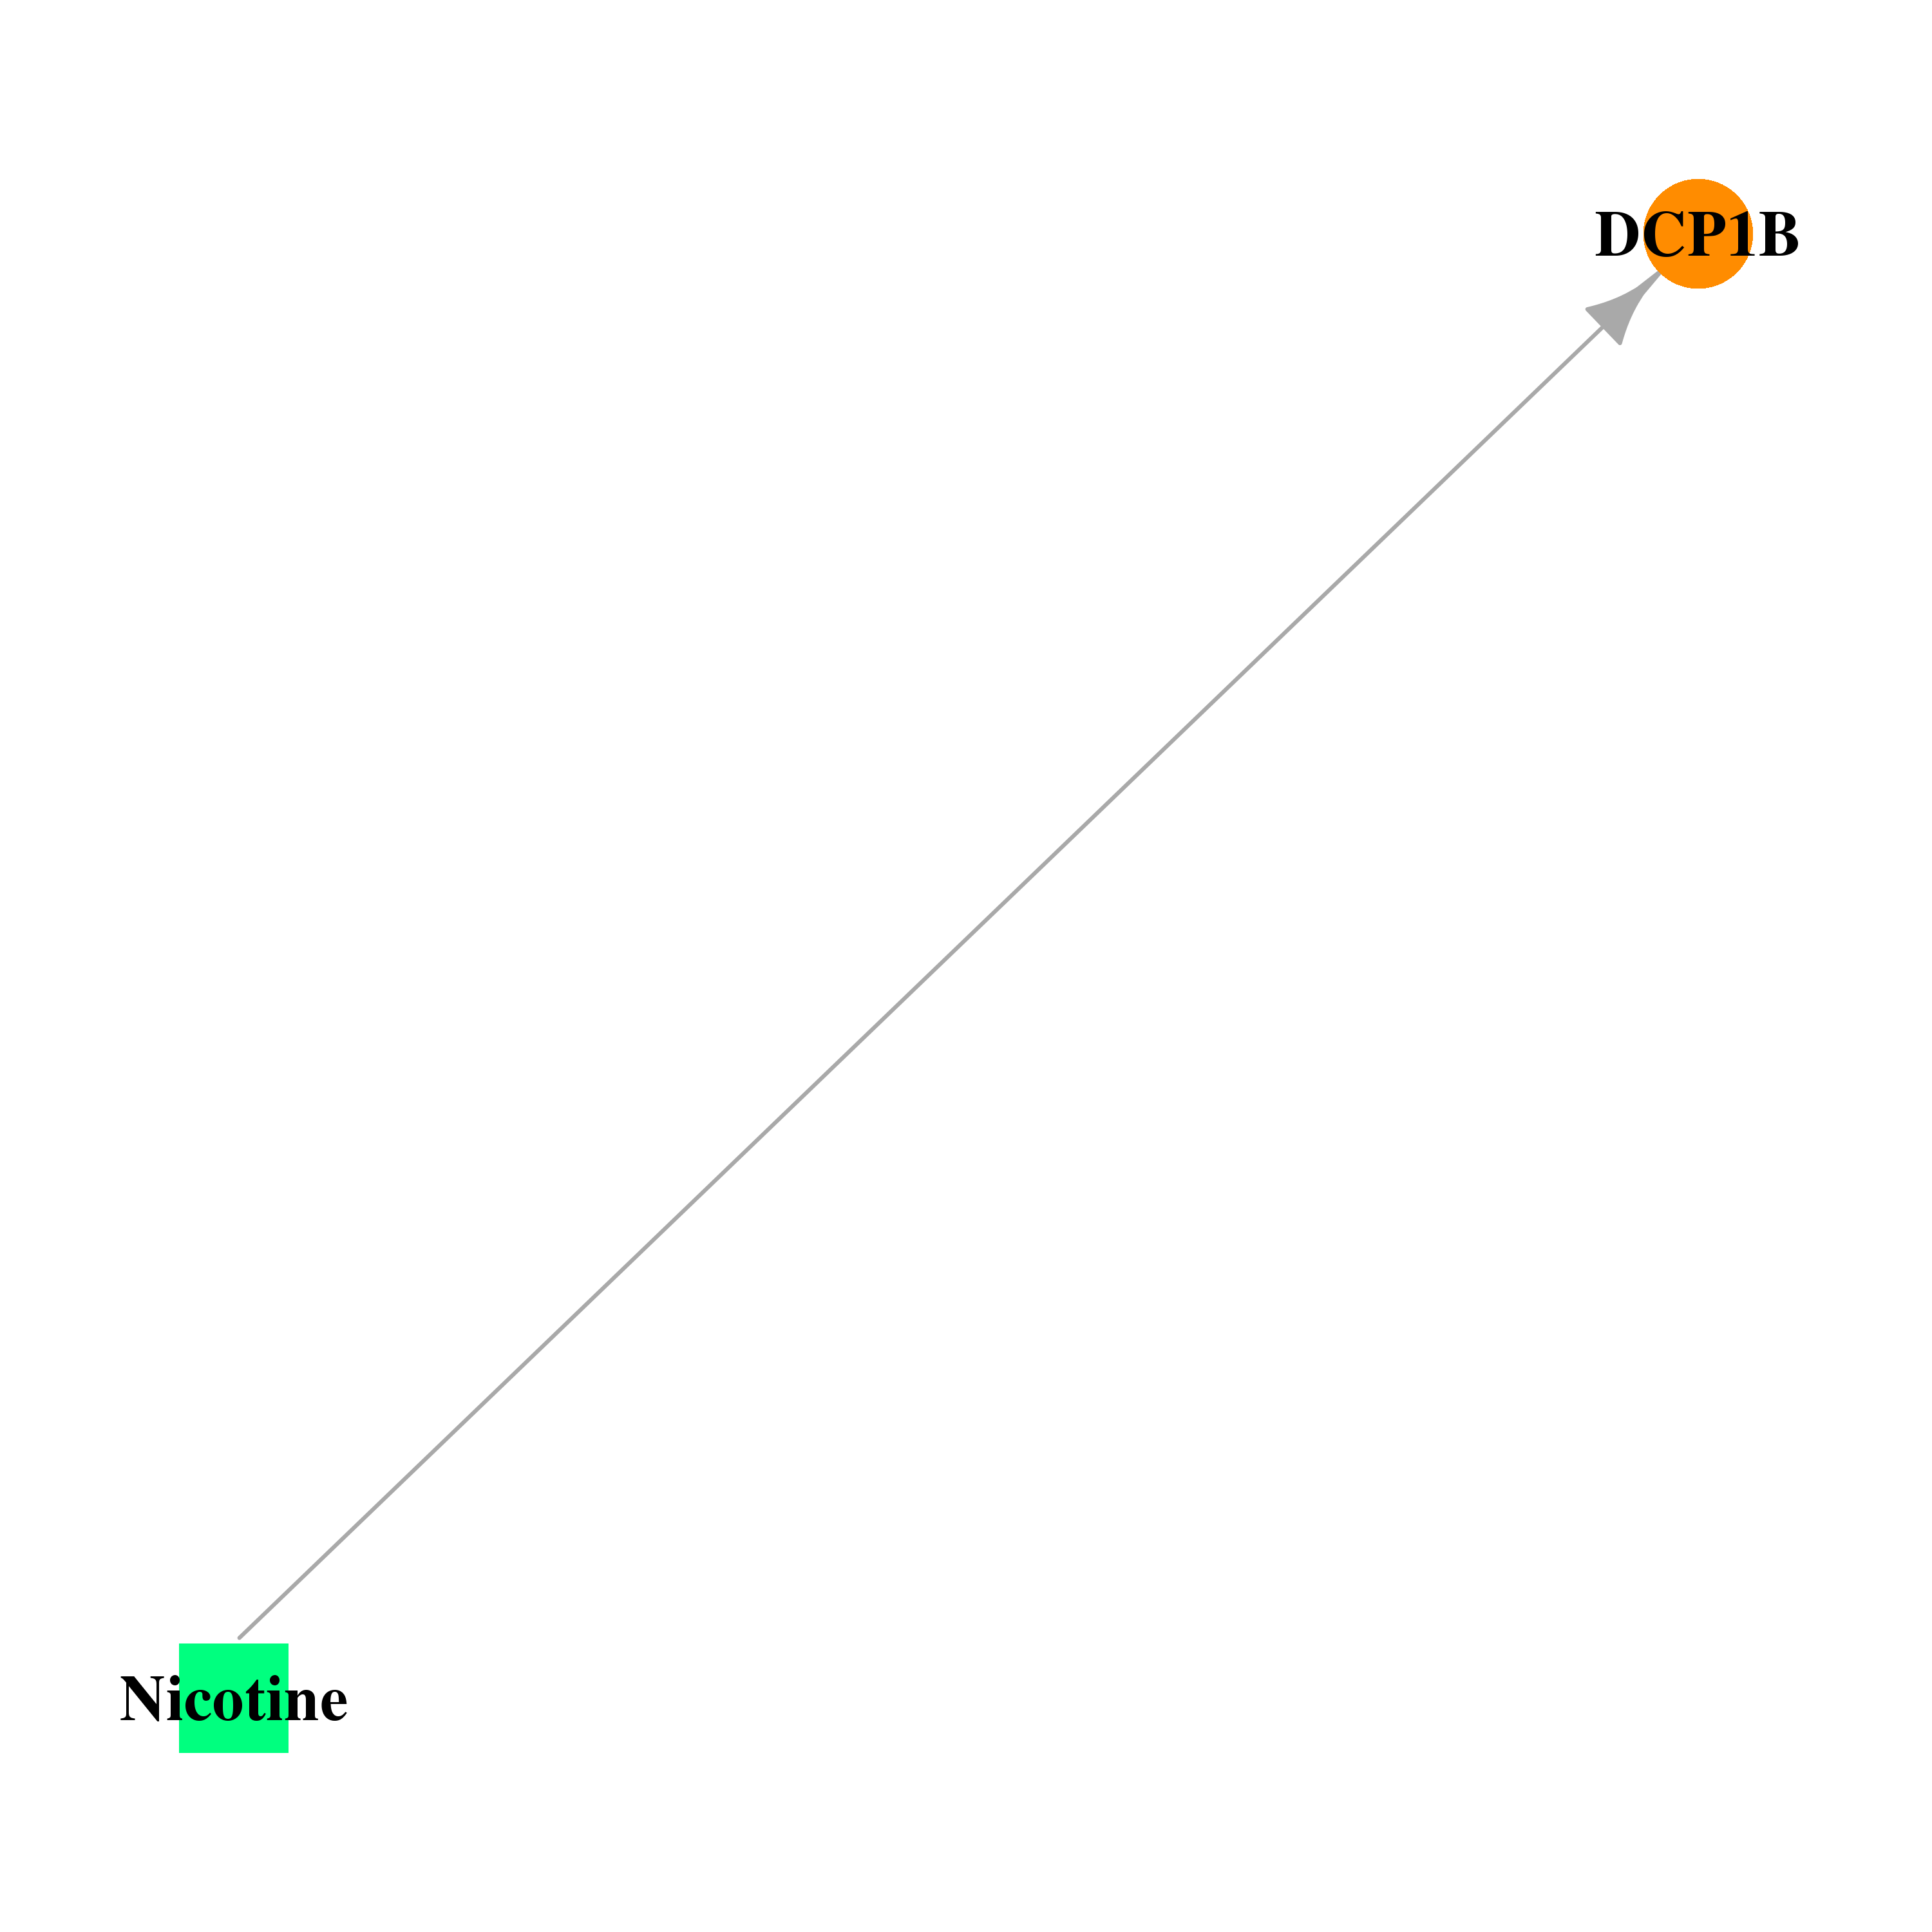 |
| * Drug Centered Interaction Network. |
| DrugBank ID | Target Name | Drug Groups | Generic Name | Drug Centered Network | Drug Structure |
| DB00184 | decapping mRNA 1B | approved | Nicotine |  | 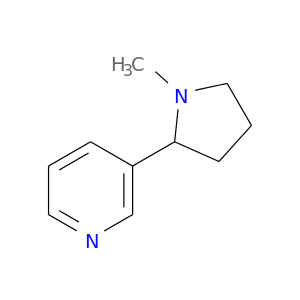 |
| Top |
| Cross referenced IDs for DCP1B |
| * We obtained these cross-references from Uniprot database. It covers 150 different DBs, 18 categories. http://www.uniprot.org/help/cross_references_section |
: Open all cross reference information
|
Copyright © 2016-Present - The Univsersity of Texas Health Science Center at Houston @ |