|
||||||||||||||||||||
| |
| Phenotypic Information (metabolism pathway, cancer, disease, phenome) |
| |
| |
| Gene-Gene Network Information: Co-Expression Network, Interacting Genes & KEGG |
| |
|


| Gene Summary for EIF2B1 |
| Top |
| Phenotypic Information for EIF2B1(metabolism pathway, cancer, disease, phenome) |
| Cancer | CGAP: EIF2B1 |
| Familial Cancer Database: EIF2B1 | |
| * This gene is included in those cancer gene databases. |
|
|
|
|
|
| . | ||||||||||||||
Oncogene 1 | Significant driver gene in | |||||||||||||||||||
| cf) number; DB name 1 Oncogene; http://nar.oxfordjournals.org/content/35/suppl_1/D721.long, 2 Tumor Suppressor gene; https://bioinfo.uth.edu/TSGene/, 3 Cancer Gene Census; http://www.nature.com/nrc/journal/v4/n3/abs/nrc1299.html, 4 CancerGenes; http://nar.oxfordjournals.org/content/35/suppl_1/D721.long, 5 Network of Cancer Gene; http://ncg.kcl.ac.uk/index.php, 1Therapeutic Vulnerabilities in Cancer; http://cbio.mskcc.org/cancergenomics/statius/ |
| REACTOME_METABOLISM_OF_PROTEINS | |
| OMIM | 603896; phenotype. 606686; gene. |
| Orphanet | 157713; Congenital or early infantile CACH syndrome. 157716; Late infantile CACH syndrome. 157719; Juvenile or adult CACH syndrome. 99853; Ovarioleukodystrophy. 99854; Cree leukoencephalopathy. |
| Disease | KEGG Disease: EIF2B1 |
| MedGen: EIF2B1 (Human Medical Genetics with Condition) | |
| ClinVar: EIF2B1 | |
| Phenotype | MGI: EIF2B1 (International Mouse Phenotyping Consortium) |
| PhenomicDB: EIF2B1 | |
| Mutations for EIF2B1 |
| * Under tables are showing count per each tissue to give us broad intuition about tissue specific mutation patterns.You can go to the detailed page for each mutation database's web site. |
| - Statistics for Tissue and Mutation type | Top |
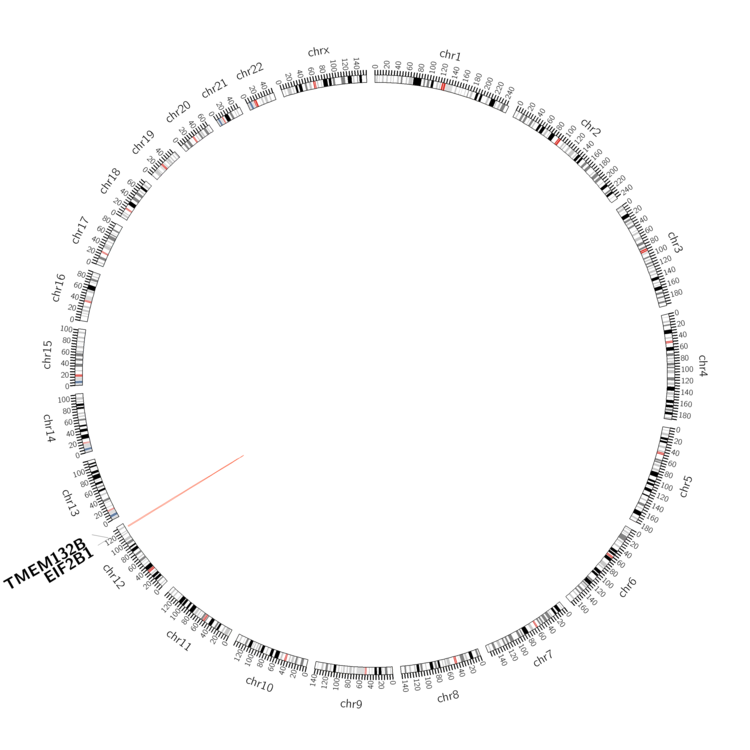 |
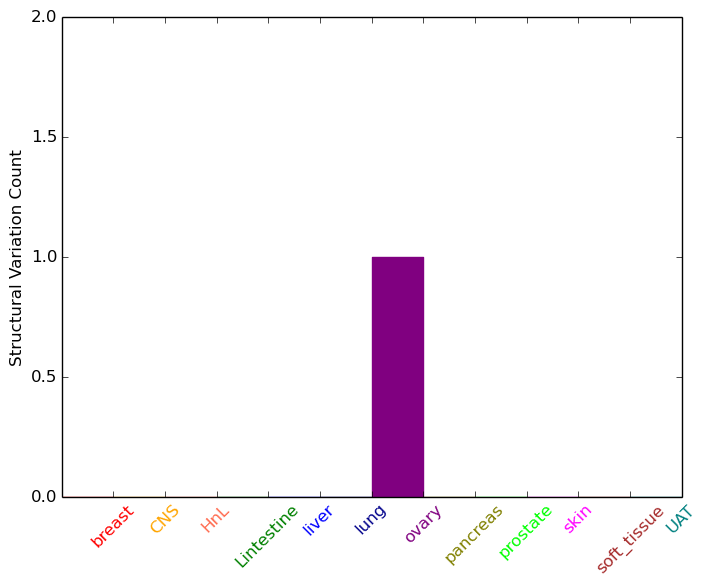
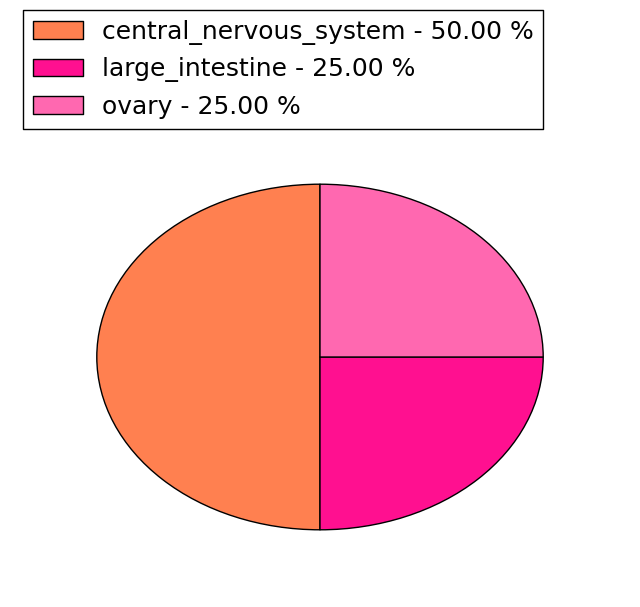
| - For Inter-chromosomal Variations |
| There's no inter-chromosomal structural variation. |
| - For Intra-chromosomal Variations |
| * Intra-chromosomal variantions includes 'intrachromosomal amplicon to amplicon', 'intrachromosomal amplicon to non-amplified dna', 'intrachromosomal deletion', 'intrachromosomal fold-back inversion', 'intrachromosomal inversion', 'intrachromosomal tandem duplication', 'Intrachromosomal unknown type', 'intrachromosomal with inverted orientation', 'intrachromosomal with non-inverted orientation'. |
 |
| Sample | Symbol_a | Chr_a | Start_a | End_a | Symbol_b | Chr_b | Start_b | End_b |
| ovary | EIF2B1 | chr12 | 124112624 | 124112644 | TMEM132B | chr12 | 125980405 | 125980425 |
| cf) Tissue number; Tissue name (1;Breast, 2;Central_nervous_system, 3;Haematopoietic_and_lymphoid_tissue, 4;Large_intestine, 5;Liver, 6;Lung, 7;Ovary, 8;Pancreas, 9;Prostate, 10;Skin, 11;Soft_tissue, 12;Upper_aerodigestive_tract) |
| * From mRNA Sanger sequences, Chitars2.0 arranged chimeric transcripts. This table shows EIF2B1 related fusion information. |
| ID | Head Gene | Tail Gene | Accession | Gene_a | qStart_a | qEnd_a | Chromosome_a | tStart_a | tEnd_a | Gene_a | qStart_a | qEnd_a | Chromosome_a | tStart_a | tEnd_a |
| Top |
| There's no copy number variation information in COSMIC data for this gene. |
| Top |
|
 |
| Top |
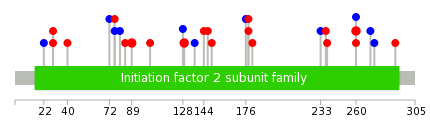
| Stat. for Non-Synonymous SNVs (# total SNVs=17) | (# total SNVs=4) |
 |  |
(# total SNVs=1) | (# total SNVs=0) |
 |
| Top |
| * When you move the cursor on each content, you can see more deailed mutation information on the Tooltip. Those are primary_site,primary_histology,mutation(aa),pubmedID. |
| GRCh37 position | Mutation(aa) | Unique sampleID count |
| chr12:124114935-124114935 | p.? | 3 |
| chr12:124106442-124106442 | p.A260V | 2 |
| chr12:124111688-124111688 | p.A129T | 2 |
| chr12:124109419-124109419 | p.? | 2 |
| chr12:124114820-124114820 | p.C89R | 2 |
| chr12:124110995-124110995 | p.T176T | 1 |
| chr12:124114943-124114943 | p.? | 1 |
| chr12:124106443-124106443 | p.A260S | 1 |
| chr12:124111624-124111624 | p.V150A | 1 |
| chr12:124114945-124114945 | p.S84F | 1 |
| Top |
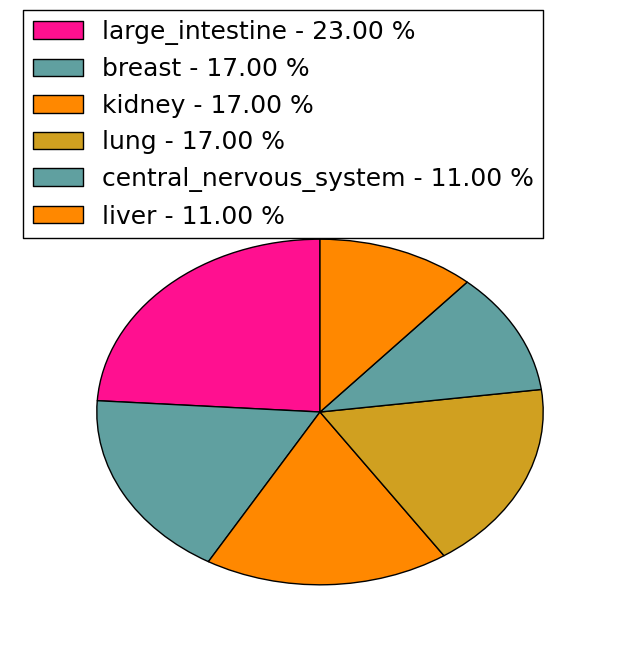
|
 |
| Point Mutation/ Tissue ID | 1 | 2 | 3 | 4 | 5 | 6 | 7 | 8 | 9 | 10 | 11 | 12 | 13 | 14 | 15 | 16 | 17 | 18 | 19 | 20 |
| # sample | 1 | 2 | 2 | 2 | 1 | 2 | 1 | 2 | 1 | 4 | 5 | |||||||||
| # mutation | 1 | 2 | 3 | 2 | 1 | 3 | 1 | 2 | 1 | 4 | 4 | |||||||||
| nonsynonymous SNV | 2 | 2 | 1 | 3 | 1 | 2 | 1 | 3 | ||||||||||||
| synonymous SNV | 1 | 1 | 1 | 1 | 1 | 3 | 1 |
| cf) Tissue ID; Tissue type (1; BLCA[Bladder Urothelial Carcinoma], 2; BRCA[Breast invasive carcinoma], 3; CESC[Cervical squamous cell carcinoma and endocervical adenocarcinoma], 4; COAD[Colon adenocarcinoma], 5; GBM[Glioblastoma multiforme], 6; Glioma Low Grade, 7; HNSC[Head and Neck squamous cell carcinoma], 8; KICH[Kidney Chromophobe], 9; KIRC[Kidney renal clear cell carcinoma], 10; KIRP[Kidney renal papillary cell carcinoma], 11; LAML[Acute Myeloid Leukemia], 12; LUAD[Lung adenocarcinoma], 13; LUSC[Lung squamous cell carcinoma], 14; OV[Ovarian serous cystadenocarcinoma ], 15; PAAD[Pancreatic adenocarcinoma], 16; PRAD[Prostate adenocarcinoma], 17; SKCM[Skin Cutaneous Melanoma], 18:STAD[Stomach adenocarcinoma], 19:THCA[Thyroid carcinoma], 20:UCEC[Uterine Corpus Endometrial Carcinoma]) |
| Top |
| * We represented just top 10 SNVs. When you move the cursor on each content, you can see more deailed mutation information on the Tooltip. Those are primary_site, primary_histology, mutation(aa), pubmedID. |
| Genomic Position | Mutation(aa) | Unique sampleID count |
| chr12:124106442 | p.A260V | 2 |
| chr12:124107222 | p.F233L | 1 |
| chr12:124114778 | p.R28P | 1 |
| chr12:124107227 | p.A181T | 1 |
| chr12:124114945 | p.S22S | 1 |
| chr12:124107237 | p.V178A | 1 |
| chr12:124114968 | p.K4K | 1 |
| chr12:124110982 | p.V178L | 1 |
| chr12:124114980 | p.T176T | 1 |
| chr12:124110990 | p.R147Q | 1 |
| * Copy number data were extracted from TCGA using R package TCGA-Assembler. The URLs of all public data files on TCGA DCC data server were gathered on Jan-05-2015. Function ProcessCNAData in TCGA-Assembler package was used to obtain gene-level copy number value which is calculated as the average copy number of the genomic region of a gene. |
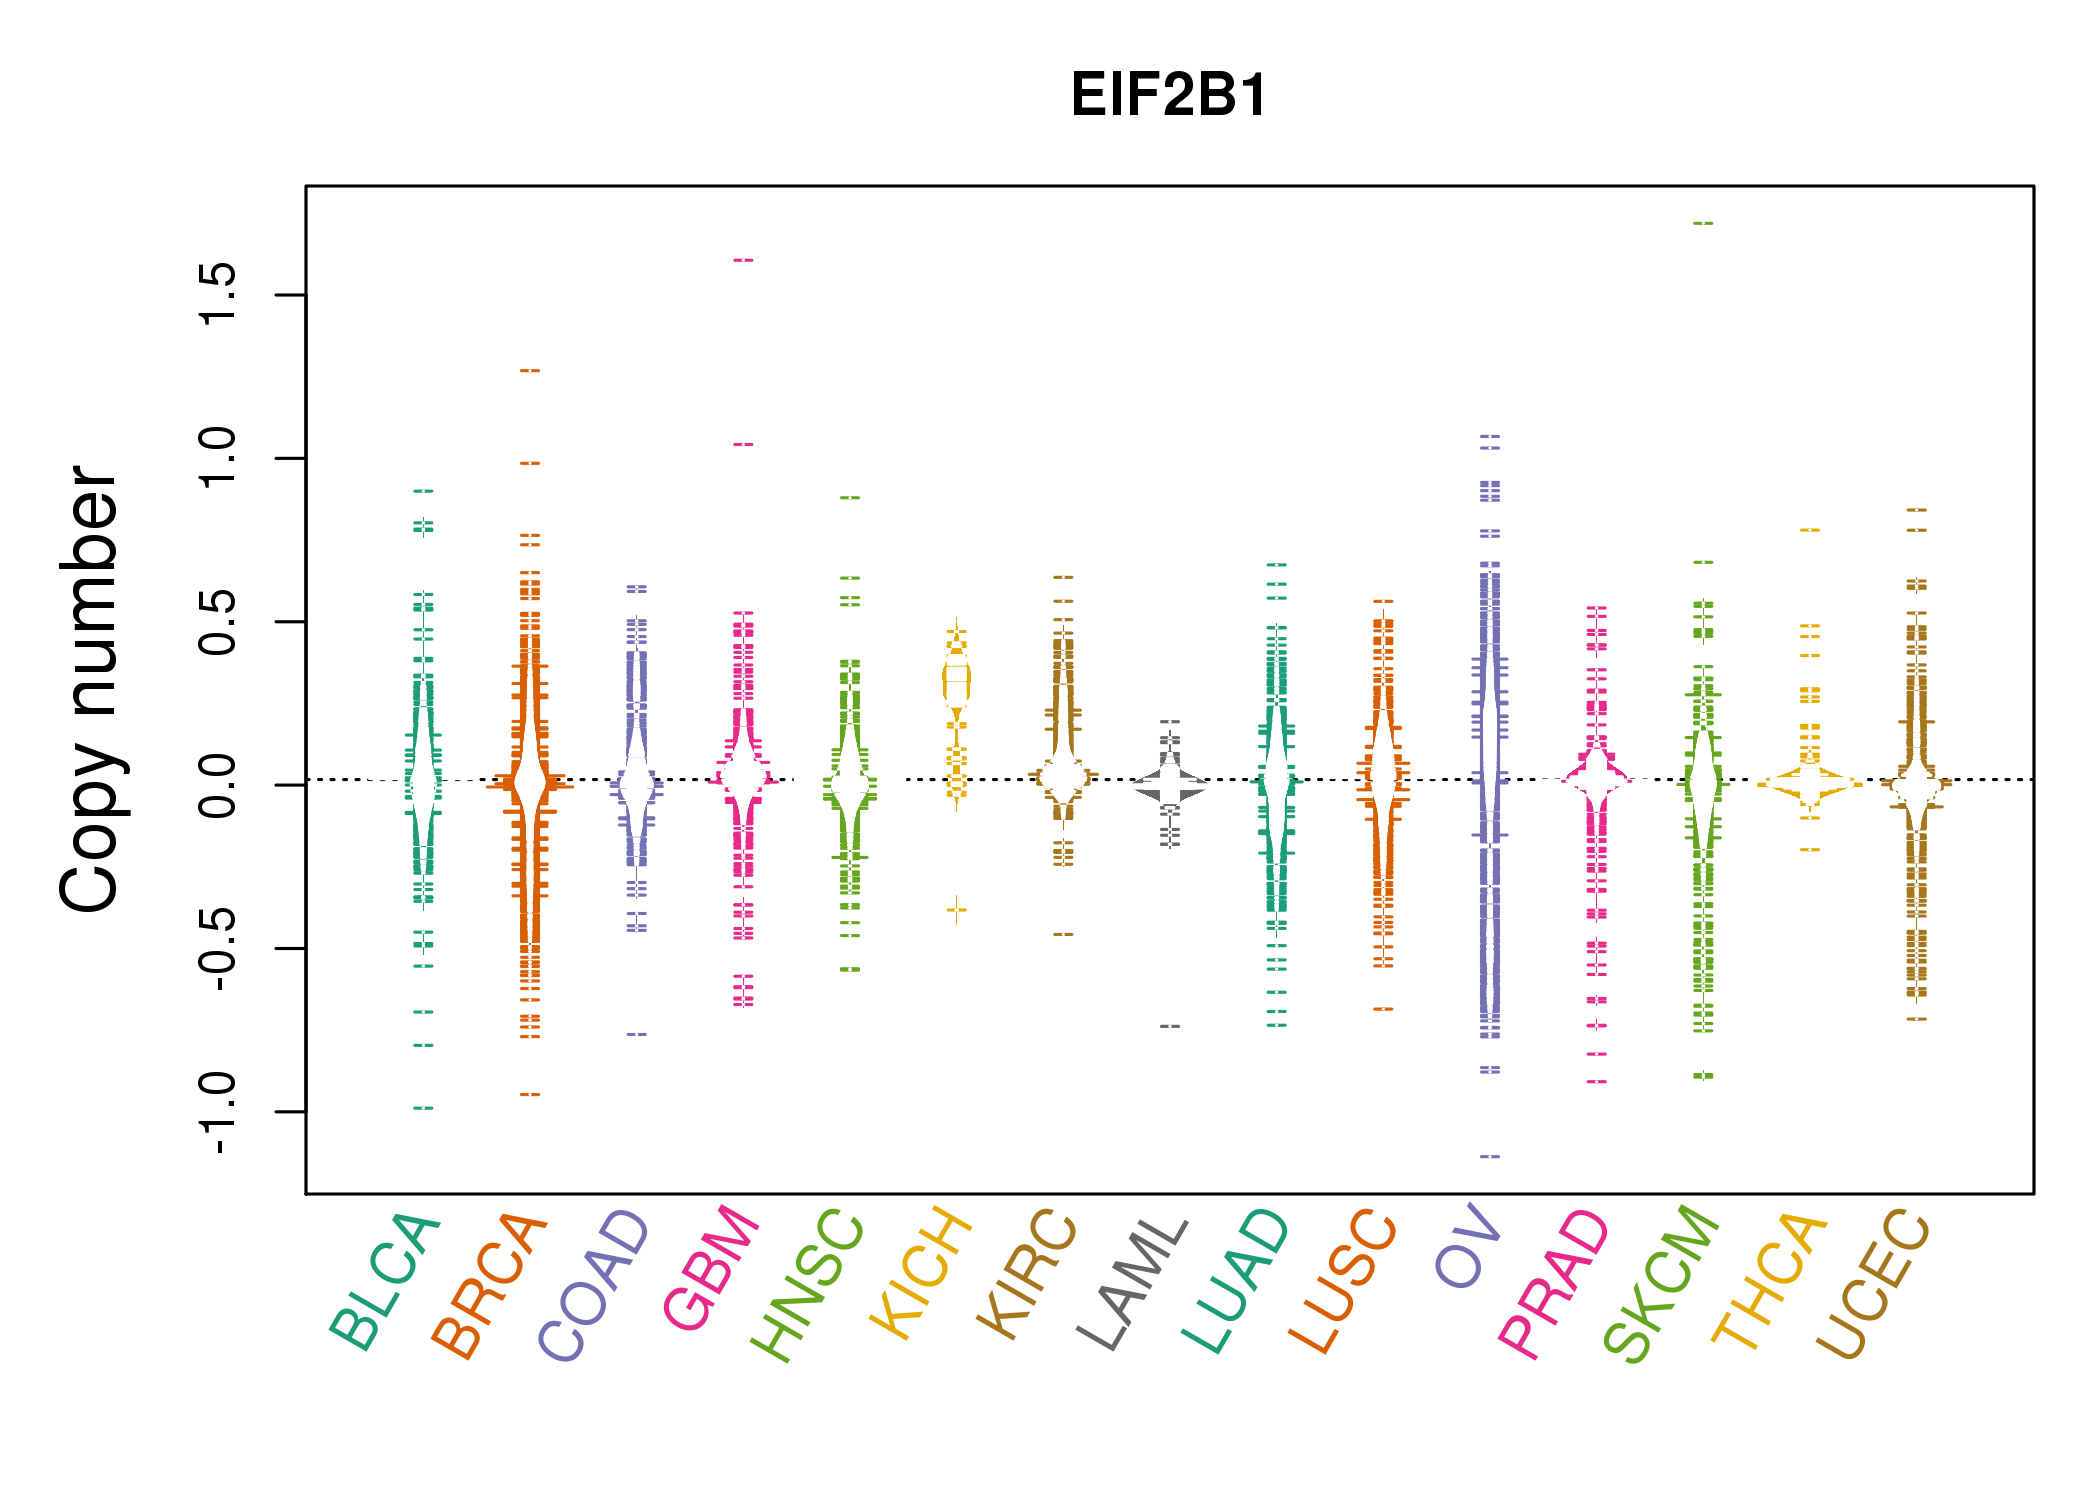 |
| cf) Tissue ID[Tissue type]: BLCA[Bladder Urothelial Carcinoma], BRCA[Breast invasive carcinoma], CESC[Cervical squamous cell carcinoma and endocervical adenocarcinoma], COAD[Colon adenocarcinoma], GBM[Glioblastoma multiforme], Glioma Low Grade, HNSC[Head and Neck squamous cell carcinoma], KICH[Kidney Chromophobe], KIRC[Kidney renal clear cell carcinoma], KIRP[Kidney renal papillary cell carcinoma], LAML[Acute Myeloid Leukemia], LUAD[Lung adenocarcinoma], LUSC[Lung squamous cell carcinoma], OV[Ovarian serous cystadenocarcinoma ], PAAD[Pancreatic adenocarcinoma], PRAD[Prostate adenocarcinoma], SKCM[Skin Cutaneous Melanoma], STAD[Stomach adenocarcinoma], THCA[Thyroid carcinoma], UCEC[Uterine Corpus Endometrial Carcinoma] |
| Top |
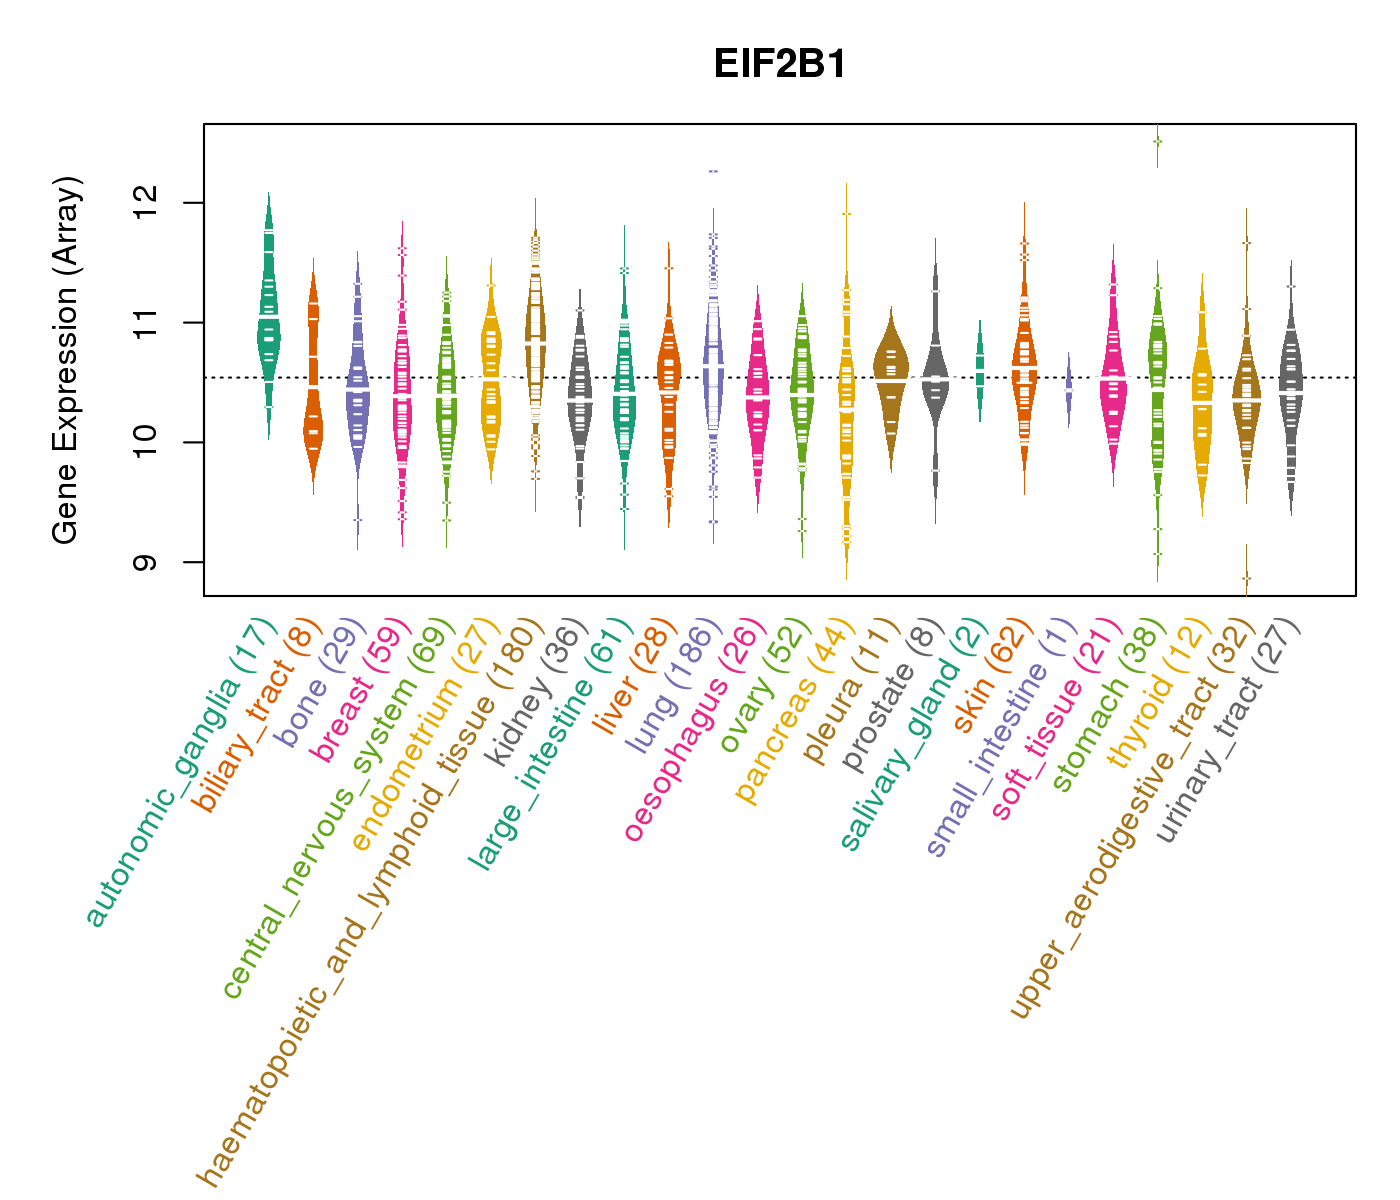
| Gene Expression for EIF2B1 |
| * CCLE gene expression data were extracted from CCLE_Expression_Entrez_2012-10-18.res: Gene-centric RMA-normalized mRNA expression data. |
 |
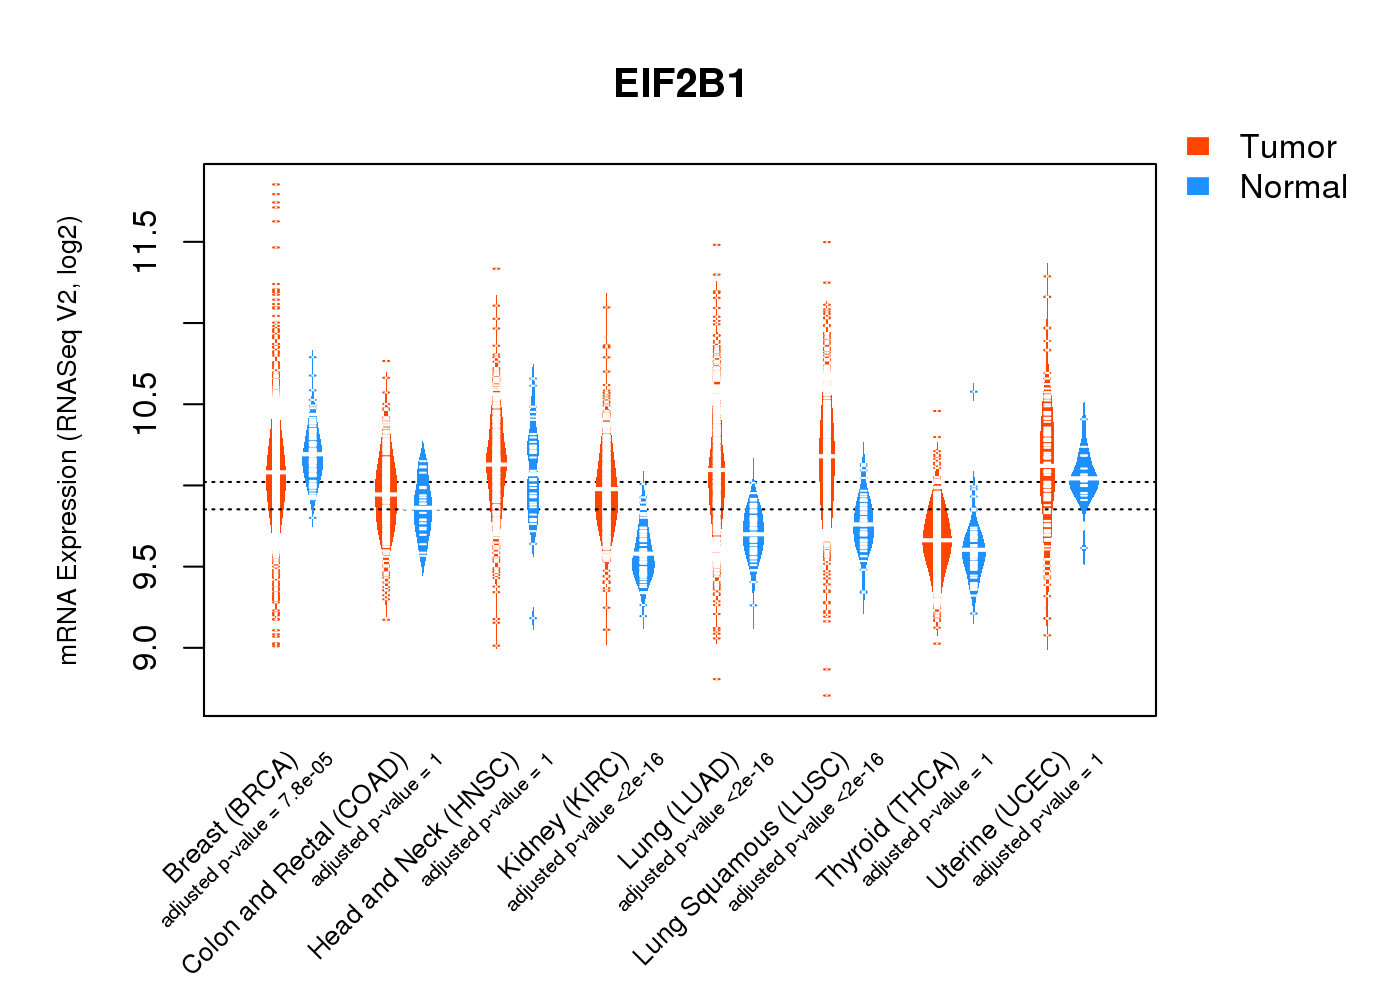
| * Normalized gene expression data of RNASeqV2 was extracted from TCGA using R package TCGA-Assembler. The URLs of all public data files on TCGA DCC data server were gathered at Jan-05-2015. Only eight cancer types have enough normal control samples for differential expression analysis. (t test, adjusted p<0.05 (using Benjamini-Hochberg FDR)) |
 |
| Top |
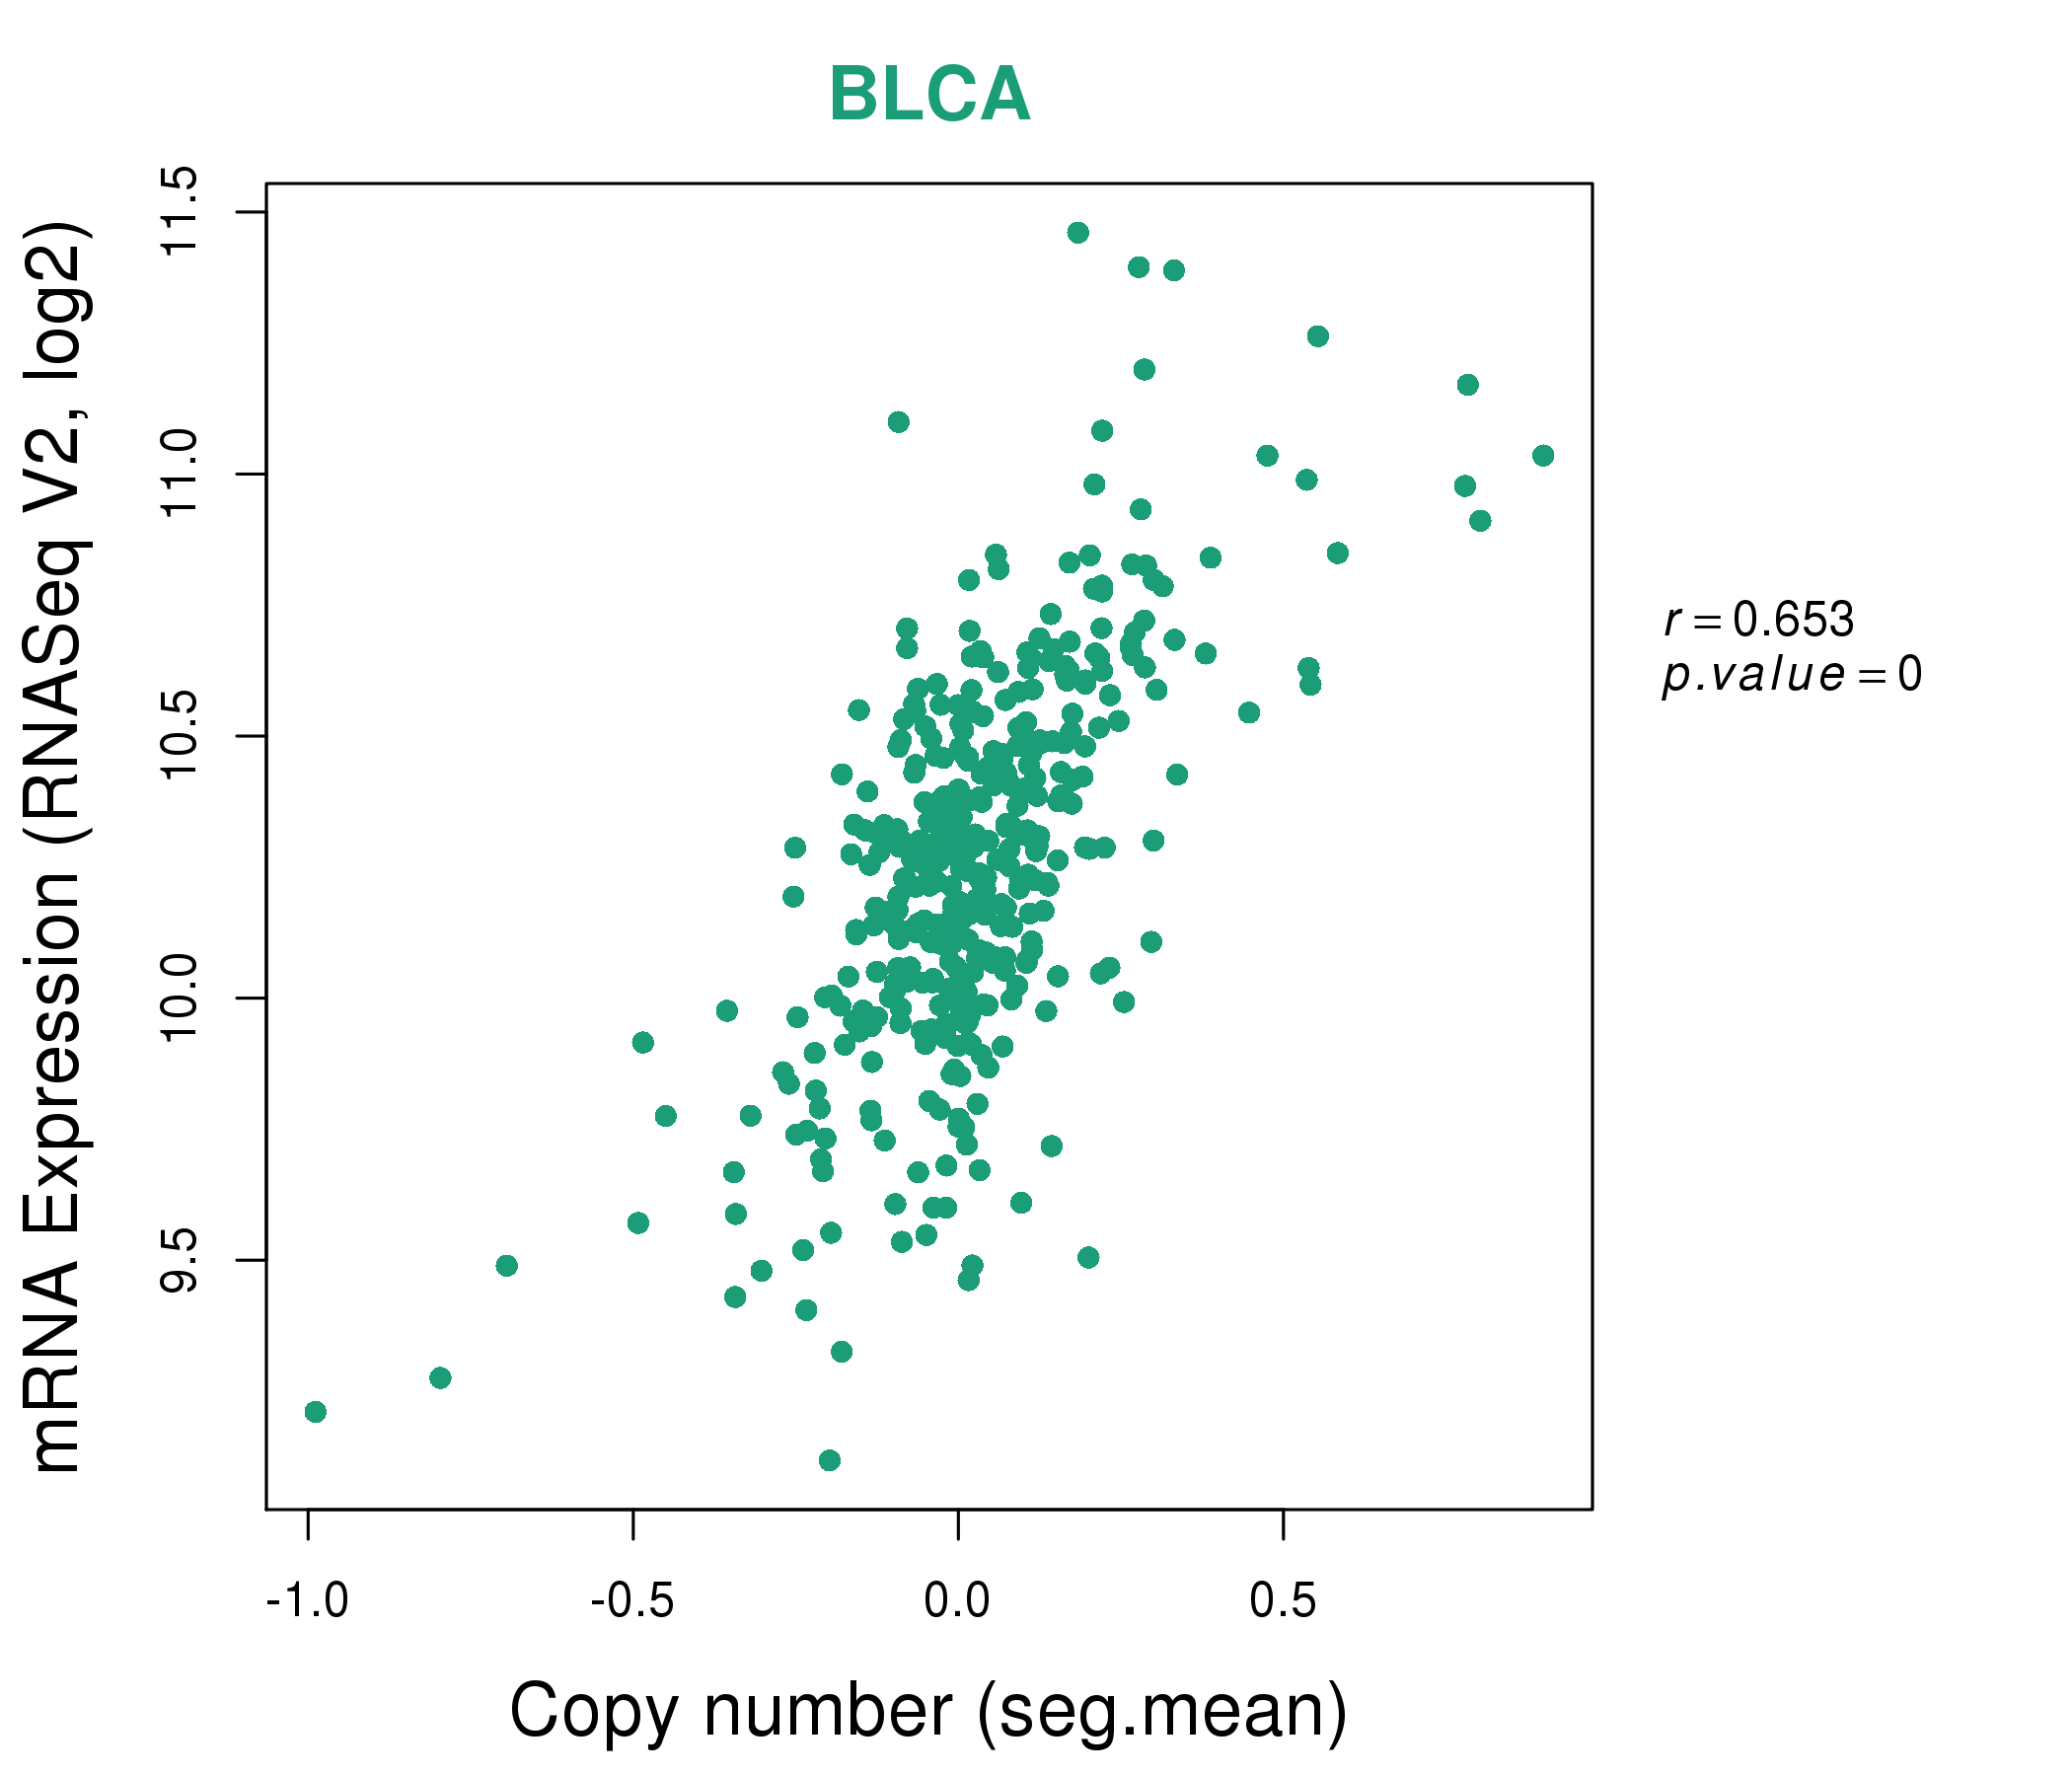
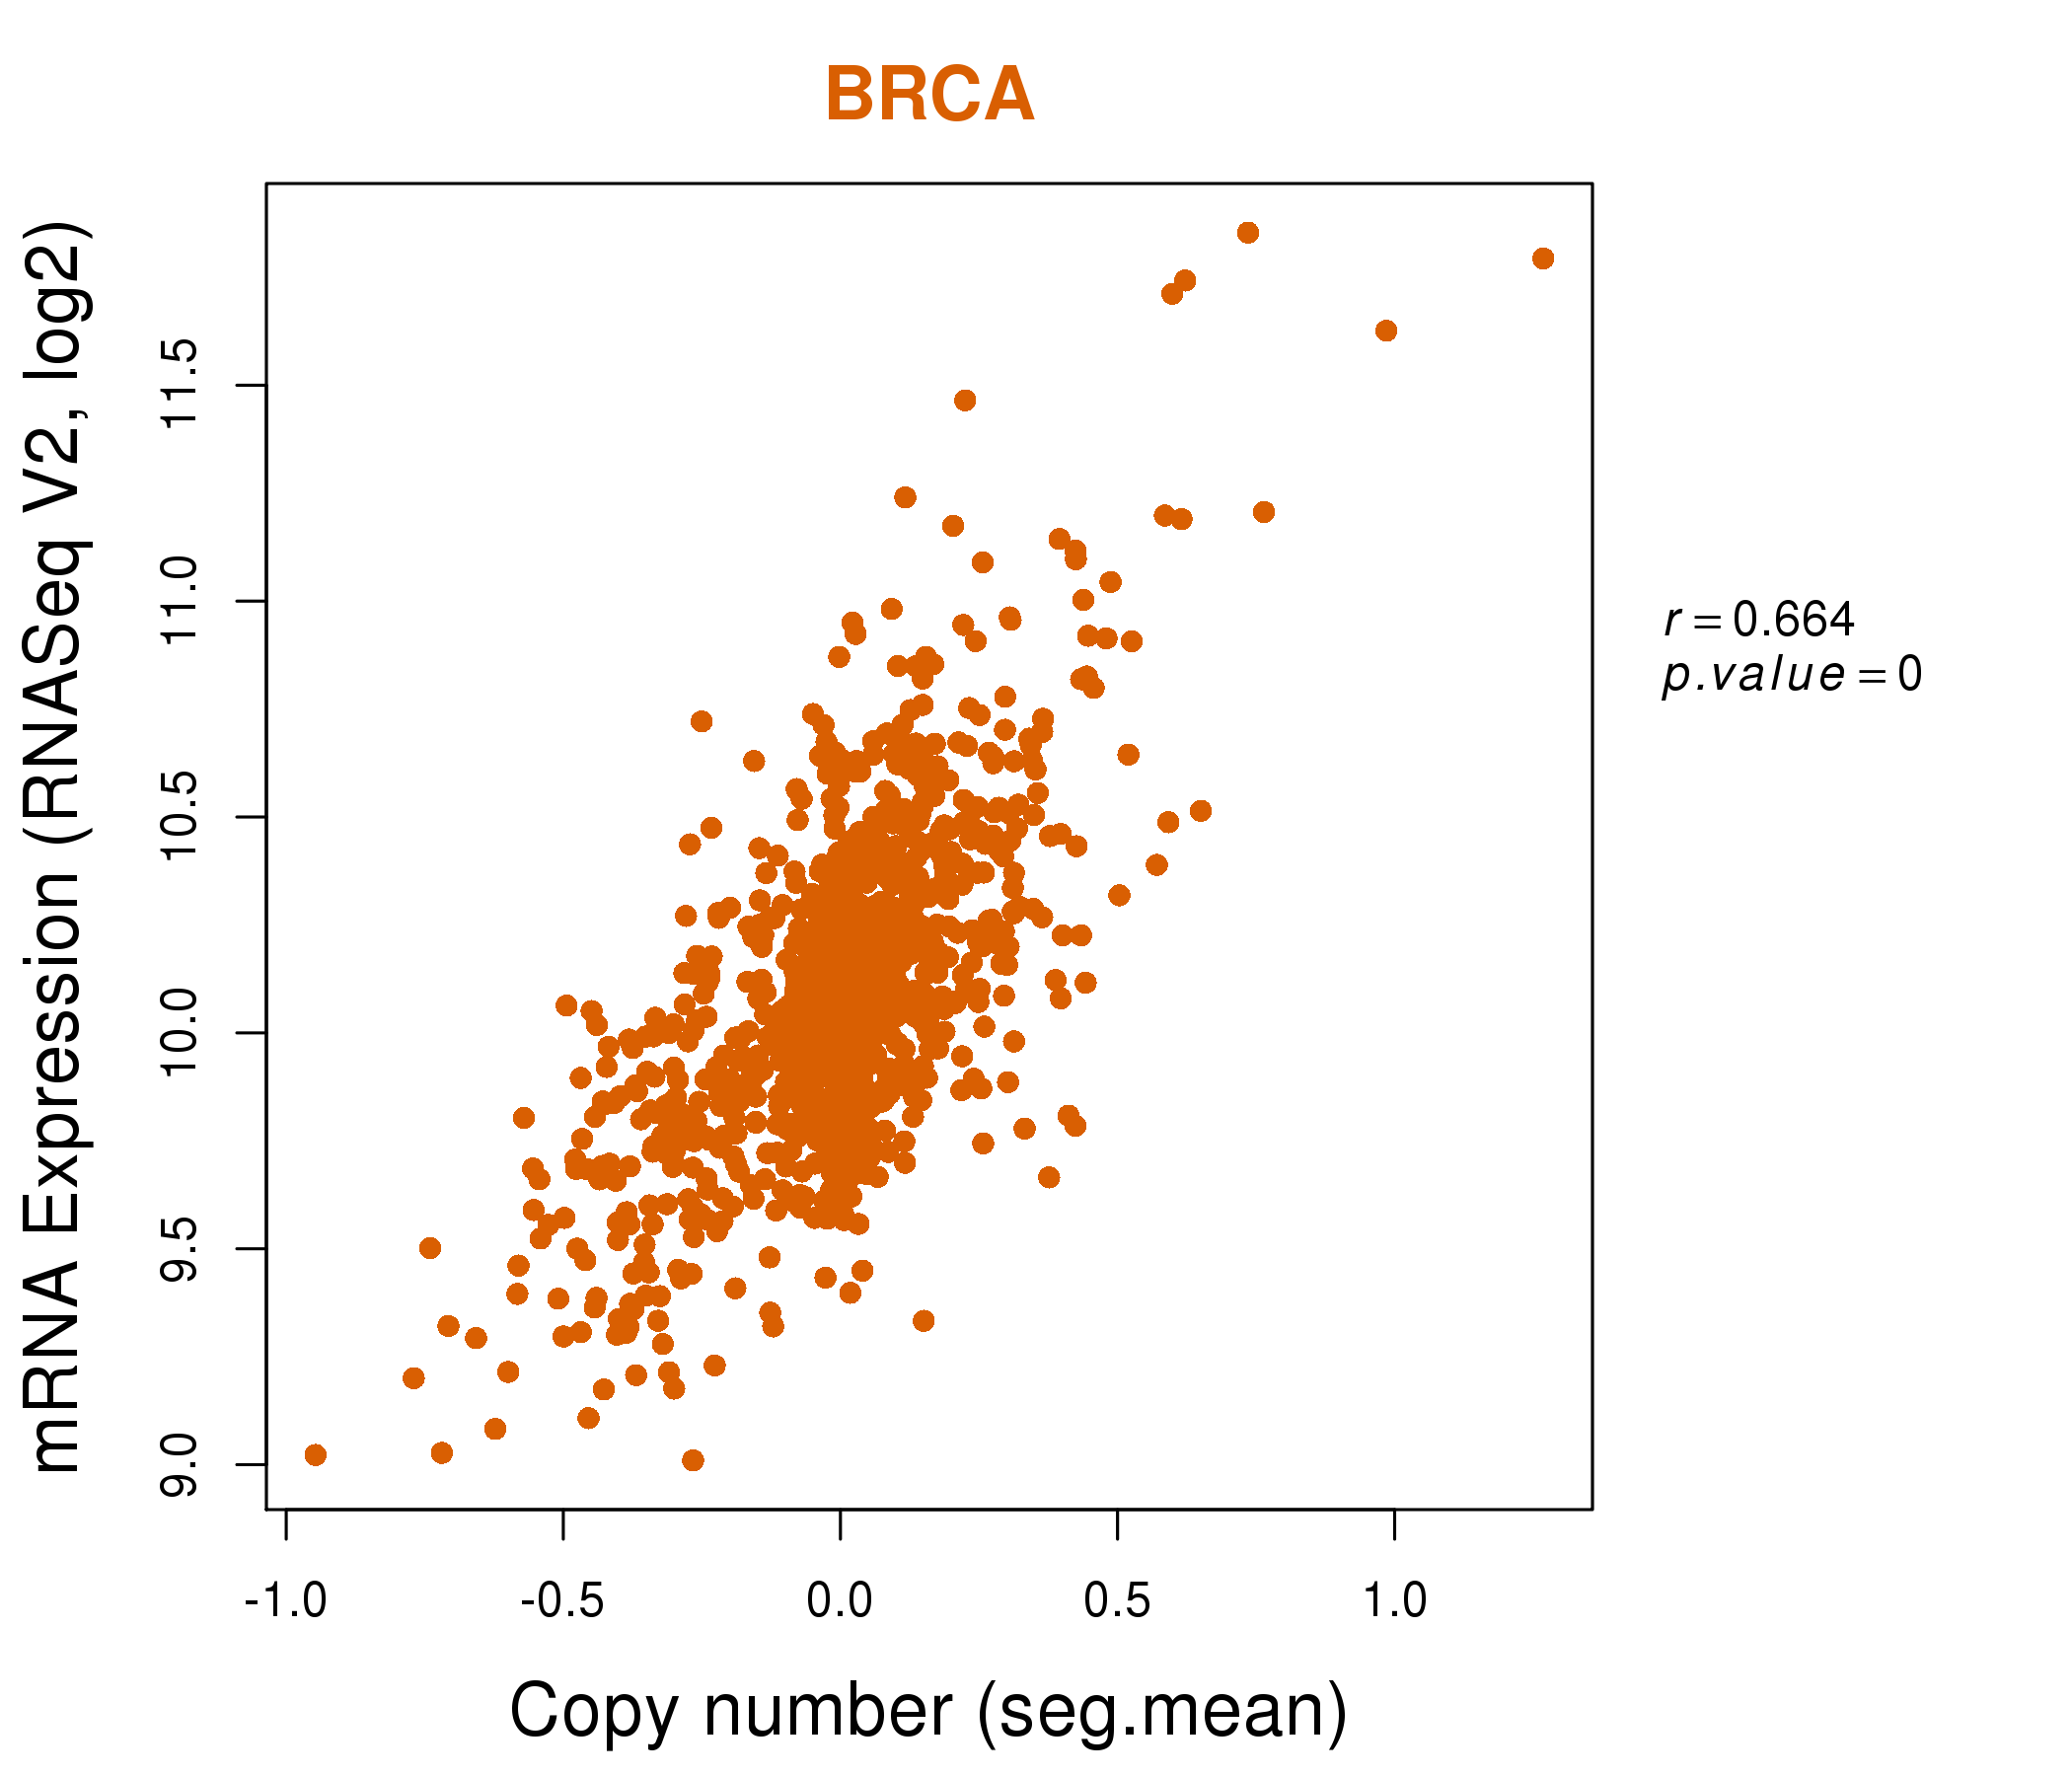
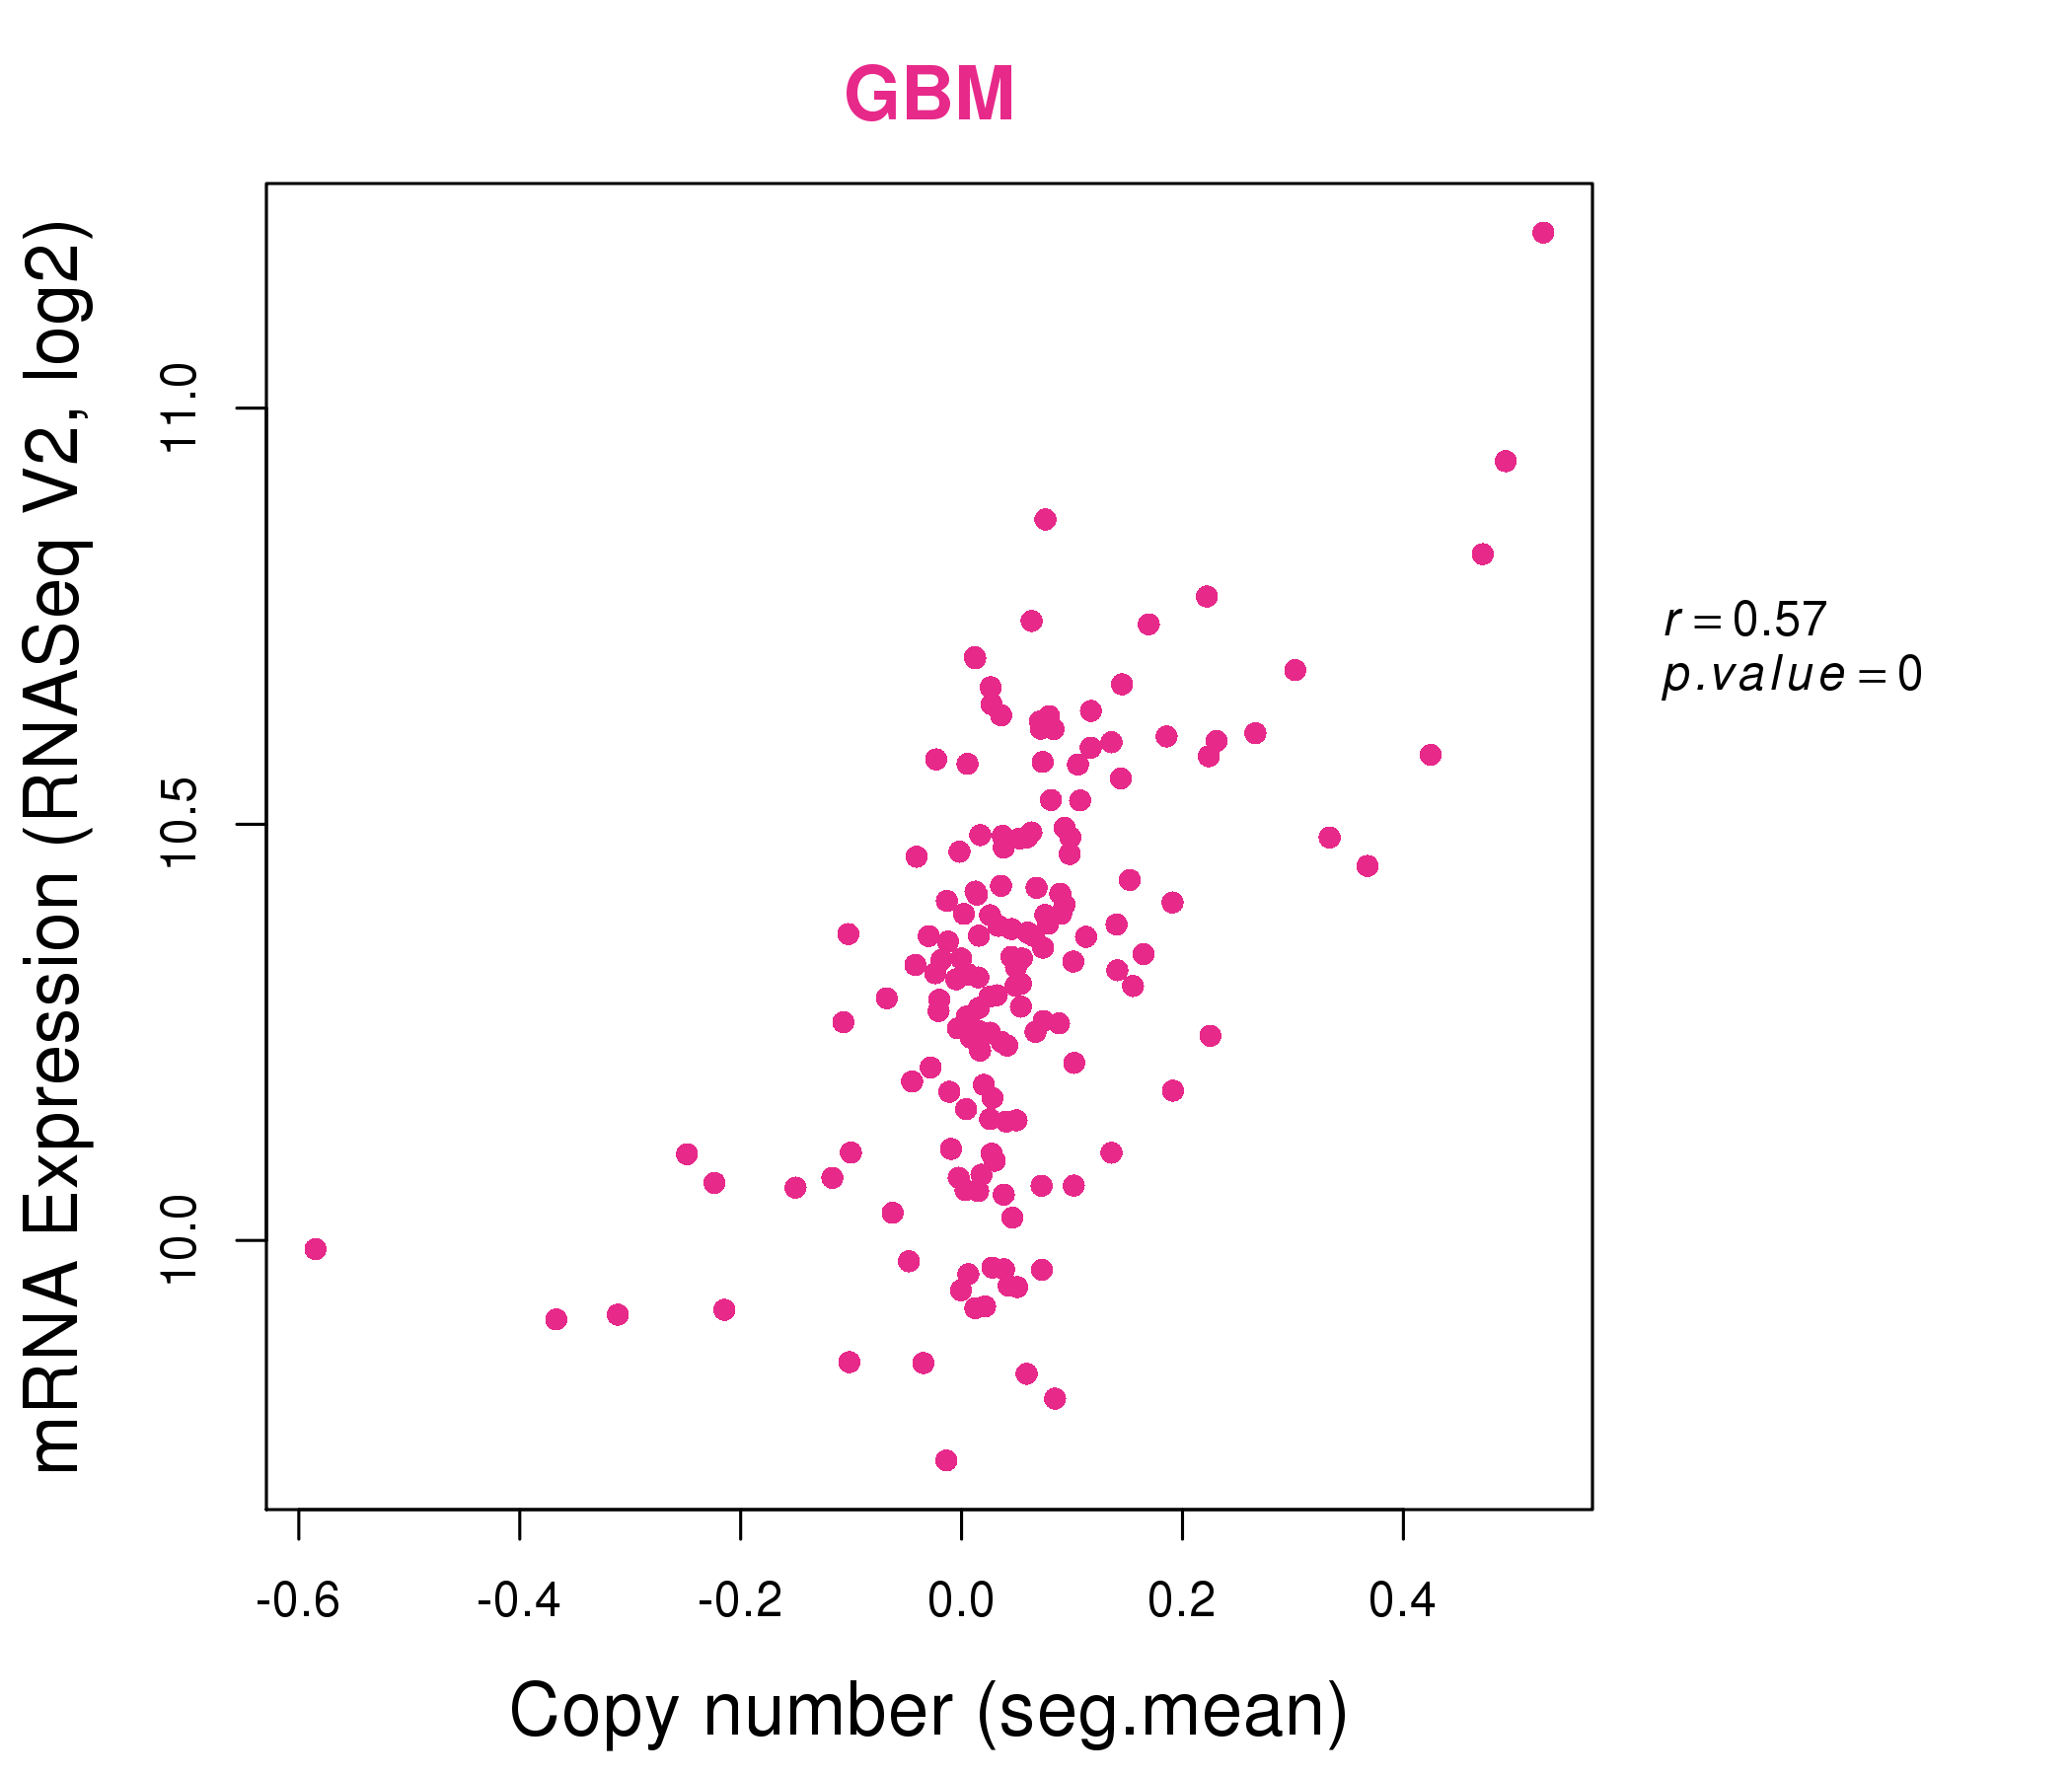
| * This plots show the correlation between CNV and gene expression. |
: Open all plots for all cancer types
 |
|
 |
|
| Top |
| Gene-Gene Network Information |
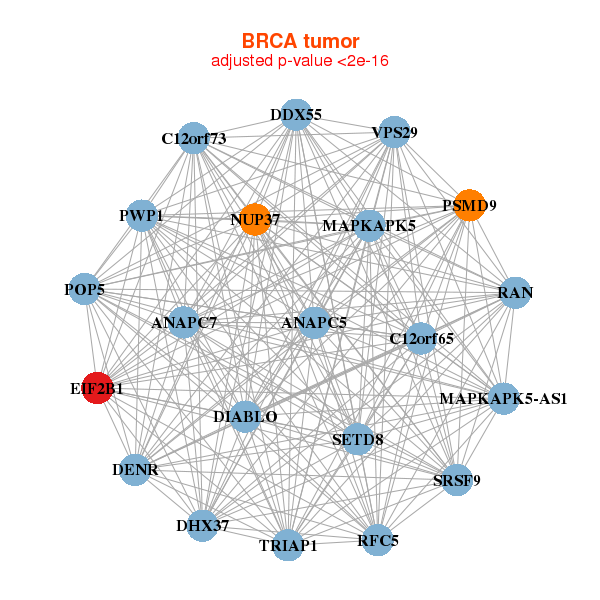
| * Co-Expression network figures were drawn using R package igraph. Only the top 20 genes with the highest correlations were shown. Red circle: input gene, orange circle: cell metabolism gene, sky circle: other gene |
: Open all plots for all cancer types
 |
|
| ANAPC5,ANAPC7,MAPKAPK5-AS1,C12orf65,C12orf73,DDX55,DENR, DHX37,DIABLO,EIF2B1,MAPKAPK5,NUP37,POP5,PSMD9, PWP1,RAN,RFC5,SETD8,SRSF9,TRIAP1,VPS29 | C14orf166,BRK1,C4orf27,CDC16,CKS1B,COMMD6,COX7A2L, EIF2B1,ESD,FBXO7,FRG1,HDDC2,MFF,PARL, PFDN4,RAC1,RBM34,RFWD2,SEC22A,TMEM14C,UBE2V1 |
 |
|
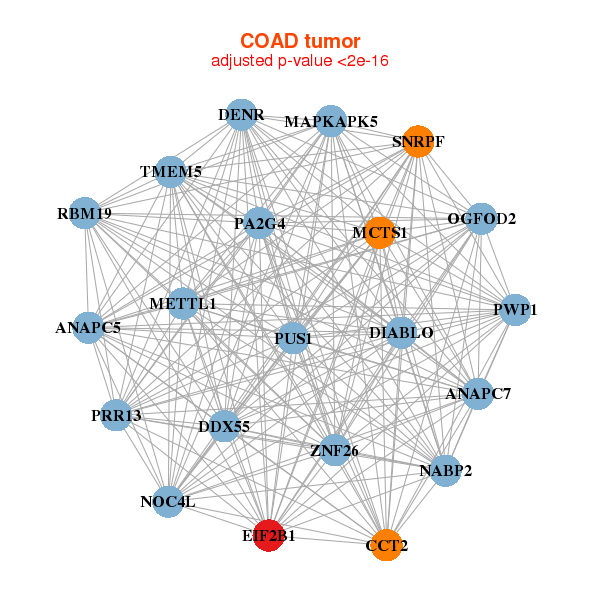
| ANAPC5,ANAPC7,CCT2,DDX55,DENR,DIABLO,EIF2B1, MAPKAPK5,MCTS1,METTL1,NOC4L,NABP2,OGFOD2,PA2G4, PRR13,PUS1,PWP1,RBM19,SNRPF,TMEM5,ZNF26 | DCTN3,DUSP12,DYRK4,EIF2B1,ERI3,FRG1,LYRM1, LYRM4,MFF,MRPS6,NSMCE4A,POLR2G,PPP1R8,PRKAG1, PWP1,THYN1,TMEM218,VPS72,WDR70,ZNF530,ZNHIT3 |
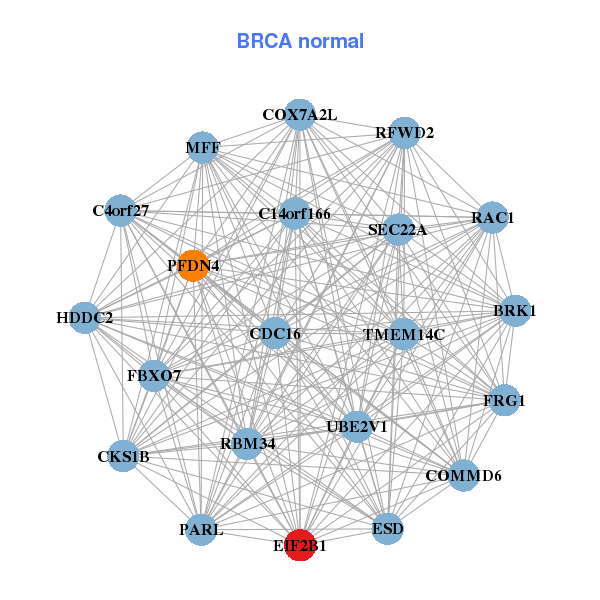
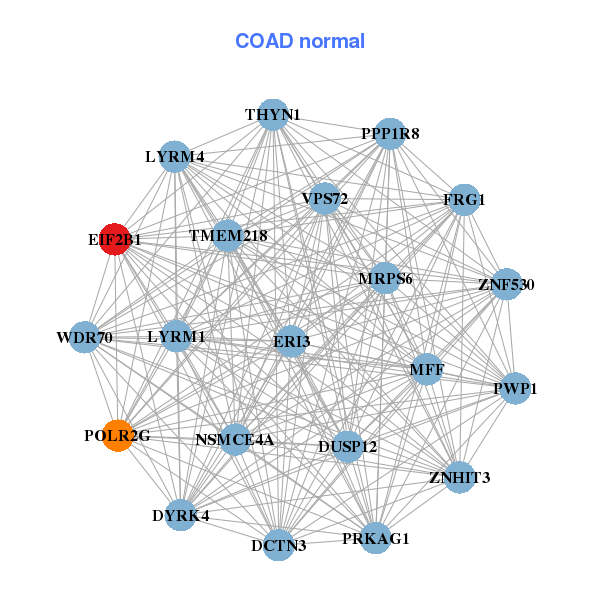
| * Co-Expression network figures were drawn using R package igraph. Only the top 20 genes with the highest correlations were shown. Red circle: input gene, orange circle: cell metabolism gene, sky circle: other gene |
: Open all plots for all cancer types
| Top |
: Open all interacting genes' information including KEGG pathway for all interacting genes from DAVID
| Top |
| Pharmacological Information for EIF2B1 |
| There's no related Drug. |
| Top |
| Cross referenced IDs for EIF2B1 |
| * We obtained these cross-references from Uniprot database. It covers 150 different DBs, 18 categories. http://www.uniprot.org/help/cross_references_section |
: Open all cross reference information
|
Copyright © 2016-Present - The Univsersity of Texas Health Science Center at Houston @ |