|
||||||||||||||||||||
| |
| Phenotypic Information (metabolism pathway, cancer, disease, phenome) |
| |
| |
| Gene-Gene Network Information: Co-Expression Network, Interacting Genes & KEGG |
| |
|


| Gene Summary for LDHD |
| Basic gene info. | Gene symbol | LDHD |
| Gene name | lactate dehydrogenase D | |
| Synonyms | DLD | |
| Cytomap | UCSC genome browser: 16q23.1 | |
| Genomic location | chr16 :75145757-75150670 | |
| Type of gene | protein-coding | |
| RefGenes | NM_153486.3, NM_194436.2, | |
| Ensembl id | ENSG00000166816 | |
| Description | D-lactate dehydrogenaseprobable D-lactate dehydrogenase, mitochondrial | |
| Modification date | 20141207 | |
| dbXrefs | MIM : 607490 | |
| HGNC : HGNC | ||
| Ensembl : ENSG00000166816 | ||
| HPRD : 06318 | ||
| Vega : OTTHUMG00000137605 | ||
| Protein | UniProt: go to UniProt's Cross Reference DB Table | |
| Expression | CleanEX: HS_LDHD | |
| BioGPS: 197257 | ||
| Gene Expression Atlas: ENSG00000166816 | ||
| The Human Protein Atlas: ENSG00000166816 | ||
| Pathway | NCI Pathway Interaction Database: LDHD | |
| KEGG: LDHD | ||
| REACTOME: LDHD | ||
| ConsensusPathDB | ||
| Pathway Commons: LDHD | ||
| Metabolism | MetaCyc: LDHD | |
| HUMANCyc: LDHD | ||
| Regulation | Ensembl's Regulation: ENSG00000166816 | |
| miRBase: chr16 :75,145,757-75,150,670 | ||
| TargetScan: NM_153486 | ||
| cisRED: ENSG00000166816 | ||
| Context | iHOP: LDHD | |
| cancer metabolism search in PubMed: LDHD | ||
| UCL Cancer Institute: LDHD | ||
| Assigned class in ccmGDB | C | |
| Top |
| Phenotypic Information for LDHD(metabolism pathway, cancer, disease, phenome) |
| Cancer | CGAP: LDHD |
| Familial Cancer Database: LDHD | |
| * This gene is included in those cancer gene databases. |
|
|
|
|
|
| . | ||||||||||||||
Oncogene 1 | Significant driver gene in | |||||||||||||||||||
| cf) number; DB name 1 Oncogene; http://nar.oxfordjournals.org/content/35/suppl_1/D721.long, 2 Tumor Suppressor gene; https://bioinfo.uth.edu/TSGene/, 3 Cancer Gene Census; http://www.nature.com/nrc/journal/v4/n3/abs/nrc1299.html, 4 CancerGenes; http://nar.oxfordjournals.org/content/35/suppl_1/D721.long, 5 Network of Cancer Gene; http://ncg.kcl.ac.uk/index.php, 1Therapeutic Vulnerabilities in Cancer; http://cbio.mskcc.org/cancergenomics/statius/ |
| KEGG_PYRUVATE_METABOLISM REACTOME_METABOLISM_OF_PROTEINS | |
| OMIM | |
| Orphanet | |
| Disease | KEGG Disease: LDHD |
| MedGen: LDHD (Human Medical Genetics with Condition) | |
| ClinVar: LDHD | |
| Phenotype | MGI: LDHD (International Mouse Phenotyping Consortium) |
| PhenomicDB: LDHD | |
| Mutations for LDHD |
| * Under tables are showing count per each tissue to give us broad intuition about tissue specific mutation patterns.You can go to the detailed page for each mutation database's web site. |
| There's no structural variation information in COSMIC data for this gene. |
| * From mRNA Sanger sequences, Chitars2.0 arranged chimeric transcripts. This table shows LDHD related fusion information. |
| ID | Head Gene | Tail Gene | Accession | Gene_a | qStart_a | qEnd_a | Chromosome_a | tStart_a | tEnd_a | Gene_a | qStart_a | qEnd_a | Chromosome_a | tStart_a | tEnd_a |
| Top |
| There's no copy number variation information in COSMIC data for this gene. |
| Top |
|
 |
| Top |
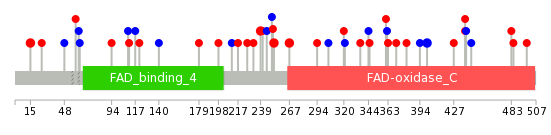
| Stat. for Non-Synonymous SNVs (# total SNVs=24) | (# total SNVs=13) |
 |  |
(# total SNVs=0) | (# total SNVs=0) |
| Top |
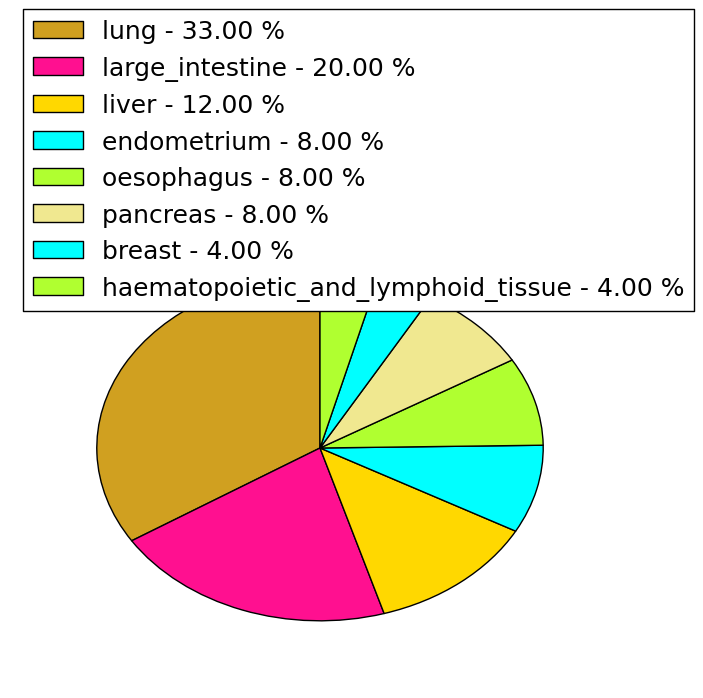
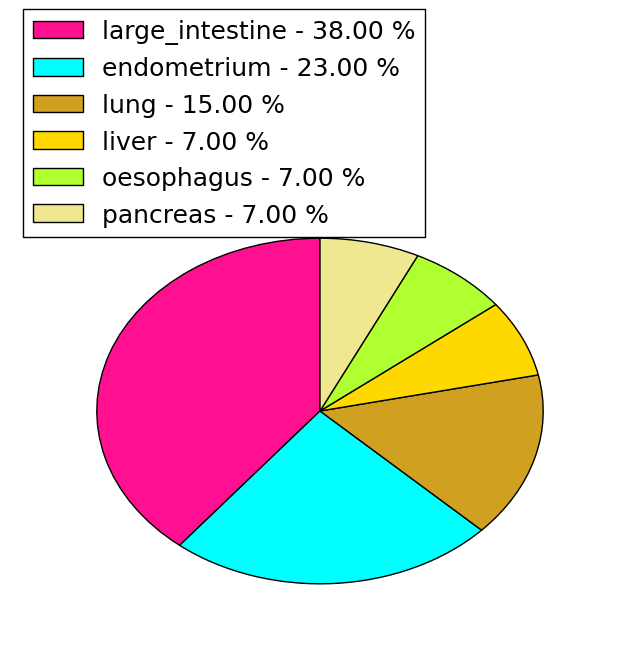
| * When you move the cursor on each content, you can see more deailed mutation information on the Tooltip. Those are primary_site,primary_histology,mutation(aa),pubmedID. |
| GRCh37 position | Mutation(aa) | Unique sampleID count |
| chr16:75146546-75146546 | p.A438S | 2 |
| chr16:75150574-75150574 | p.W15C | 2 |
| chr16:75148047-75148047 | p.Y239N | 2 |
| chr16:75146775-75146775 | p.I401I | 2 |
| chr16:75147961-75147961 | p.E267D | 2 |
| chr16:75148007-75148007 | p.L252P | 2 |
| chr16:75148027-75148027 | p.F245F | 1 |
| chr16:75148832-75148832 | p.R121Q | 1 |
| chr16:75147661-75147661 | p.E336K | 1 |
| chr16:75148041-75148041 | p.L241F | 1 |
| Top |
|
 |
| Point Mutation/ Tissue ID | 1 | 2 | 3 | 4 | 5 | 6 | 7 | 8 | 9 | 10 | 11 | 12 | 13 | 14 | 15 | 16 | 17 | 18 | 19 | 20 |
| # sample | 1 | 1 | 8 | 4 | 2 | 9 | 2 | 5 | 5 | |||||||||||
| # mutation | 1 | 1 | 8 | 4 | 2 | 9 | 2 | 5 | 5 | |||||||||||
| nonsynonymous SNV | 1 | 4 | 3 | 2 | 7 | 1 | 3 | 2 | ||||||||||||
| synonymous SNV | 1 | 4 | 1 | 2 | 1 | 2 | 3 |
| cf) Tissue ID; Tissue type (1; BLCA[Bladder Urothelial Carcinoma], 2; BRCA[Breast invasive carcinoma], 3; CESC[Cervical squamous cell carcinoma and endocervical adenocarcinoma], 4; COAD[Colon adenocarcinoma], 5; GBM[Glioblastoma multiforme], 6; Glioma Low Grade, 7; HNSC[Head and Neck squamous cell carcinoma], 8; KICH[Kidney Chromophobe], 9; KIRC[Kidney renal clear cell carcinoma], 10; KIRP[Kidney renal papillary cell carcinoma], 11; LAML[Acute Myeloid Leukemia], 12; LUAD[Lung adenocarcinoma], 13; LUSC[Lung squamous cell carcinoma], 14; OV[Ovarian serous cystadenocarcinoma ], 15; PAAD[Pancreatic adenocarcinoma], 16; PRAD[Prostate adenocarcinoma], 17; SKCM[Skin Cutaneous Melanoma], 18:STAD[Stomach adenocarcinoma], 19:THCA[Thyroid carcinoma], 20:UCEC[Uterine Corpus Endometrial Carcinoma]) |
| Top |
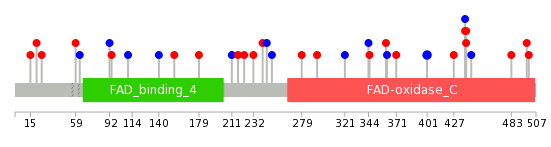
| * We represented just top 10 SNVs. When you move the cursor on each content, you can see more deailed mutation information on the Tooltip. Those are primary_site, primary_histology, mutation(aa), pubmedID. |
| Genomic Position | Mutation(aa) | Unique sampleID count |
| chr16:75146775 | p.I401I,LDHD | 2 |
| chr16:75148731 | p.A438S,LDHD | 1 |
| chr16:75146543 | p.I217M | 1 |
| chr16:75147882 | p.F427S,LDHD | 1 |
| chr16:75148774 | p.F211F | 1 |
| chr16:75146544 | p.R179H,LDHD | 1 |
| chr16:75147927 | p.H371R,LDHD | 1 |
| chr16:75148864 | p.P155T,LDHD | 1 |
| chr16:75146546 | p.E362E,LDHD | 1 |
| chr16:75148012 | p.R140R,LDHD | 1 |
| * Copy number data were extracted from TCGA using R package TCGA-Assembler. The URLs of all public data files on TCGA DCC data server were gathered on Jan-05-2015. Function ProcessCNAData in TCGA-Assembler package was used to obtain gene-level copy number value which is calculated as the average copy number of the genomic region of a gene. |
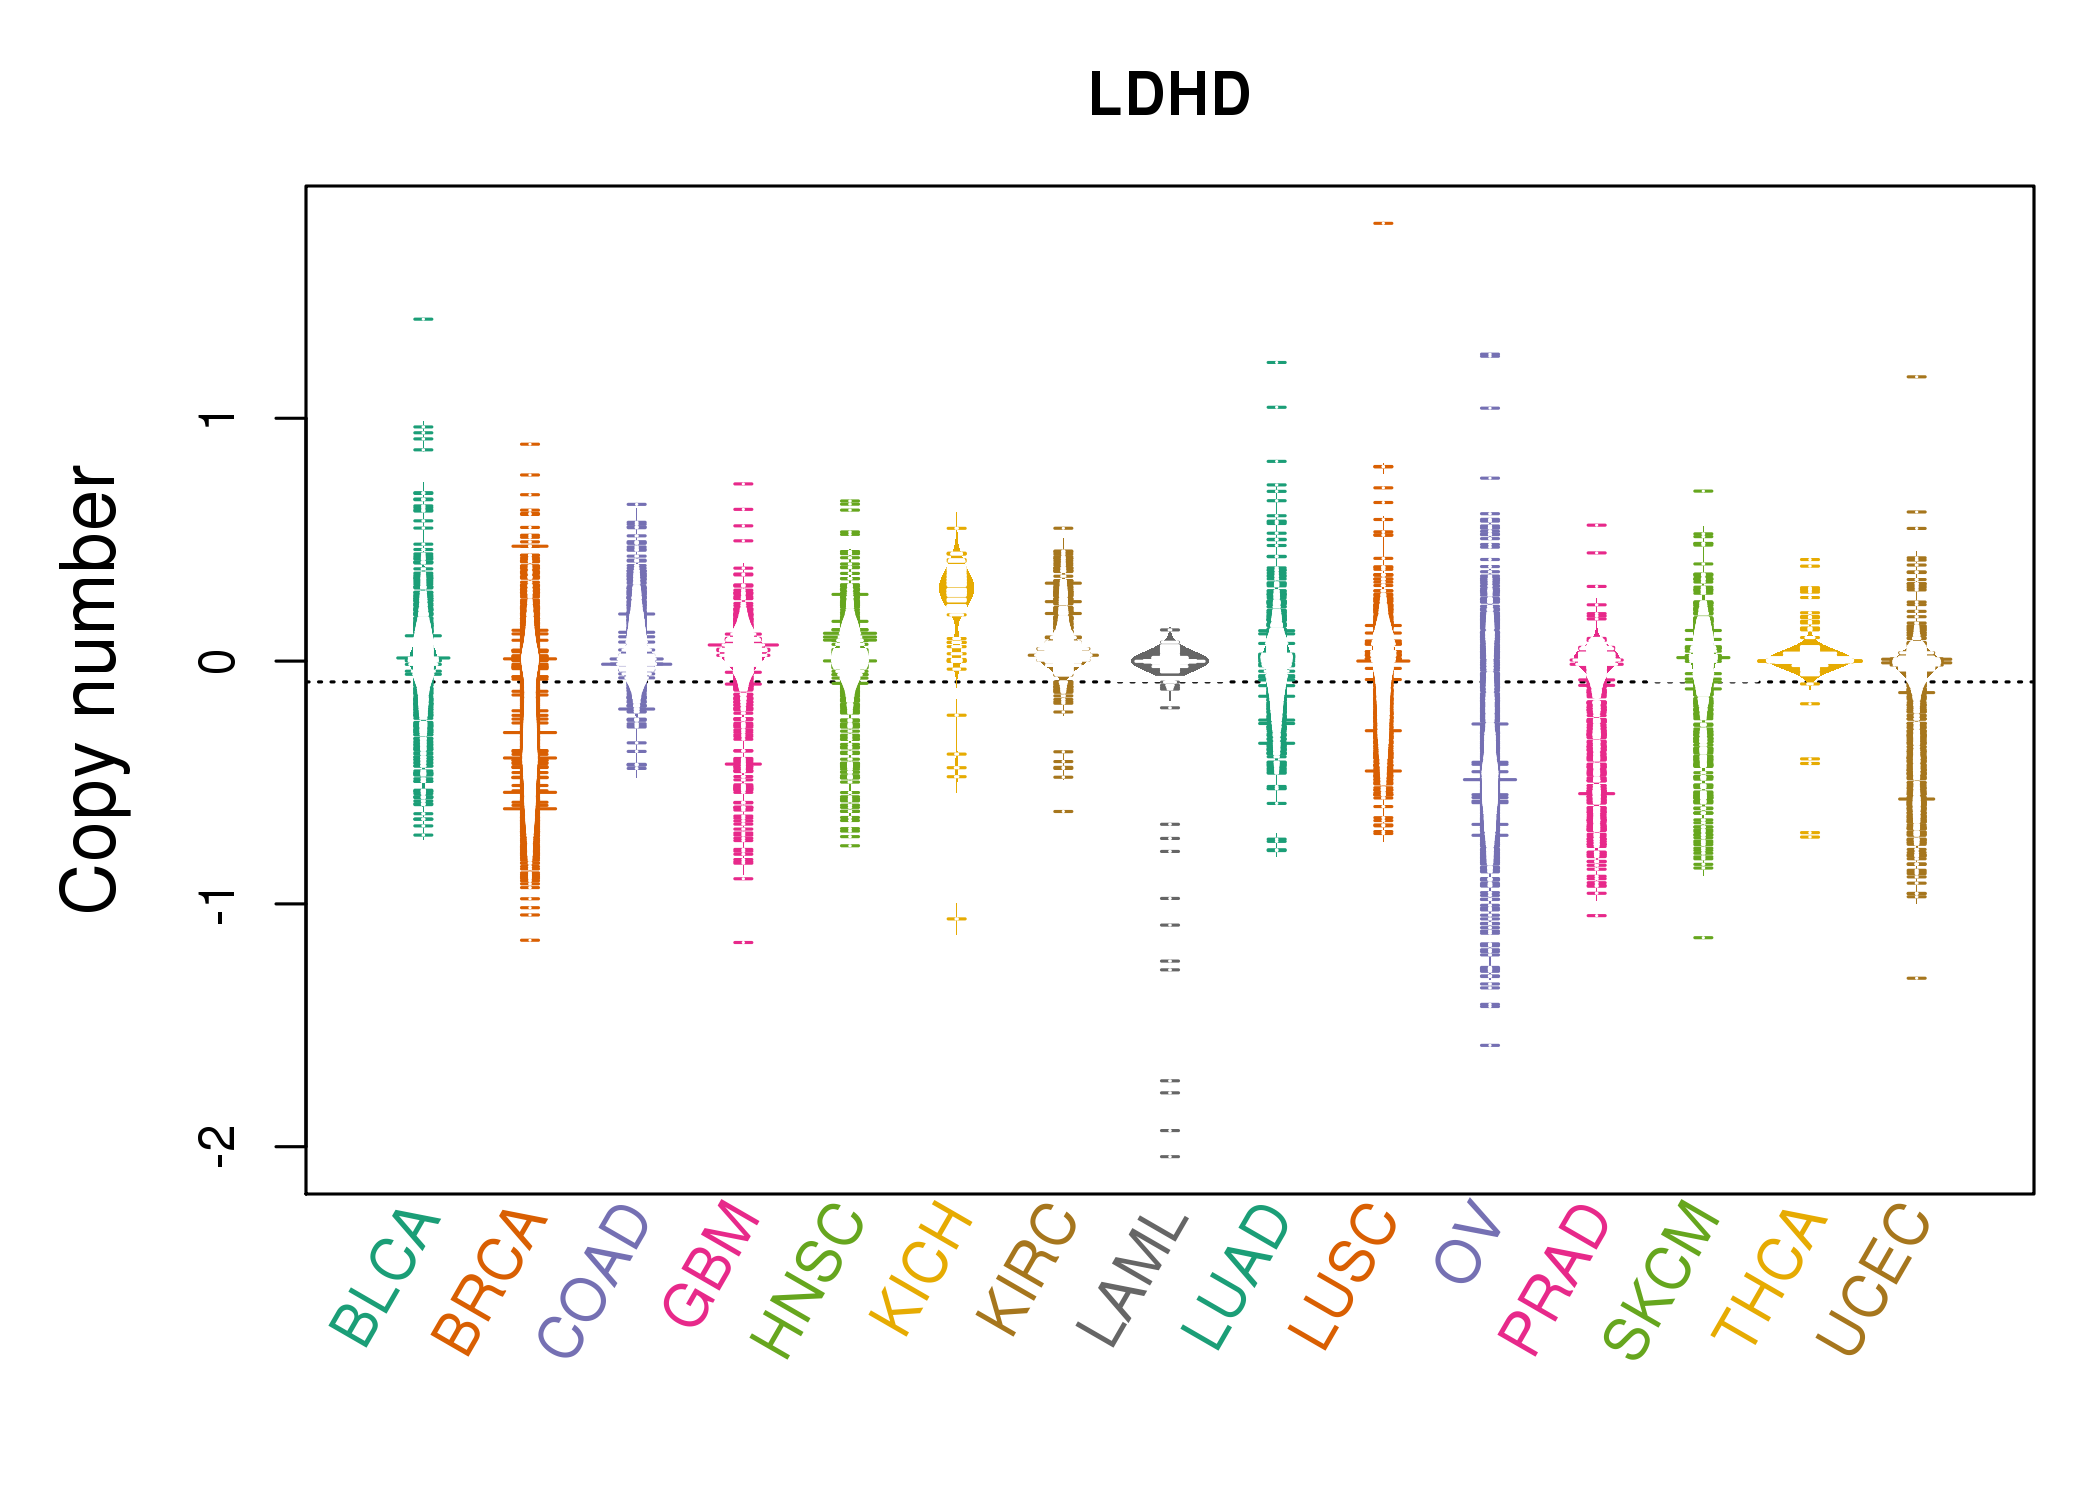 |
| cf) Tissue ID[Tissue type]: BLCA[Bladder Urothelial Carcinoma], BRCA[Breast invasive carcinoma], CESC[Cervical squamous cell carcinoma and endocervical adenocarcinoma], COAD[Colon adenocarcinoma], GBM[Glioblastoma multiforme], Glioma Low Grade, HNSC[Head and Neck squamous cell carcinoma], KICH[Kidney Chromophobe], KIRC[Kidney renal clear cell carcinoma], KIRP[Kidney renal papillary cell carcinoma], LAML[Acute Myeloid Leukemia], LUAD[Lung adenocarcinoma], LUSC[Lung squamous cell carcinoma], OV[Ovarian serous cystadenocarcinoma ], PAAD[Pancreatic adenocarcinoma], PRAD[Prostate adenocarcinoma], SKCM[Skin Cutaneous Melanoma], STAD[Stomach adenocarcinoma], THCA[Thyroid carcinoma], UCEC[Uterine Corpus Endometrial Carcinoma] |
| Top |
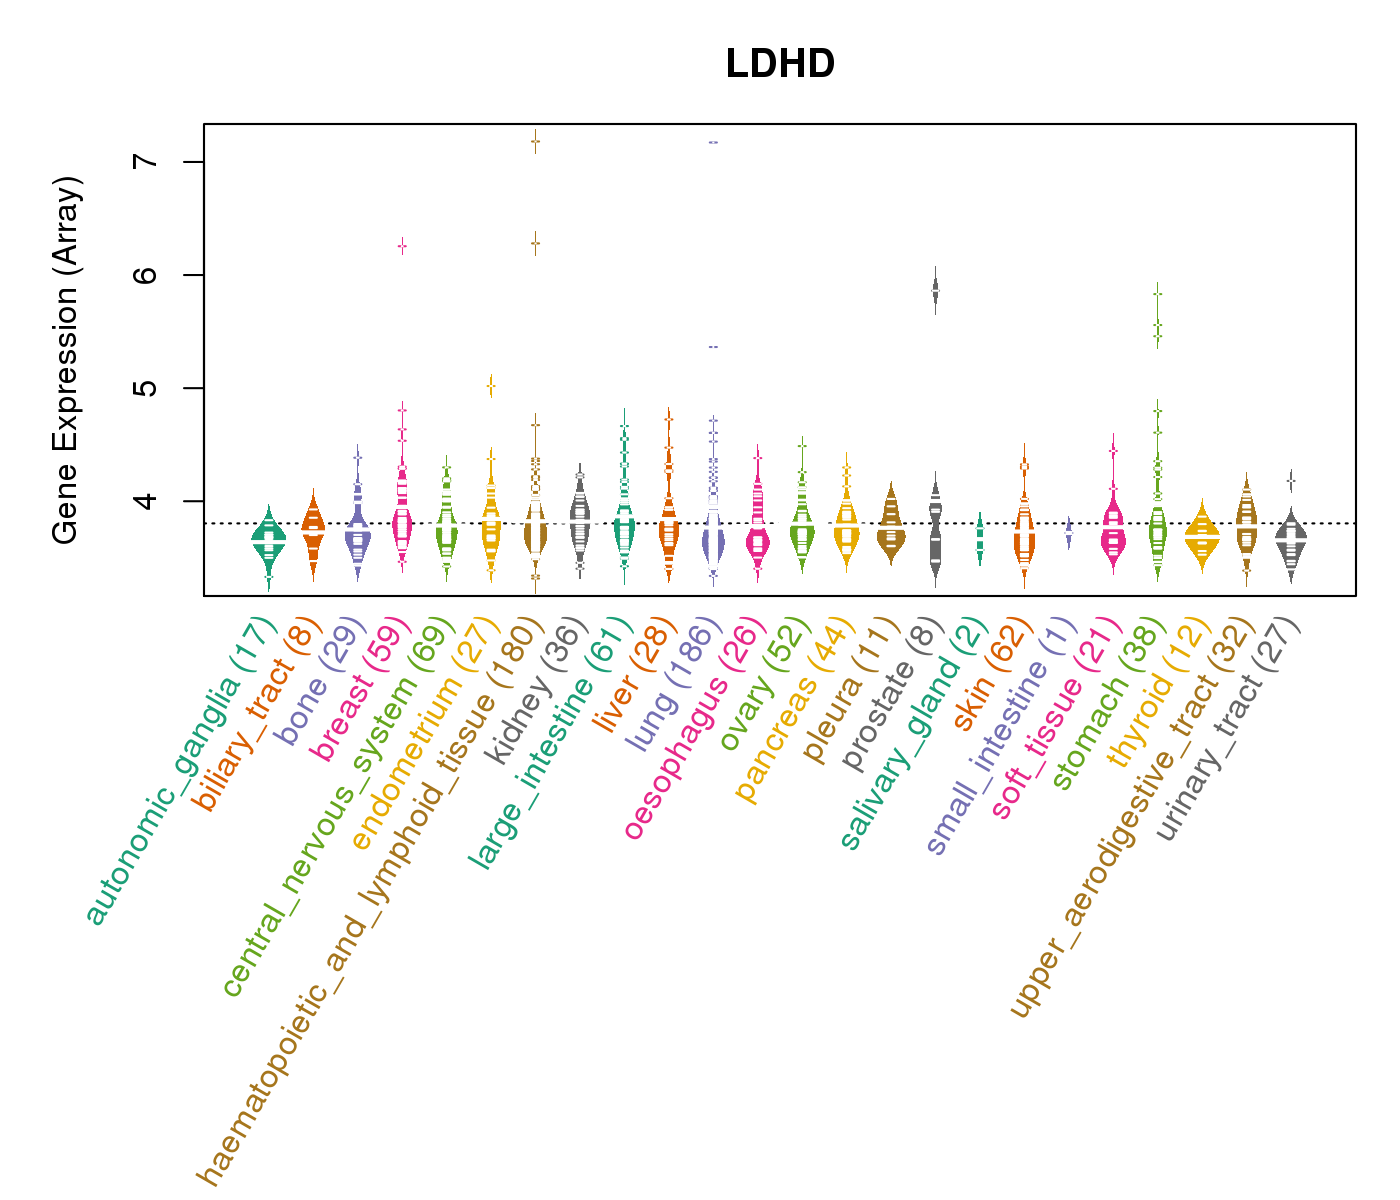
| Gene Expression for LDHD |
| * CCLE gene expression data were extracted from CCLE_Expression_Entrez_2012-10-18.res: Gene-centric RMA-normalized mRNA expression data. |
 |
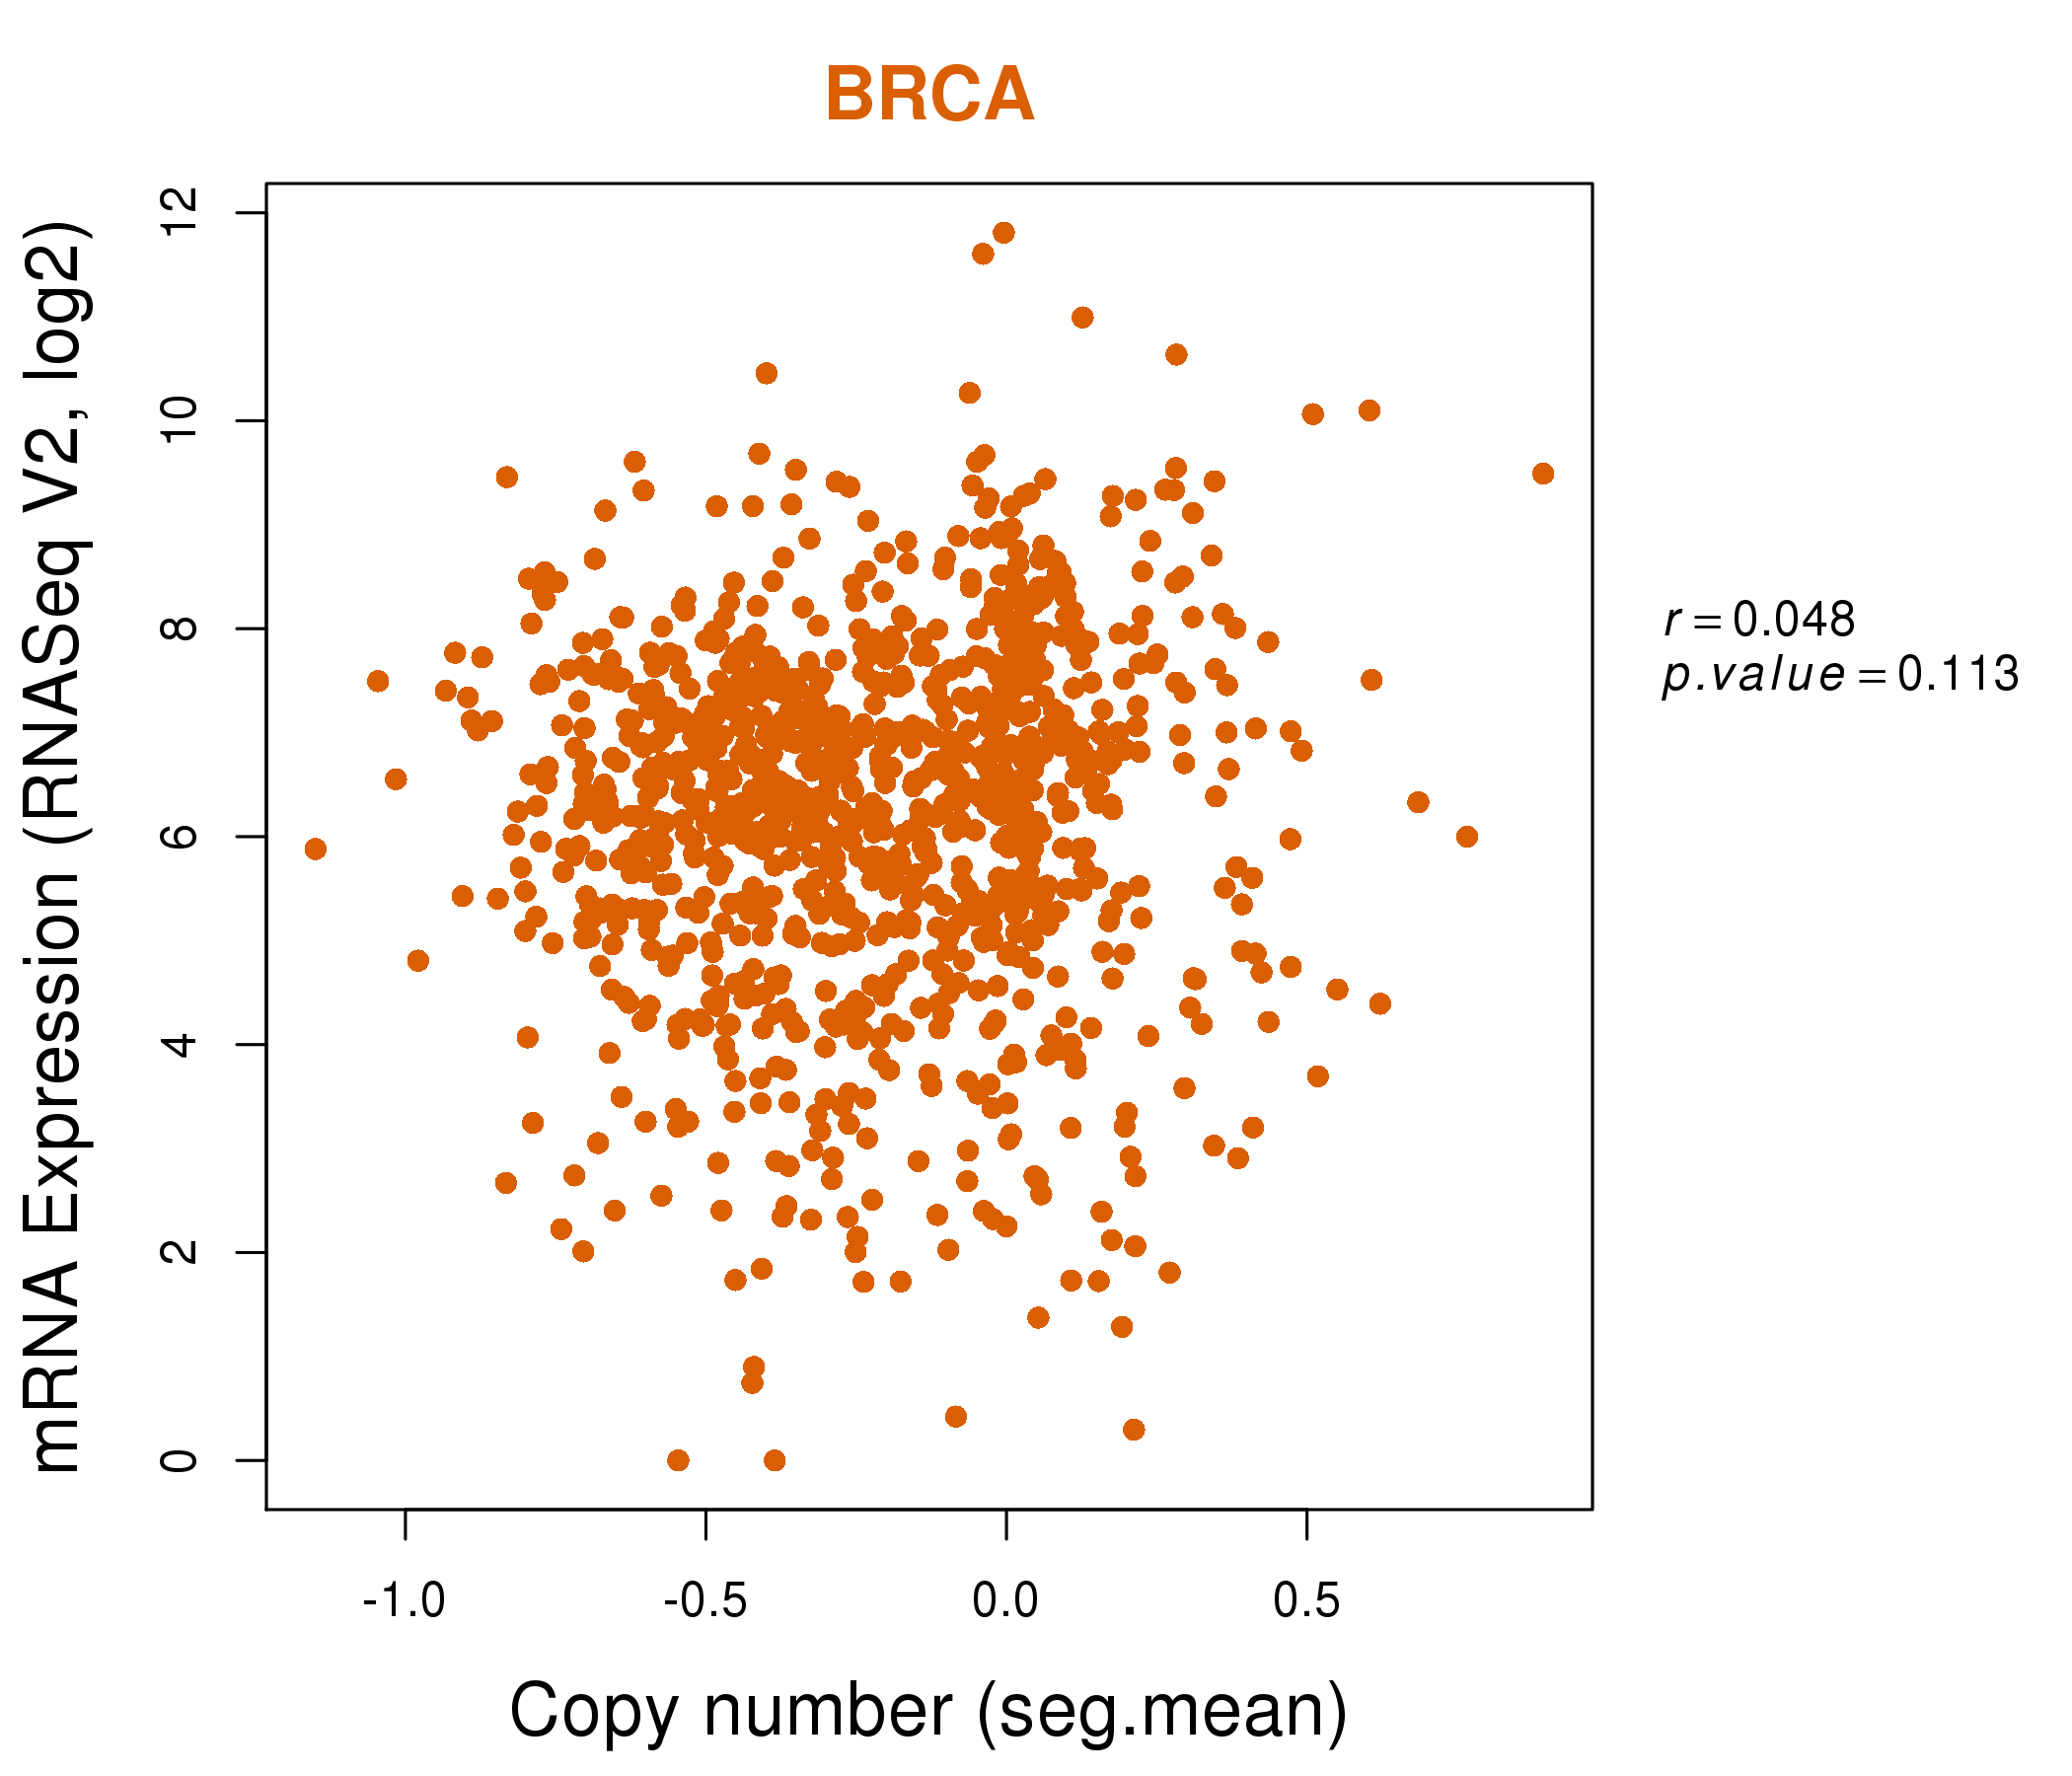
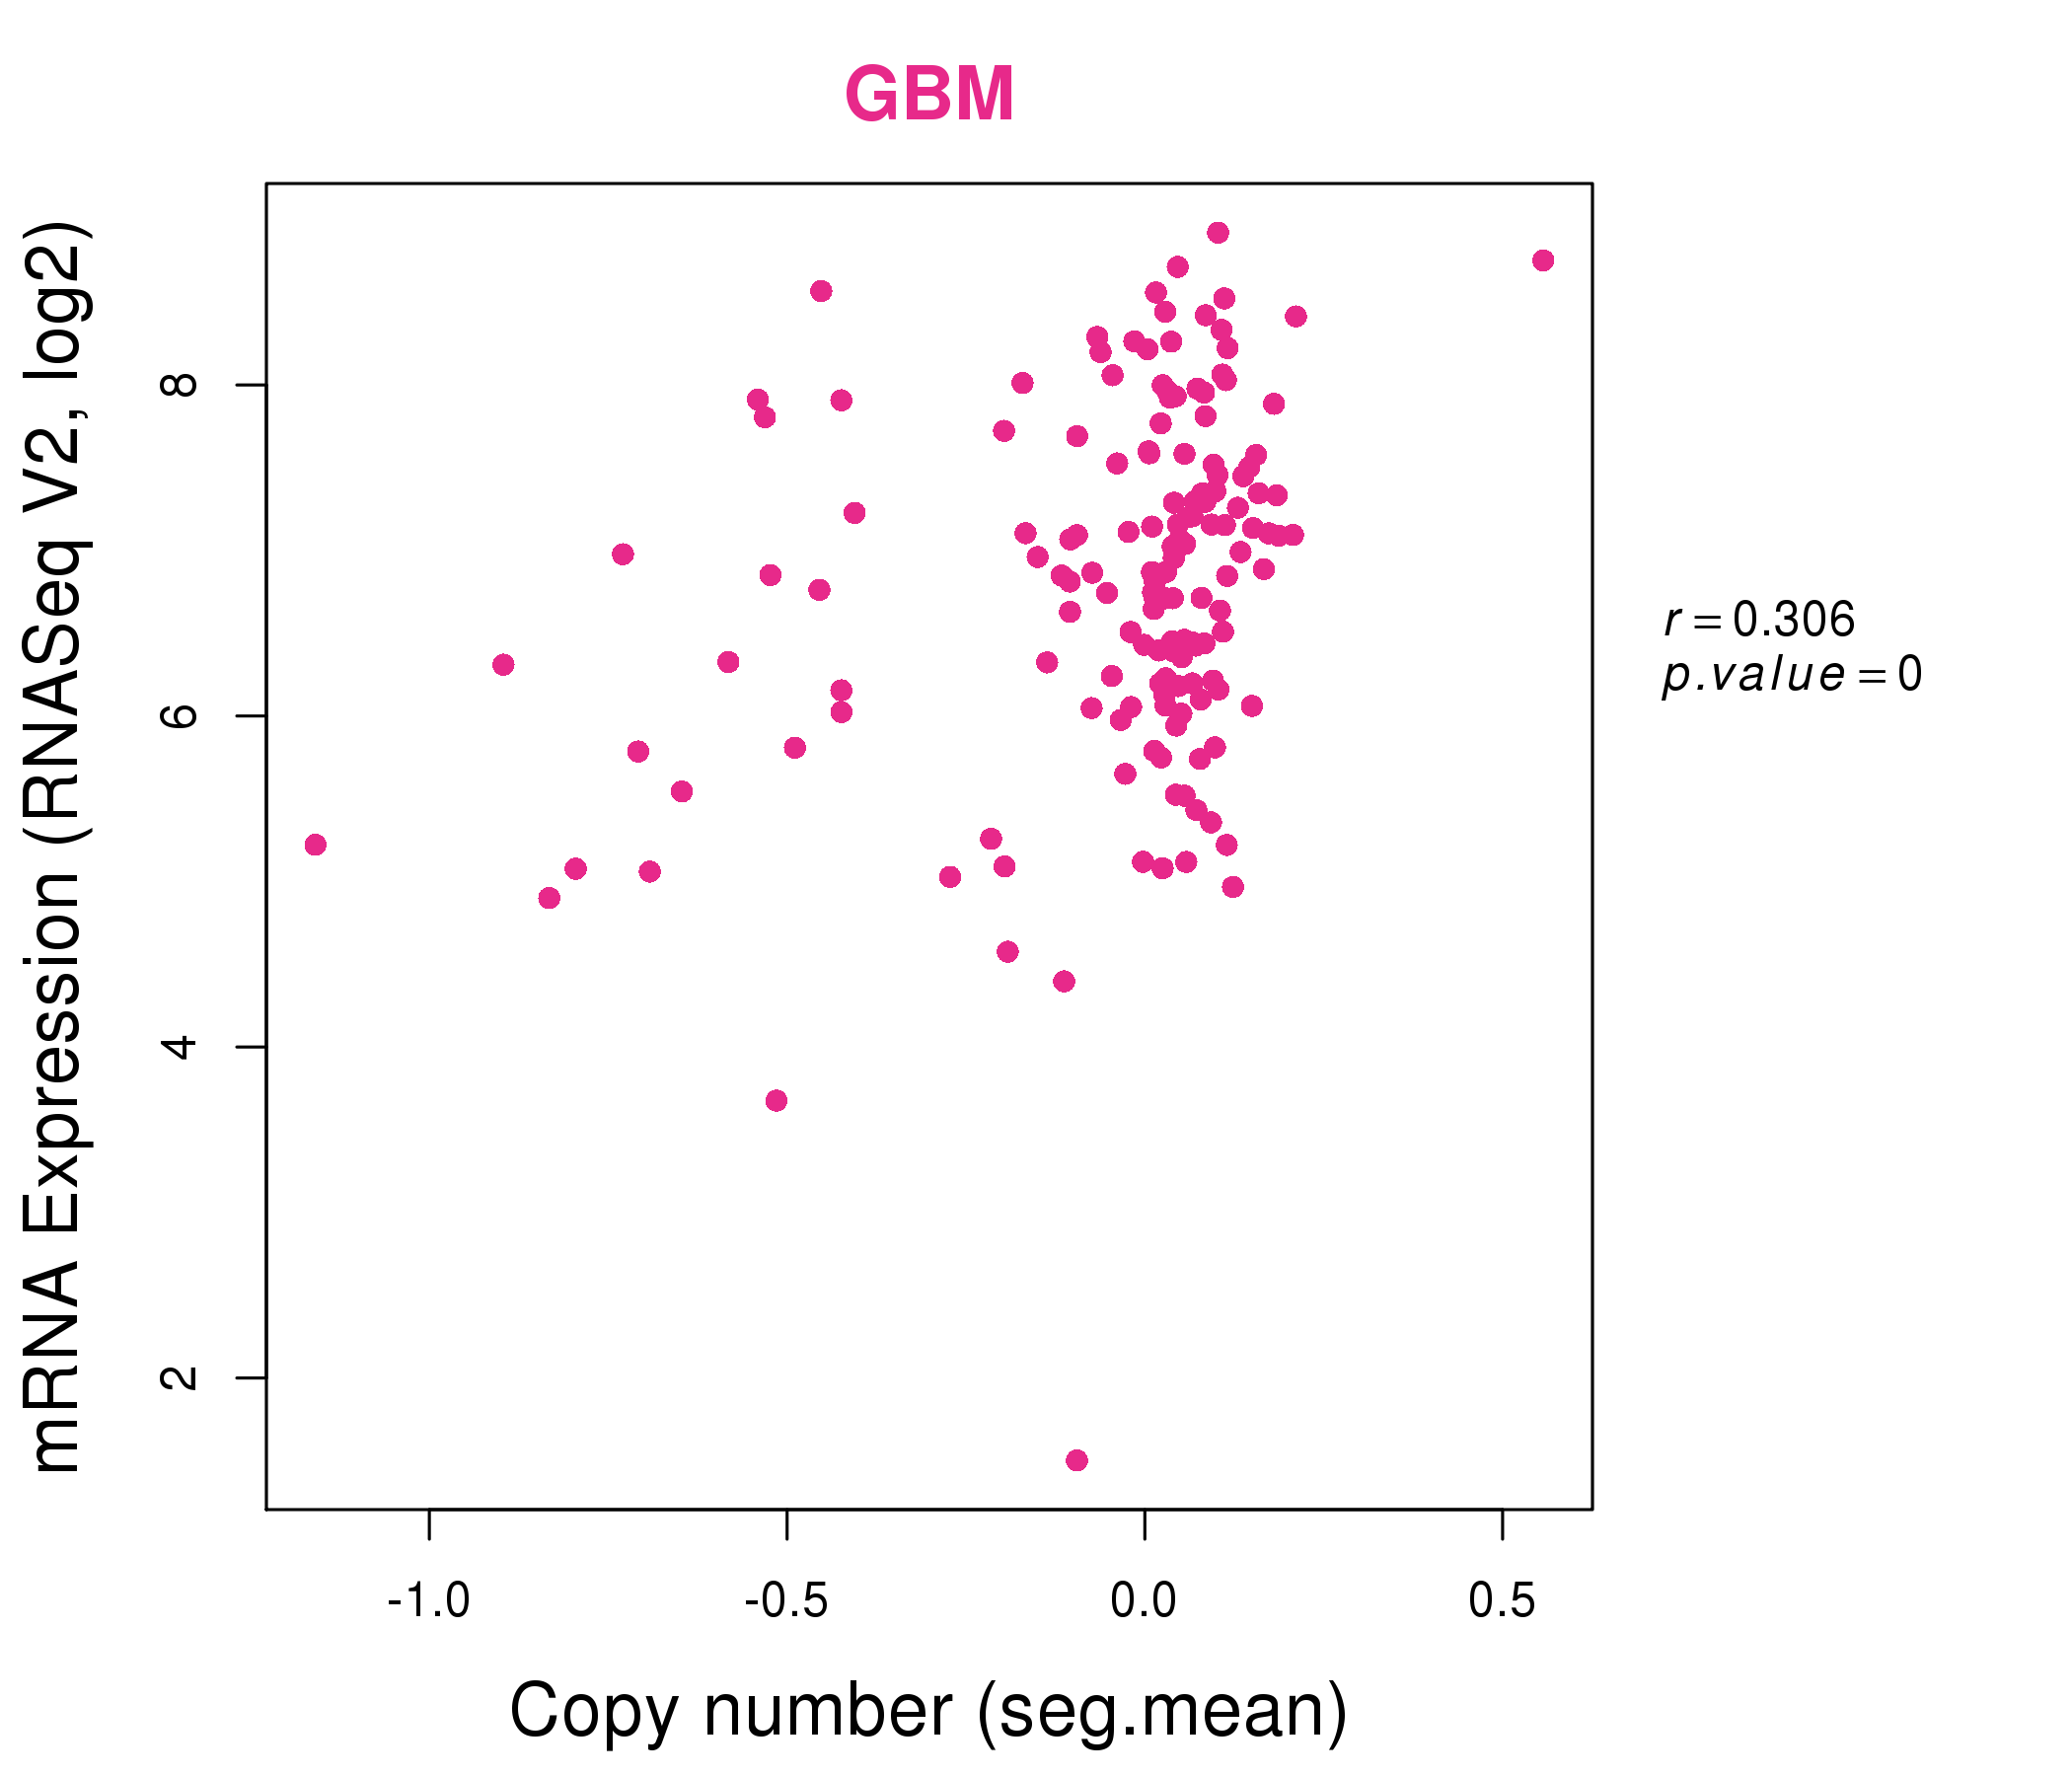
| * Normalized gene expression data of RNASeqV2 was extracted from TCGA using R package TCGA-Assembler. The URLs of all public data files on TCGA DCC data server were gathered at Jan-05-2015. Only eight cancer types have enough normal control samples for differential expression analysis. (t test, adjusted p<0.05 (using Benjamini-Hochberg FDR)) |
 |
| Top |
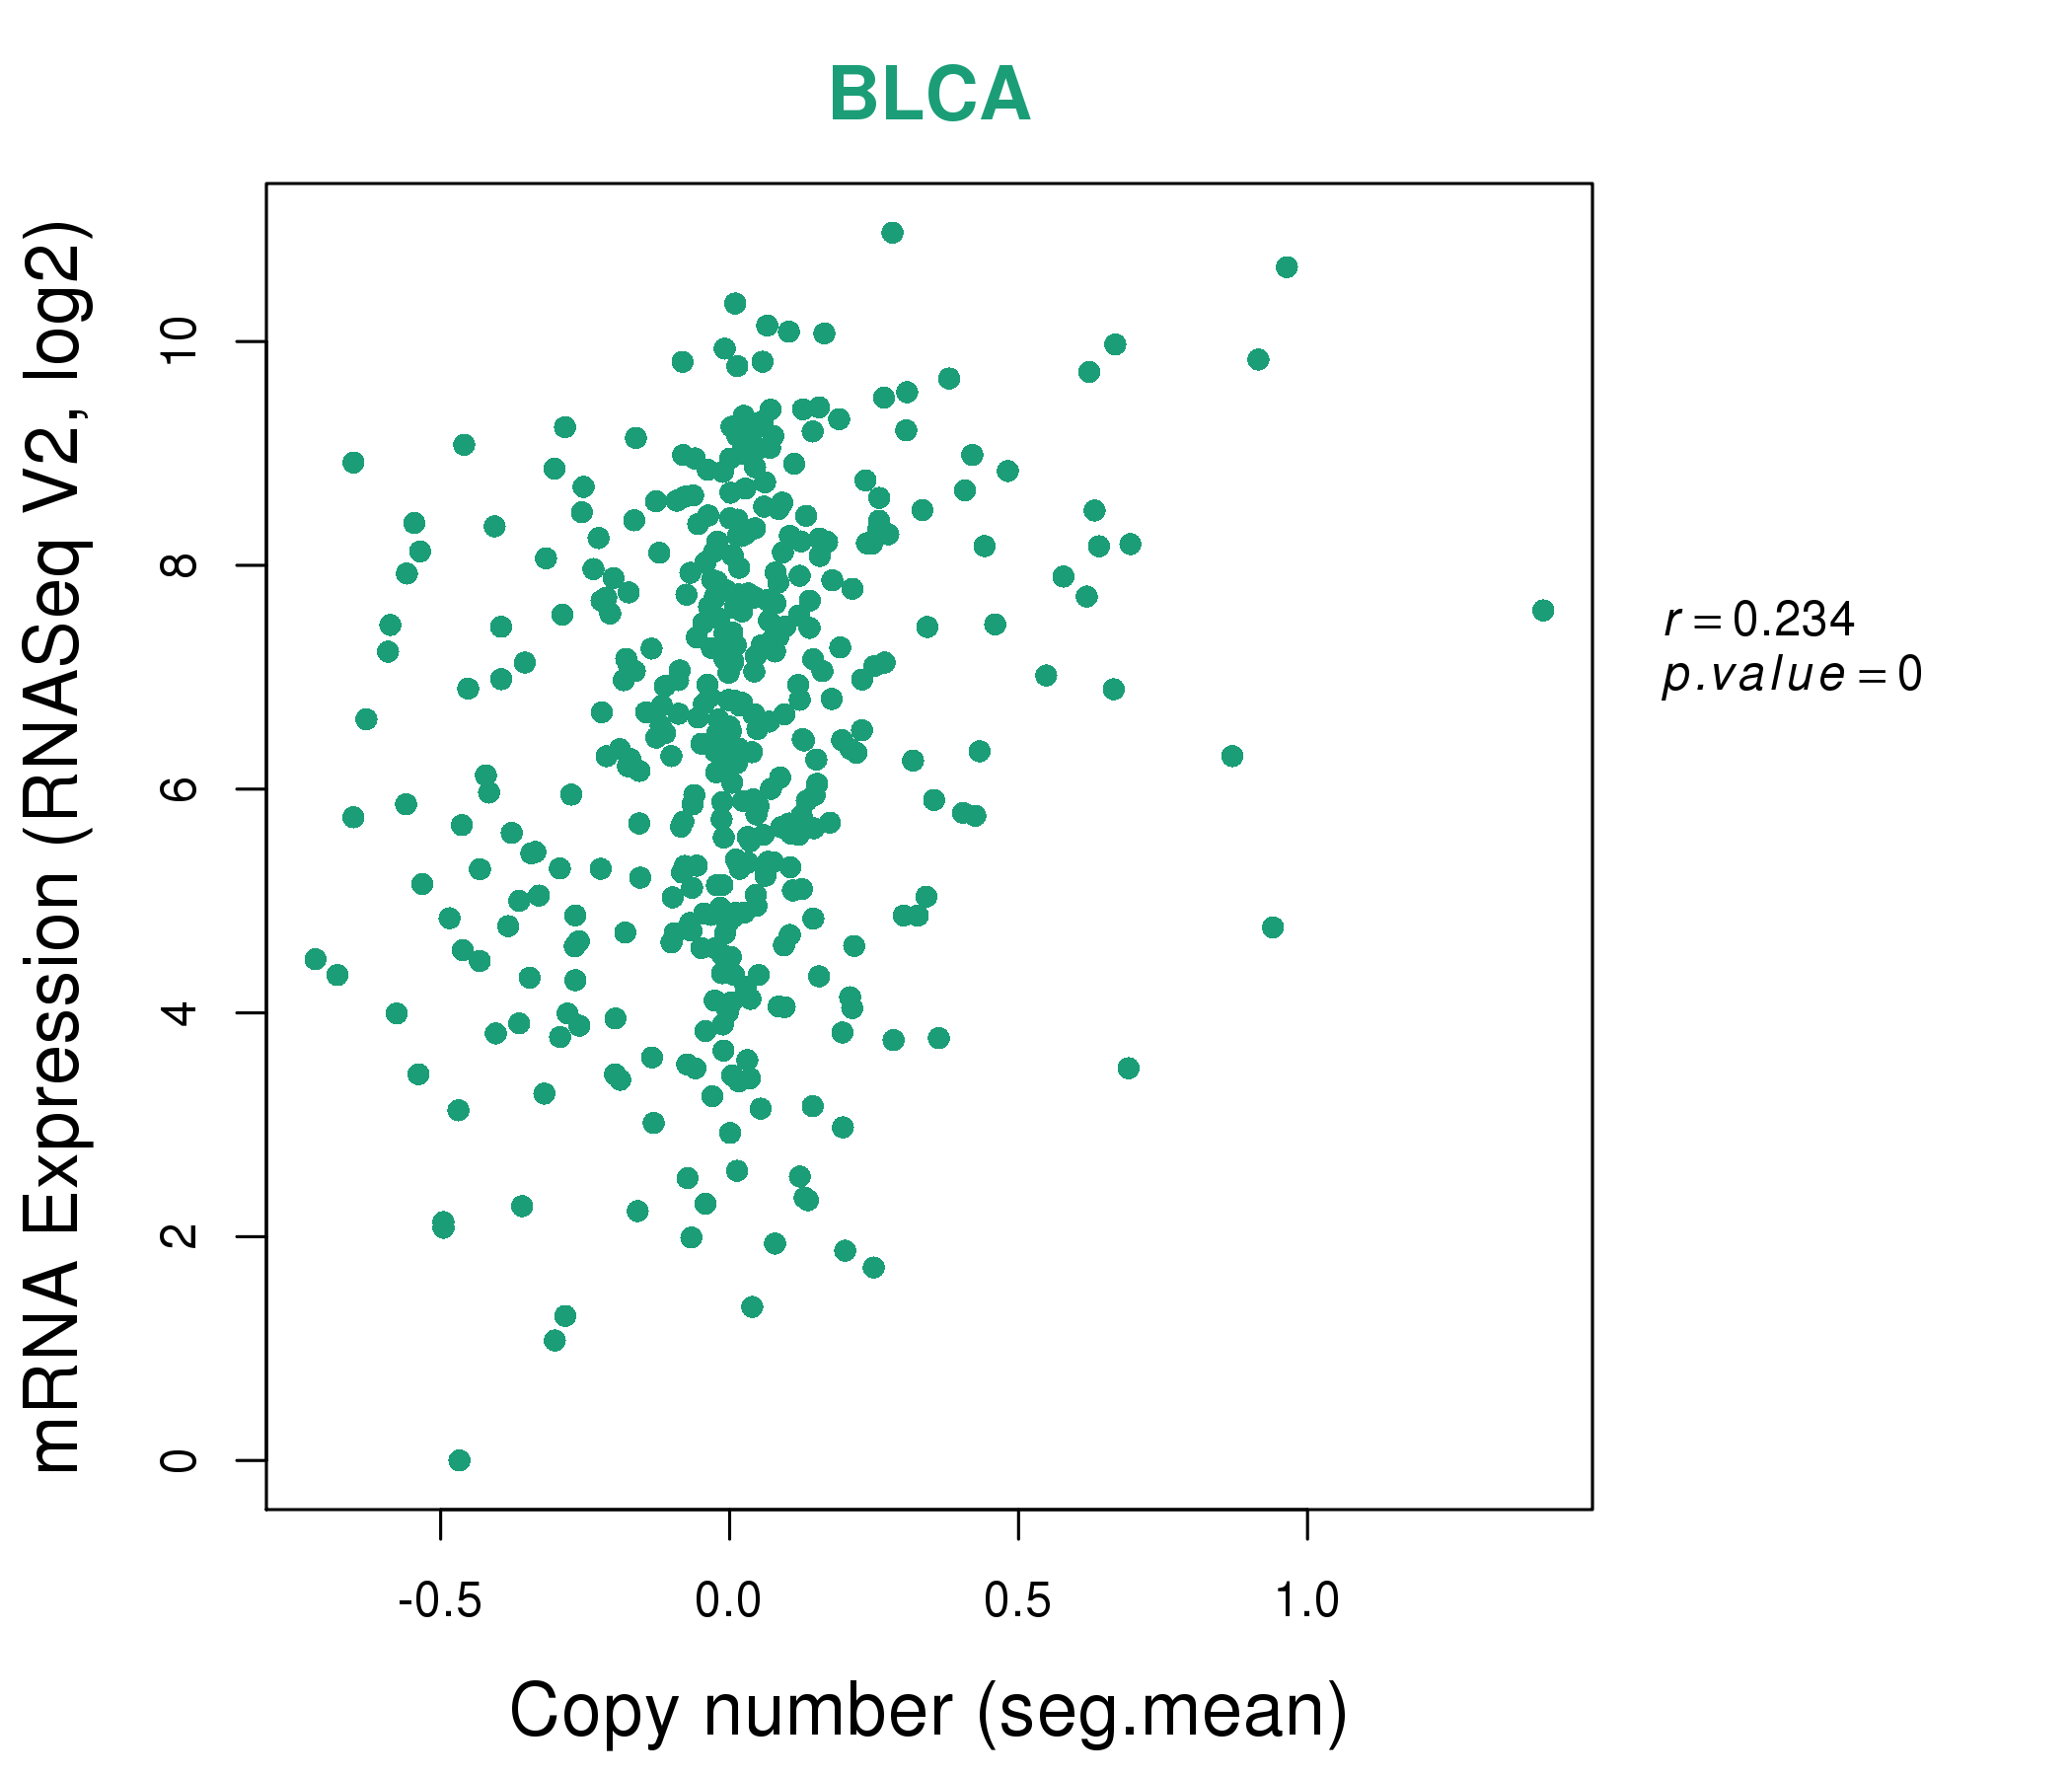
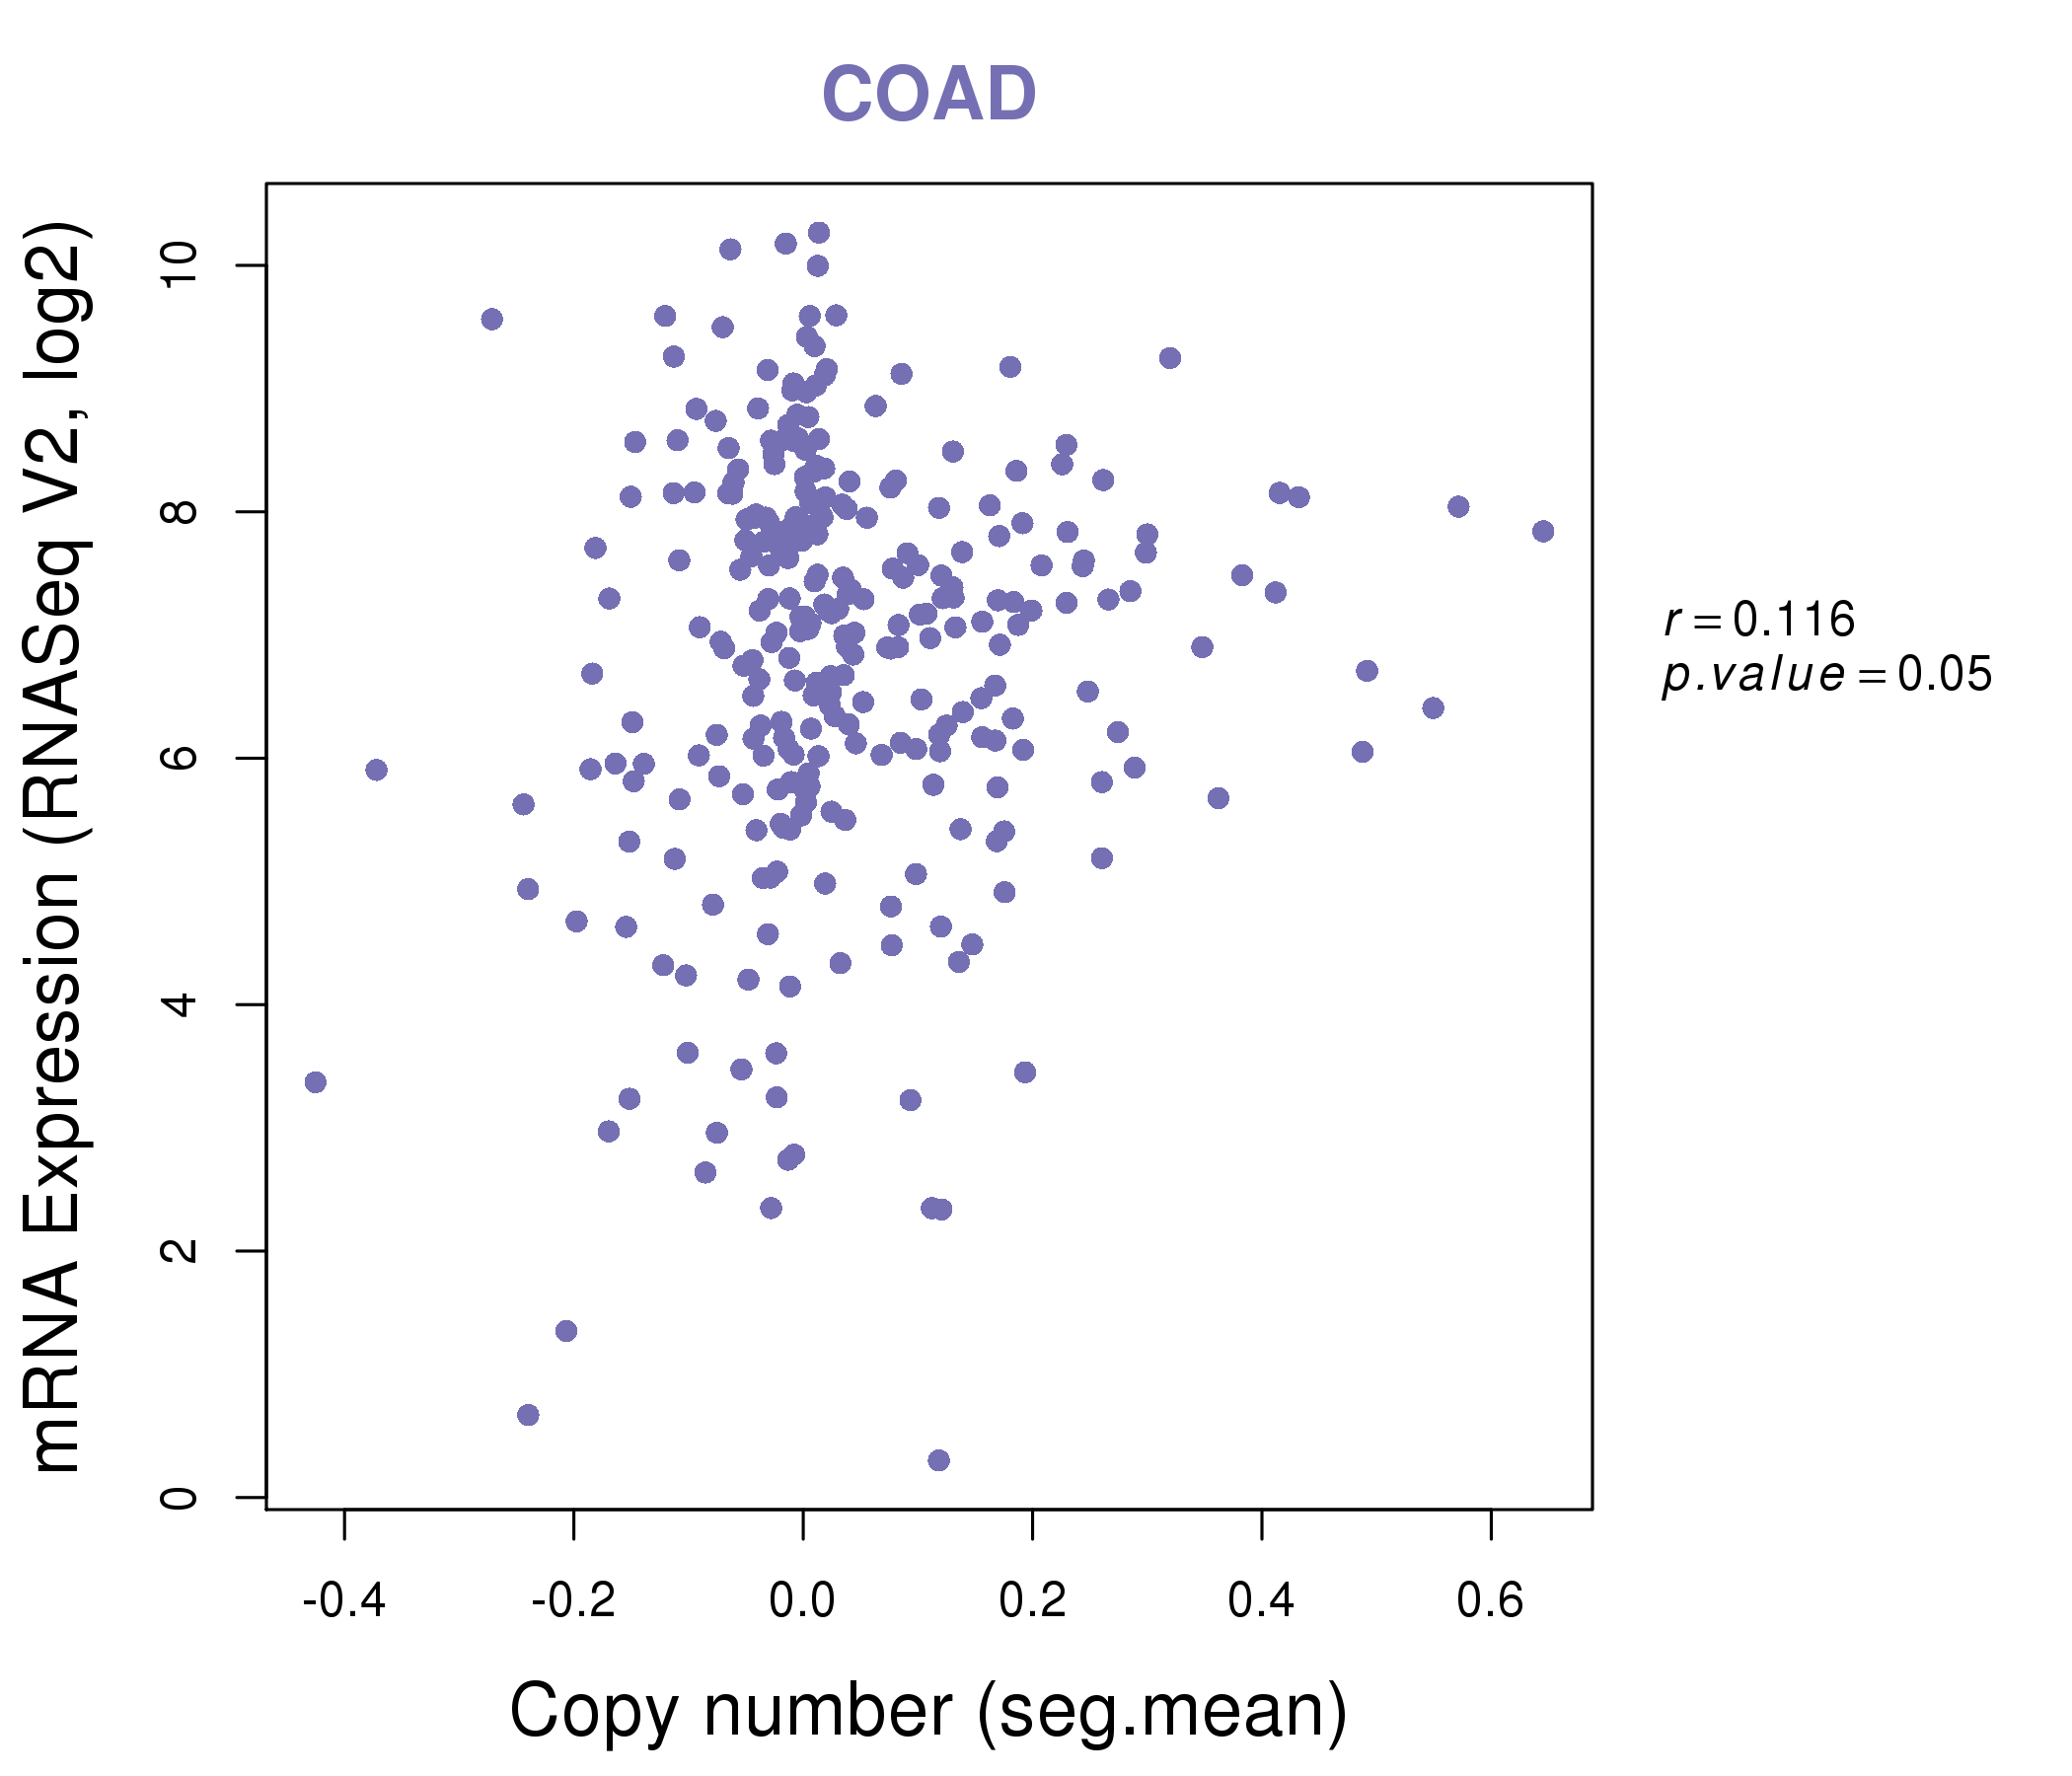
| * This plots show the correlation between CNV and gene expression. |
: Open all plots for all cancer types
 |
|
 |
|
| Top |
| Gene-Gene Network Information |
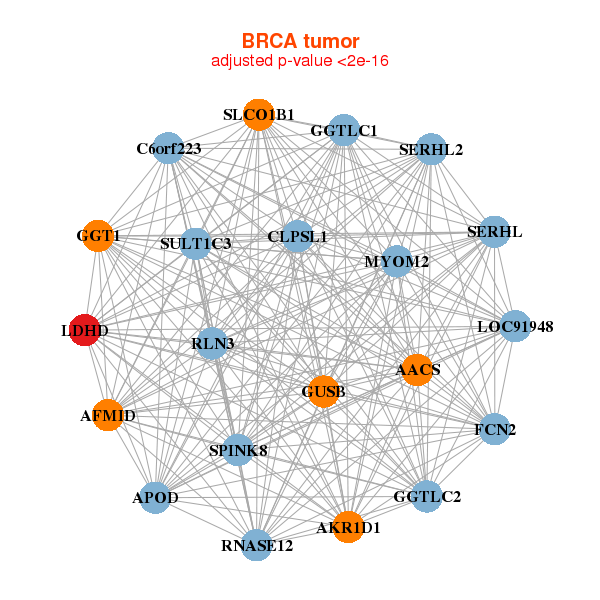
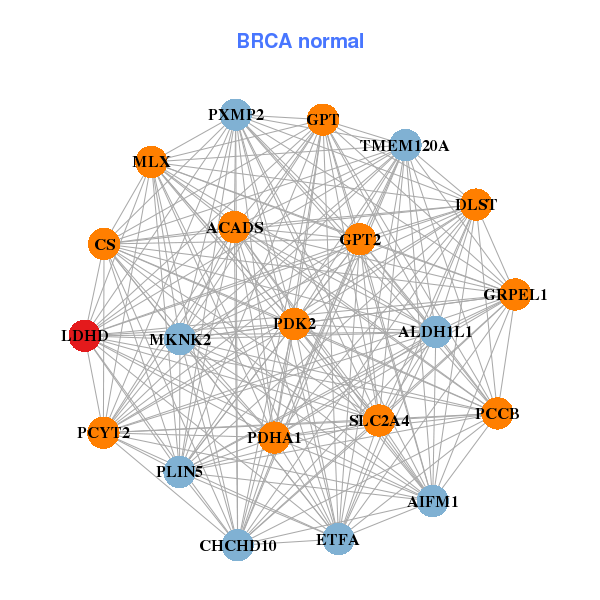
| * Co-Expression network figures were drawn using R package igraph. Only the top 20 genes with the highest correlations were shown. Red circle: input gene, orange circle: cell metabolism gene, sky circle: other gene |
: Open all plots for all cancer types
 |
|
| AACS,AFMID,AKR1D1,APOD,CLPSL1,C6orf223,FCN2, GGT1,GGTLC1,GGTLC2,GUSB,LDHD,LOC91948,MYOM2, RLN3,RNASE12,SERHL2,SERHL,SLCO1B1,SPINK8,SULT1C3 | ACADS,AIFM1,ALDH1L1,CHCHD10,CS,DLST,ETFA, GPT2,GPT,GRPEL1,LDHD,MKNK2,MLX,PCCB, PCYT2,PDHA1,PDK2,PLIN5,PXMP2,SLC2A4,TMEM120A |
 |
|
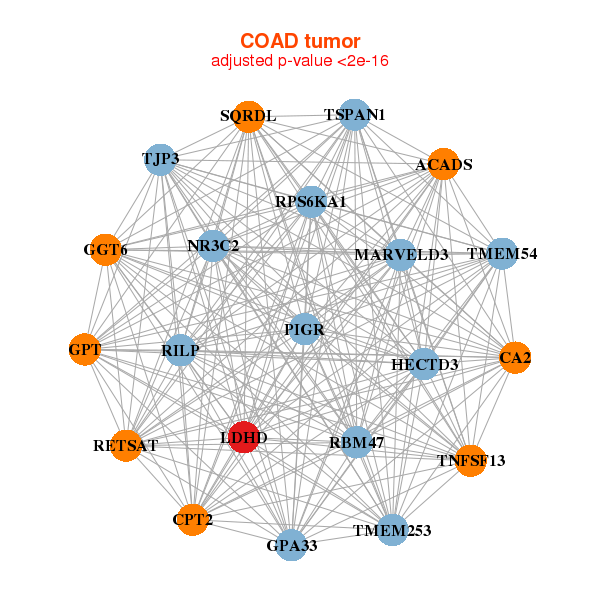
| ACADS,TMEM253,CA2,CPT2,GGT6,GPA33,GPT, HECTD3,LDHD,MARVELD3,NR3C2,PIGR,RBM47,RETSAT, RILP,RPS6KA1,SQRDL,TJP3,TMEM54,TNFSF13,TSPAN1 | ACSS2,CA4,RHOV___CHP1,ETHE1,LDHD,LETM1,LLGL2, LRRC56,MAP2K2,NADK,PPP1R14D,PTK6,RAB40C,SGK2, SIRT7,TJP3,TMEM171,TMEM8A,TNK1,TPRN,TST |
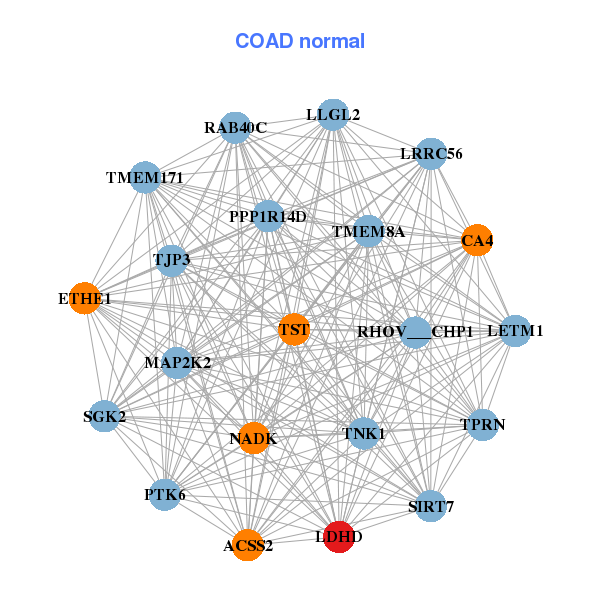
| * Co-Expression network figures were drawn using R package igraph. Only the top 20 genes with the highest correlations were shown. Red circle: input gene, orange circle: cell metabolism gene, sky circle: other gene |
: Open all plots for all cancer types
| Top |
: Open all interacting genes' information including KEGG pathway for all interacting genes from DAVID
| Top |
| Pharmacological Information for LDHD |
| There's no related Drug. |
| Top |
| Cross referenced IDs for LDHD |
| * We obtained these cross-references from Uniprot database. It covers 150 different DBs, 18 categories. http://www.uniprot.org/help/cross_references_section |
: Open all cross reference information
|
Copyright © 2016-Present - The Univsersity of Texas Health Science Center at Houston @ |