|
||||||||||||||||||||
| |
| Phenotypic Information (metabolism pathway, cancer, disease, phenome) |
| |
| |
| Gene-Gene Network Information: Co-Expression Network, Interacting Genes & KEGG |
| |
|


| Gene Summary for FUK |
| Basic gene info. | Gene symbol | FUK |
| Gene name | fucokinase | |
| Synonyms | 1110046B12Rik | |
| Cytomap | UCSC genome browser: 16q22.1 | |
| Genomic location | chr16 :70488497-70514177 | |
| Type of gene | protein-coding | |
| RefGenes | NM_145059.2, | |
| Ensembl id | ENSG00000157353 | |
| Description | L-fucose kinase | |
| Modification date | 20141207 | |
| dbXrefs | MIM : 608675 | |
| HGNC : HGNC | ||
| Ensembl : ENSG00000157353 | ||
| HPRD : 16365 | ||
| Vega : OTTHUMG00000074085 | ||
| Protein | UniProt: go to UniProt's Cross Reference DB Table | |
| Expression | CleanEX: HS_FUK | |
| BioGPS: 197258 | ||
| Gene Expression Atlas: ENSG00000157353 | ||
| The Human Protein Atlas: ENSG00000157353 | ||
| Pathway | NCI Pathway Interaction Database: FUK | |
| KEGG: FUK | ||
| REACTOME: FUK | ||
| ConsensusPathDB | ||
| Pathway Commons: FUK | ||
| Metabolism | MetaCyc: FUK | |
| HUMANCyc: FUK | ||
| Regulation | Ensembl's Regulation: ENSG00000157353 | |
| miRBase: chr16 :70,488,497-70,514,177 | ||
| TargetScan: NM_145059 | ||
| cisRED: ENSG00000157353 | ||
| Context | iHOP: FUK | |
| cancer metabolism search in PubMed: FUK | ||
| UCL Cancer Institute: FUK | ||
| Assigned class in ccmGDB | C | |
| Top |
| Phenotypic Information for FUK(metabolism pathway, cancer, disease, phenome) |
| Cancer | CGAP: FUK |
| Familial Cancer Database: FUK | |
| * This gene is included in those cancer gene databases. |
|
|
|
|
|
| . | ||||||||||||||
Oncogene 1 | Significant driver gene in | |||||||||||||||||||
| cf) number; DB name 1 Oncogene; http://nar.oxfordjournals.org/content/35/suppl_1/D721.long, 2 Tumor Suppressor gene; https://bioinfo.uth.edu/TSGene/, 3 Cancer Gene Census; http://www.nature.com/nrc/journal/v4/n3/abs/nrc1299.html, 4 CancerGenes; http://nar.oxfordjournals.org/content/35/suppl_1/D721.long, 5 Network of Cancer Gene; http://ncg.kcl.ac.uk/index.php, 1Therapeutic Vulnerabilities in Cancer; http://cbio.mskcc.org/cancergenomics/statius/ |
| KEGG_FRUCTOSE_AND_MANNOSE_METABOLISM KEGG_AMINO_SUGAR_AND_NUCLEOTIDE_SUGAR_METABOLISM | |
| OMIM | |
| Orphanet | |
| Disease | KEGG Disease: FUK |
| MedGen: FUK (Human Medical Genetics with Condition) | |
| ClinVar: FUK | |
| Phenotype | MGI: FUK (International Mouse Phenotyping Consortium) |
| PhenomicDB: FUK | |
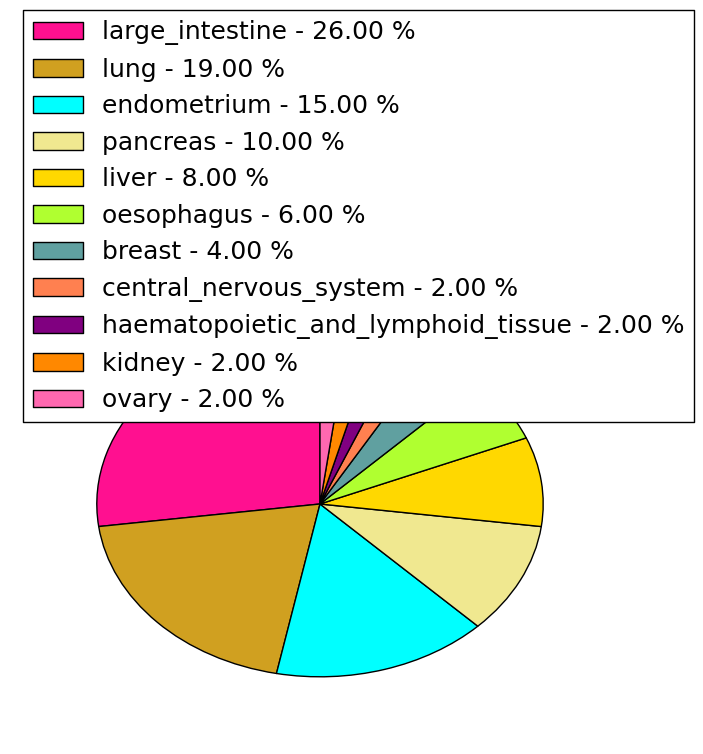
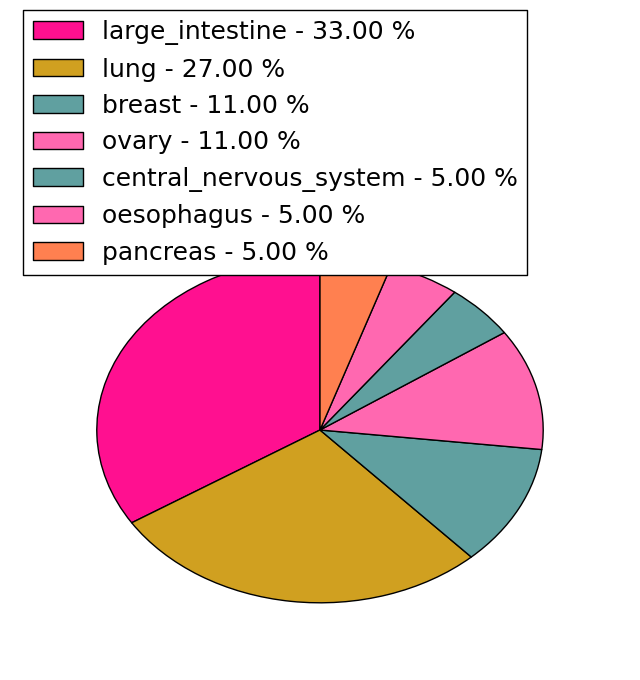
| Mutations for FUK |
| * Under tables are showing count per each tissue to give us broad intuition about tissue specific mutation patterns.You can go to the detailed page for each mutation database's web site. |
| - Statistics for Tissue and Mutation type | Top |
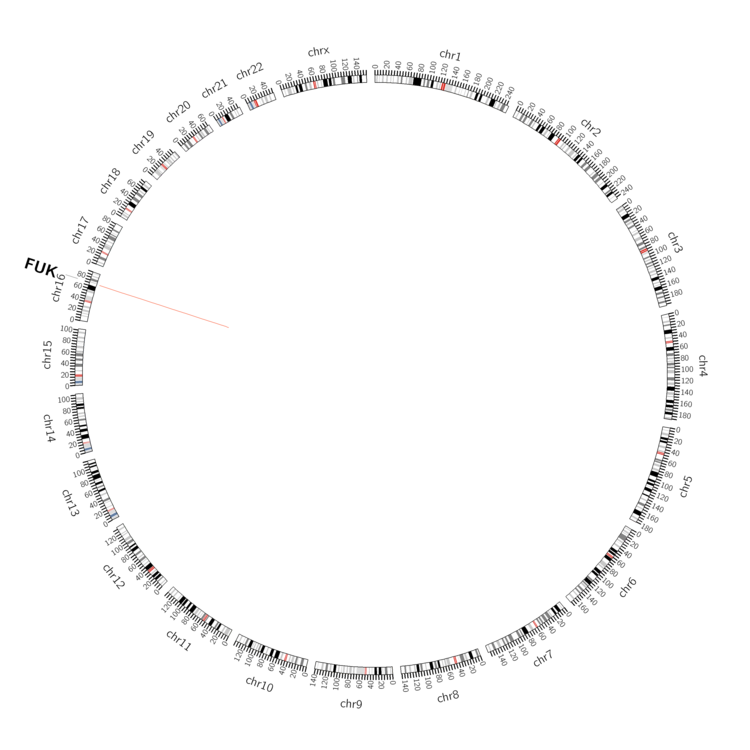 |
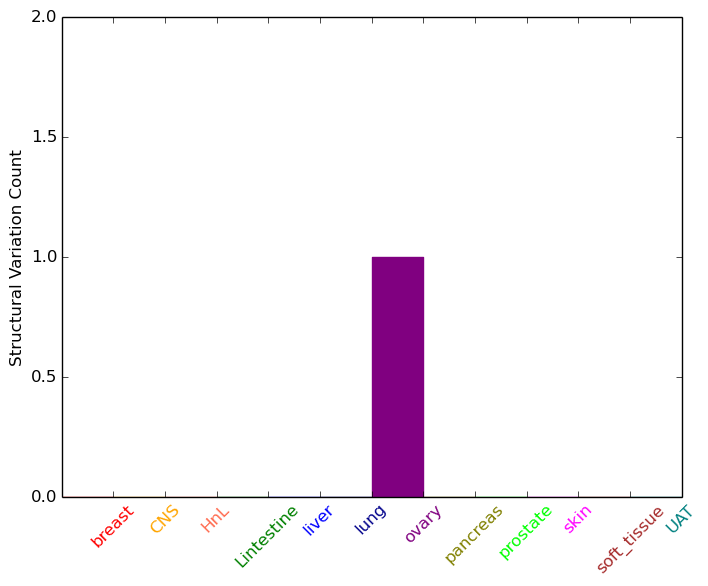
| - For Inter-chromosomal Variations |
| There's no inter-chromosomal structural variation. |
| - For Intra-chromosomal Variations |
| * Intra-chromosomal variantions includes 'intrachromosomal amplicon to amplicon', 'intrachromosomal amplicon to non-amplified dna', 'intrachromosomal deletion', 'intrachromosomal fold-back inversion', 'intrachromosomal inversion', 'intrachromosomal tandem duplication', 'Intrachromosomal unknown type', 'intrachromosomal with inverted orientation', 'intrachromosomal with non-inverted orientation'. |
 |
| Sample | Symbol_a | Chr_a | Start_a | End_a | Symbol_b | Chr_b | Start_b | End_b |
| ovary | FUK | chr16 | 70510855 | 70510875 | FUK | chr16 | 70507357 | 70507377 |
| cf) Tissue number; Tissue name (1;Breast, 2;Central_nervous_system, 3;Haematopoietic_and_lymphoid_tissue, 4;Large_intestine, 5;Liver, 6;Lung, 7;Ovary, 8;Pancreas, 9;Prostate, 10;Skin, 11;Soft_tissue, 12;Upper_aerodigestive_tract) |
| * From mRNA Sanger sequences, Chitars2.0 arranged chimeric transcripts. This table shows FUK related fusion information. |
| ID | Head Gene | Tail Gene | Accession | Gene_a | qStart_a | qEnd_a | Chromosome_a | tStart_a | tEnd_a | Gene_a | qStart_a | qEnd_a | Chromosome_a | tStart_a | tEnd_a |
| BE147710 | FUK | 14 | 189 | 16 | 70511292 | 70511468 | PARD3 | 182 | 384 | 10 | 34682029 | 34682233 | |
| DB451208 | FUK | 1 | 409 | 16 | 70488328 | 70497624 | DNMT3B | 407 | 477 | 20 | 31390240 | 31390310 | |
| Top |
| There's no copy number variation information in COSMIC data for this gene. |
| Top |
|
 |
| Top |
| Stat. for Non-Synonymous SNVs (# total SNVs=46) | (# total SNVs=18) |
 |  |
(# total SNVs=1) | (# total SNVs=1) |
 |  |
| Top |
| * When you move the cursor on each content, you can see more deailed mutation information on the Tooltip. Those are primary_site,primary_histology,mutation(aa),pubmedID. |
| GRCh37 position | Mutation(aa) | Unique sampleID count |
| chr16:70506907-70506907 | p.P476P | 3 |
| chr16:70512475-70512475 | p.A951S | 2 |
| chr16:70508837-70508837 | p.R767Q | 2 |
| chr16:70509291-70509291 | p.V806M | 2 |
| chr16:70497629-70497629 | p.N62N | 2 |
| chr16:70509652-70509652 | p.E875Q | 2 |
| chr16:70506488-70506488 | p.F462F | 2 |
| chr16:70502792-70502792 | p.R235H | 2 |
| chr16:70500855-70500855 | p.P161L | 1 |
| chr16:70506490-70506490 | p.F463S | 1 |
| Top |
|
 |
| Point Mutation/ Tissue ID | 1 | 2 | 3 | 4 | 5 | 6 | 7 | 8 | 9 | 10 | 11 | 12 | 13 | 14 | 15 | 16 | 17 | 18 | 19 | 20 |
| # sample | 3 | 3 | 14 | 2 | 6 | 5 | 2 | 1 | 2 | 6 | 5 | 1 | 7 | |||||||
| # mutation | 3 | 3 | 12 | 2 | 6 | 5 | 2 | 1 | 2 | 6 | 5 | 1 | 6 | |||||||
| nonsynonymous SNV | 2 | 2 | 7 | 1 | 4 | 2 | 1 | 1 | 3 | 2 | 1 | 6 | ||||||||
| synonymous SNV | 1 | 1 | 5 | 1 | 2 | 3 | 1 | 2 | 3 | 3 |
| cf) Tissue ID; Tissue type (1; BLCA[Bladder Urothelial Carcinoma], 2; BRCA[Breast invasive carcinoma], 3; CESC[Cervical squamous cell carcinoma and endocervical adenocarcinoma], 4; COAD[Colon adenocarcinoma], 5; GBM[Glioblastoma multiforme], 6; Glioma Low Grade, 7; HNSC[Head and Neck squamous cell carcinoma], 8; KICH[Kidney Chromophobe], 9; KIRC[Kidney renal clear cell carcinoma], 10; KIRP[Kidney renal papillary cell carcinoma], 11; LAML[Acute Myeloid Leukemia], 12; LUAD[Lung adenocarcinoma], 13; LUSC[Lung squamous cell carcinoma], 14; OV[Ovarian serous cystadenocarcinoma ], 15; PAAD[Pancreatic adenocarcinoma], 16; PRAD[Prostate adenocarcinoma], 17; SKCM[Skin Cutaneous Melanoma], 18:STAD[Stomach adenocarcinoma], 19:THCA[Thyroid carcinoma], 20:UCEC[Uterine Corpus Endometrial Carcinoma]) |
| Top |
| * We represented just top 10 SNVs. When you move the cursor on each content, you can see more deailed mutation information on the Tooltip. Those are primary_site, primary_histology, mutation(aa), pubmedID. |
| Genomic Position | Mutation(aa) | Unique sampleID count |
| chr16:70508837 | p.R767Q | 3 |
| chr16:70506488 | p.R235H | 2 |
| chr16:70502792 | p.F462F | 2 |
| chr16:70503177 | p.L43L | 1 |
| chr16:70497568 | p.E461E | 1 |
| chr16:70505166 | p.X1085X | 1 |
| chr16:70500855 | p.K52T | 1 |
| chr16:70512547 | p.P243S | 1 |
| chr16:70503181 | p.S56R | 1 |
| chr16:70497570 | p.E279E | 1 |
| * Copy number data were extracted from TCGA using R package TCGA-Assembler. The URLs of all public data files on TCGA DCC data server were gathered on Jan-05-2015. Function ProcessCNAData in TCGA-Assembler package was used to obtain gene-level copy number value which is calculated as the average copy number of the genomic region of a gene. |
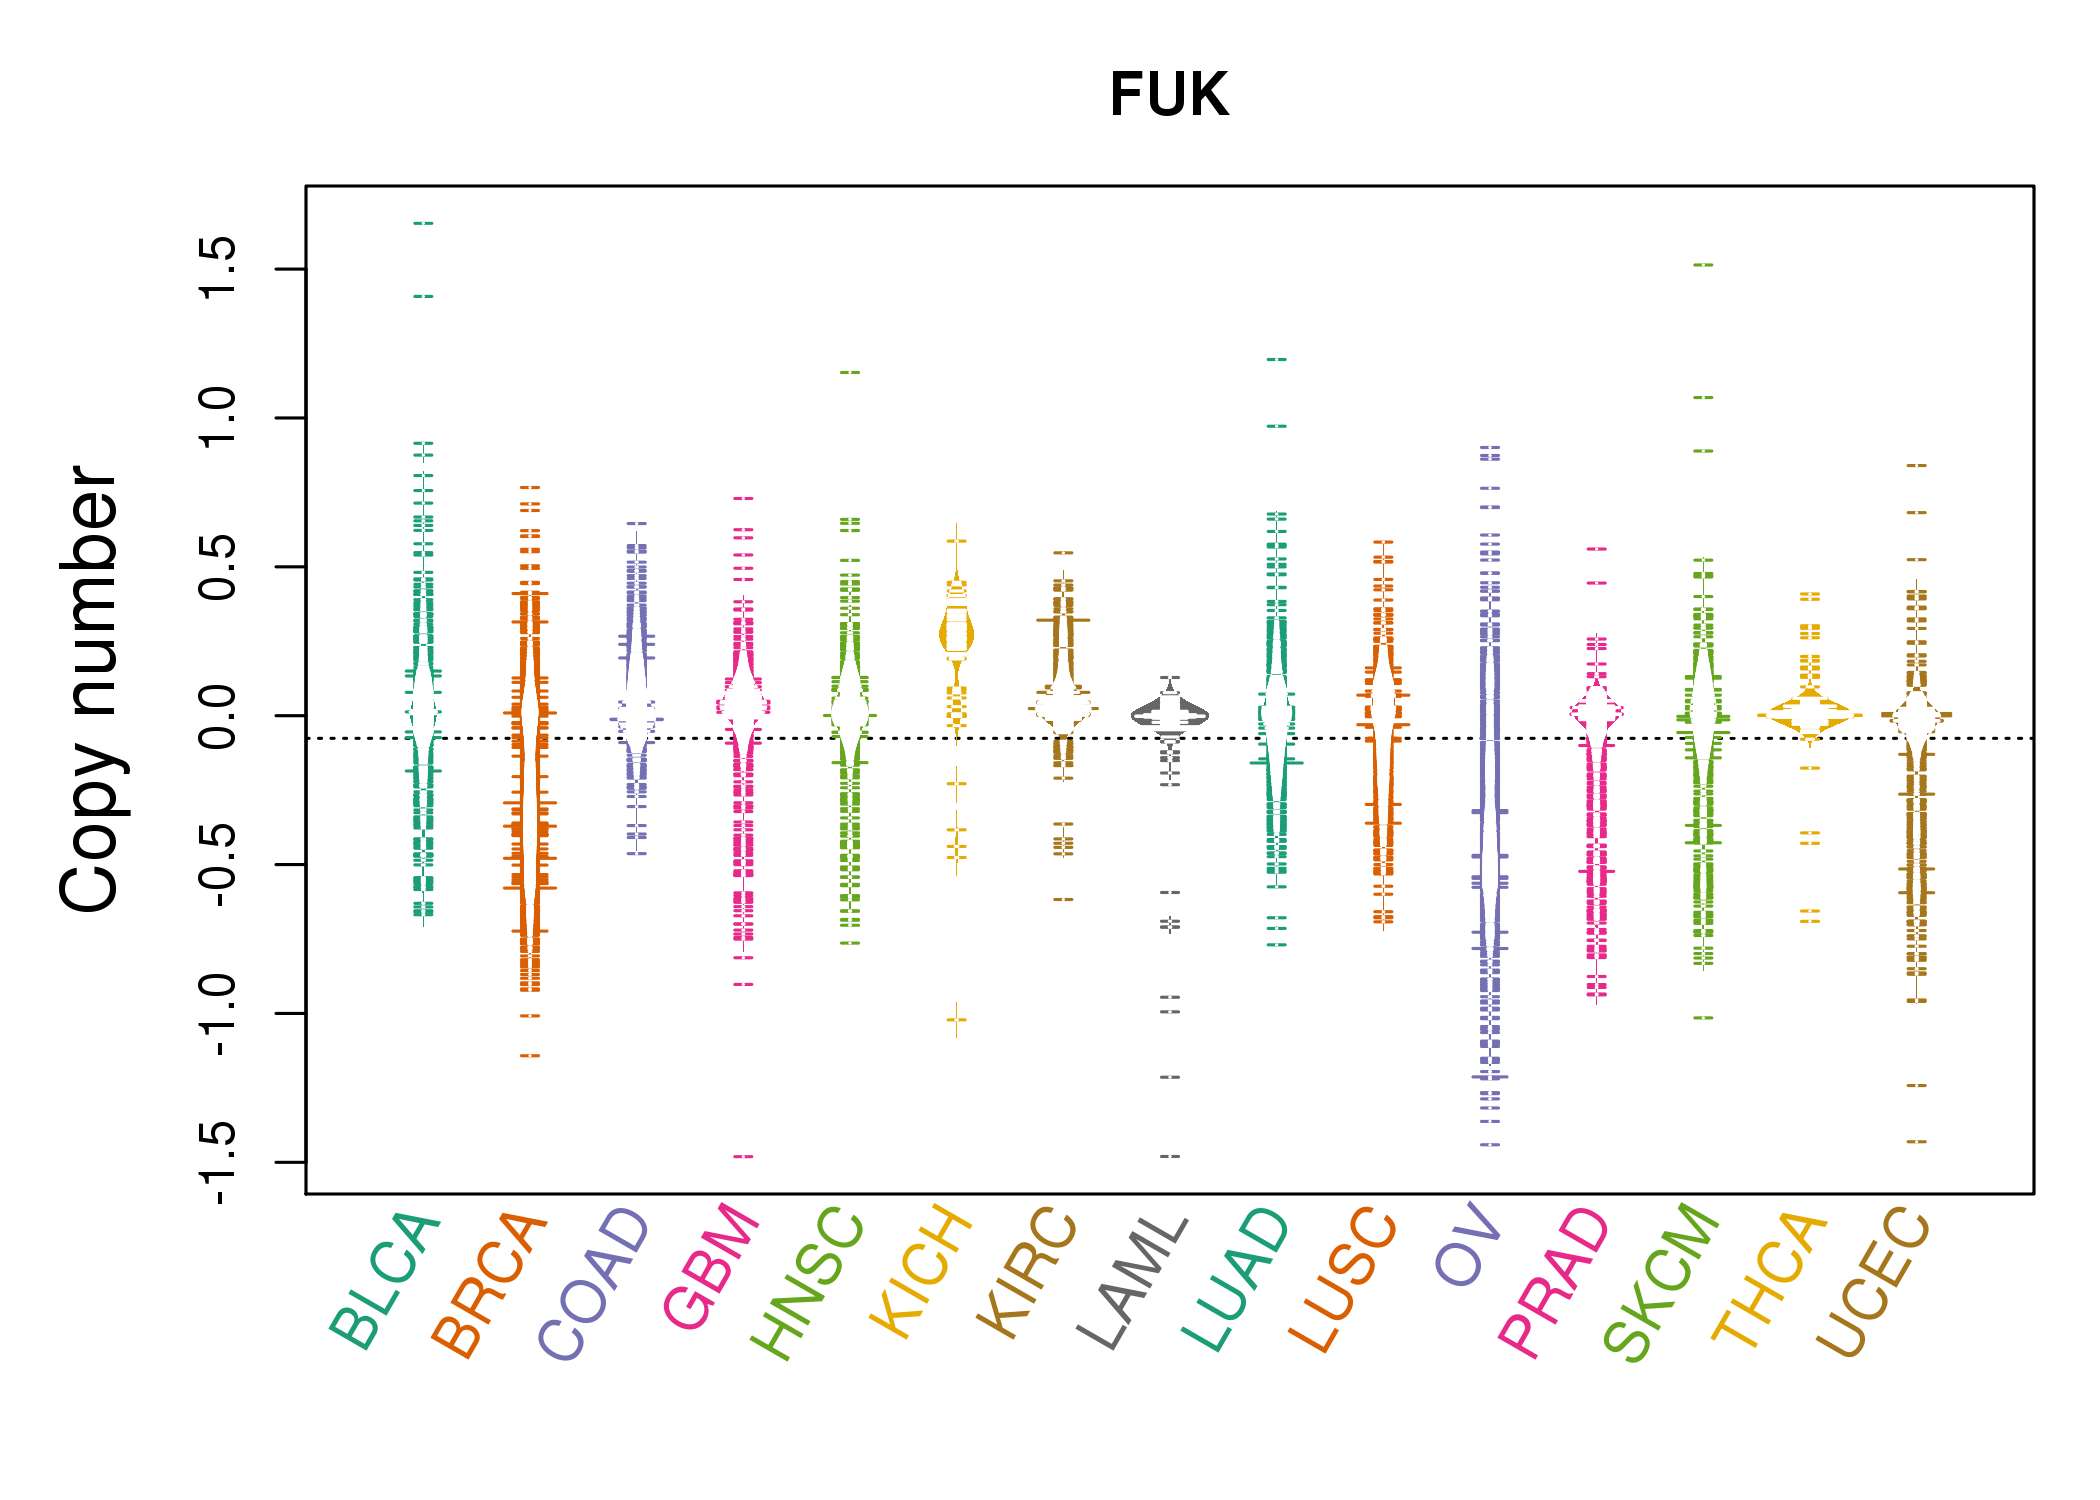 |
| cf) Tissue ID[Tissue type]: BLCA[Bladder Urothelial Carcinoma], BRCA[Breast invasive carcinoma], CESC[Cervical squamous cell carcinoma and endocervical adenocarcinoma], COAD[Colon adenocarcinoma], GBM[Glioblastoma multiforme], Glioma Low Grade, HNSC[Head and Neck squamous cell carcinoma], KICH[Kidney Chromophobe], KIRC[Kidney renal clear cell carcinoma], KIRP[Kidney renal papillary cell carcinoma], LAML[Acute Myeloid Leukemia], LUAD[Lung adenocarcinoma], LUSC[Lung squamous cell carcinoma], OV[Ovarian serous cystadenocarcinoma ], PAAD[Pancreatic adenocarcinoma], PRAD[Prostate adenocarcinoma], SKCM[Skin Cutaneous Melanoma], STAD[Stomach adenocarcinoma], THCA[Thyroid carcinoma], UCEC[Uterine Corpus Endometrial Carcinoma] |
| Top |
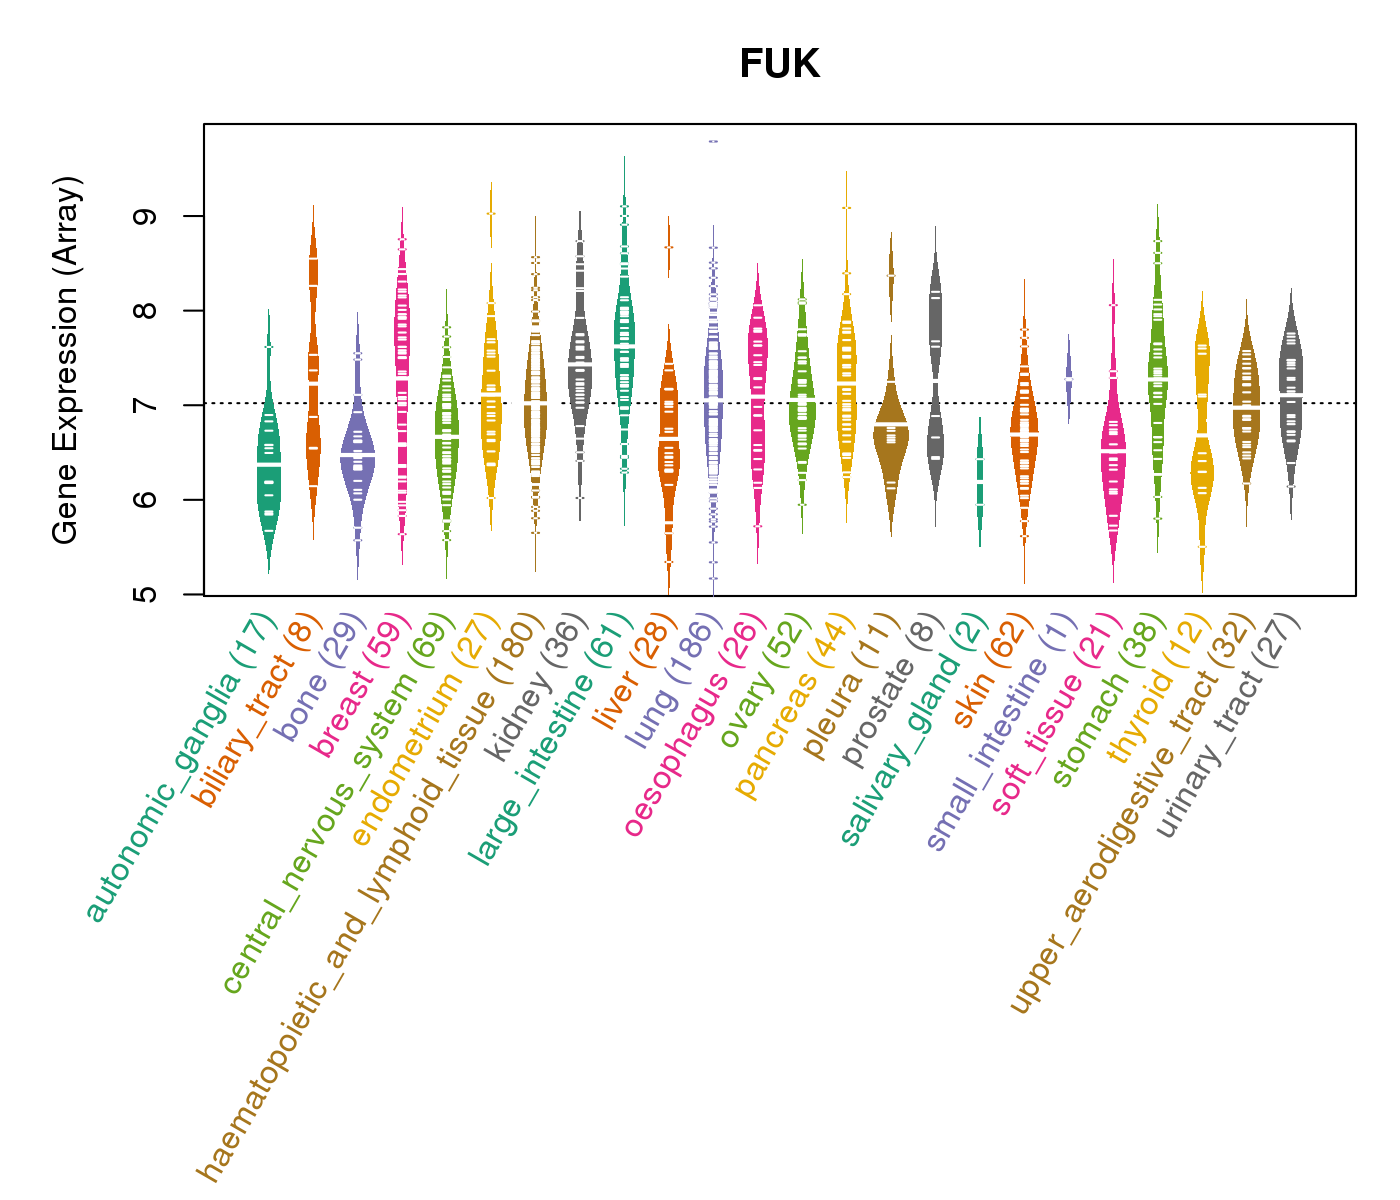
| Gene Expression for FUK |
| * CCLE gene expression data were extracted from CCLE_Expression_Entrez_2012-10-18.res: Gene-centric RMA-normalized mRNA expression data. |
 |
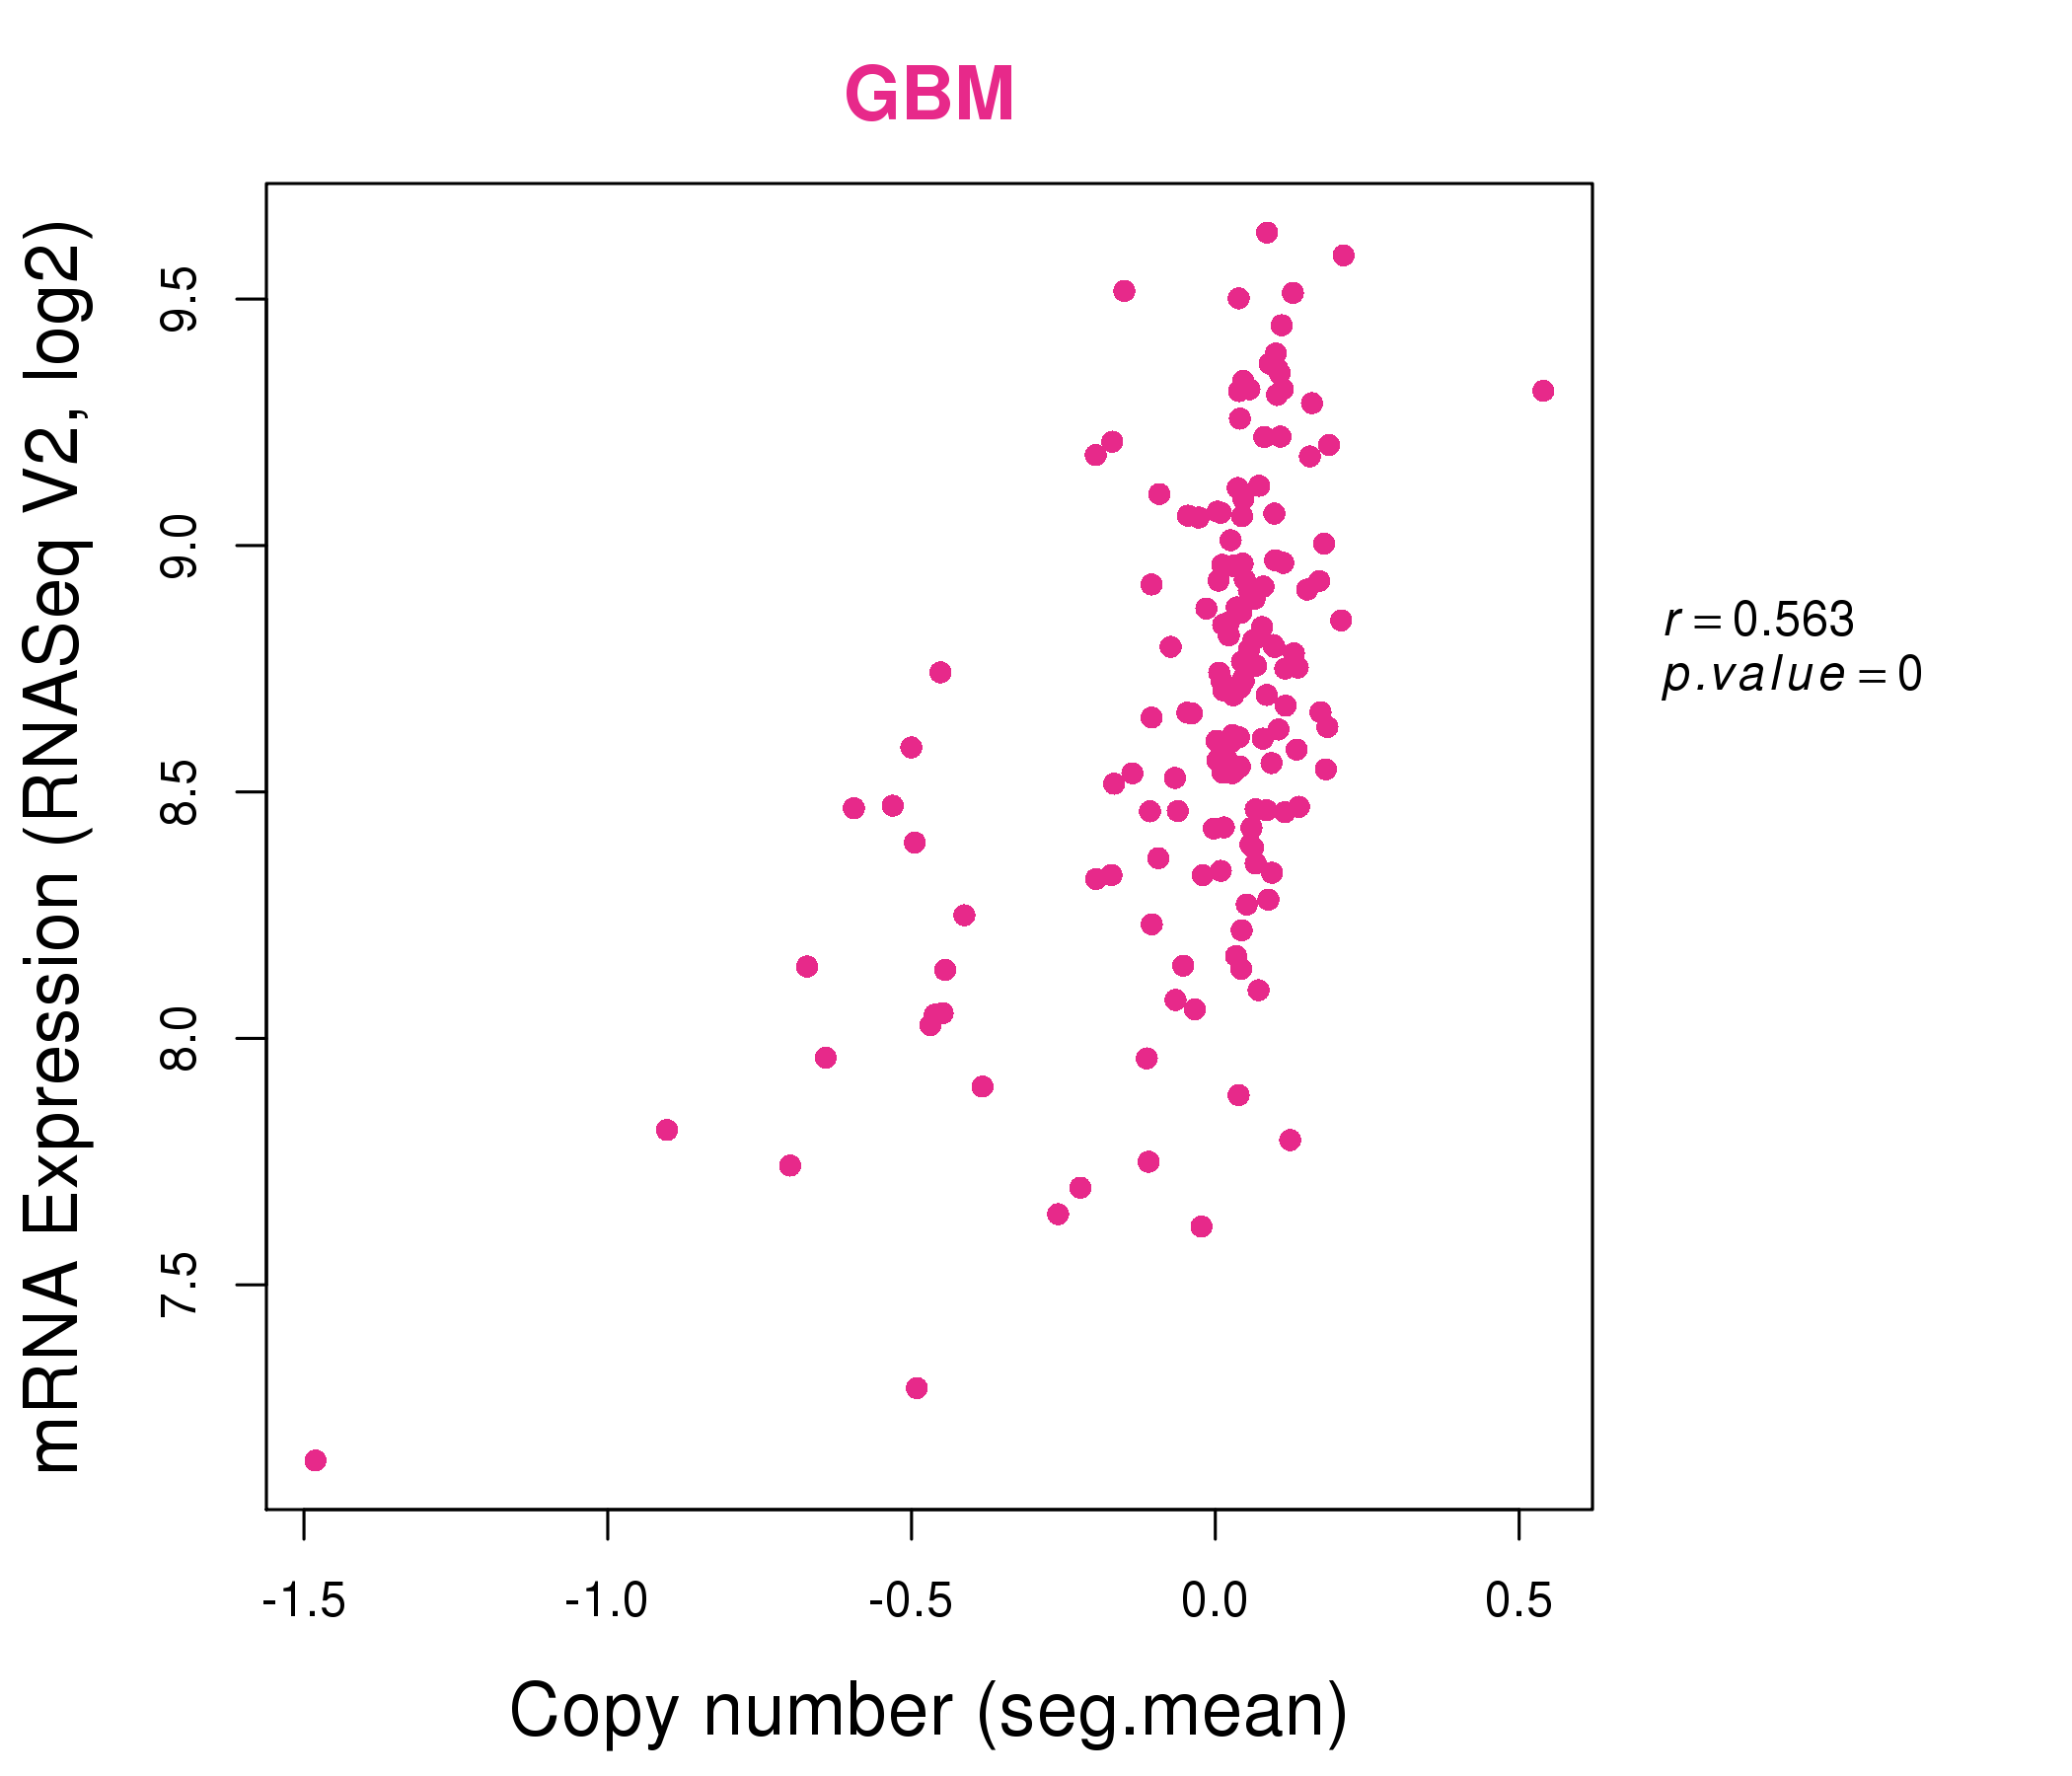
| * Normalized gene expression data of RNASeqV2 was extracted from TCGA using R package TCGA-Assembler. The URLs of all public data files on TCGA DCC data server were gathered at Jan-05-2015. Only eight cancer types have enough normal control samples for differential expression analysis. (t test, adjusted p<0.05 (using Benjamini-Hochberg FDR)) |
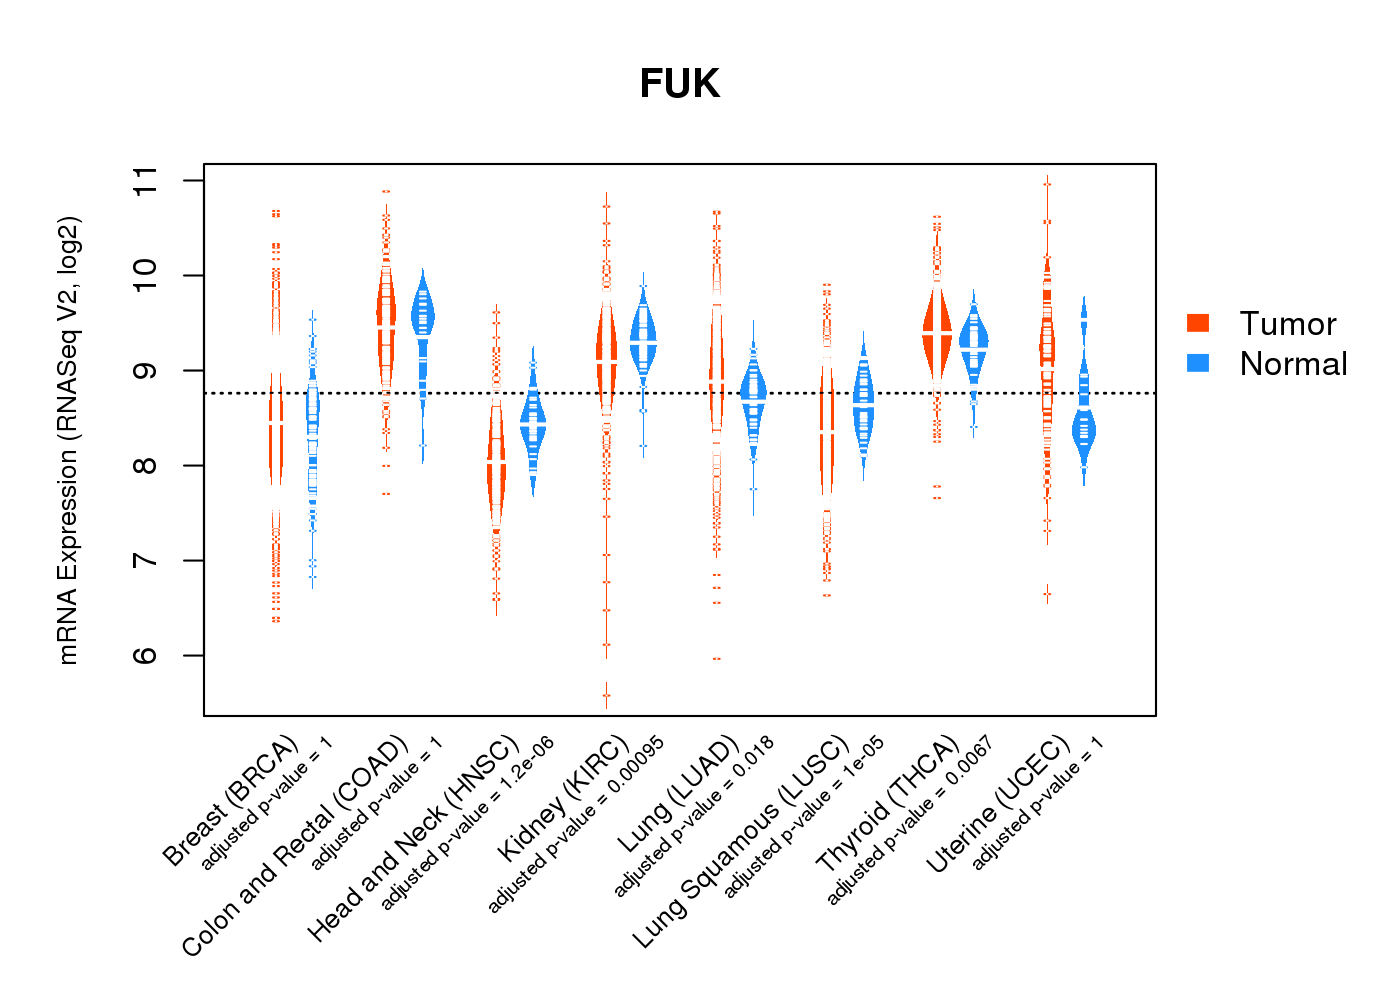 |
| Top |
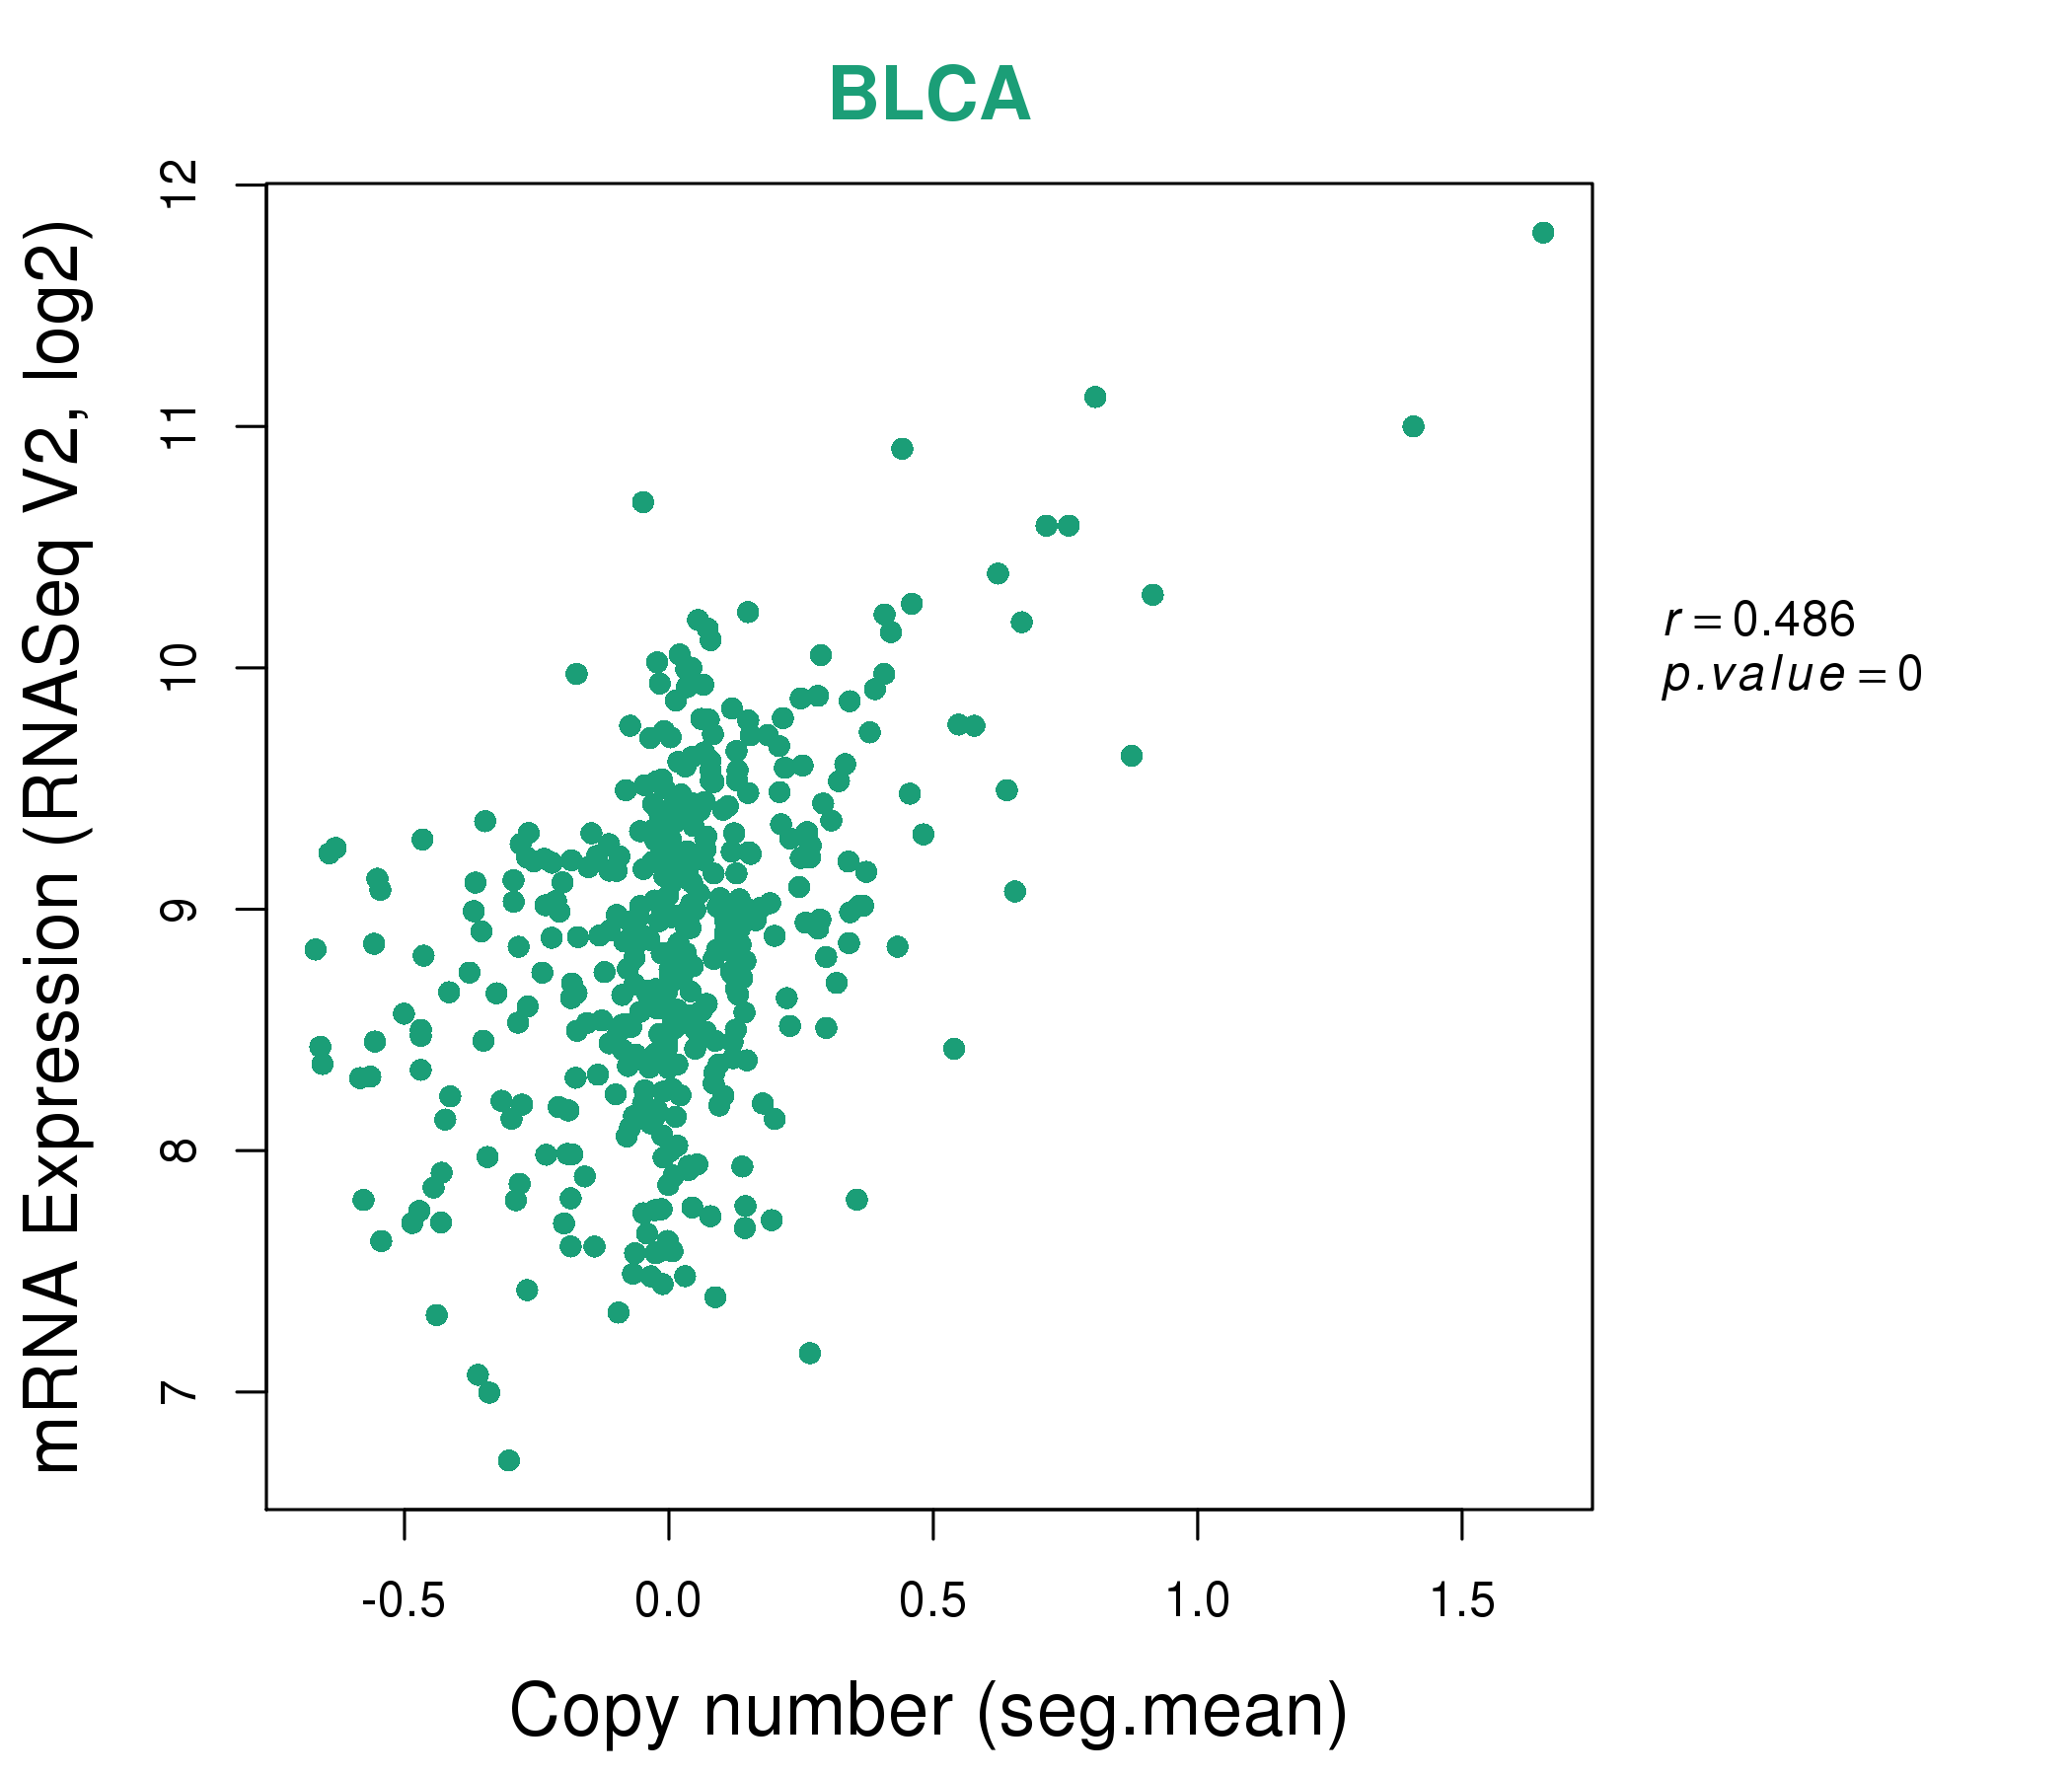
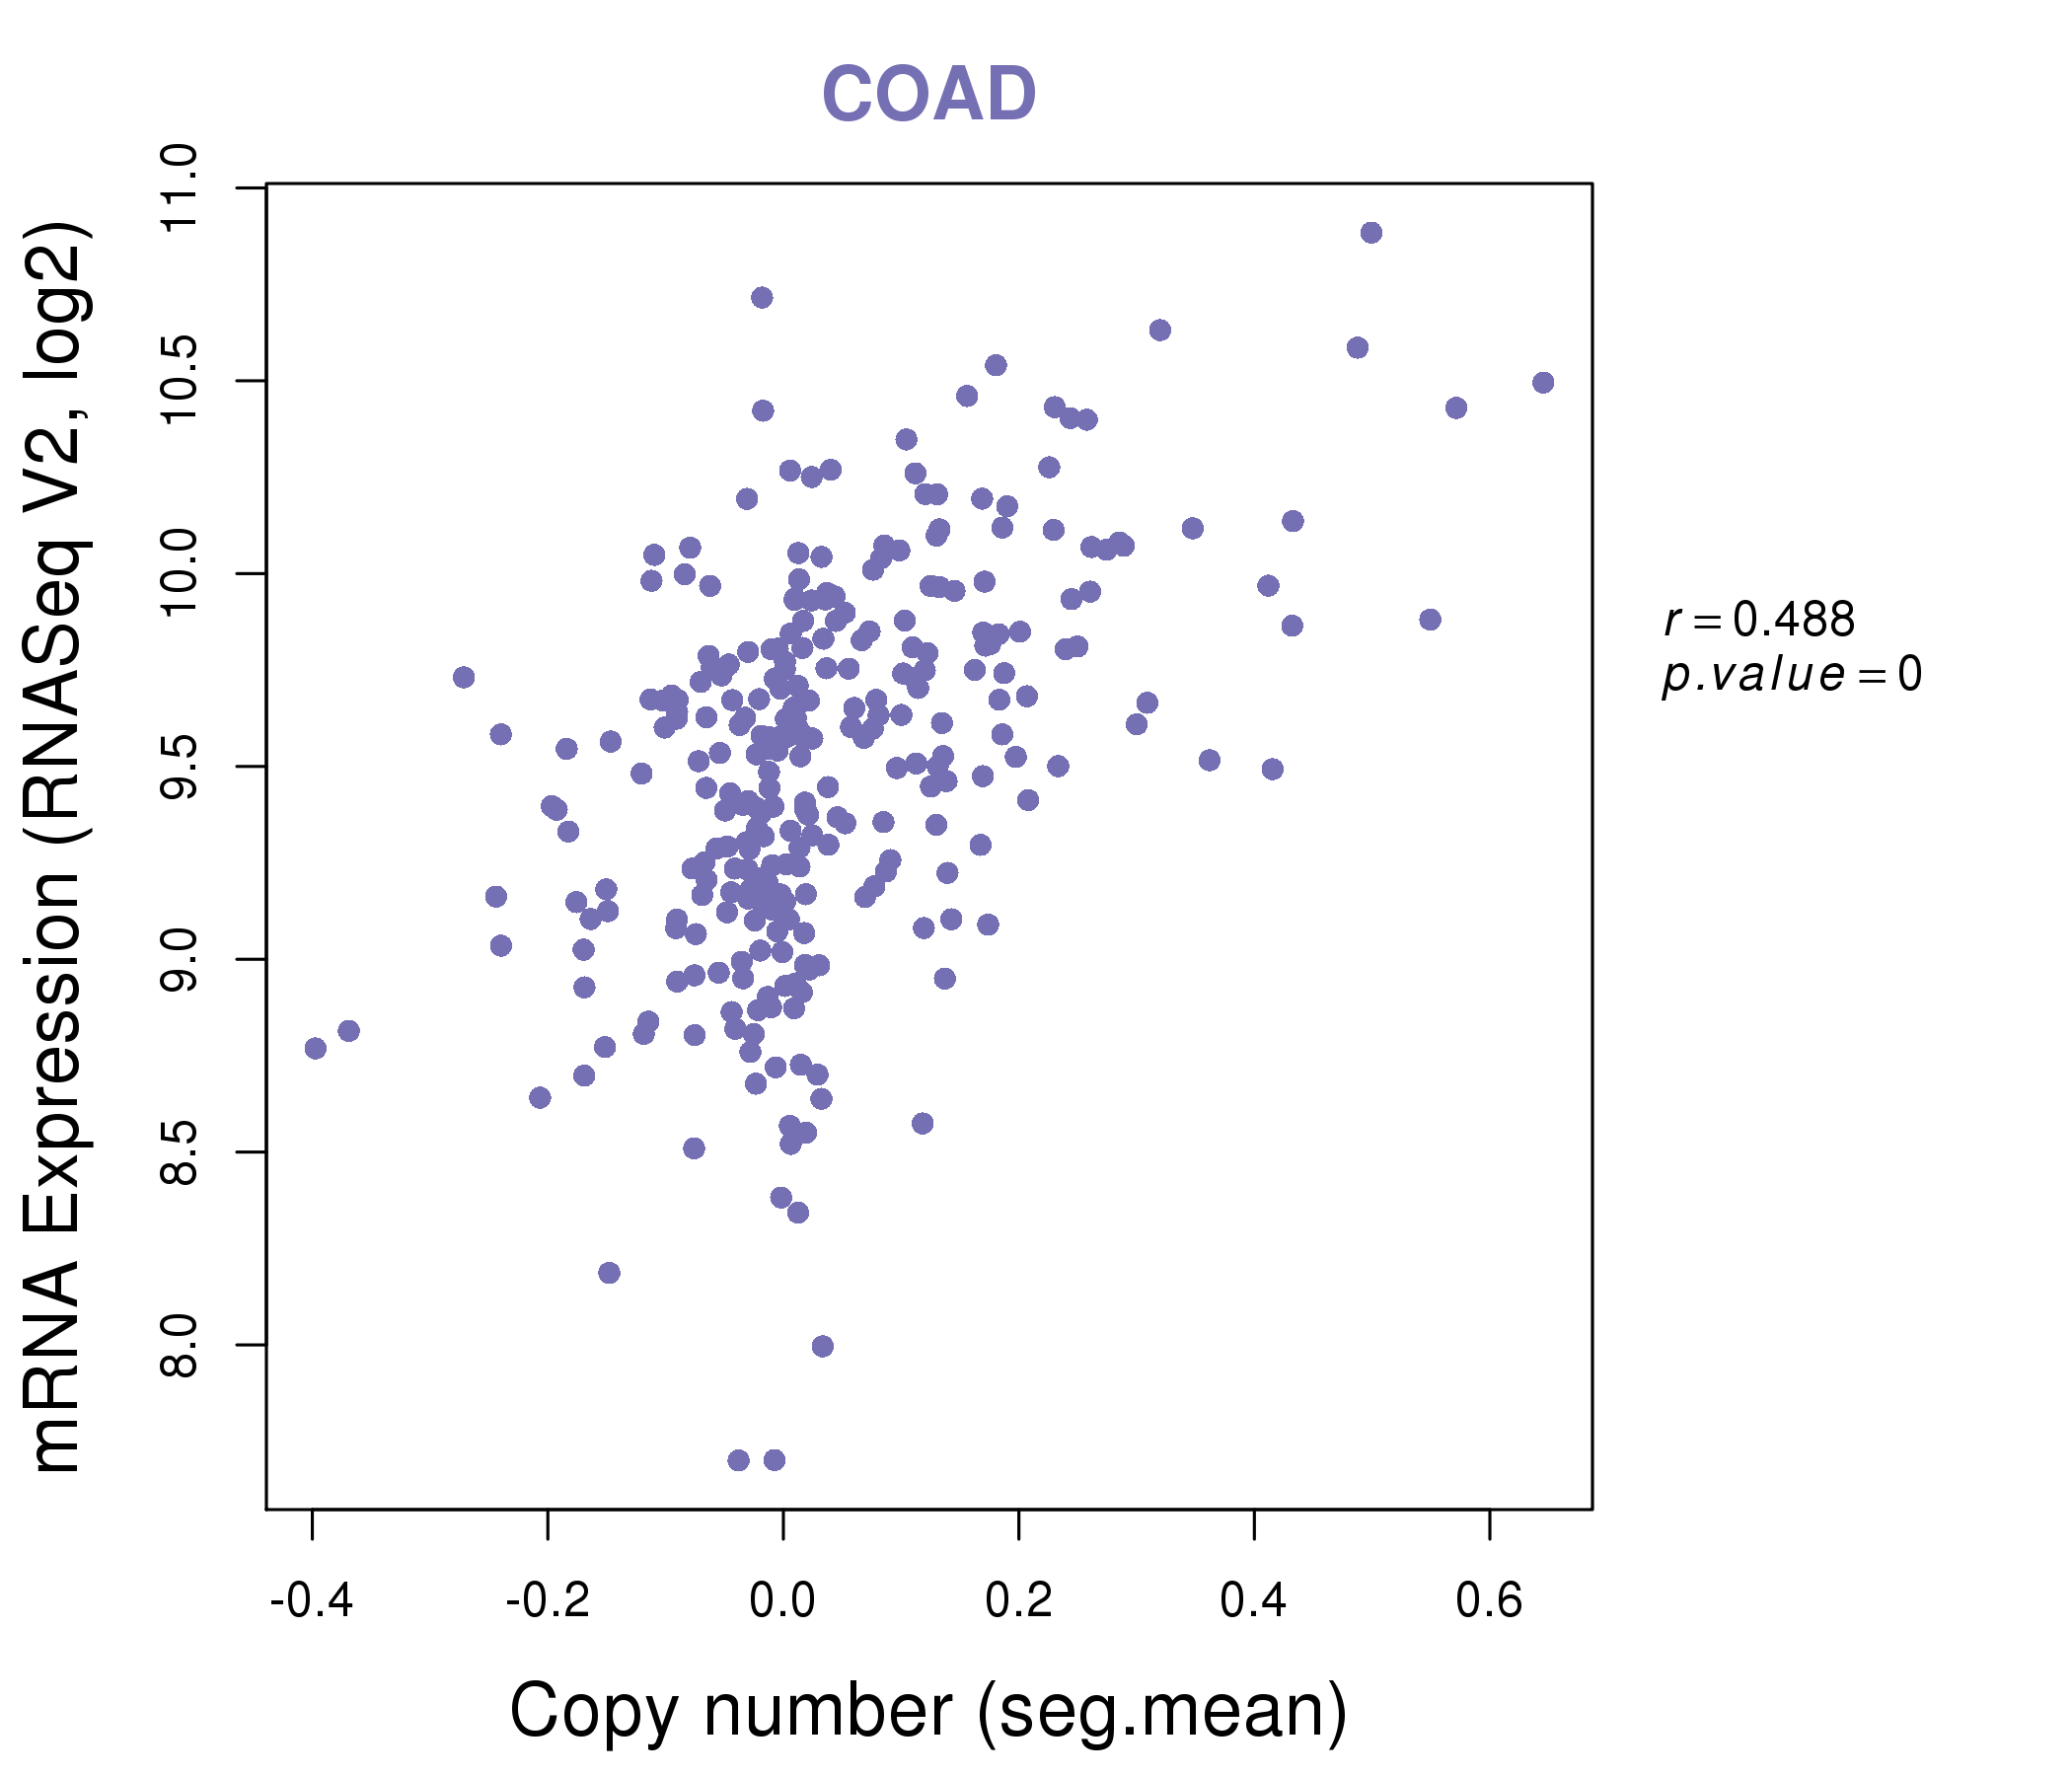
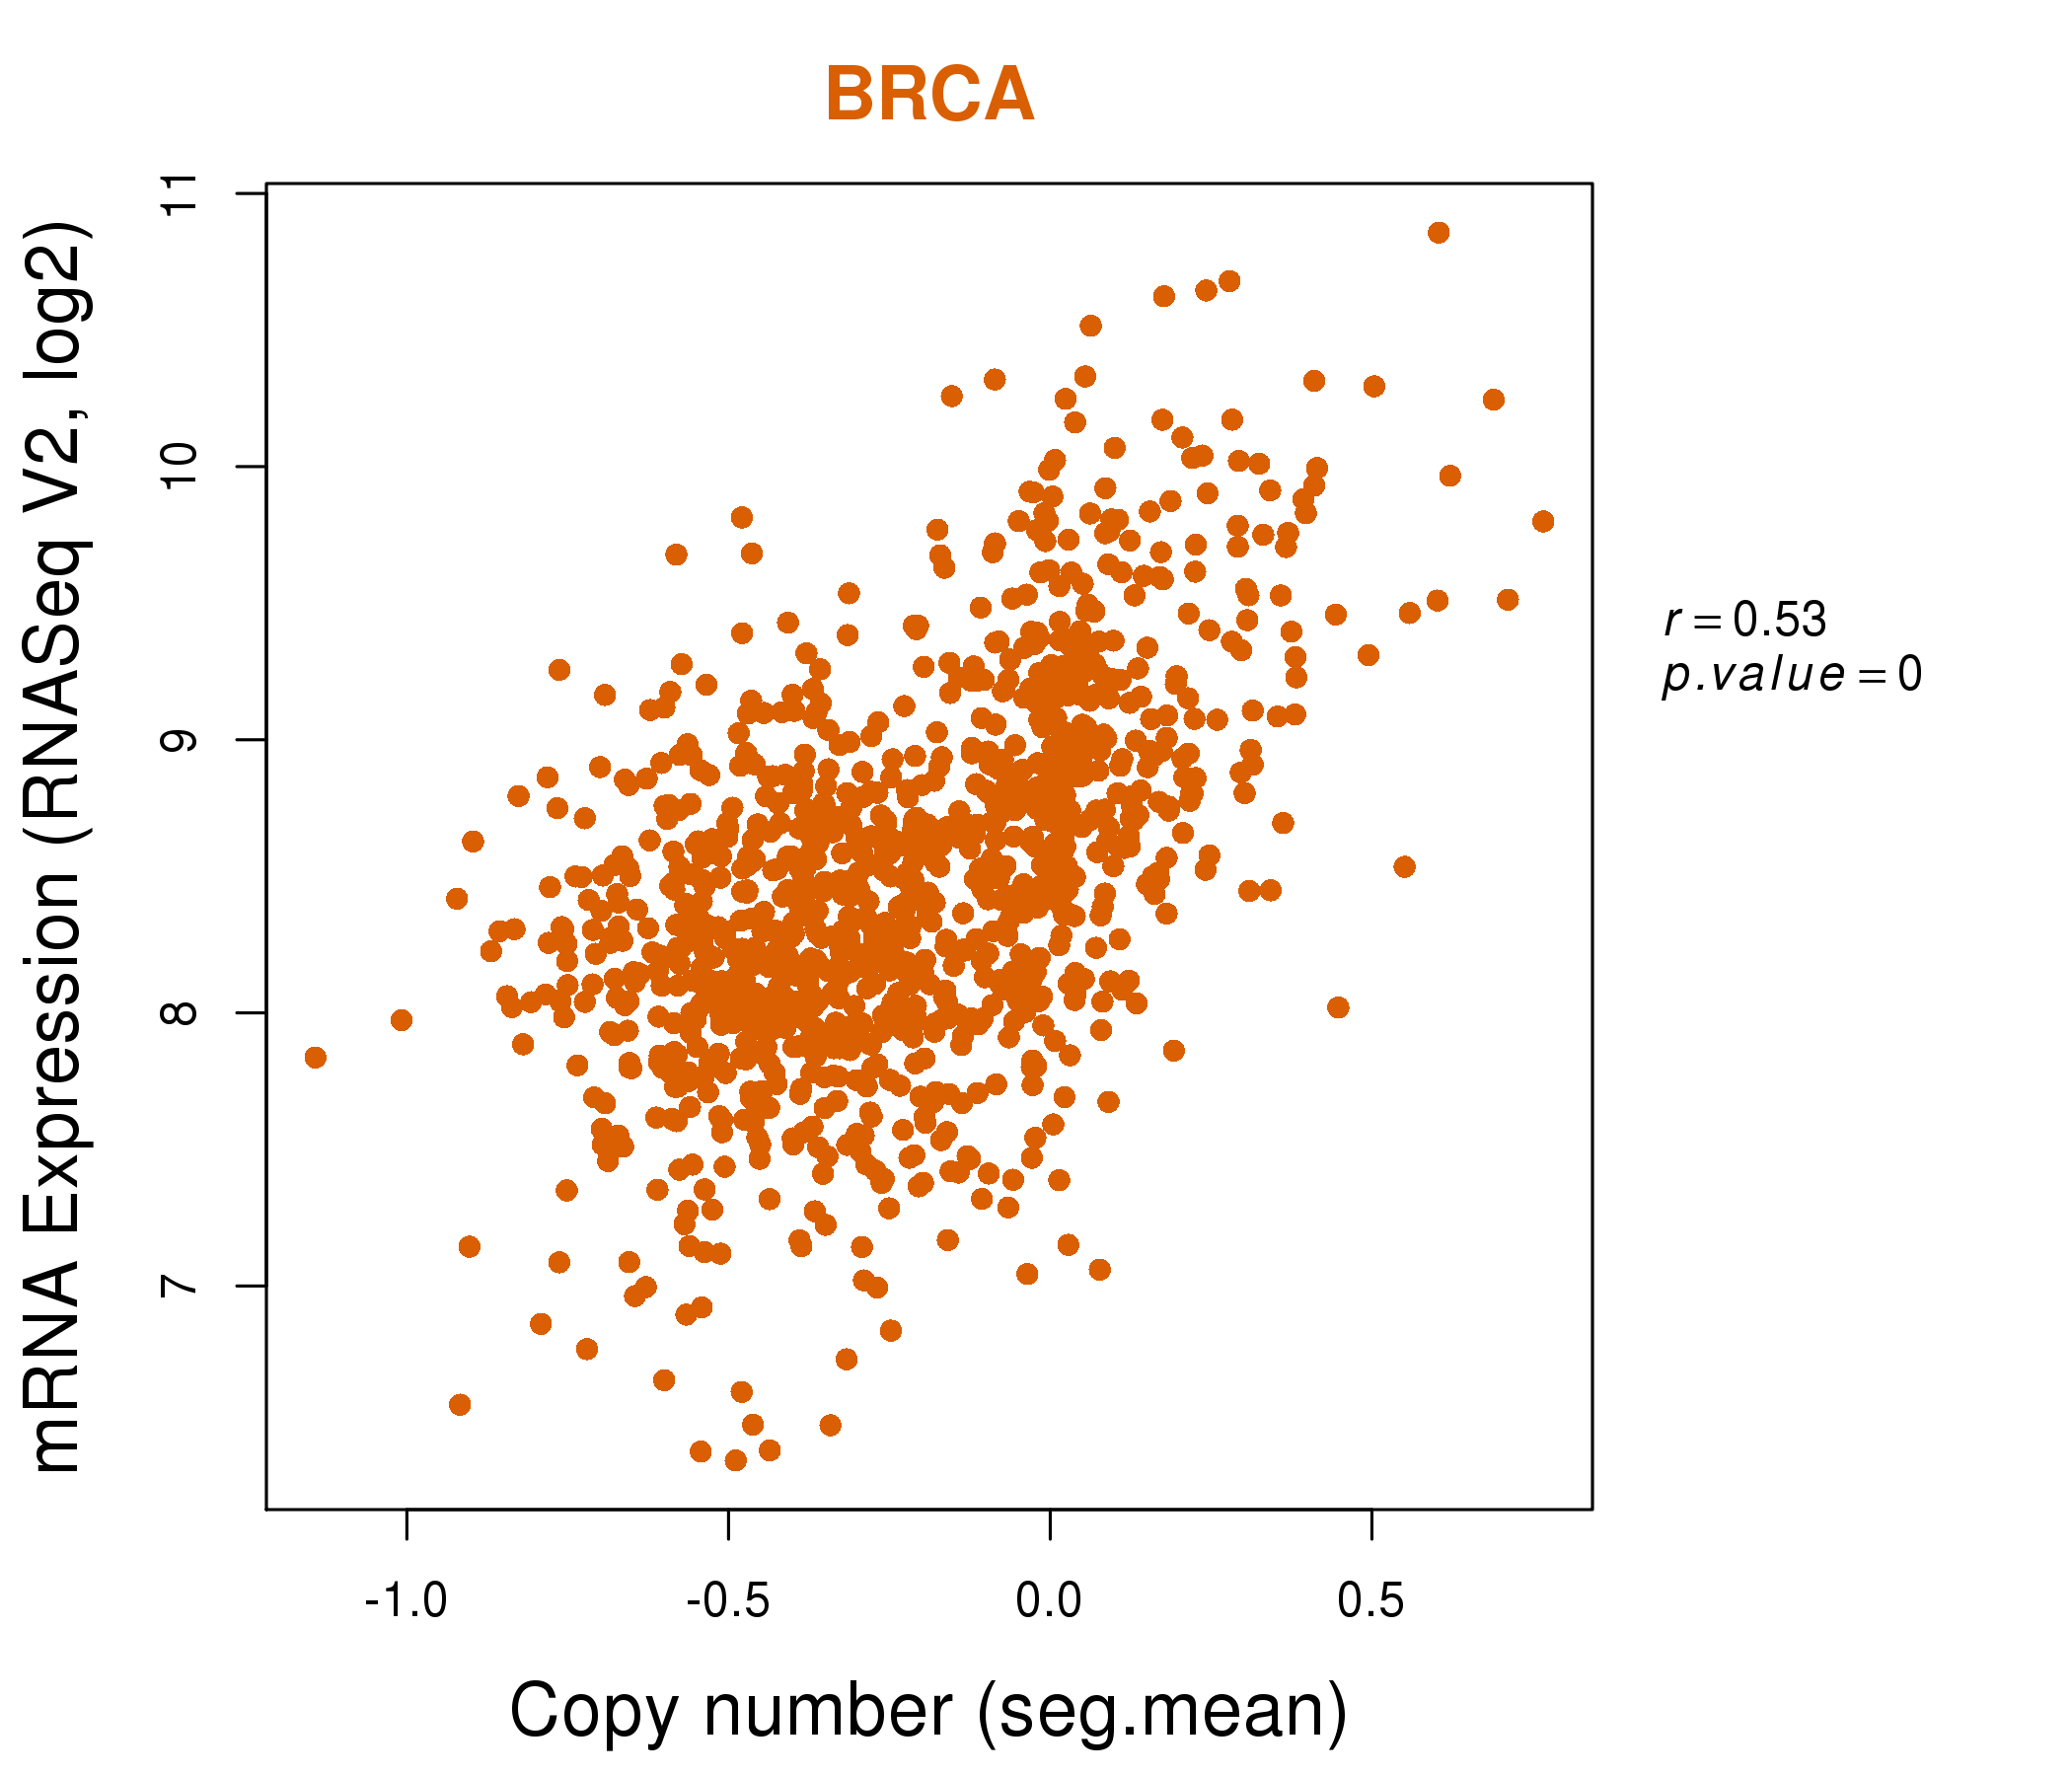
| * This plots show the correlation between CNV and gene expression. |
: Open all plots for all cancer types
 |
|
 |
|
| Top |
| Gene-Gene Network Information |
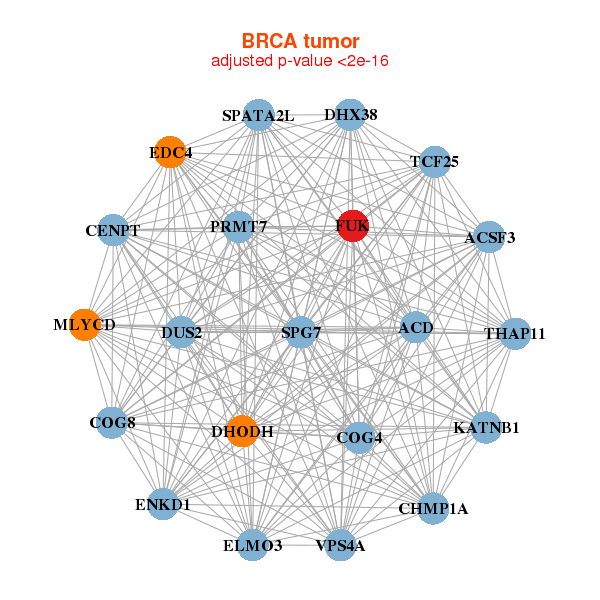
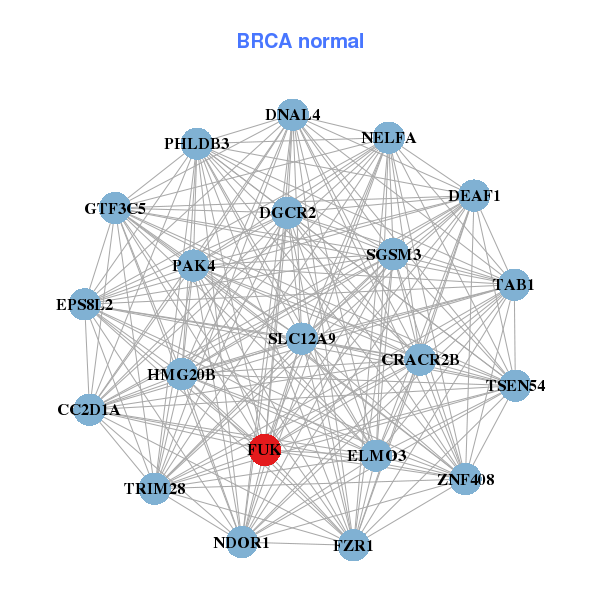
| * Co-Expression network figures were drawn using R package igraph. Only the top 20 genes with the highest correlations were shown. Red circle: input gene, orange circle: cell metabolism gene, sky circle: other gene |
: Open all plots for all cancer types
 |
|
| ACD,ACSF3,ENKD1,CENPT,CHMP1A,COG4,COG8, DHODH,DHX38,DUS2,EDC4,ELMO3,FUK,KATNB1, MLYCD,PRMT7,SPATA2L,SPG7,TCF25,THAP11,VPS4A | CC2D1A,DEAF1,DGCR2,DNAL4,CRACR2B,ELMO3,EPS8L2, FUK,FZR1,GTF3C5,HMG20B,NDOR1,PAK4,PHLDB3, SGSM3,SLC12A9,TAB1,TRIM28,TSEN54,NELFA,ZNF408 |
 |
|
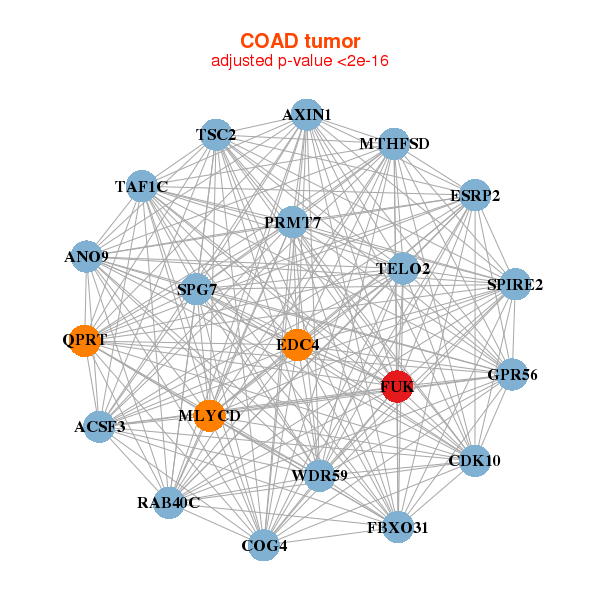
| ACSF3,ANO9,AXIN1,CDK10,COG4,EDC4,ESRP2, FBXO31,FUK,GPR56,MLYCD,MTHFSD,PRMT7,QPRT, RAB40C,SPG7,SPIRE2,TAF1C,TELO2,TSC2,WDR59 | BDH1,PROSER2,CC2D1A,CES3,DDR1,FOXD2,FUK, GFOD2,GRN,HES1,IHH,LDLRAP1,PFKL,PLA2G6, PPFIA3,PWWP2B,RNF44,SCAP,STK11,TRPM4,ZBTB7C |
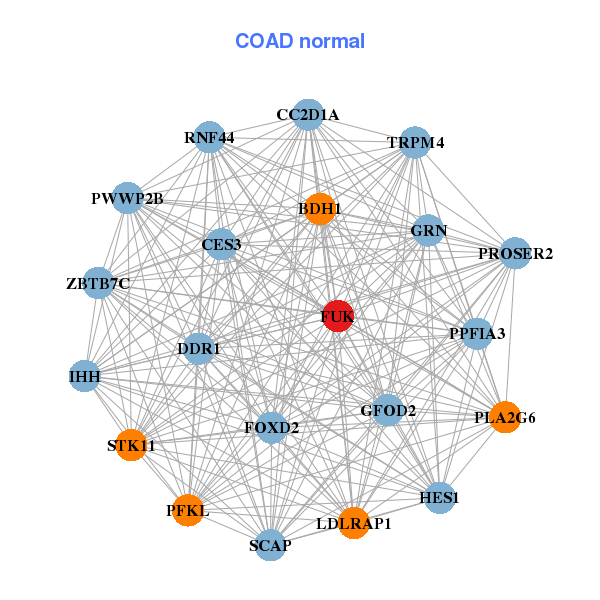
| * Co-Expression network figures were drawn using R package igraph. Only the top 20 genes with the highest correlations were shown. Red circle: input gene, orange circle: cell metabolism gene, sky circle: other gene |
: Open all plots for all cancer types
| Top |
: Open all interacting genes' information including KEGG pathway for all interacting genes from DAVID
| Top |
| Pharmacological Information for FUK |
| There's no related Drug. |
| Top |
| Cross referenced IDs for FUK |
| * We obtained these cross-references from Uniprot database. It covers 150 different DBs, 18 categories. http://www.uniprot.org/help/cross_references_section |
: Open all cross reference information
|
Copyright © 2016-Present - The Univsersity of Texas Health Science Center at Houston @ |