|
||||||||||||||||||||
| |
| Phenotypic Information (metabolism pathway, cancer, disease, phenome) |
| |
| |
| Gene-Gene Network Information: Co-Expression Network, Interacting Genes & KEGG |
| |
|


| Gene Summary for EIF5 |
| Basic gene info. | Gene symbol | EIF5 |
| Gene name | eukaryotic translation initiation factor 5 | |
| Synonyms | EIF-5|EIF-5A | |
| Cytomap | UCSC genome browser: 14q32.32 | |
| Genomic location | chr14 :103801235-103811361 | |
| Type of gene | protein-coding | |
| RefGenes | NM_001969.4, NM_183004.4, | |
| Ensembl id | ENSG00000100664 | |
| Description | - | |
| Modification date | 20141207 | |
| dbXrefs | MIM : 601710 | |
| HGNC : HGNC | ||
| Ensembl : ENSG00000100664 | ||
| HPRD : 03417 | ||
| Vega : OTTHUMG00000171839 | ||
| Protein | UniProt: go to UniProt's Cross Reference DB Table | |
| Expression | CleanEX: HS_EIF5 | |
| BioGPS: 1983 | ||
| Gene Expression Atlas: ENSG00000100664 | ||
| The Human Protein Atlas: ENSG00000100664 | ||
| Pathway | NCI Pathway Interaction Database: EIF5 | |
| KEGG: EIF5 | ||
| REACTOME: EIF5 | ||
| ConsensusPathDB | ||
| Pathway Commons: EIF5 | ||
| Metabolism | MetaCyc: EIF5 | |
| HUMANCyc: EIF5 | ||
| Regulation | Ensembl's Regulation: ENSG00000100664 | |
| miRBase: chr14 :103,801,235-103,811,361 | ||
| TargetScan: NM_001969 | ||
| cisRED: ENSG00000100664 | ||
| Context | iHOP: EIF5 | |
| cancer metabolism search in PubMed: EIF5 | ||
| UCL Cancer Institute: EIF5 | ||
| Assigned class in ccmGDB | C | |
| Top |
| Phenotypic Information for EIF5(metabolism pathway, cancer, disease, phenome) |
| Cancer | CGAP: EIF5 |
| Familial Cancer Database: EIF5 | |
| * This gene is included in those cancer gene databases. |
|
|
|
|
|
| . | ||||||||||||||
Oncogene 1 | Significant driver gene in | |||||||||||||||||||
| cf) number; DB name 1 Oncogene; http://nar.oxfordjournals.org/content/35/suppl_1/D721.long, 2 Tumor Suppressor gene; https://bioinfo.uth.edu/TSGene/, 3 Cancer Gene Census; http://www.nature.com/nrc/journal/v4/n3/abs/nrc1299.html, 4 CancerGenes; http://nar.oxfordjournals.org/content/35/suppl_1/D721.long, 5 Network of Cancer Gene; http://ncg.kcl.ac.uk/index.php, 1Therapeutic Vulnerabilities in Cancer; http://cbio.mskcc.org/cancergenomics/statius/ |
| REACTOME_METABOLISM_OF_PROTEINS | |
| OMIM | |
| Orphanet | |
| Disease | KEGG Disease: EIF5 |
| MedGen: EIF5 (Human Medical Genetics with Condition) | |
| ClinVar: EIF5 | |
| Phenotype | MGI: EIF5 (International Mouse Phenotyping Consortium) |
| PhenomicDB: EIF5 | |
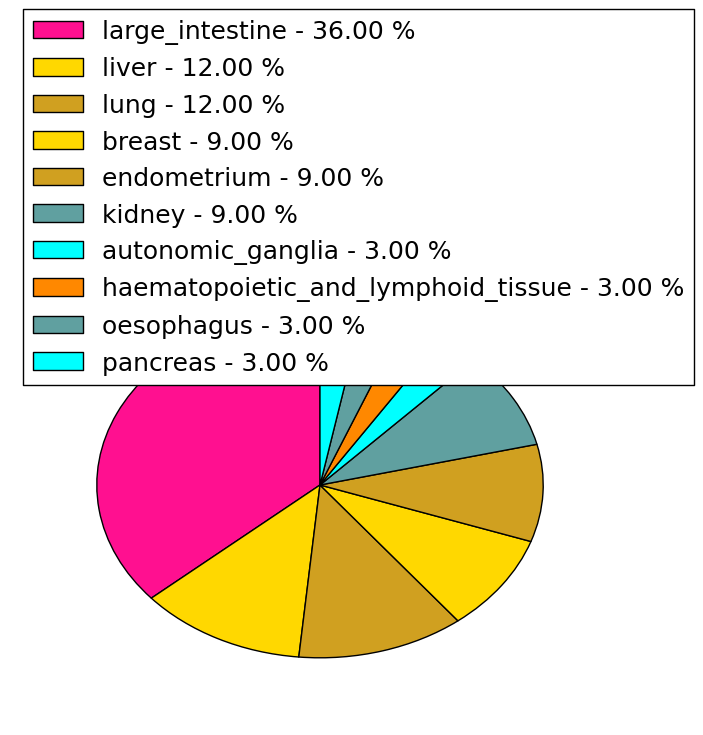
| Mutations for EIF5 |
| * Under tables are showing count per each tissue to give us broad intuition about tissue specific mutation patterns.You can go to the detailed page for each mutation database's web site. |
| - Statistics for Tissue and Mutation type | Top |
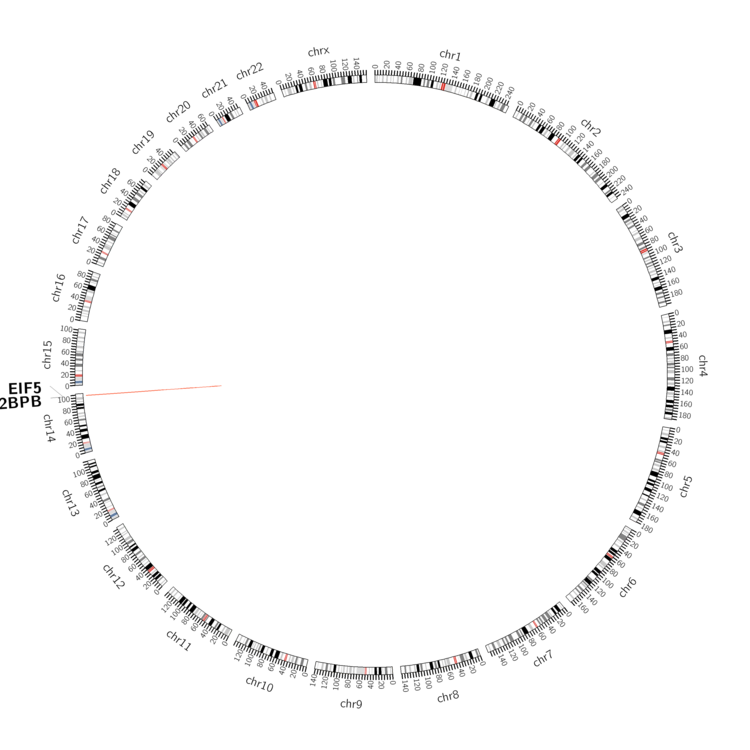 |
| - For Inter-chromosomal Variations |
| There's no inter-chromosomal structural variation. |
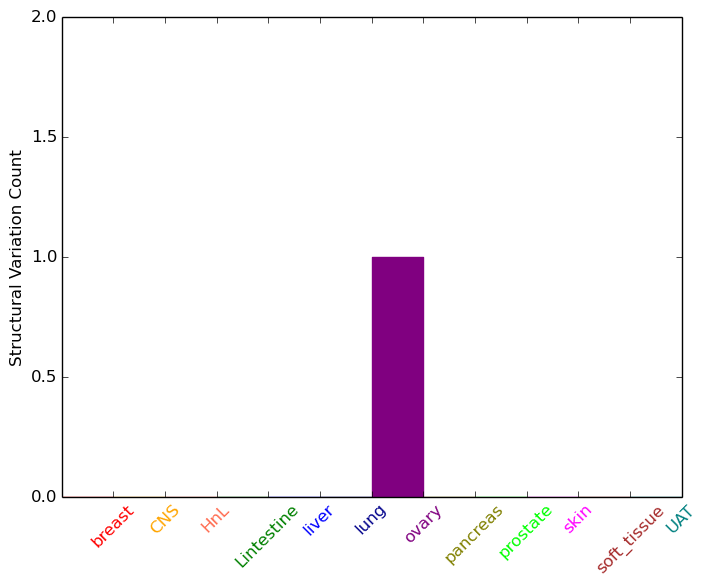
| - For Intra-chromosomal Variations |
| * Intra-chromosomal variantions includes 'intrachromosomal amplicon to amplicon', 'intrachromosomal amplicon to non-amplified dna', 'intrachromosomal deletion', 'intrachromosomal fold-back inversion', 'intrachromosomal inversion', 'intrachromosomal tandem duplication', 'Intrachromosomal unknown type', 'intrachromosomal with inverted orientation', 'intrachromosomal with non-inverted orientation'. |
 |
| Sample | Symbol_a | Chr_a | Start_a | End_a | Symbol_b | Chr_b | Start_b | End_b |
| ovary | EIF5 | chr14 | 103808265 | 103808285 | CDC42BPB | chr14 | 103424659 | 103424679 |
| cf) Tissue number; Tissue name (1;Breast, 2;Central_nervous_system, 3;Haematopoietic_and_lymphoid_tissue, 4;Large_intestine, 5;Liver, 6;Lung, 7;Ovary, 8;Pancreas, 9;Prostate, 10;Skin, 11;Soft_tissue, 12;Upper_aerodigestive_tract) |
| * From mRNA Sanger sequences, Chitars2.0 arranged chimeric transcripts. This table shows EIF5 related fusion information. |
| ID | Head Gene | Tail Gene | Accession | Gene_a | qStart_a | qEnd_a | Chromosome_a | tStart_a | tEnd_a | Gene_a | qStart_a | qEnd_a | Chromosome_a | tStart_a | tEnd_a |
| AI133642 | ITPR2 | 1 | 83 | 12 | 26853999 | 26854081 | EIF5 | 82 | 630 | 14 | 103800574 | 103802408 | |
| BM833559 | REV1 | 1 | 280 | 2 | 100019515 | 100021011 | EIF5 | 261 | 461 | 14 | 103804688 | 103805151 | |
| BI058894 | AKIP1 | 8 | 206 | 11 | 8941010 | 8941208 | EIF5 | 200 | 456 | 14 | 103810337 | 103810593 | |
| DB066453 | EIF5 | 1 | 67 | 14 | 103804245 | 103804311 | BOP1 | 68 | 534 | 8 | 145505145 | 145505610 | |
| Top |
| There's no copy number variation information in COSMIC data for this gene. |
| Top |
|
 |
| Top |
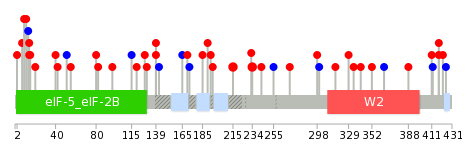
| Stat. for Non-Synonymous SNVs (# total SNVs=33) | (# total SNVs=4) |
 |  |
(# total SNVs=4) | (# total SNVs=0) |
 |
| Top |
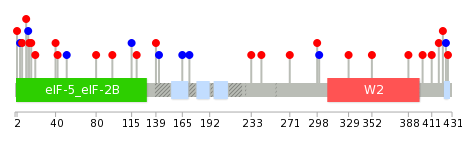
| * When you move the cursor on each content, you can see more deailed mutation information on the Tooltip. Those are primary_site,primary_histology,mutation(aa),pubmedID. |
| GRCh37 position | Mutation(aa) | Unique sampleID count |
| chr14:103807366-103807372 | p.D425fs*>5 | 2 |
| chr14:103805187-103805187 | p.R234K | 2 |
| chr14:103802238-103802238 | p.Y14F | 2 |
| chr14:103803541-103803541 | p.T139I | 2 |
| chr14:103807346-103807346 | p.K418M | 2 |
| chr14:103805130-103805130 | p.R215Q | 2 |
| chr14:103802453-103802453 | p.T51T | 1 |
| chr14:103806054-103806054 | p.L329F | 1 |
| chr14:103803551-103803551 | p.L142L | 1 |
| chr14:103807359-103807359 | p.K422N | 1 |
| Top |
|
 |
| Point Mutation/ Tissue ID | 1 | 2 | 3 | 4 | 5 | 6 | 7 | 8 | 9 | 10 | 11 | 12 | 13 | 14 | 15 | 16 | 17 | 18 | 19 | 20 |
| # sample | 3 | 1 | 3 | 2 | 1 | 3 | 2 | 3 | 1 | 5 | 5 | 2 | ||||||||
| # mutation | 3 | 1 | 4 | 2 | 1 | 3 | 2 | 3 | 1 | 5 | 6 | 2 | ||||||||
| nonsynonymous SNV | 2 | 1 | 4 | 1 | 1 | 3 | 1 | 2 | 2 | 5 | 2 | |||||||||
| synonymous SNV | 1 | 1 | 1 | 1 | 1 | 3 | 1 |
| cf) Tissue ID; Tissue type (1; BLCA[Bladder Urothelial Carcinoma], 2; BRCA[Breast invasive carcinoma], 3; CESC[Cervical squamous cell carcinoma and endocervical adenocarcinoma], 4; COAD[Colon adenocarcinoma], 5; GBM[Glioblastoma multiforme], 6; Glioma Low Grade, 7; HNSC[Head and Neck squamous cell carcinoma], 8; KICH[Kidney Chromophobe], 9; KIRC[Kidney renal clear cell carcinoma], 10; KIRP[Kidney renal papillary cell carcinoma], 11; LAML[Acute Myeloid Leukemia], 12; LUAD[Lung adenocarcinoma], 13; LUSC[Lung squamous cell carcinoma], 14; OV[Ovarian serous cystadenocarcinoma ], 15; PAAD[Pancreatic adenocarcinoma], 16; PRAD[Prostate adenocarcinoma], 17; SKCM[Skin Cutaneous Melanoma], 18:STAD[Stomach adenocarcinoma], 19:THCA[Thyroid carcinoma], 20:UCEC[Uterine Corpus Endometrial Carcinoma]) |
| Top |
| * We represented just top 10 SNVs. When you move the cursor on each content, you can see more deailed mutation information on the Tooltip. Those are primary_site, primary_histology, mutation(aa), pubmedID. |
| Genomic Position | Mutation(aa) | Unique sampleID count |
| chr14:103802453 | p.D11E,EIF5 | 1 |
| chr14:103805576 | p.E233K,EIF5 | 1 |
| chr14:103802201 | p.F13F,EIF5 | 1 |
| chr14:103807372 | p.L243H,EIF5 | 1 |
| chr14:103803097 | p.Y14C,EIF5 | 1 |
| chr14:103805657 | p.D271G,EIF5 | 1 |
| chr14:103802212 | p.Y16H,EIF5 | 1 |
| chr14:103803146 | p.R298H,EIF5 | 1 |
| chr14:103805664 | p.R20S,EIF5 | 1 |
| chr14:103802217 | p.F300F,EIF5 | 1 |
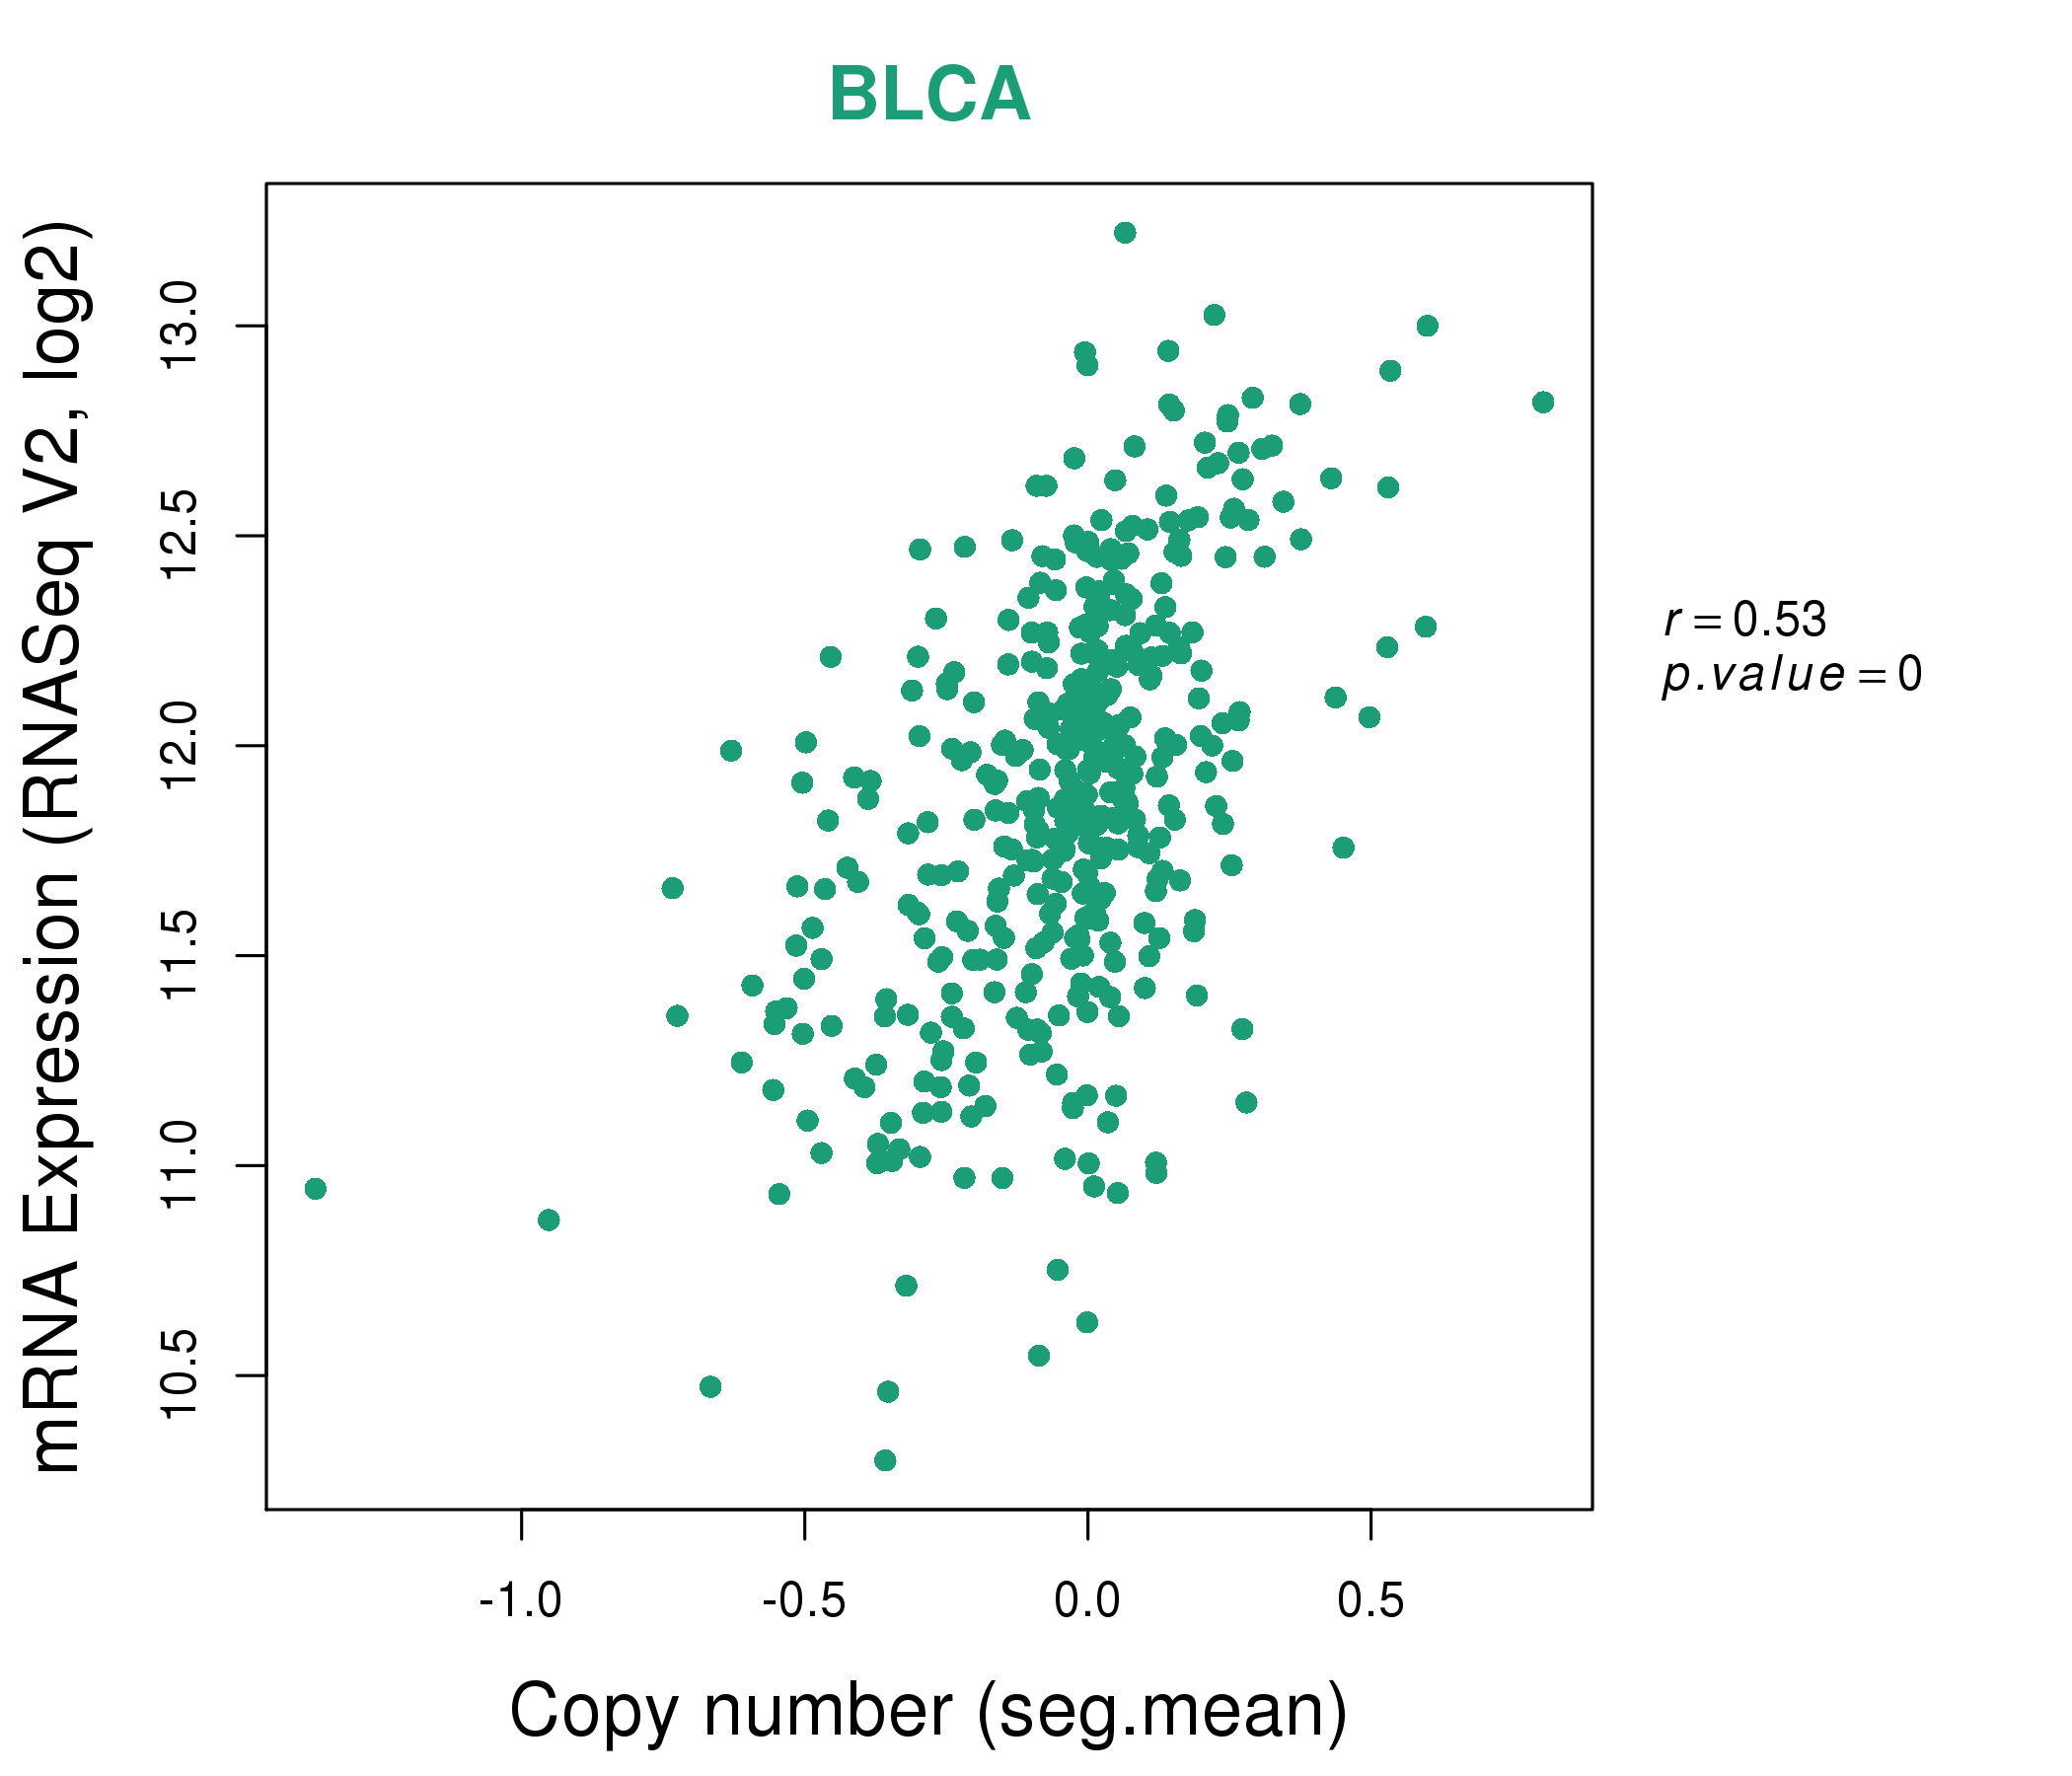
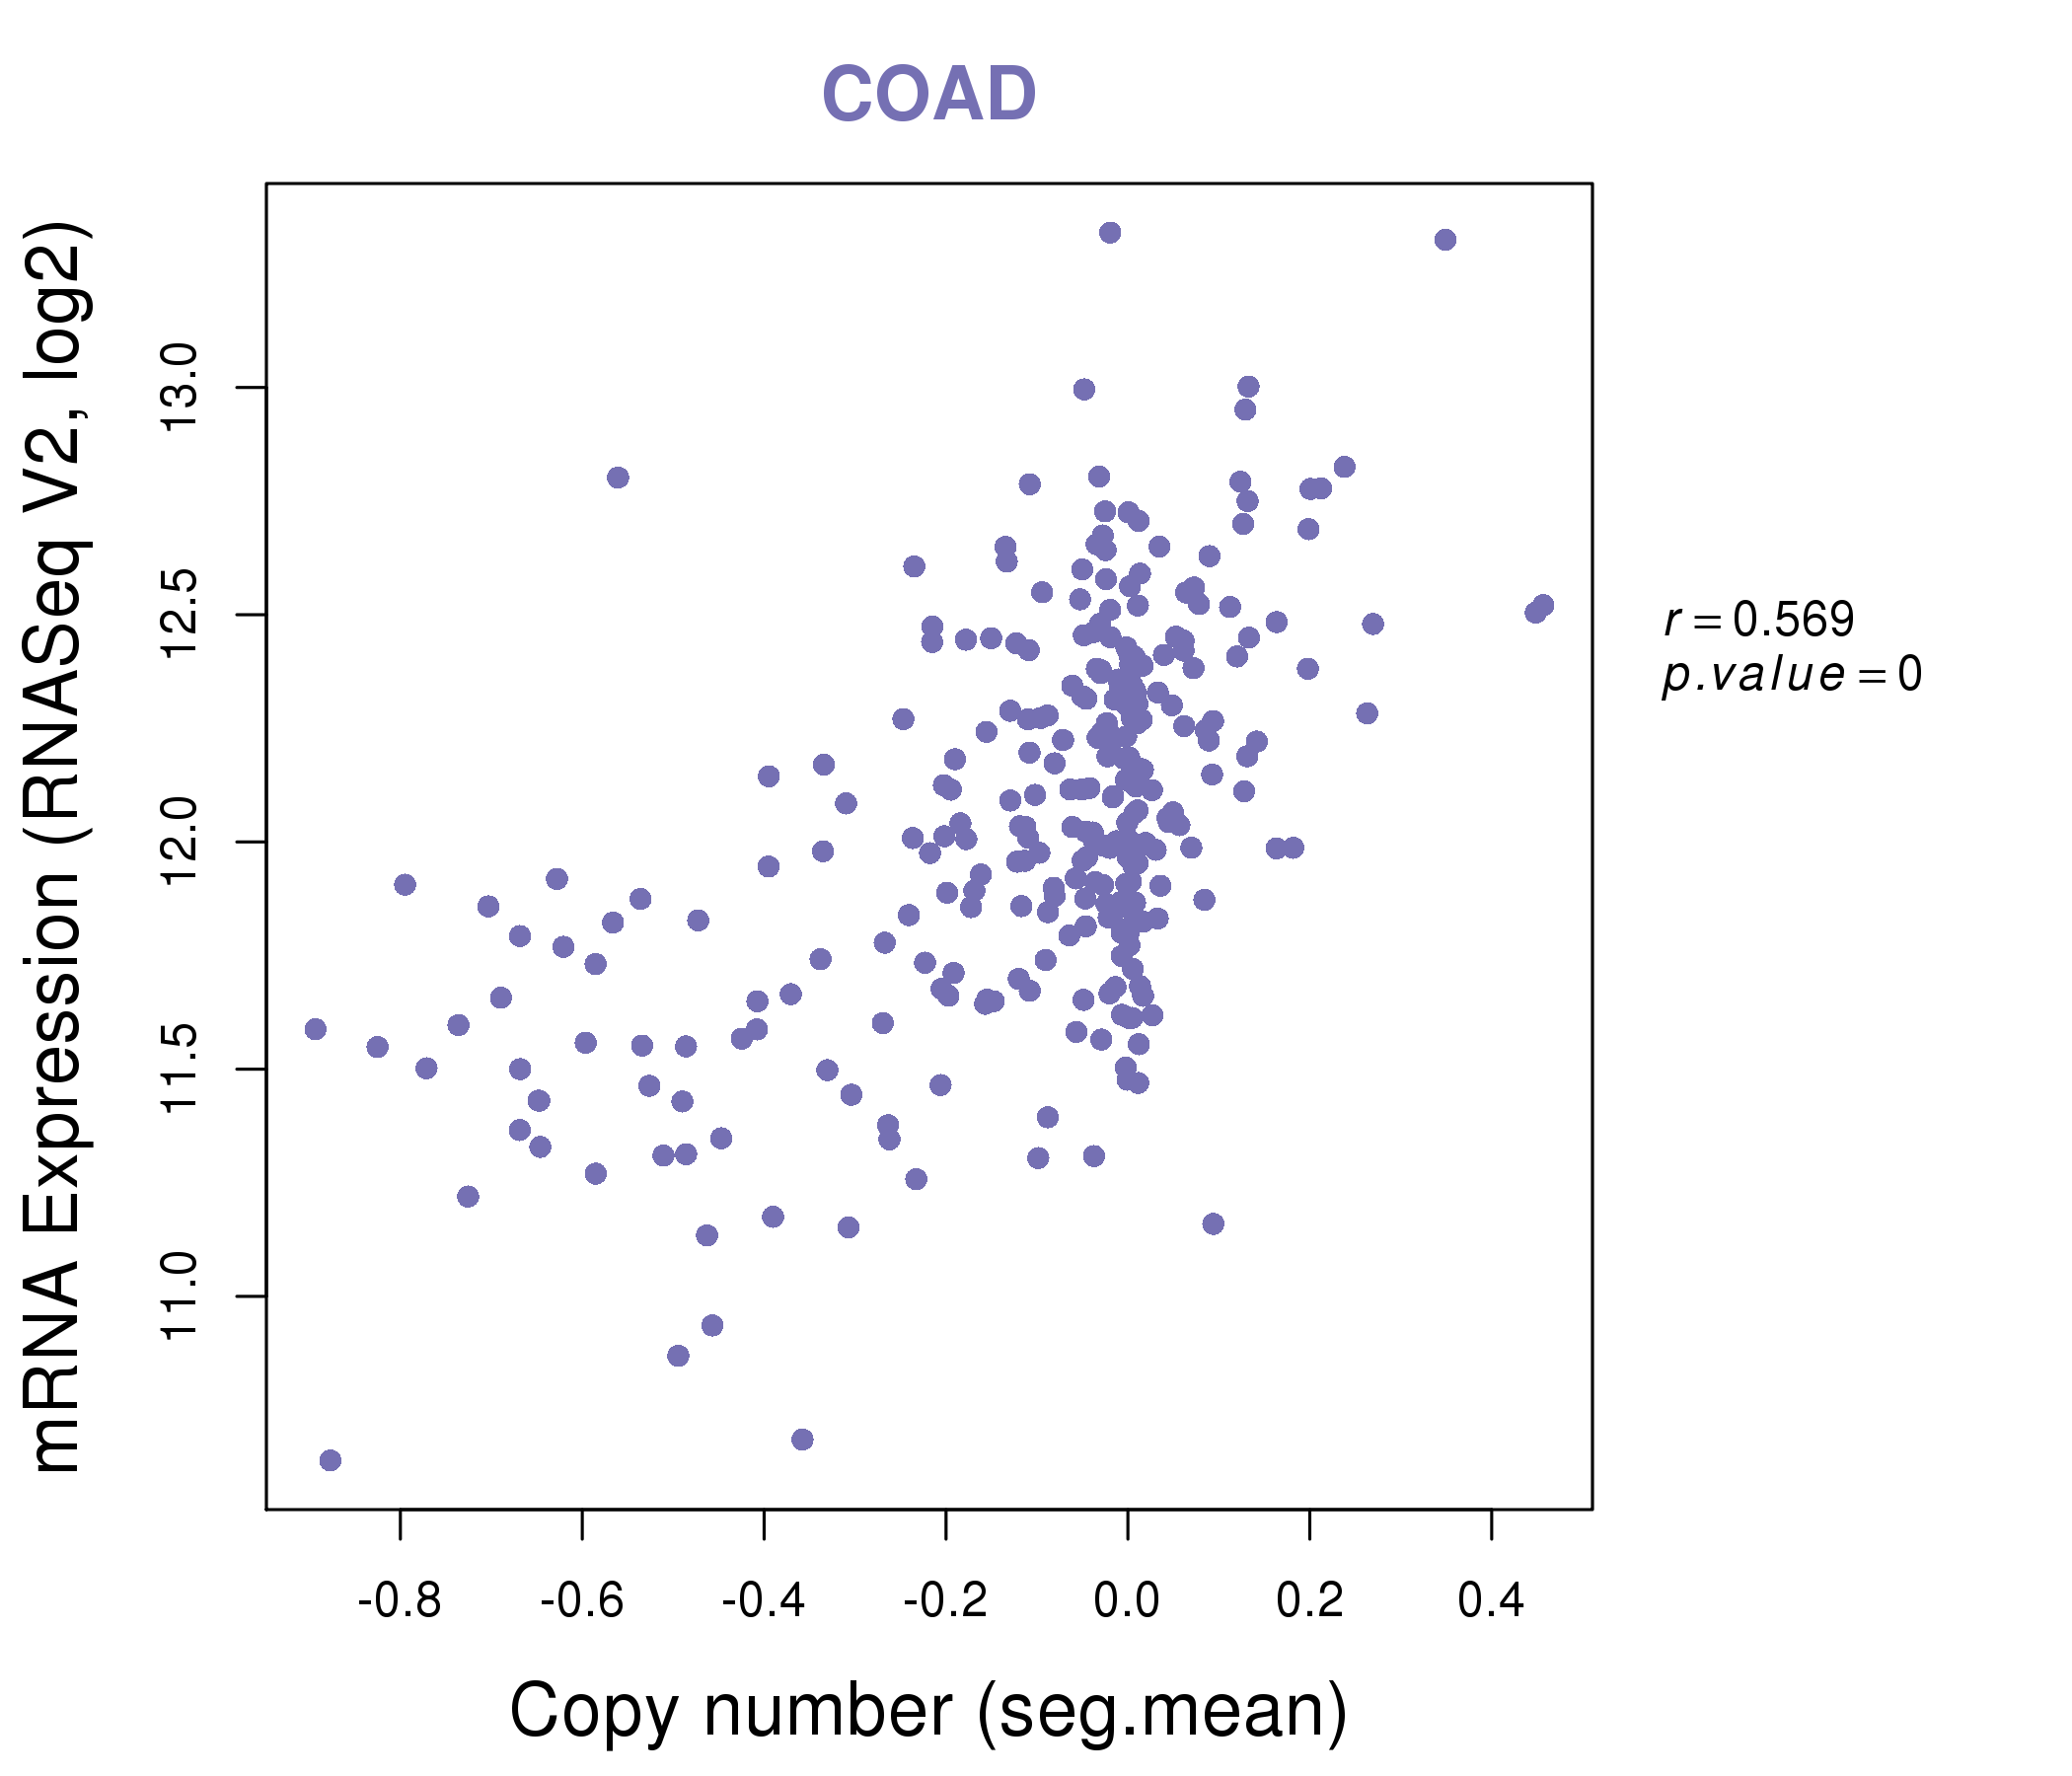
| * Copy number data were extracted from TCGA using R package TCGA-Assembler. The URLs of all public data files on TCGA DCC data server were gathered on Jan-05-2015. Function ProcessCNAData in TCGA-Assembler package was used to obtain gene-level copy number value which is calculated as the average copy number of the genomic region of a gene. |
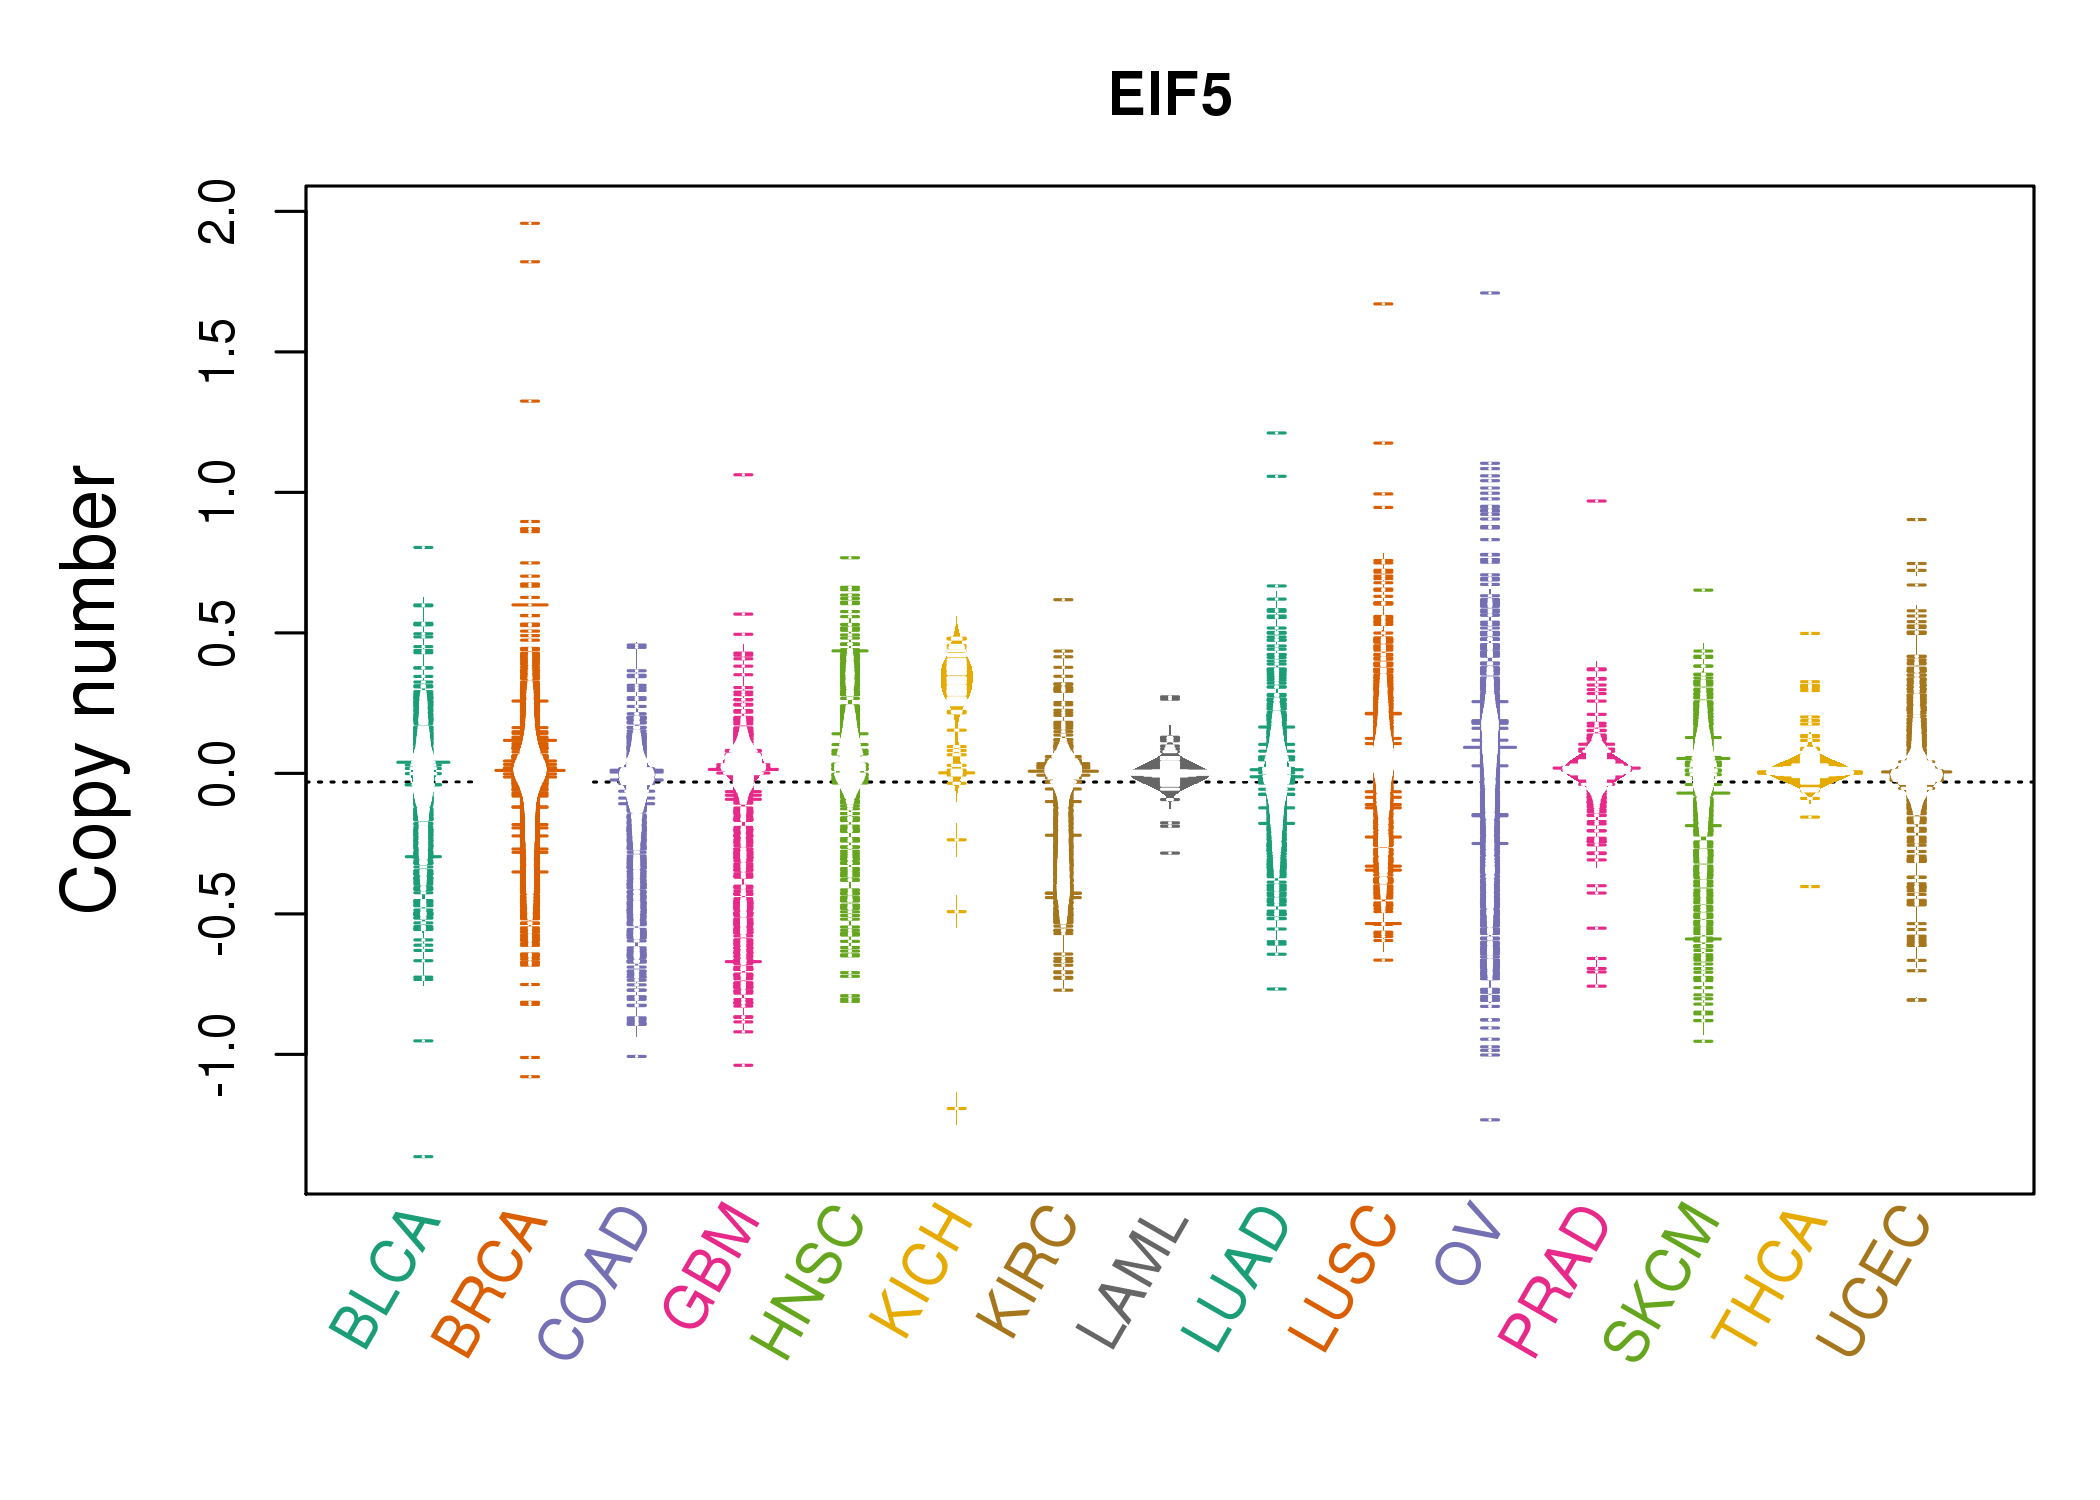 |
| cf) Tissue ID[Tissue type]: BLCA[Bladder Urothelial Carcinoma], BRCA[Breast invasive carcinoma], CESC[Cervical squamous cell carcinoma and endocervical adenocarcinoma], COAD[Colon adenocarcinoma], GBM[Glioblastoma multiforme], Glioma Low Grade, HNSC[Head and Neck squamous cell carcinoma], KICH[Kidney Chromophobe], KIRC[Kidney renal clear cell carcinoma], KIRP[Kidney renal papillary cell carcinoma], LAML[Acute Myeloid Leukemia], LUAD[Lung adenocarcinoma], LUSC[Lung squamous cell carcinoma], OV[Ovarian serous cystadenocarcinoma ], PAAD[Pancreatic adenocarcinoma], PRAD[Prostate adenocarcinoma], SKCM[Skin Cutaneous Melanoma], STAD[Stomach adenocarcinoma], THCA[Thyroid carcinoma], UCEC[Uterine Corpus Endometrial Carcinoma] |
| Top |
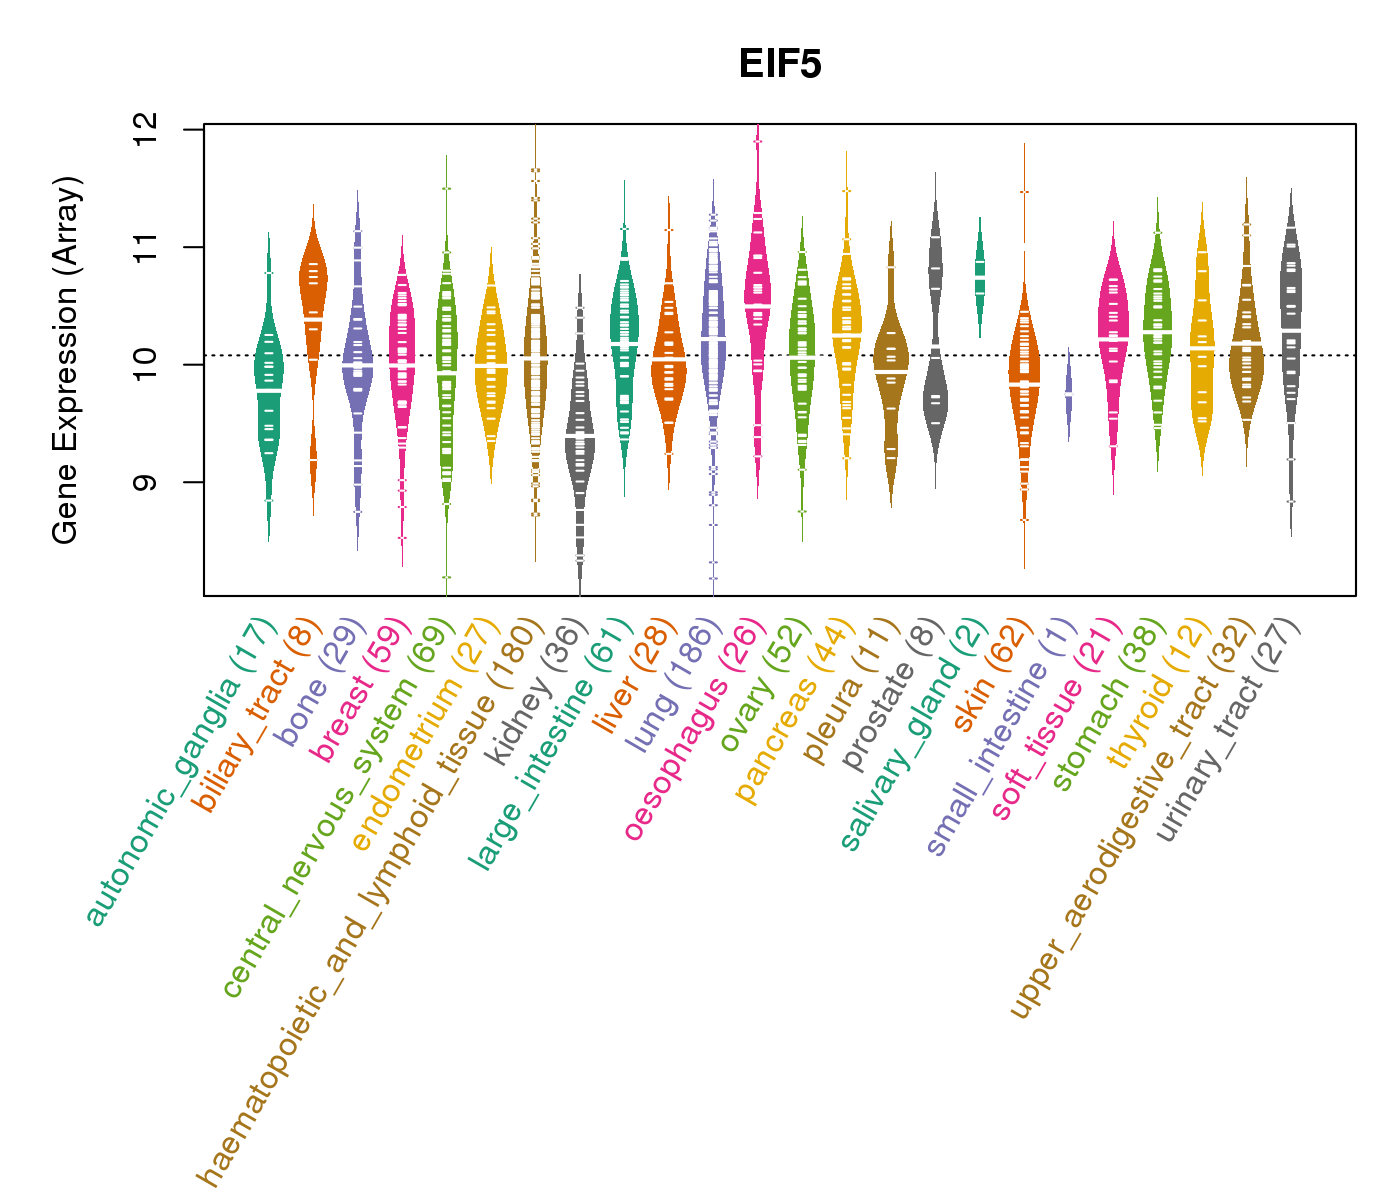
| Gene Expression for EIF5 |
| * CCLE gene expression data were extracted from CCLE_Expression_Entrez_2012-10-18.res: Gene-centric RMA-normalized mRNA expression data. |
 |
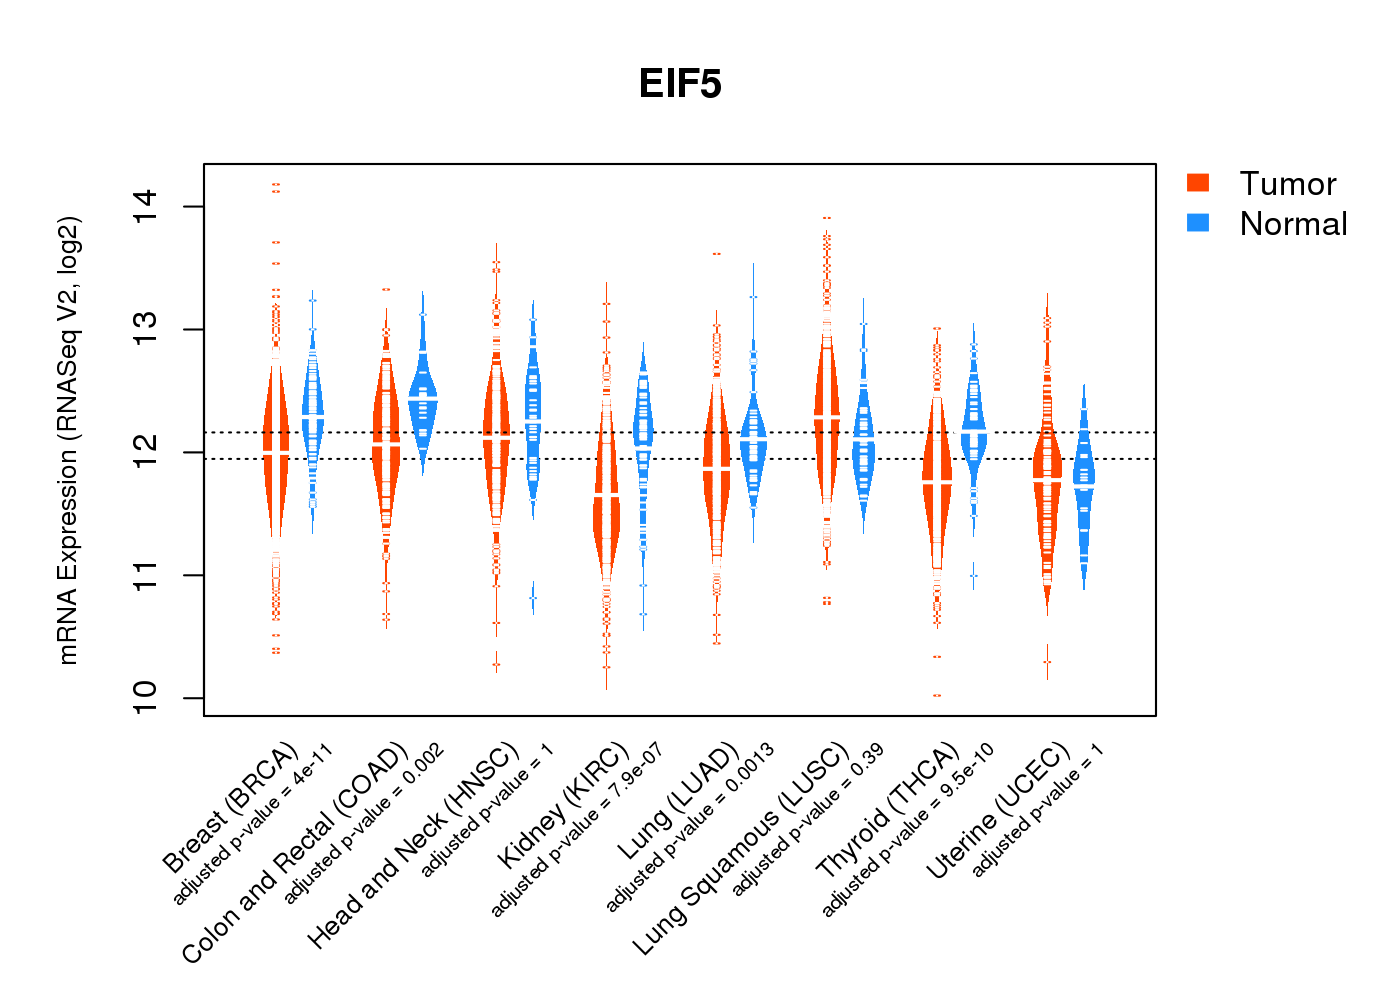
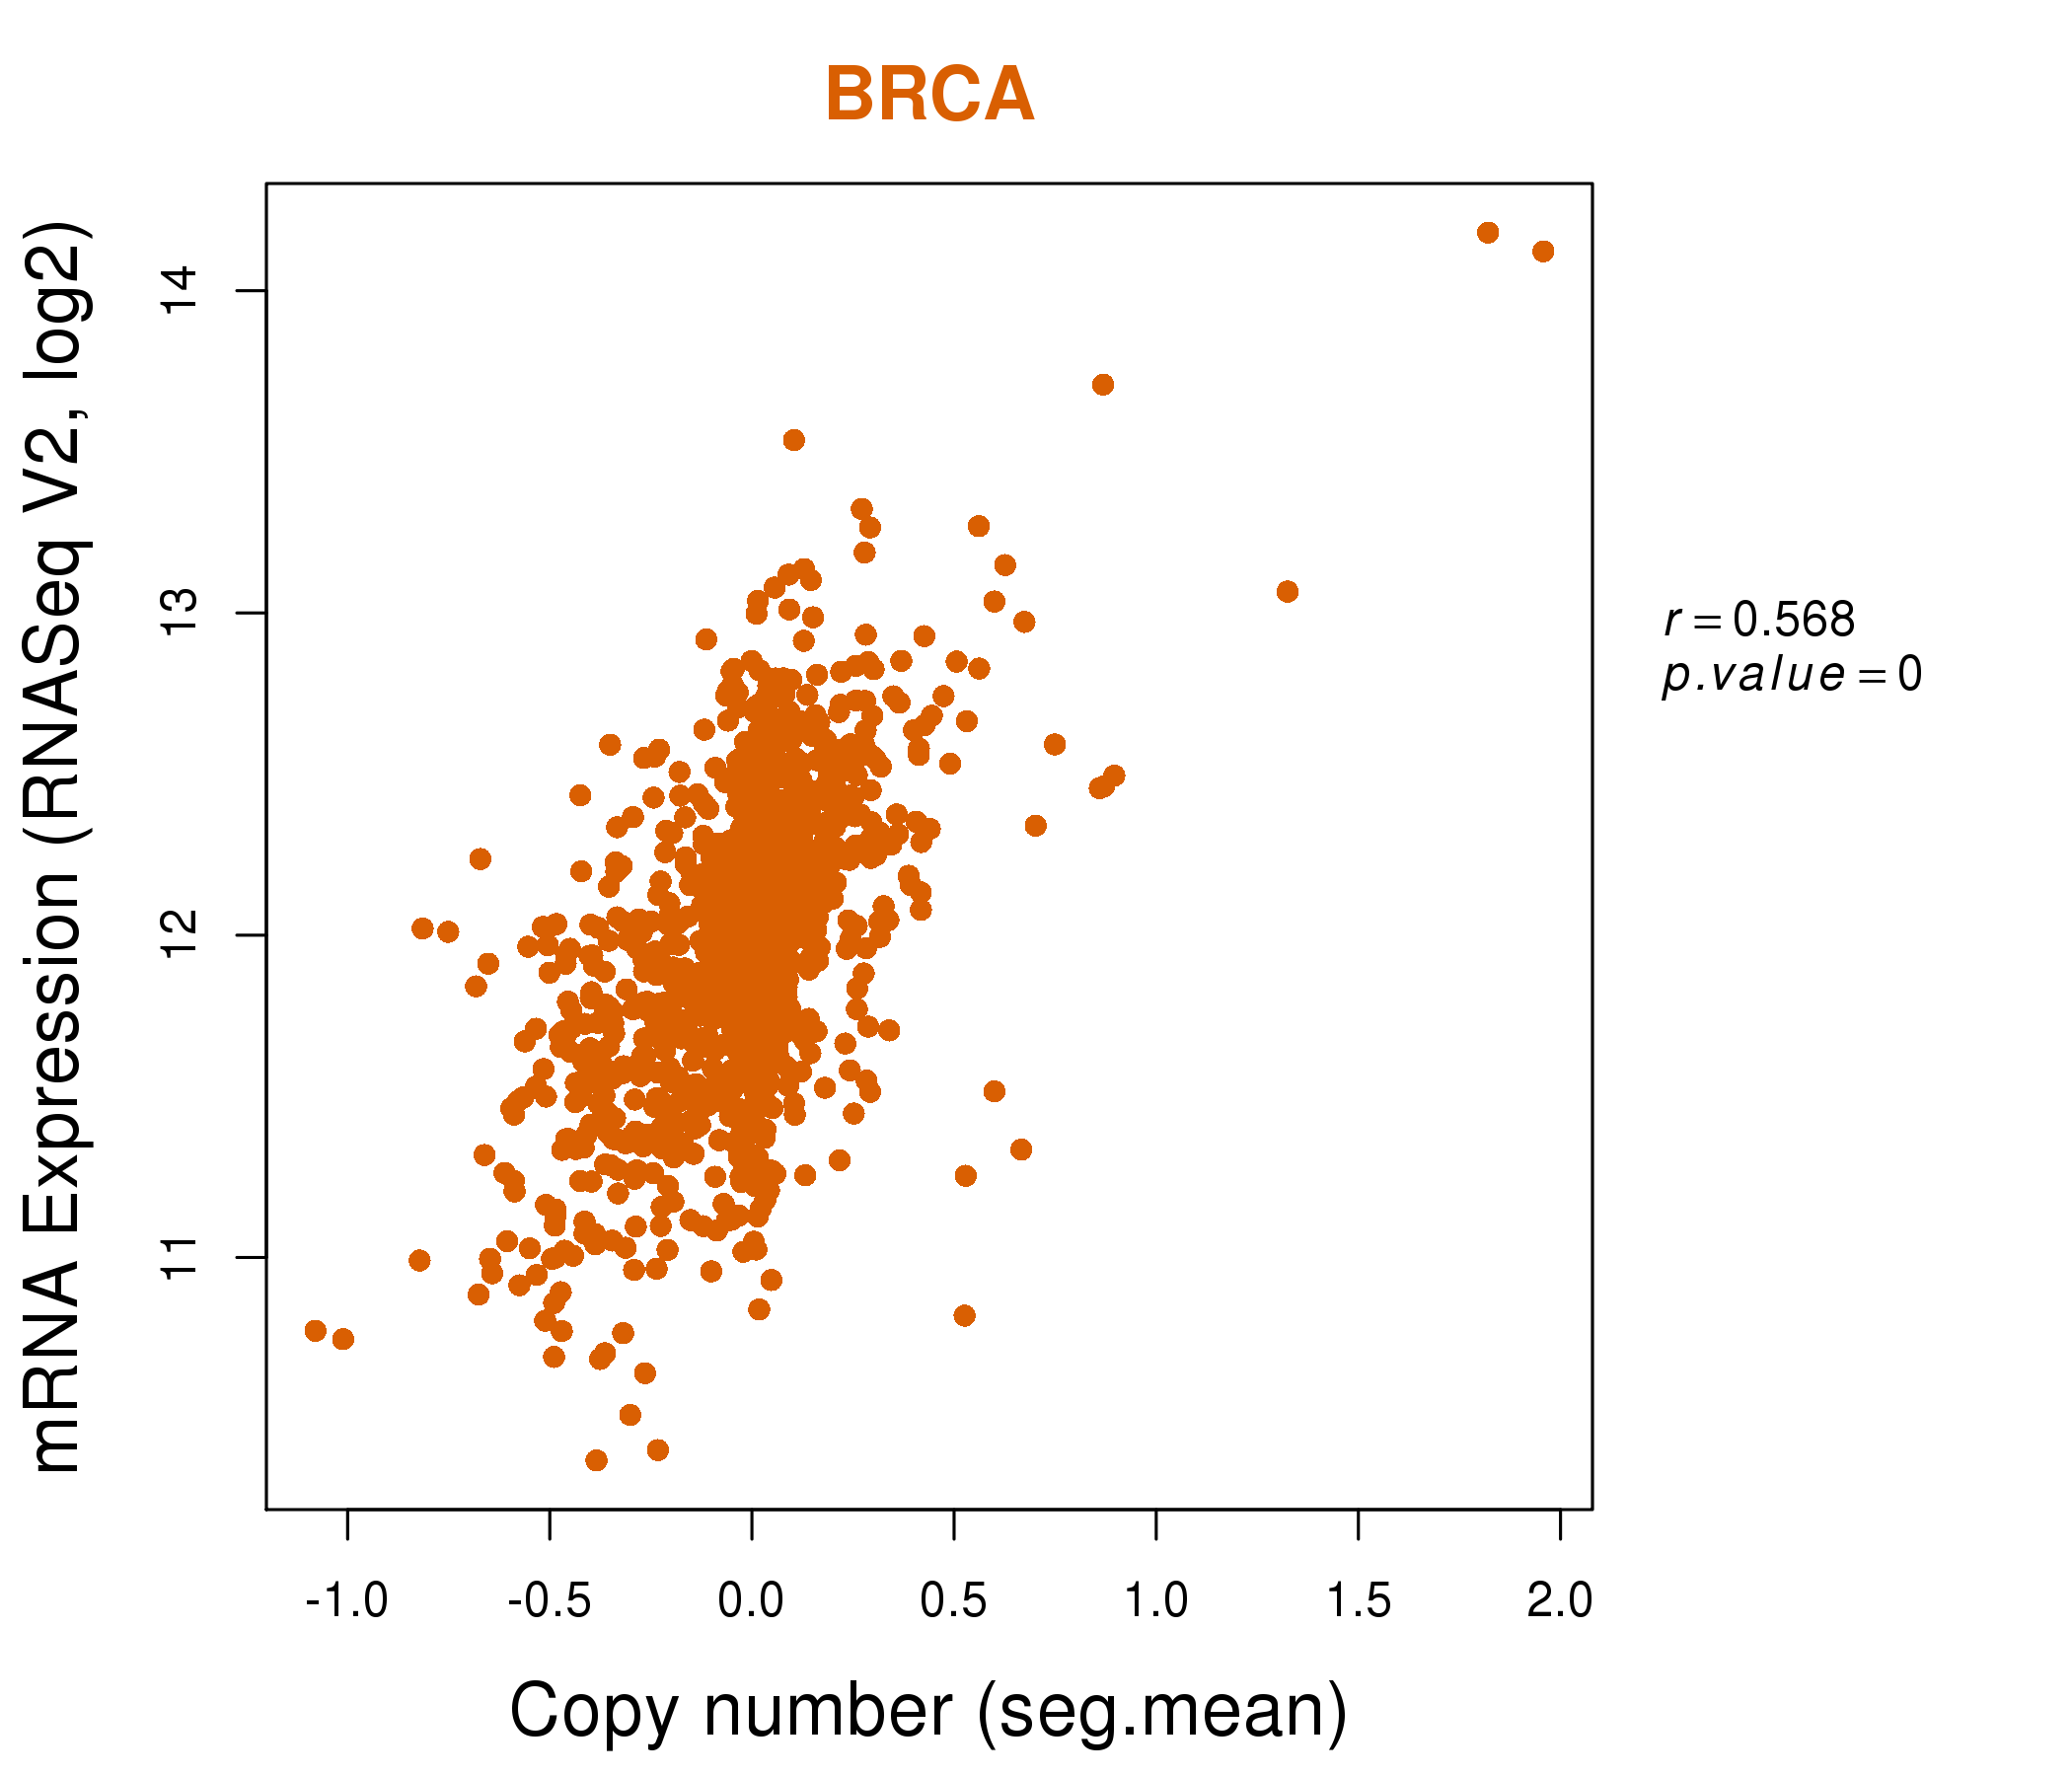
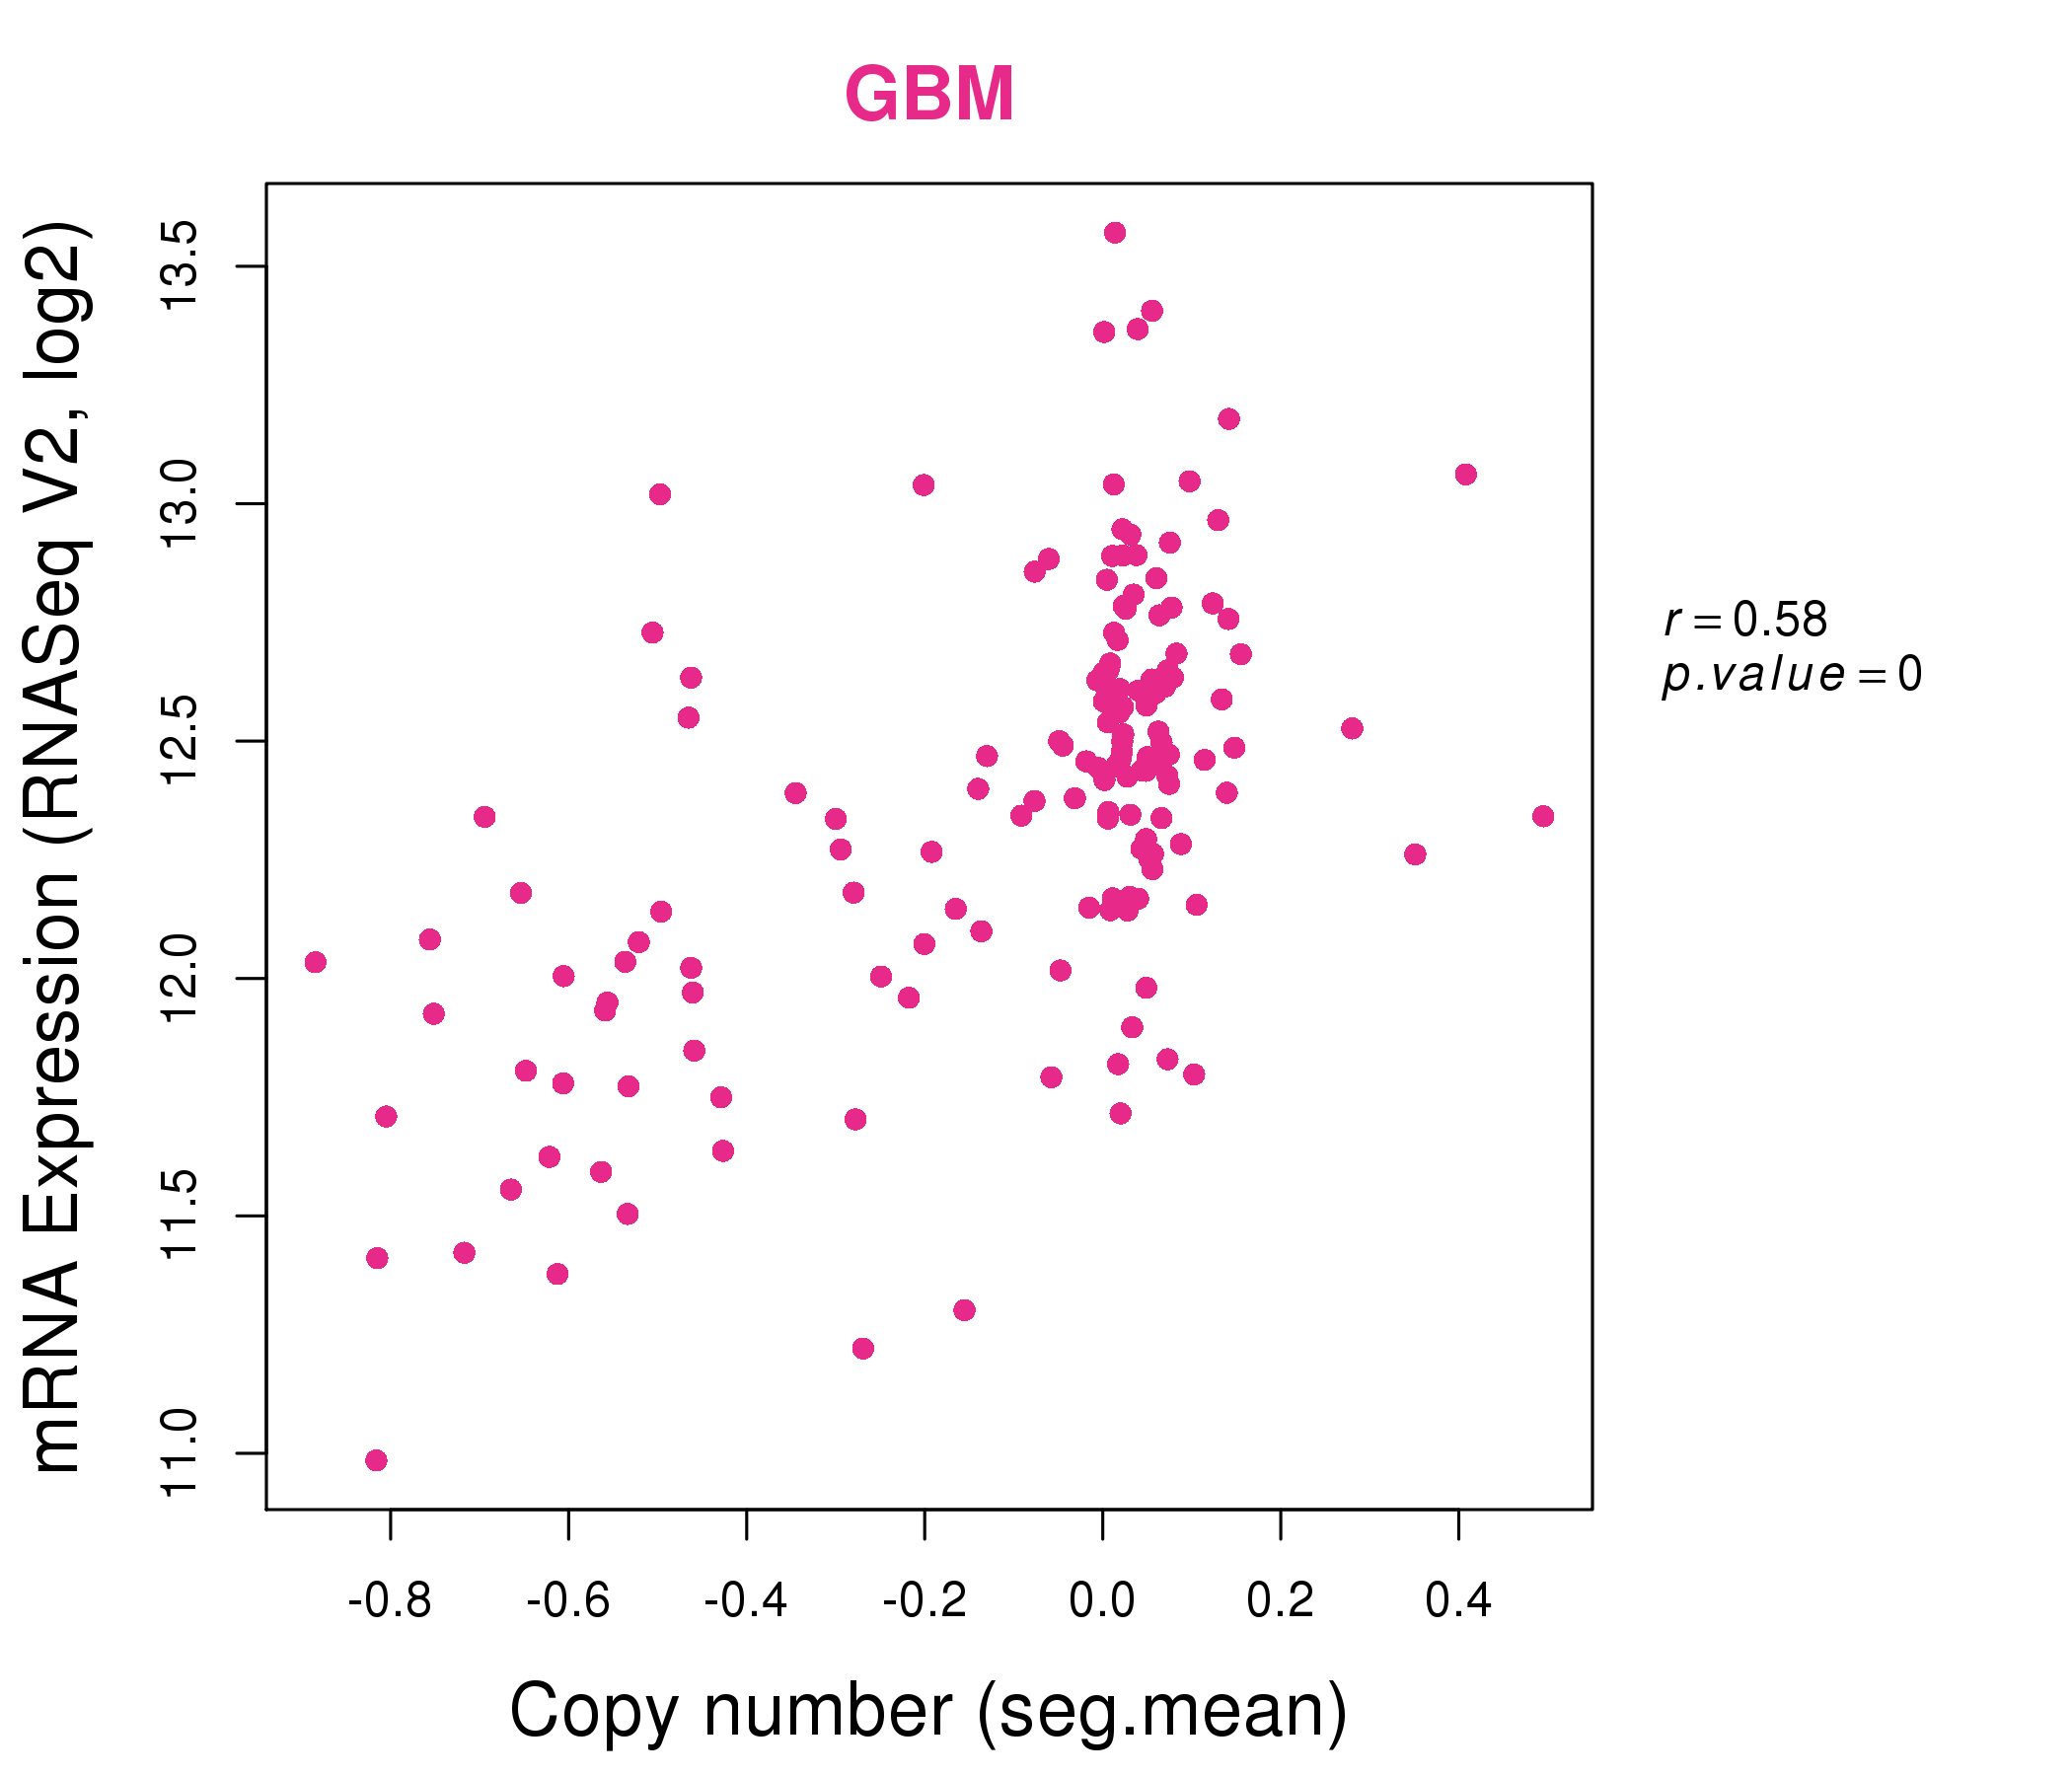
| * Normalized gene expression data of RNASeqV2 was extracted from TCGA using R package TCGA-Assembler. The URLs of all public data files on TCGA DCC data server were gathered at Jan-05-2015. Only eight cancer types have enough normal control samples for differential expression analysis. (t test, adjusted p<0.05 (using Benjamini-Hochberg FDR)) |
 |
| Top |
| * This plots show the correlation between CNV and gene expression. |
: Open all plots for all cancer types
 |
|
 |
|
| Top |
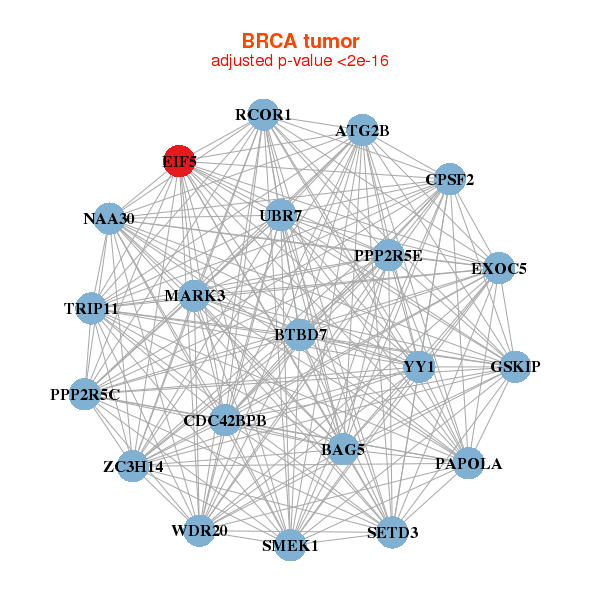
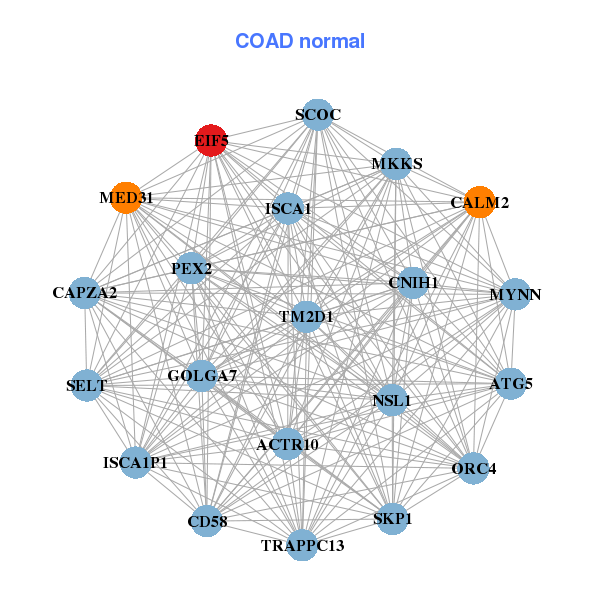
| Gene-Gene Network Information |
| * Co-Expression network figures were drawn using R package igraph. Only the top 20 genes with the highest correlations were shown. Red circle: input gene, orange circle: cell metabolism gene, sky circle: other gene |
: Open all plots for all cancer types
 |
|
| CCDC58,DNAJC2,EIF5B,FAM136A,GEMIN6,GNL2,MAGOH, MEMO1,MPHOSPH10,MRPS9,NDUFS5,NOL10,NOP58,NUTF2, PDCL3,PDSS1,RPP40,SNRPG,SSB,SSBP1,UTP11L | C6orf203,CWC27,DNAJC7,DNAJC8,EIF2S2,EIF4E2,EIF5B, FAM118B,HTATSF1,LSM1,PRPS1,PSMC2,PSMD1,PSMD7, RBM17,SBDS,TTC1,UBC,UBE2G2,XPA,ZCRB1 |
 |
|
| CCAR1,CWC22,EIF5B,HNRNPA2B1,HNRNPA3,HNRNPU,IWS1, LTV1,MPHOSPH10,MRPS5,MRPS9,NCL,NOP58,POU2F1, PPIG,PPM1G,RPF2,SSB,TARDBP,WDR75,WDR92 | ADAMTS9,AKAP12,ARMCX3,CELF2,DDX19A,DDX24,DYX1C1, EIF5B,LBR,NAV2,NUCKS1,OXCT1,PBRM1,PRKAR1A, PTPN11,ROCK1,SEC63,SRP68,SUPT16H,TCOF1,ZC3H13 |
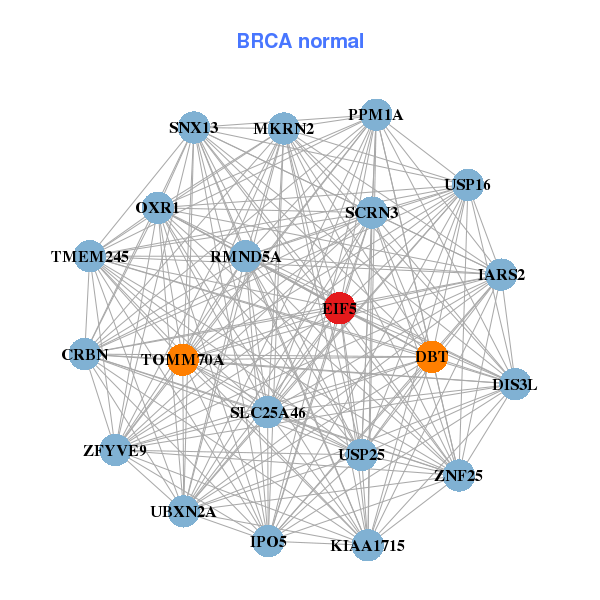
| * Co-Expression network figures were drawn using R package igraph. Only the top 20 genes with the highest correlations were shown. Red circle: input gene, orange circle: cell metabolism gene, sky circle: other gene |
: Open all plots for all cancer types
| Top |
: Open all interacting genes' information including KEGG pathway for all interacting genes from DAVID
| Top |
| Pharmacological Information for EIF5 |
| There's no related Drug. |
| Top |
| Cross referenced IDs for EIF5 |
| * We obtained these cross-references from Uniprot database. It covers 150 different DBs, 18 categories. http://www.uniprot.org/help/cross_references_section |
: Open all cross reference information
|
Copyright © 2016-Present - The Univsersity of Texas Health Science Center at Houston @ |