|
||||||||||||||||||||
| |
| Phenotypic Information (metabolism pathway, cancer, disease, phenome) |
| |
| |
| Gene-Gene Network Information: Co-Expression Network, Interacting Genes & KEGG |
| |
|


| Gene Summary for ELAVL1 |
| Basic gene info. | Gene symbol | ELAVL1 |
| Gene name | ELAV like RNA binding protein 1 | |
| Synonyms | ELAV1|HUR|Hua|MelG | |
| Cytomap | UCSC genome browser: 19p13.2 | |
| Genomic location | chr19 :8023456-8070529 | |
| Type of gene | protein-coding | |
| RefGenes | NM_001419.2, | |
| Ensembl id | ENSG00000066044 | |
| Description | ELAV (embryonic lethal, abnormal vision, Drosophila)-like 1 (Hu antigen R)ELAV-like protein 1Hu antigen Rembryonic lethal, abnormal vision, drosophila, homolog-like 1hu-antigen R | |
| Modification date | 20141222 | |
| dbXrefs | MIM : 603466 | |
| HGNC : HGNC | ||
| Ensembl : ENSG00000066044 | ||
| HPRD : 16025 | ||
| Vega : OTTHUMG00000182470 | ||
| Protein | UniProt: Q15717 go to UniProt's Cross Reference DB Table | |
| Expression | CleanEX: HS_ELAVL1 | |
| BioGPS: 1994 | ||
| Gene Expression Atlas: ENSG00000066044 | ||
| The Human Protein Atlas: ENSG00000066044 | ||
| Pathway | NCI Pathway Interaction Database: ELAVL1 | |
| KEGG: ELAVL1 | ||
| REACTOME: ELAVL1 | ||
| ConsensusPathDB | ||
| Pathway Commons: ELAVL1 | ||
| Metabolism | MetaCyc: ELAVL1 | |
| HUMANCyc: ELAVL1 | ||
| Regulation | Ensembl's Regulation: ENSG00000066044 | |
| miRBase: chr19 :8,023,456-8,070,529 | ||
| TargetScan: NM_001419 | ||
| cisRED: ENSG00000066044 | ||
| Context | iHOP: ELAVL1 | |
| cancer metabolism search in PubMed: ELAVL1 | ||
| UCL Cancer Institute: ELAVL1 | ||
| Assigned class in ccmGDB | A - This gene has a literature evidence and it belongs to cancer gene. | |
| References showing role of ELAVL1 in cancer cell metabolism | 1. Chou SD, Murshid A, Eguchi T, Gong J, Calderwood SK (2015) HSF1 regulation of beta-catenin in mammary cancer cells through control of HuR/elavL1 expression. Oncogene 34: 2178-2188. doi: 10.1038/onc.2014.177. pmid: 4275421. go to article 2. Degese MS, Tanos T, Naipauer J, Gingerich T, Chiappe D, et al. (2015) An interplay between the p38 MAPK pathway and AUBPs regulates c-fos mRNA stability during mitogenic stimulation. Biochem J 467: 77-90. doi: 10.1042/BJ20141100. go to article | |
| Top |
| Phenotypic Information for ELAVL1(metabolism pathway, cancer, disease, phenome) |
| Cancer | CGAP: ELAVL1 |
| Familial Cancer Database: ELAVL1 | |
| * This gene is included in those cancer gene databases. |
|
|
|
|
|
| . | ||||||||||||||
Oncogene 1 | Significant driver gene in | |||||||||||||||||||
| cf) number; DB name 1 Oncogene; http://nar.oxfordjournals.org/content/35/suppl_1/D721.long, 2 Tumor Suppressor gene; https://bioinfo.uth.edu/TSGene/, 3 Cancer Gene Census; http://www.nature.com/nrc/journal/v4/n3/abs/nrc1299.html, 4 CancerGenes; http://nar.oxfordjournals.org/content/35/suppl_1/D721.long, 5 Network of Cancer Gene; http://ncg.kcl.ac.uk/index.php, 1Therapeutic Vulnerabilities in Cancer; http://cbio.mskcc.org/cancergenomics/statius/ |
| REACTOME_METABOLISM_OF_MRNA REACTOME_METABOLISM_OF_RNA | |
| OMIM | 603466; gene. |
| Orphanet | |
| Disease | KEGG Disease: ELAVL1 |
| MedGen: ELAVL1 (Human Medical Genetics with Condition) | |
| ClinVar: ELAVL1 | |
| Phenotype | MGI: ELAVL1 (International Mouse Phenotyping Consortium) |
| PhenomicDB: ELAVL1 | |
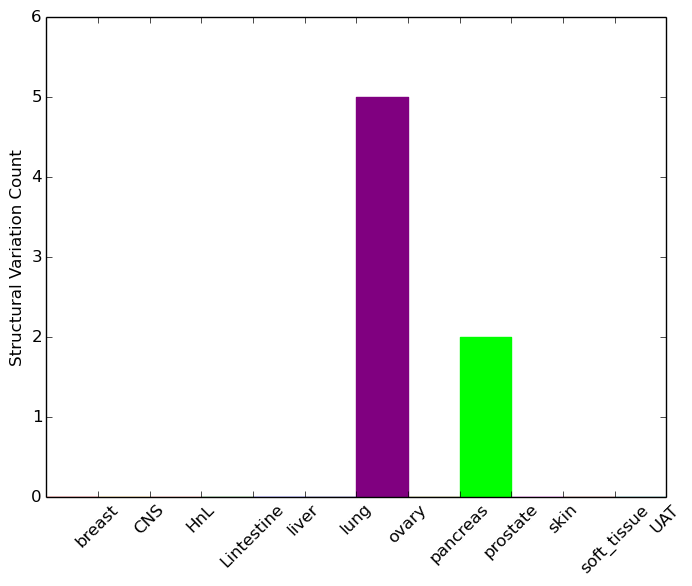
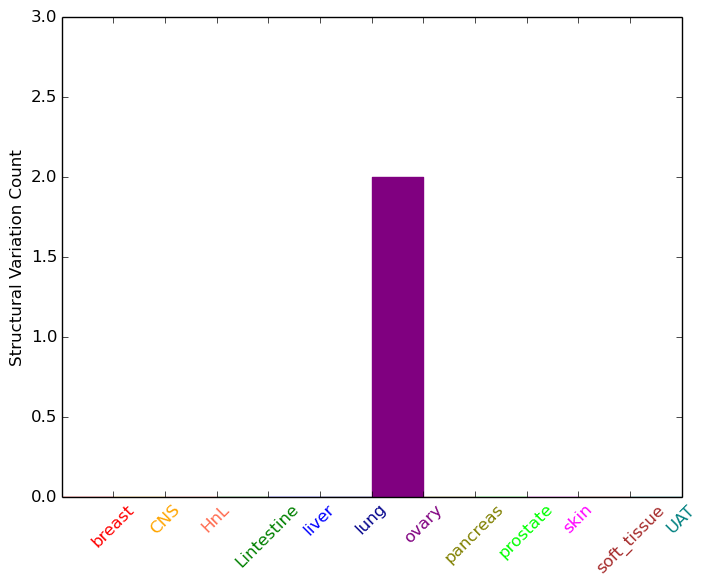
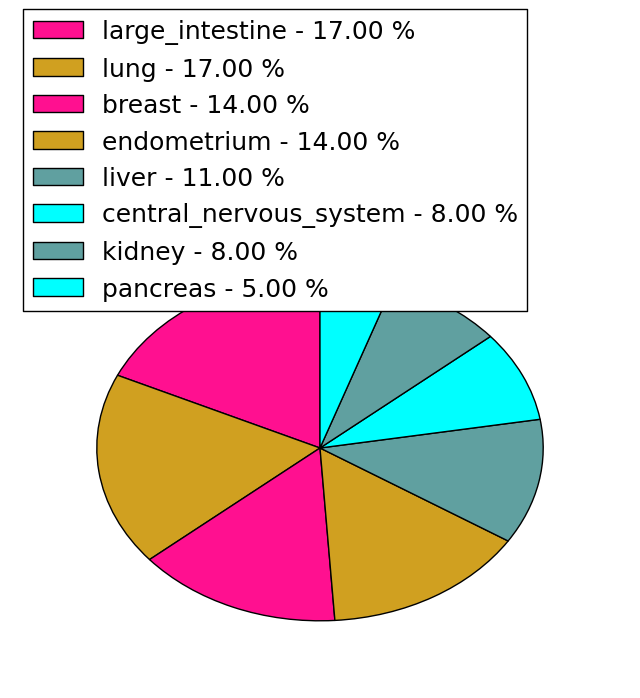
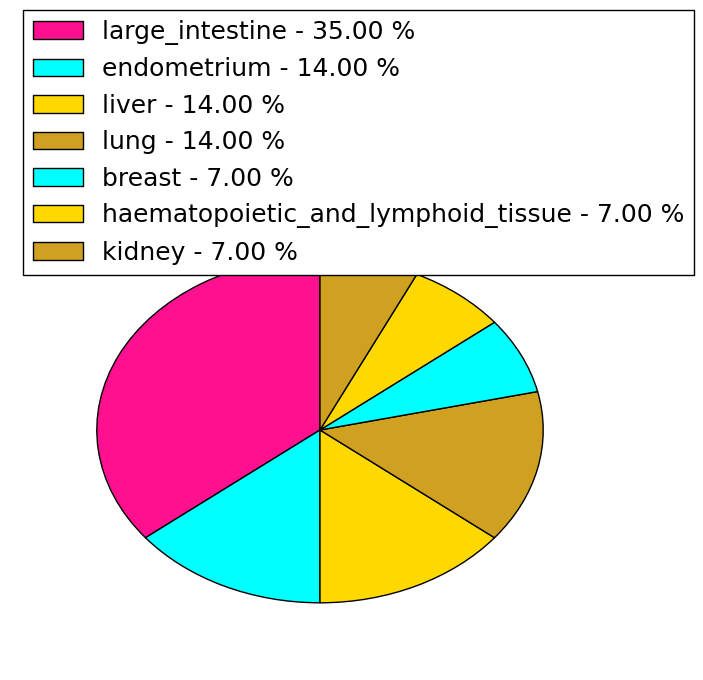
| Mutations for ELAVL1 |
| * Under tables are showing count per each tissue to give us broad intuition about tissue specific mutation patterns.You can go to the detailed page for each mutation database's web site. |
| - Statistics for Tissue and Mutation type | Top |
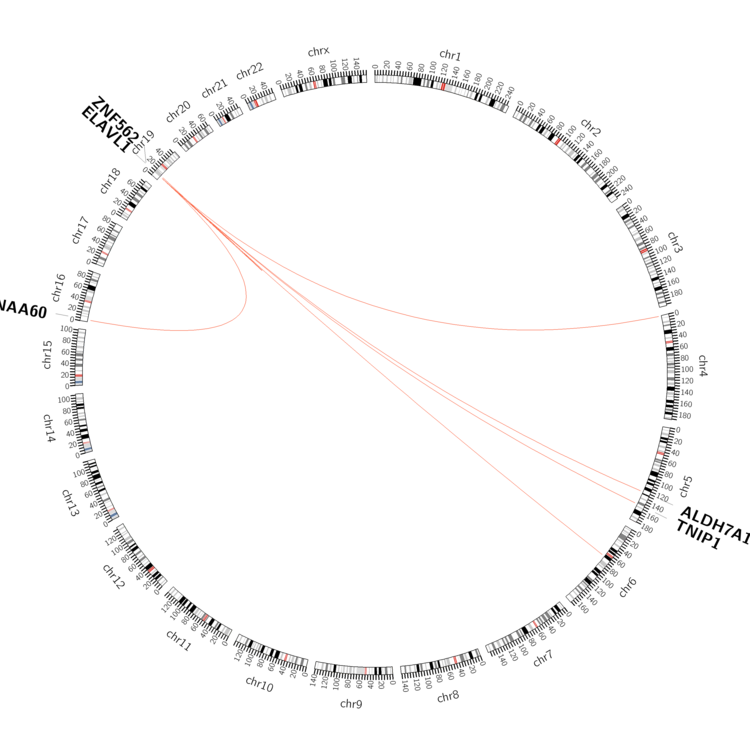 |
| - For Inter-chromosomal Variations |
| * Inter-chromosomal variantions includes 'interchromosomal amplicon to amplicon', 'interchromosomal amplicon to non-amplified dna', 'interchromosomal insertion', 'Interchromosomal unknown type'. |
 |
| - For Intra-chromosomal Variations |
| * Intra-chromosomal variantions includes 'intrachromosomal amplicon to amplicon', 'intrachromosomal amplicon to non-amplified dna', 'intrachromosomal deletion', 'intrachromosomal fold-back inversion', 'intrachromosomal inversion', 'intrachromosomal tandem duplication', 'Intrachromosomal unknown type', 'intrachromosomal with inverted orientation', 'intrachromosomal with non-inverted orientation'. |
 |
| Sample | Symbol_a | Chr_a | Start_a | End_a | Symbol_b | Chr_b | Start_b | End_b |
| ovary | ELAVL1 | chr19 | 8046013 | 8046033 | ELAVL1 | chr19 | 8041550 | 8041570 |
| ovary | ELAVL1 | chr19 | 8051284 | 8051304 | ZNF562 | chr19 | 9773927 | 9773947 |
| prostate | ELAVL1 | chr19 | 8033862 | 8035862 | ALDH7A1 | chr5 | 125921404 | 125923404 |
| cf) Tissue number; Tissue name (1;Breast, 2;Central_nervous_system, 3;Haematopoietic_and_lymphoid_tissue, 4;Large_intestine, 5;Liver, 6;Lung, 7;Ovary, 8;Pancreas, 9;Prostate, 10;Skin, 11;Soft_tissue, 12;Upper_aerodigestive_tract) |
| * From mRNA Sanger sequences, Chitars2.0 arranged chimeric transcripts. This table shows ELAVL1 related fusion information. |
| ID | Head Gene | Tail Gene | Accession | Gene_a | qStart_a | qEnd_a | Chromosome_a | tStart_a | tEnd_a | Gene_a | qStart_a | qEnd_a | Chromosome_a | tStart_a | tEnd_a |
| Top |
| There's no copy number variation information in COSMIC data for this gene. |
| Top |
|
 |
| Top |
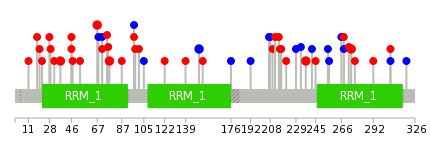
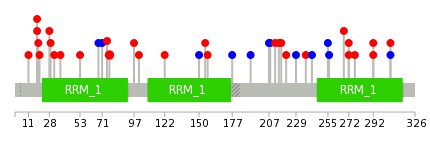
| Stat. for Non-Synonymous SNVs (# total SNVs=34) | (# total SNVs=14) |
 |  |
(# total SNVs=1) | (# total SNVs=0) |
 |
| Top |
| * When you move the cursor on each content, you can see more deailed mutation information on the Tooltip. Those are primary_site,primary_histology,mutation(aa),pubmedID. |
| GRCh37 position | Mutation(aa) | Unique sampleID count |
| chr19:8028639-8028639 | p.P237S | 2 |
| chr19:8028528-8028528 | p.K274E | 2 |
| chr19:8046044-8046044 | p.N67H | 2 |
| chr19:8045966-8045966 | p.? | 2 |
| chr19:8032655-8032655 | p.A150A | 2 |
| chr19:8046013-8046013 | p.A77V | 2 |
| chr19:8056590-8056590 | p.R37Q | 2 |
| chr19:8056606-8056606 | p.T32A | 1 |
| chr19:8032470-8032470 | p.H212R | 1 |
| chr19:8038675-8038675 | p.V122L | 1 |
| Top |
|
 |
| Point Mutation/ Tissue ID | 1 | 2 | 3 | 4 | 5 | 6 | 7 | 8 | 9 | 10 | 11 | 12 | 13 | 14 | 15 | 16 | 17 | 18 | 19 | 20 |
| # sample | 2 | 3 | 9 | 1 | 1 | 1 | 6 | 1 | 1 | 8 | 1 | 6 | ||||||||
| # mutation | 2 | 3 | 8 | 1 | 1 | 1 | 7 | 1 | 1 | 8 | 1 | 6 | ||||||||
| nonsynonymous SNV | 1 | 2 | 5 | 1 | 1 | 1 | 6 | 1 | 7 | 4 | ||||||||||
| synonymous SNV | 1 | 1 | 3 | 1 | 1 | 1 | 1 | 2 |
| cf) Tissue ID; Tissue type (1; BLCA[Bladder Urothelial Carcinoma], 2; BRCA[Breast invasive carcinoma], 3; CESC[Cervical squamous cell carcinoma and endocervical adenocarcinoma], 4; COAD[Colon adenocarcinoma], 5; GBM[Glioblastoma multiforme], 6; Glioma Low Grade, 7; HNSC[Head and Neck squamous cell carcinoma], 8; KICH[Kidney Chromophobe], 9; KIRC[Kidney renal clear cell carcinoma], 10; KIRP[Kidney renal papillary cell carcinoma], 11; LAML[Acute Myeloid Leukemia], 12; LUAD[Lung adenocarcinoma], 13; LUSC[Lung squamous cell carcinoma], 14; OV[Ovarian serous cystadenocarcinoma ], 15; PAAD[Pancreatic adenocarcinoma], 16; PRAD[Prostate adenocarcinoma], 17; SKCM[Skin Cutaneous Melanoma], 18:STAD[Stomach adenocarcinoma], 19:THCA[Thyroid carcinoma], 20:UCEC[Uterine Corpus Endometrial Carcinoma]) |
| Top |
| * We represented just top 10 SNVs. When you move the cursor on each content, you can see more deailed mutation information on the Tooltip. Those are primary_site, primary_histology, mutation(aa), pubmedID. |
| Genomic Position | Mutation(aa) | Unique sampleID count |
| chr19:8046013 | p.A77V | 2 |
| chr19:8056648 | p.N272S | 2 |
| chr19:8028533 | p.G18W | 2 |
| chr19:8032655 | p.G268D | 1 |
| chr19:8056613 | p.A150A | 1 |
| chr19:8028431 | p.E11K | 1 |
| chr19:8028686 | p.D256D | 1 |
| chr19:8038675 | p.V122L | 1 |
| chr19:8056617 | p.A255A | 1 |
| chr19:8028472 | p.E101G | 1 |
| * Copy number data were extracted from TCGA using R package TCGA-Assembler. The URLs of all public data files on TCGA DCC data server were gathered on Jan-05-2015. Function ProcessCNAData in TCGA-Assembler package was used to obtain gene-level copy number value which is calculated as the average copy number of the genomic region of a gene. |
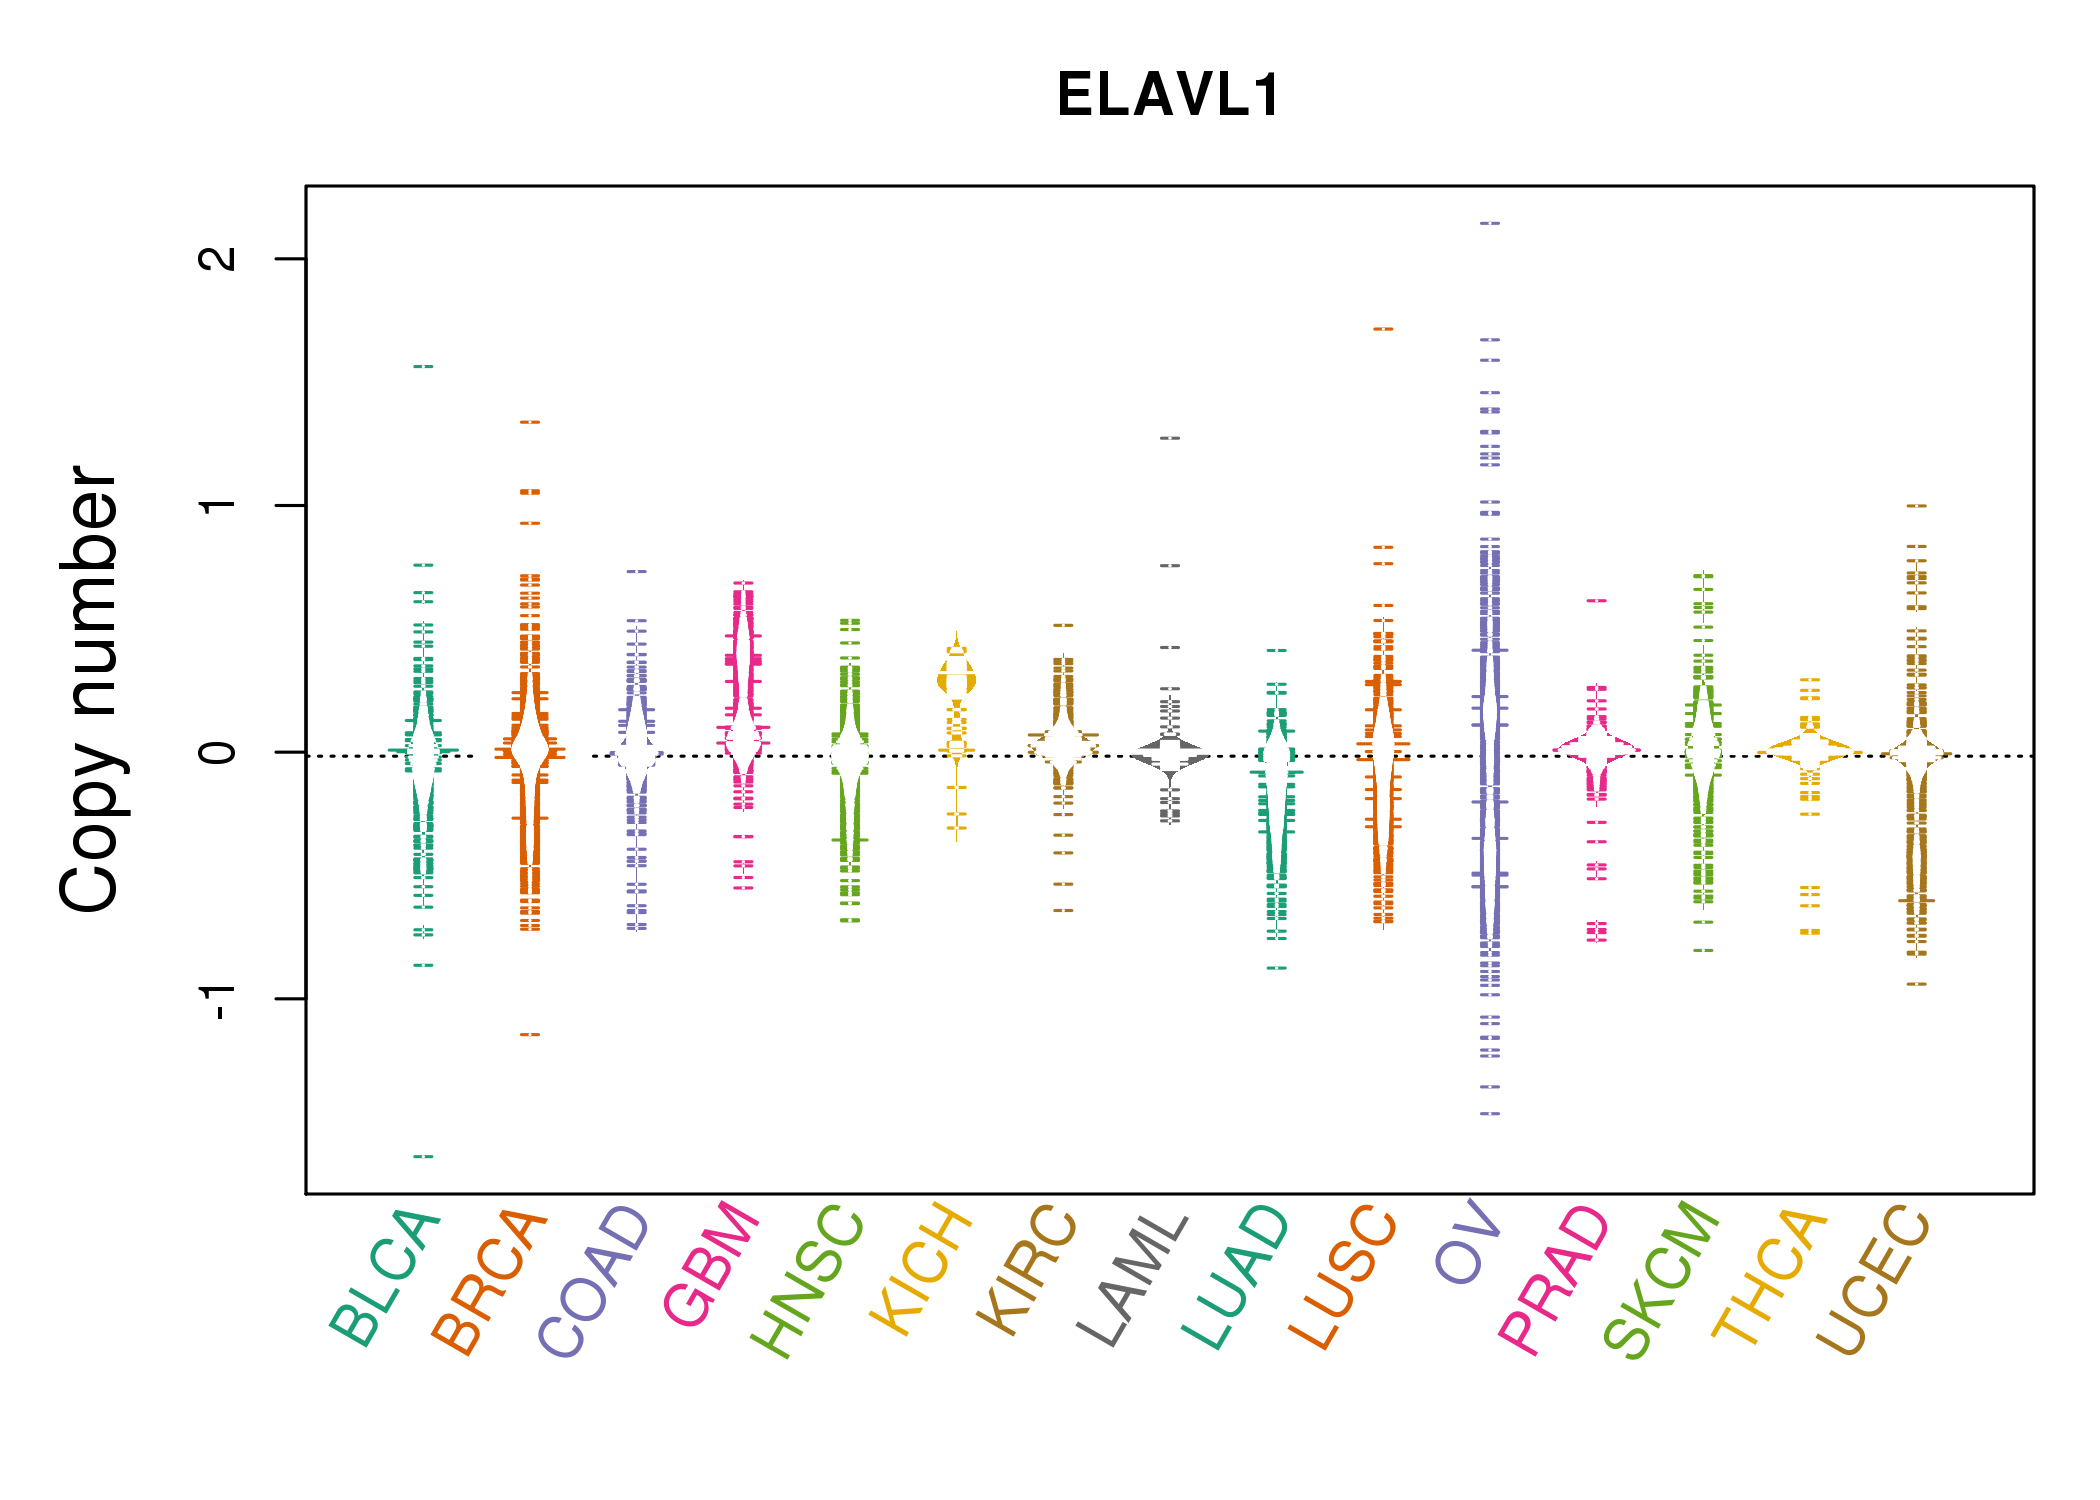 |
| cf) Tissue ID[Tissue type]: BLCA[Bladder Urothelial Carcinoma], BRCA[Breast invasive carcinoma], CESC[Cervical squamous cell carcinoma and endocervical adenocarcinoma], COAD[Colon adenocarcinoma], GBM[Glioblastoma multiforme], Glioma Low Grade, HNSC[Head and Neck squamous cell carcinoma], KICH[Kidney Chromophobe], KIRC[Kidney renal clear cell carcinoma], KIRP[Kidney renal papillary cell carcinoma], LAML[Acute Myeloid Leukemia], LUAD[Lung adenocarcinoma], LUSC[Lung squamous cell carcinoma], OV[Ovarian serous cystadenocarcinoma ], PAAD[Pancreatic adenocarcinoma], PRAD[Prostate adenocarcinoma], SKCM[Skin Cutaneous Melanoma], STAD[Stomach adenocarcinoma], THCA[Thyroid carcinoma], UCEC[Uterine Corpus Endometrial Carcinoma] |
| Top |
| Gene Expression for ELAVL1 |
| * CCLE gene expression data were extracted from CCLE_Expression_Entrez_2012-10-18.res: Gene-centric RMA-normalized mRNA expression data. |
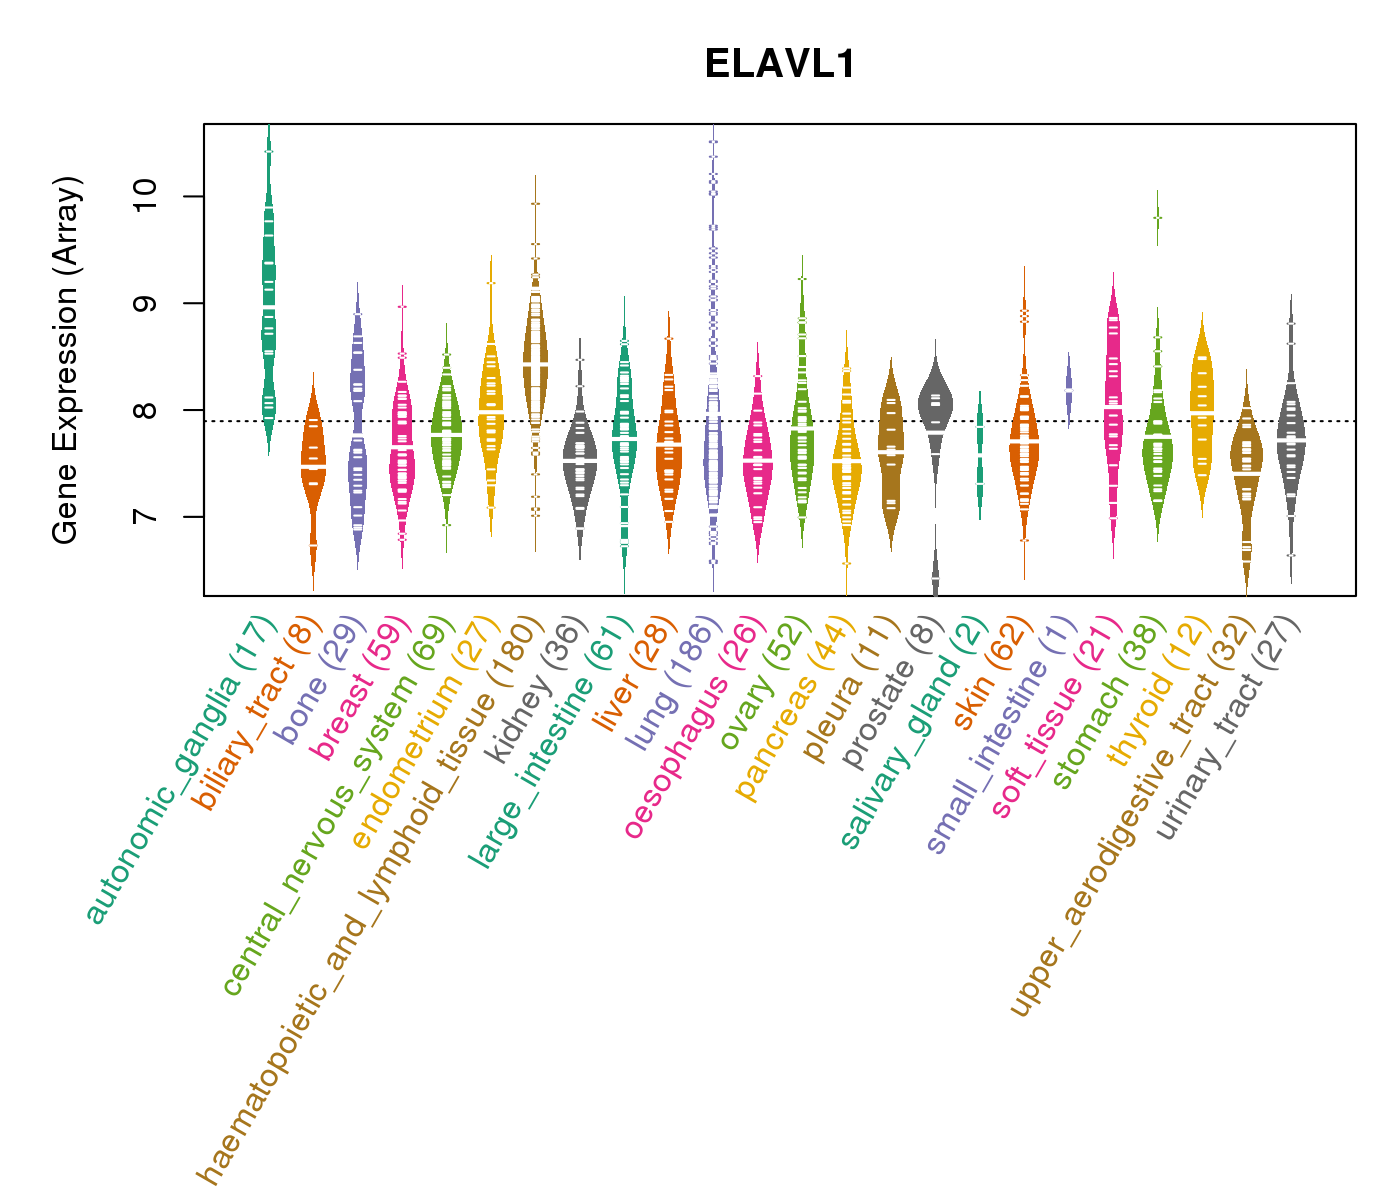 |
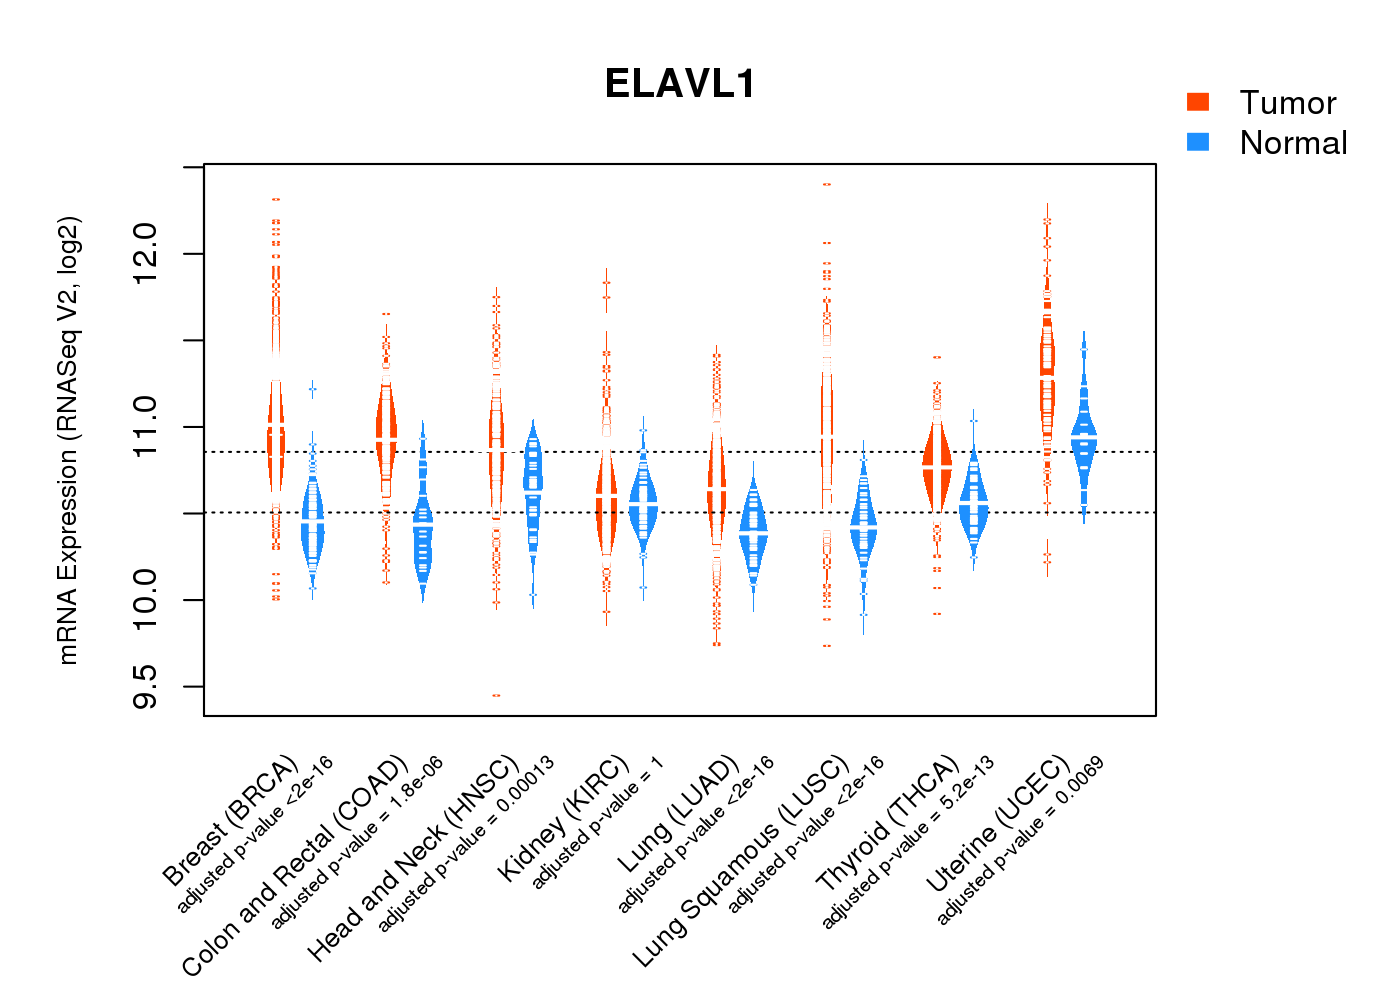
| * Normalized gene expression data of RNASeqV2 was extracted from TCGA using R package TCGA-Assembler. The URLs of all public data files on TCGA DCC data server were gathered at Jan-05-2015. Only eight cancer types have enough normal control samples for differential expression analysis. (t test, adjusted p<0.05 (using Benjamini-Hochberg FDR)) |
 |
| Top |
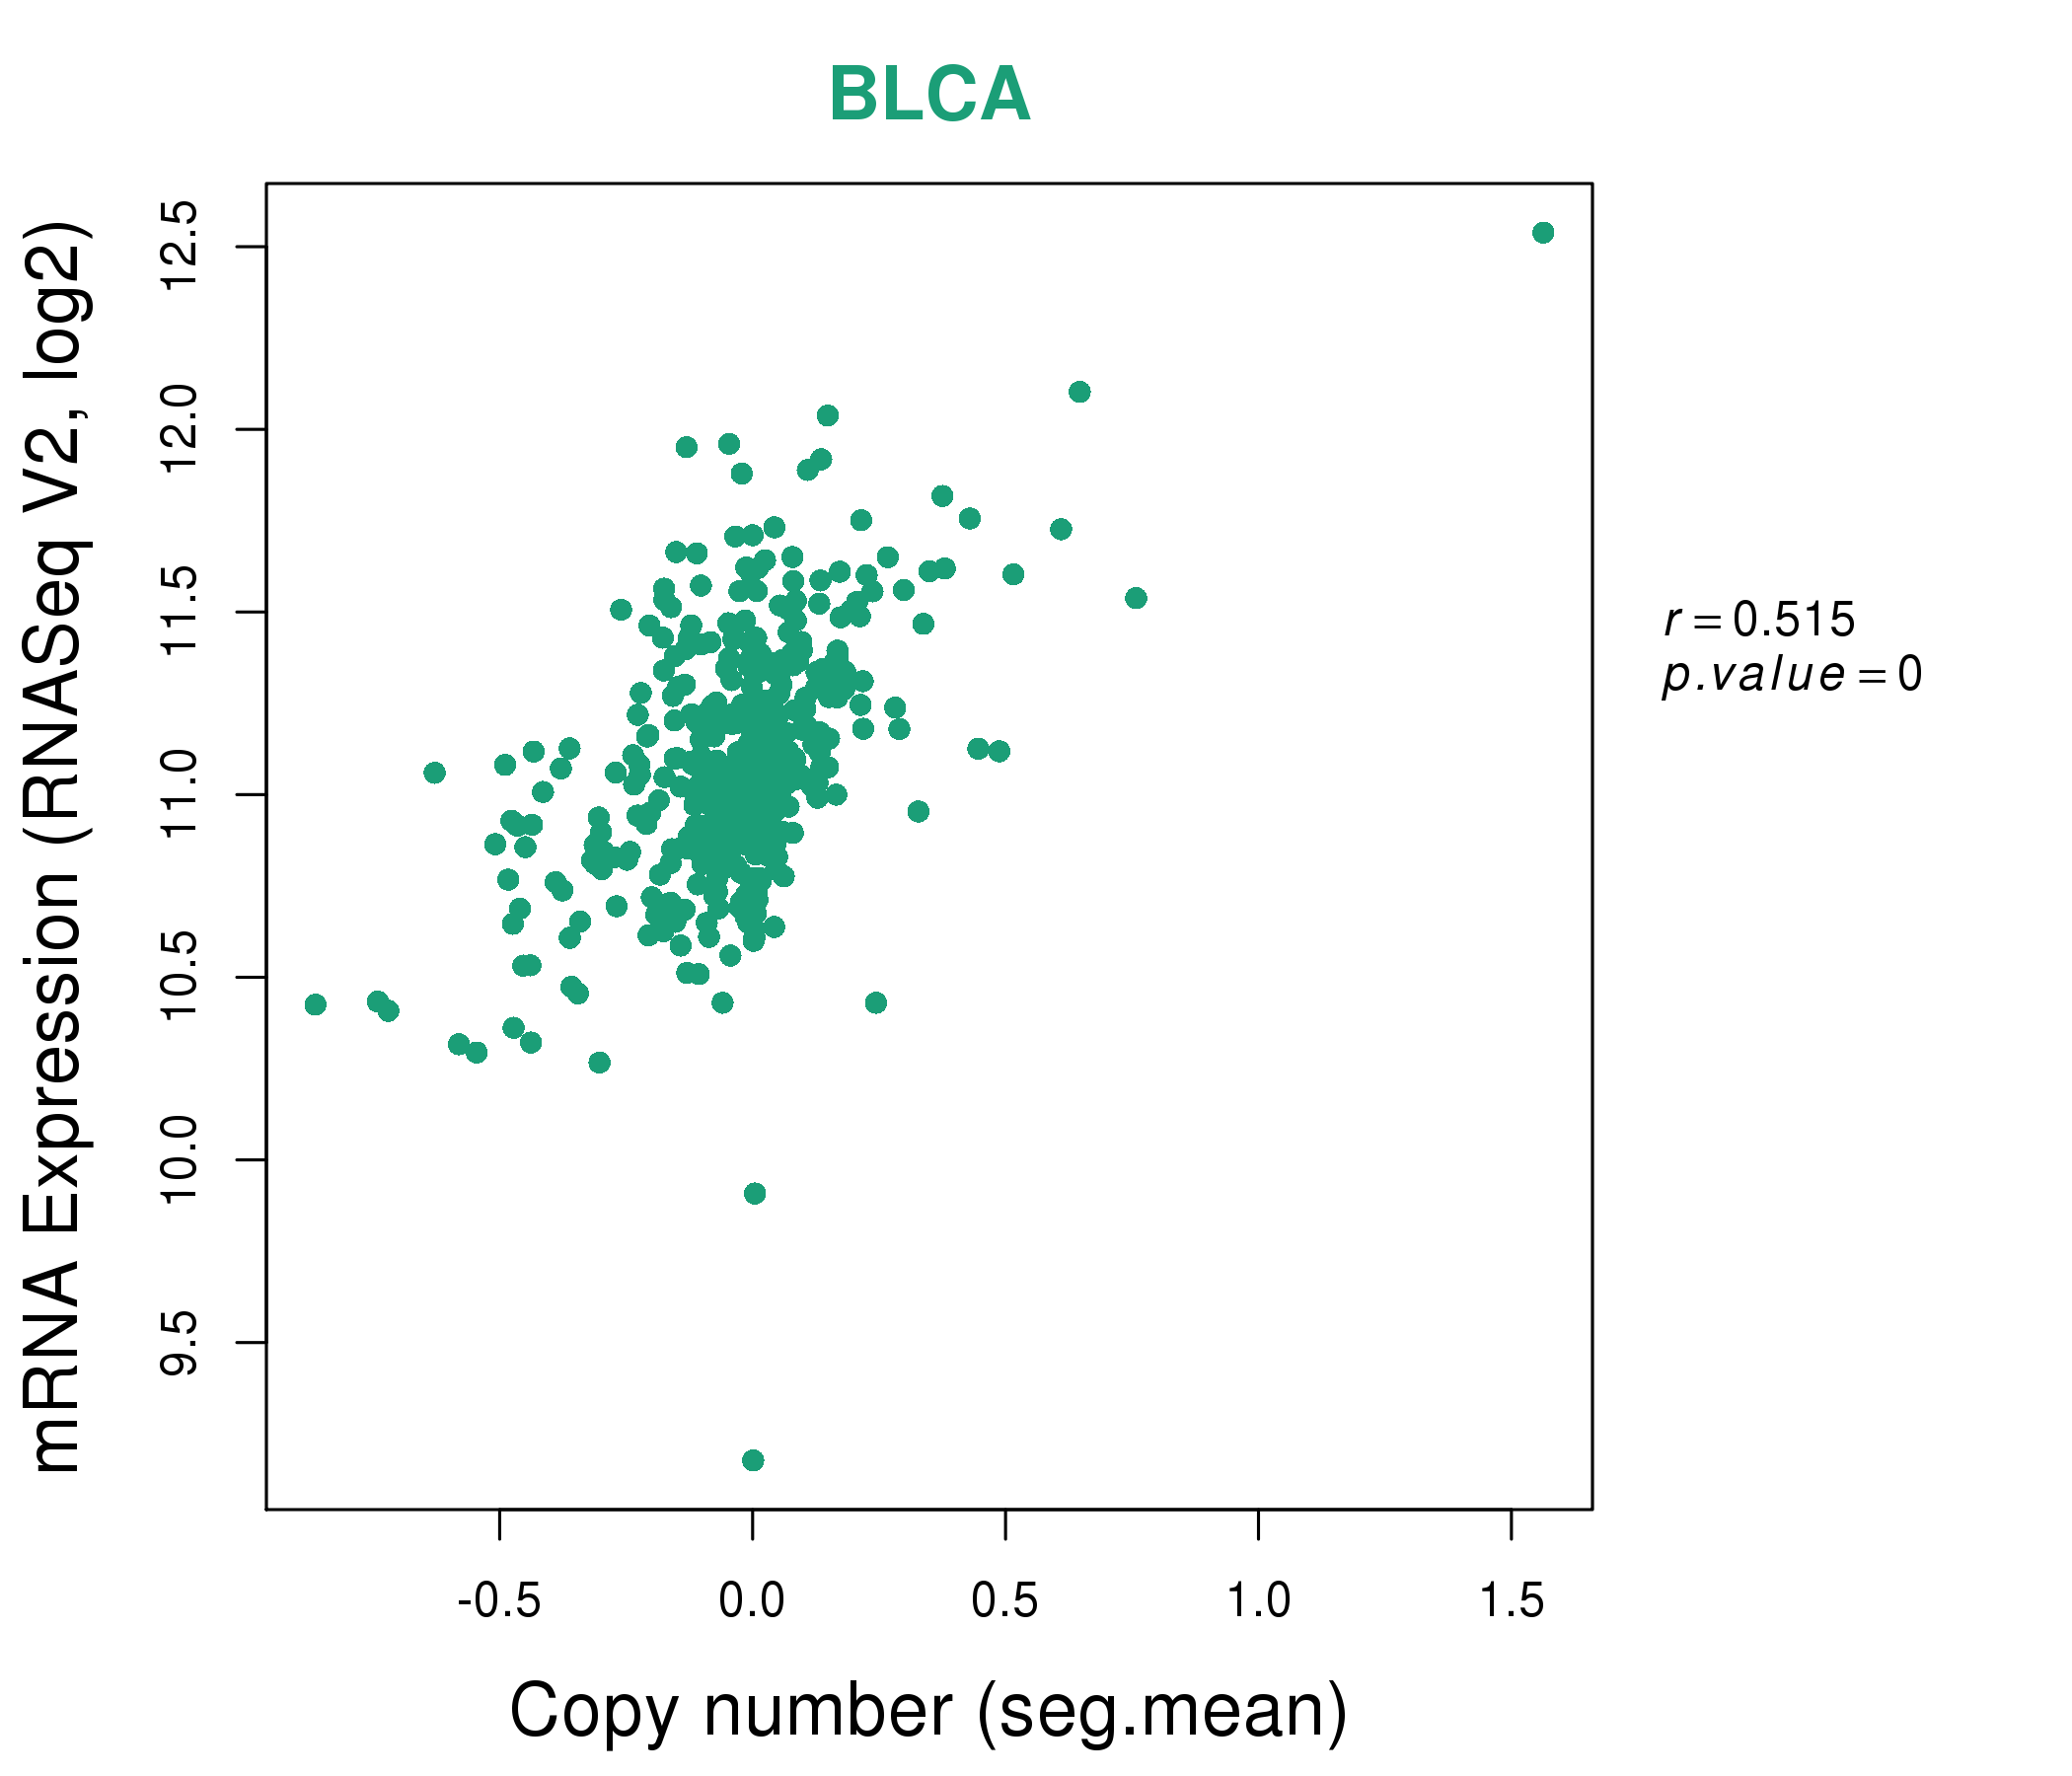
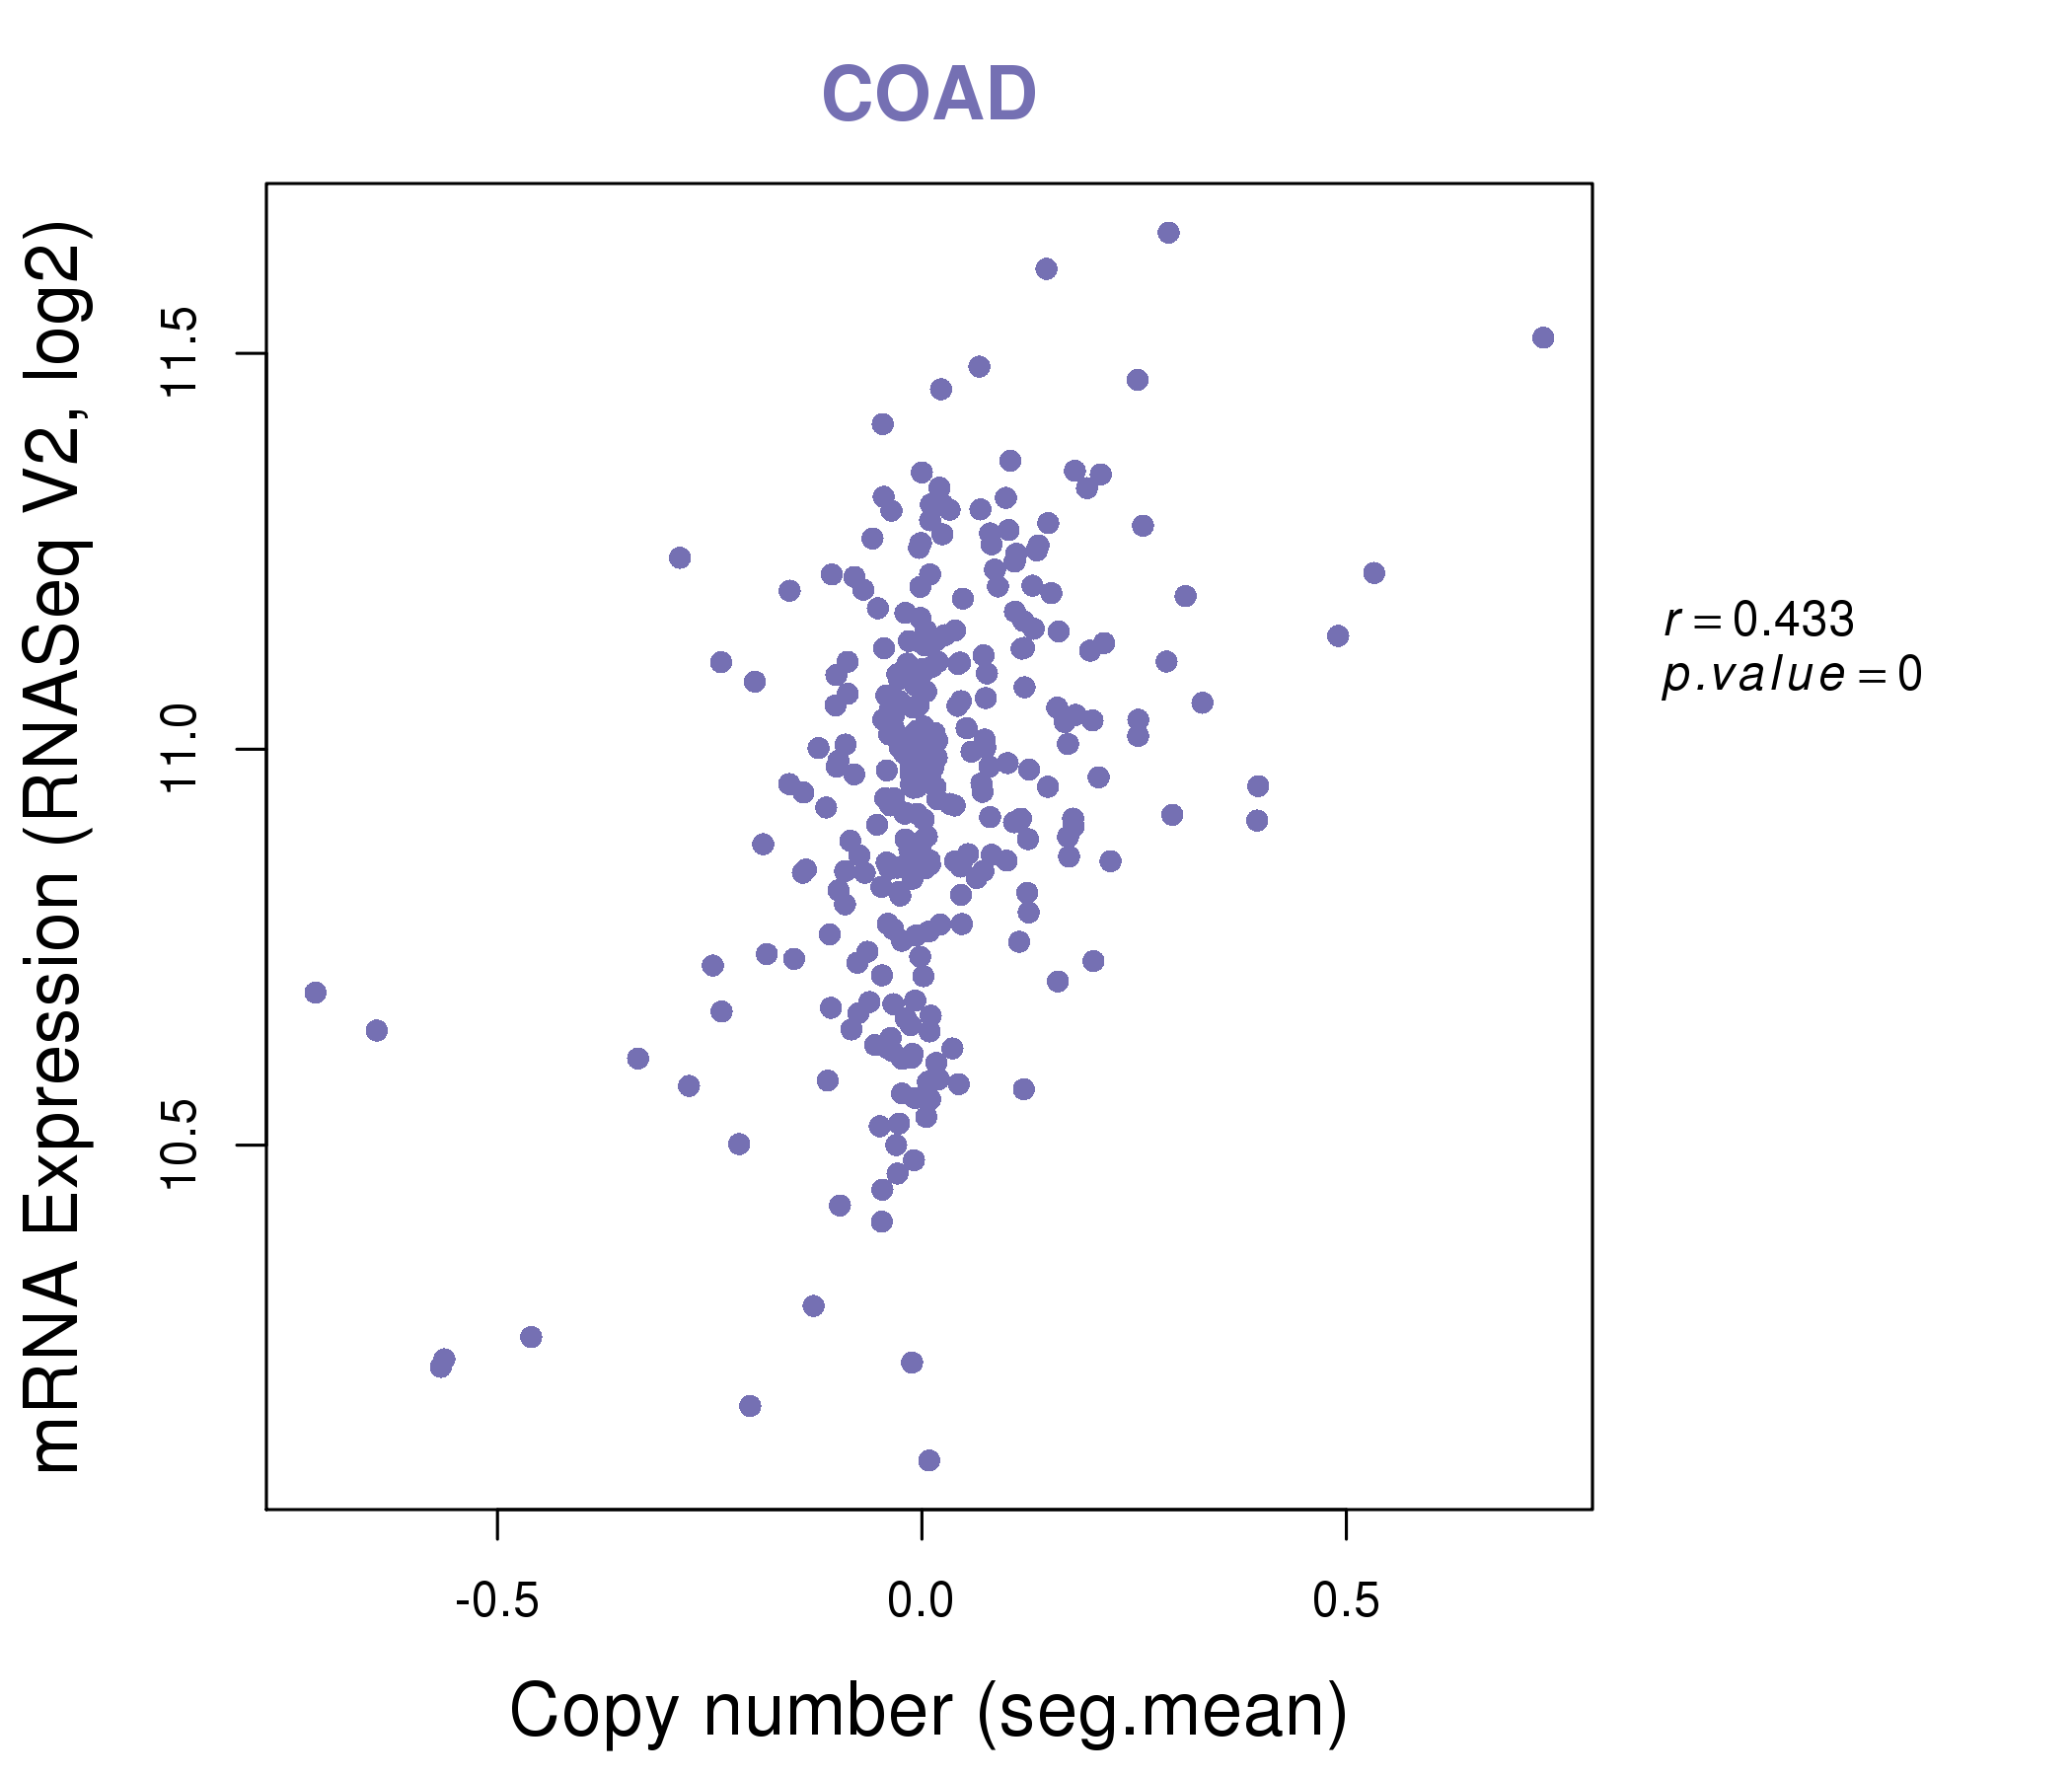
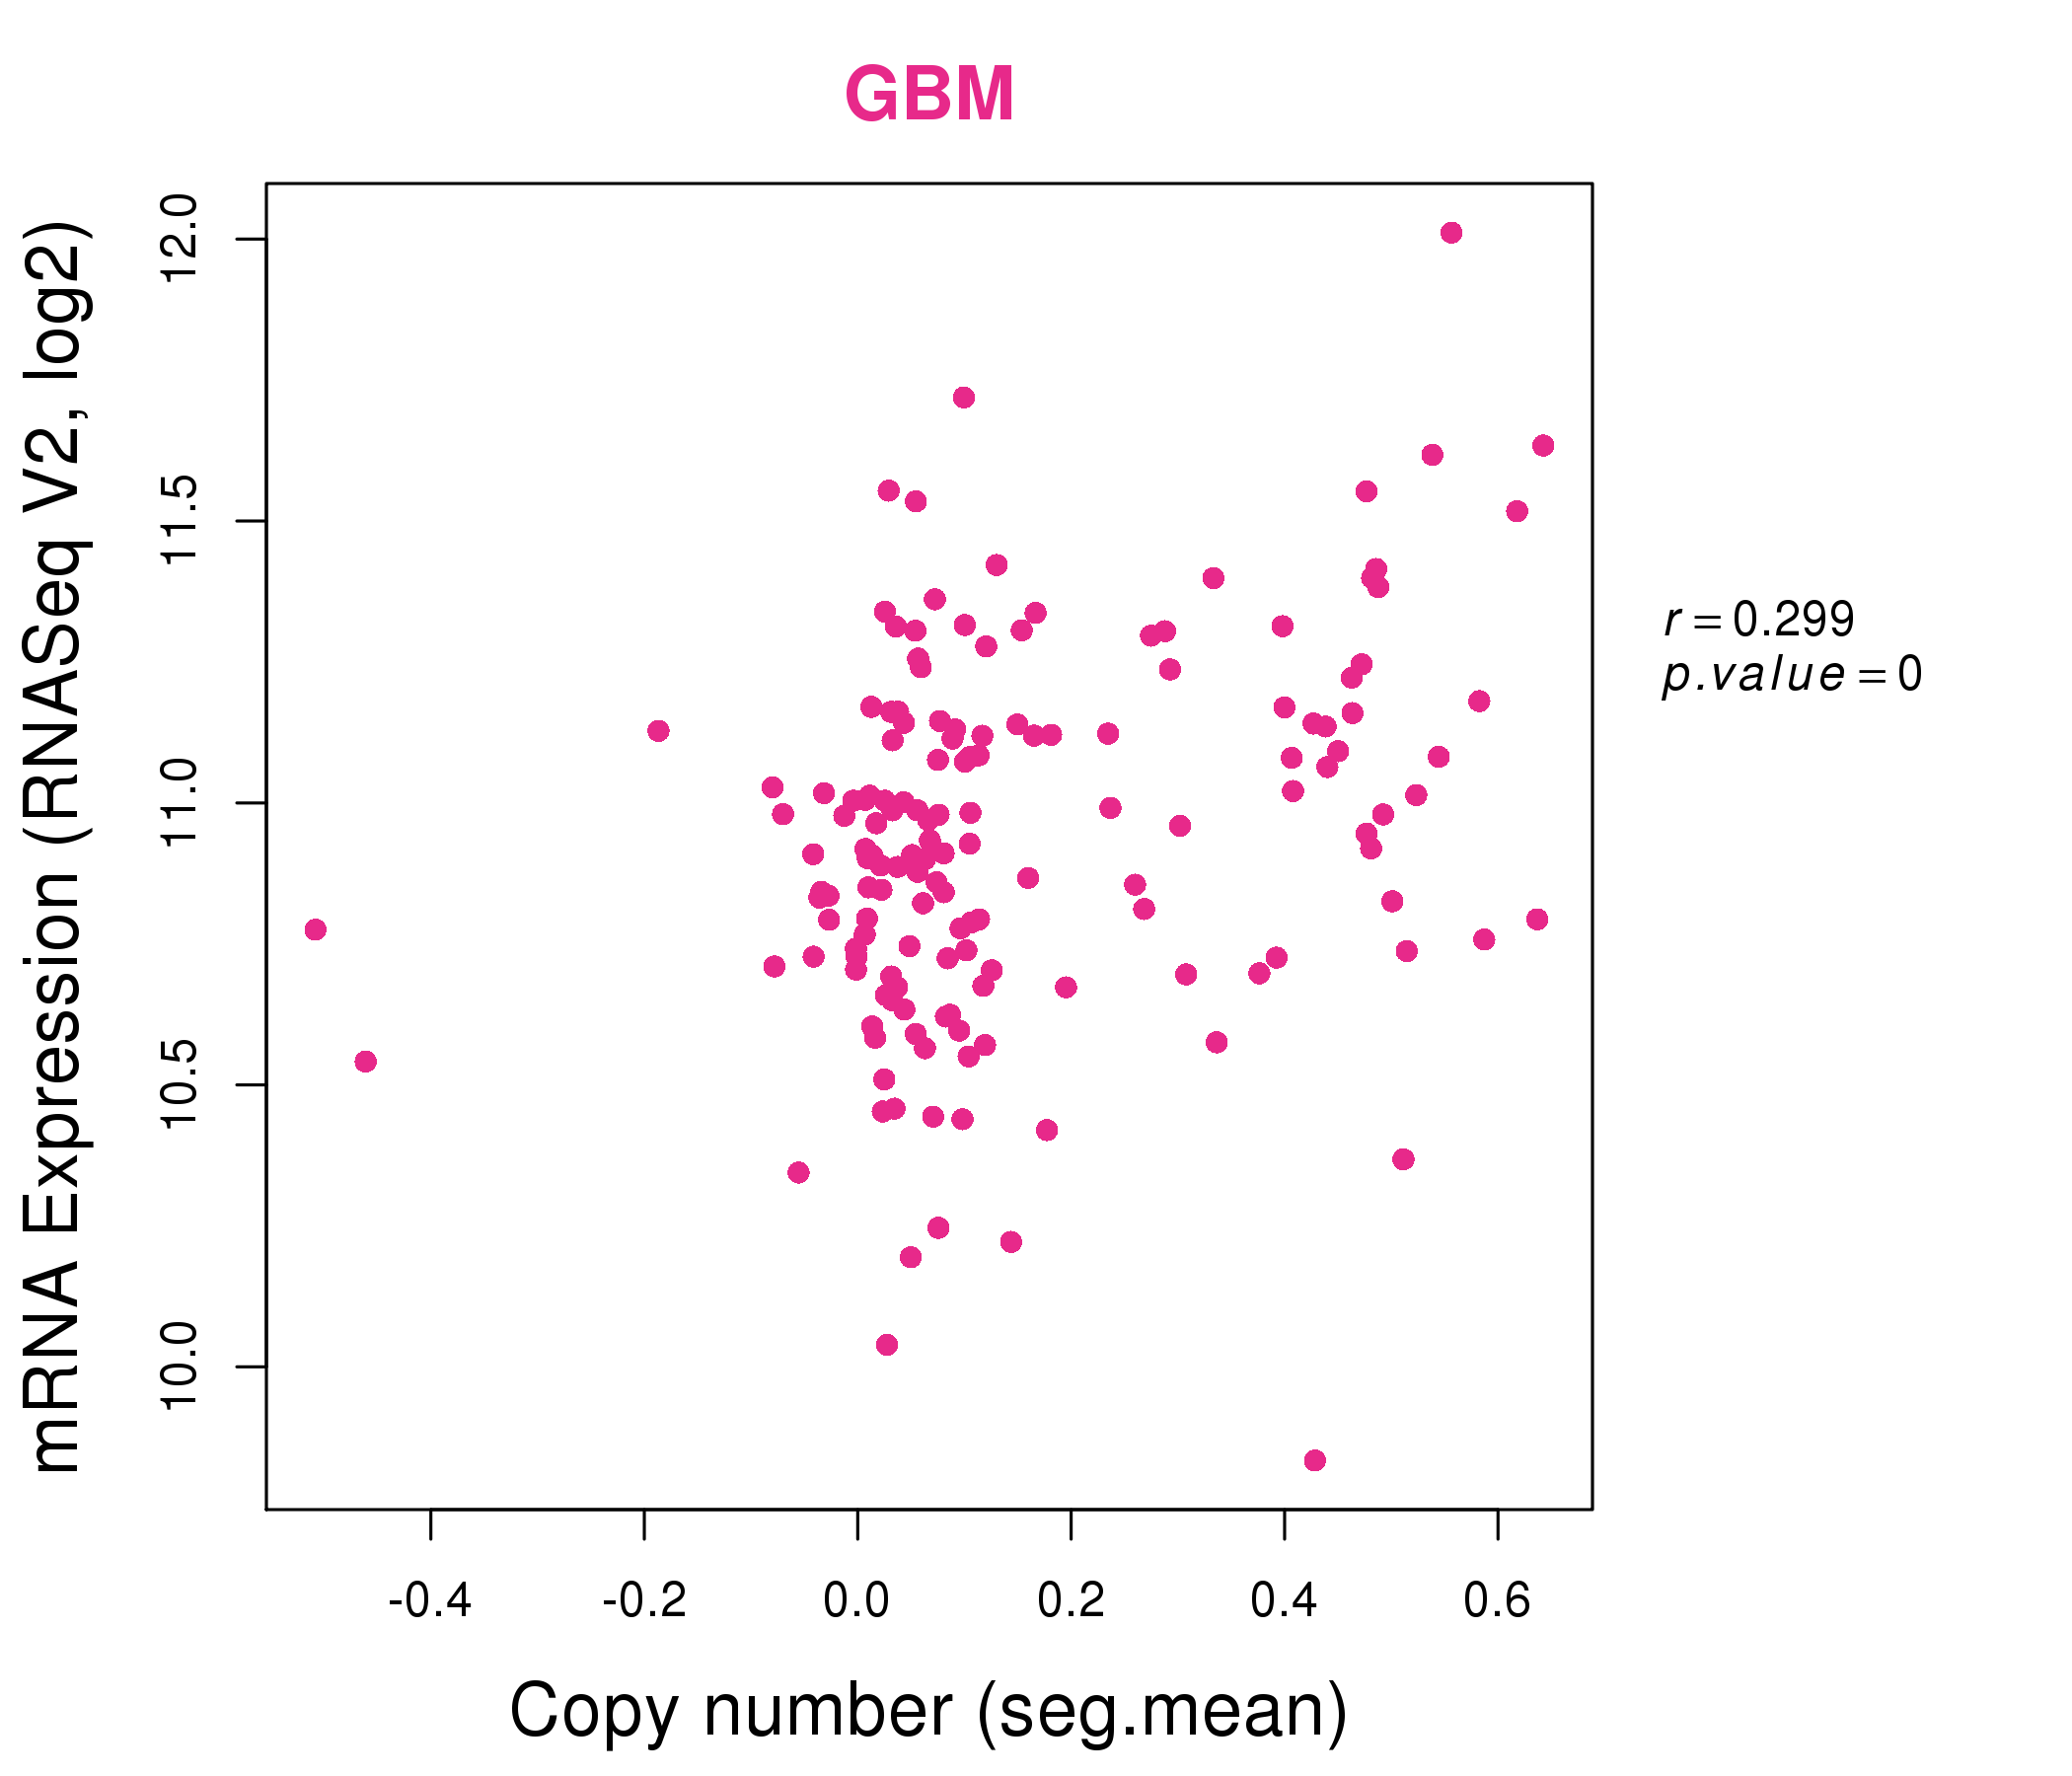
| * This plots show the correlation between CNV and gene expression. |
: Open all plots for all cancer types
 |
|
 |
|

| Top |
| Gene-Gene Network Information |
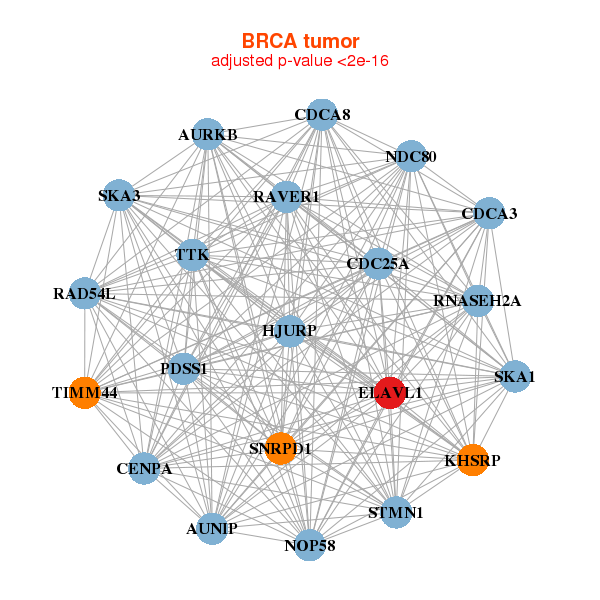
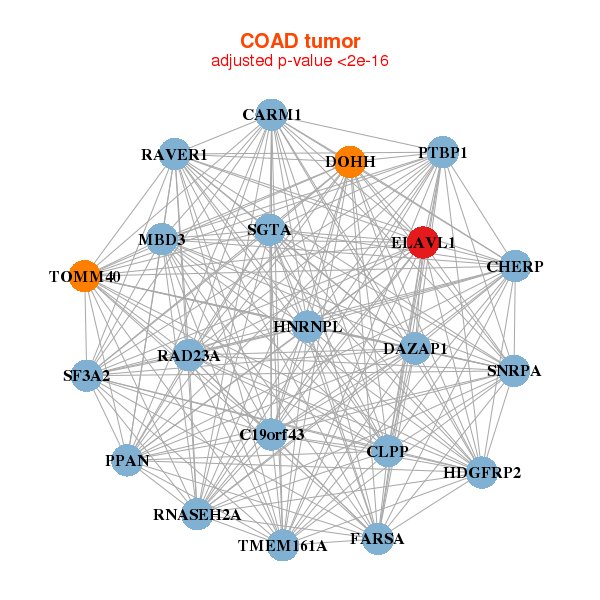
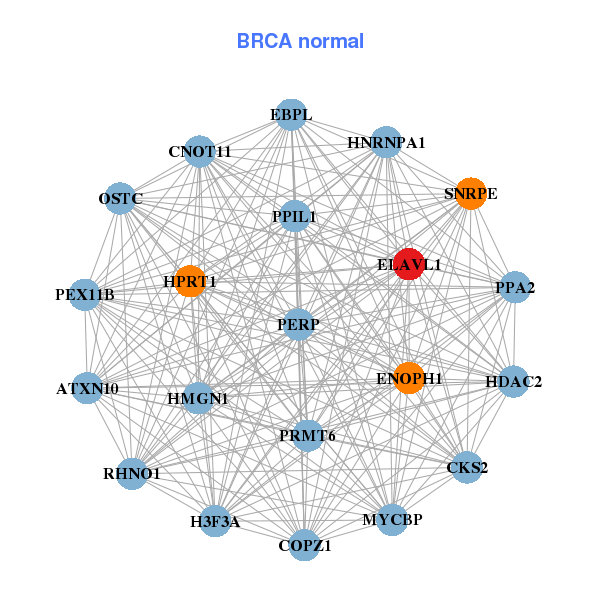
| * Co-Expression network figures were drawn using R package igraph. Only the top 20 genes with the highest correlations were shown. Red circle: input gene, orange circle: cell metabolism gene, sky circle: other gene |
: Open all plots for all cancer types
 |
|
| AURKB,AUNIP,CDC25A,CDCA3,CDCA8,CENPA,ELAVL1, HJURP,KHSRP,NDC80,NOP58,PDSS1,RAD54L,RAVER1, RNASEH2A,SKA1,SKA3,SNRPD1,STMN1,TIMM44,TTK | ATXN10,RHNO1,CNOT11,CKS2,COPZ1,EBPL,ELAVL1, ENOPH1,H3F3A,HDAC2,HMGN1,HNRNPA1,HPRT1,MYCBP, OSTC,PERP,PEX11B,PPA2,PPIL1,PRMT6,SNRPE |
 |
|
| C19orf43,CARM1,CHERP,CLPP,DAZAP1,DOHH,ELAVL1, FARSA,HDGFRP2,HNRNPL,MBD3,PPAN,PTBP1,RAD23A, RAVER1,RNASEH2A,SF3A2,SGTA,SNRPA,TMEM161A,TOMM40 | BMS1,DHX9,DOHH,EIF3B,EIF4G1,ELAVL1,GSPT1, HNRNPM,HNRNPU,KHSRP,NOC2L,RANGAP1,RBM14,SAFB, SF3B3,SFPQ,SLC7A1,SRRT,SYNCRIP,TMEM201,VARS |
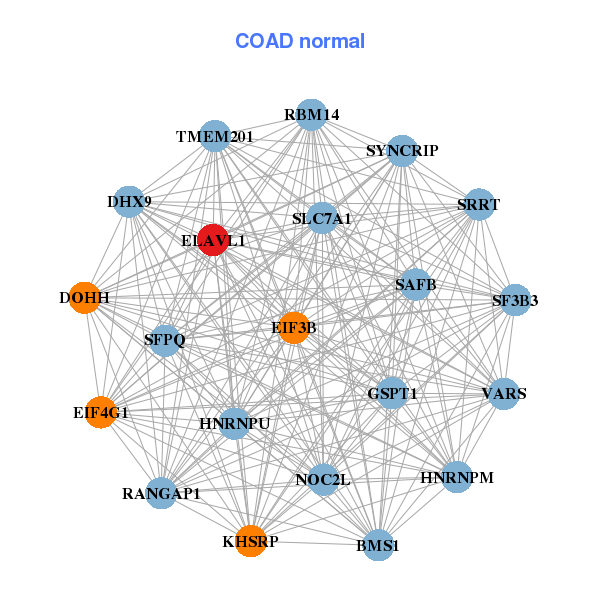
| * Co-Expression network figures were drawn using R package igraph. Only the top 20 genes with the highest correlations were shown. Red circle: input gene, orange circle: cell metabolism gene, sky circle: other gene |
: Open all plots for all cancer types
| Top |
: Open all interacting genes' information including KEGG pathway for all interacting genes from DAVID
| Top |
| Pharmacological Information for ELAVL1 |
| There's no related Drug. |
| Top |
| Cross referenced IDs for ELAVL1 |
| * We obtained these cross-references from Uniprot database. It covers 150 different DBs, 18 categories. http://www.uniprot.org/help/cross_references_section |
: Open all cross reference information
|
Copyright © 2016-Present - The Univsersity of Texas Health Science Center at Houston @ |