|
||||||||||||||||||||||||||||||||||||||||||||||||||||||||||||||||||||||||||||||||||||||||||||||||||||||||||||||||||||||||||||||||||||||||||||||||||||||||||||||||||||||||||||||||||||||||||||||||||||||||||||||||||||||||||||||||||||||||||||||||||||||||||||||||||||||||||||||||||||||||||||||||||||||||||||||||||||||||||
| |
| Phenotypic Information (metabolism pathway, cancer, disease, phenome) |
| |
| |
| Gene-Gene Network Information: Co-Expression Network, Interacting Genes & KEGG |
| |
|


| Gene Summary for ALG14 |
| Basic gene info. | Gene symbol | ALG14 |
| Gene name | ALG14, UDP-N-acetylglucosaminyltransferase subunit | |
| Synonyms | - | |
| Cytomap | UCSC genome browser: 1p21.3 | |
| Genomic location | chr1 :95448278-95538507 | |
| Type of gene | protein-coding | |
| RefGenes | NM_144988.3, | |
| Ensembl id | ENSG00000172339 | |
| Description | UDP-N-acetylglucosamine transferase subunit ALG14 homolog | |
| Modification date | 20141207 | |
| dbXrefs | MIM : 612866 | |
| HGNC : HGNC | ||
| HPRD : 14466 | ||
| Protein | UniProt: Q96F25 go to UniProt's Cross Reference DB Table | |
| Expression | CleanEX: HS_ALG14 | |
| BioGPS: 199857 | ||
| Gene Expression Atlas: ENSG00000172339 | ||
| The Human Protein Atlas: ENSG00000172339 | ||
| Pathway | NCI Pathway Interaction Database: ALG14 | |
| KEGG: ALG14 | ||
| REACTOME: ALG14 | ||
| ConsensusPathDB | ||
| Pathway Commons: ALG14 | ||
| Metabolism | MetaCyc: ALG14 | |
| HUMANCyc: ALG14 | ||
| Regulation | Ensembl's Regulation: ENSG00000172339 | |
| miRBase: chr1 :95,448,278-95,538,507 | ||
| TargetScan: NM_144988 | ||
| cisRED: ENSG00000172339 | ||
| Context | iHOP: ALG14 | |
| cancer metabolism search in PubMed: ALG14 | ||
| UCL Cancer Institute: ALG14 | ||
| Assigned class in ccmGDB | B - This gene belongs to cancer gene. | |
| Top |
| Phenotypic Information for ALG14(metabolism pathway, cancer, disease, phenome) |
| Cancer | CGAP: ALG14 |
| Familial Cancer Database: ALG14 | |
| * This gene is included in those cancer gene databases. |
|
|
|
|
|
|
| ||||||||||||||||||||||||||||||||||||||||||||||||||||||||||||||||||||||||||||||||||||||||||||||||||||||||||||||||||||||||||||||||||||||||||||||||||||||||||||||||||||||||||||||||||||||||||||||||||||||||||||||||||||||||||||||||||||||||||||||||||||||||||||||||||||||||||||||||||||||||||||||||||||||||||||||||||||
Oncogene 1 | Significant driver gene in | |||||||||||||||||||||||||||||||||||||||||||||||||||||||||||||||||||||||||||||||||||||||||||||||||||||||||||||||||||||||||||||||||||||||||||||||||||||||||||||||||||||||||||||||||||||||||||||||||||||||||||||||||||||||||||||||||||||||||||||||||||||||||||||||||||||||||||||||||||||||||||||||||||||||||||||||||||||||||
| cf) number; DB name 1 Oncogene; http://nar.oxfordjournals.org/content/35/suppl_1/D721.long, 2 Tumor Suppressor gene; https://bioinfo.uth.edu/TSGene/, 3 Cancer Gene Census; http://www.nature.com/nrc/journal/v4/n3/abs/nrc1299.html, 4 CancerGenes; http://nar.oxfordjournals.org/content/35/suppl_1/D721.long, 5 Network of Cancer Gene; http://ncg.kcl.ac.uk/index.php, 1Therapeutic Vulnerabilities in Cancer; http://cbio.mskcc.org/cancergenomics/statius/ |
| REACTOME_METABOLISM_OF_PROTEINS | |
| OMIM | 612866; gene. |
| Orphanet | 353327; Congenital myasthenic syndromes with glycosylation defect. |
| Disease | KEGG Disease: ALG14 |
| MedGen: ALG14 (Human Medical Genetics with Condition) | |
| ClinVar: ALG14 | |
| Phenotype | MGI: ALG14 (International Mouse Phenotyping Consortium) |
| PhenomicDB: ALG14 | |
| Mutations for ALG14 |
| * Under tables are showing count per each tissue to give us broad intuition about tissue specific mutation patterns.You can go to the detailed page for each mutation database's web site. |
| - Statistics for Tissue and Mutation type | Top |
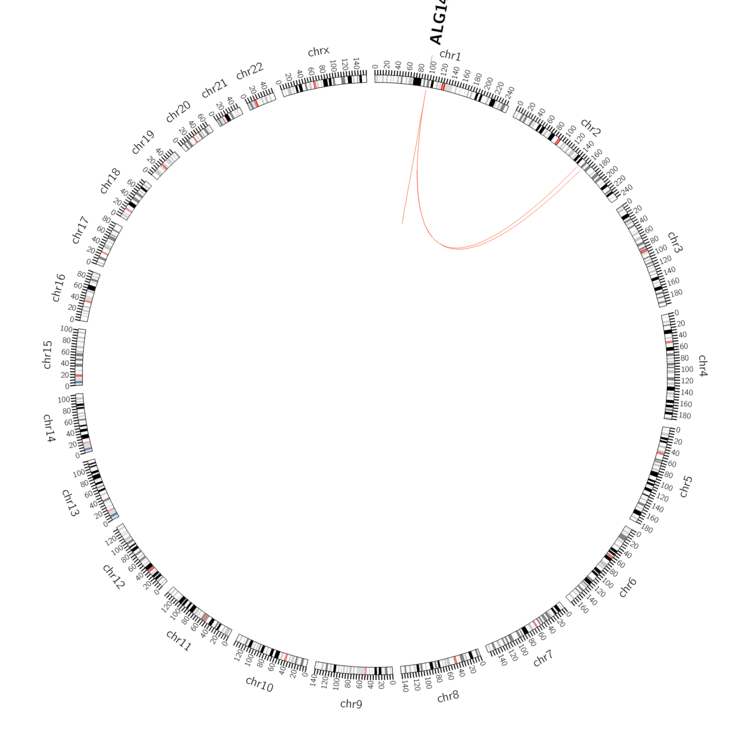 |
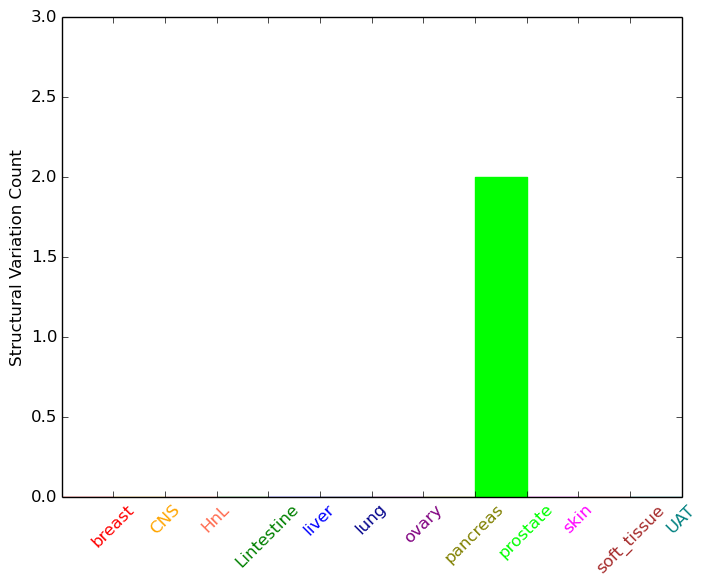
| - For Inter-chromosomal Variations |
| * Inter-chromosomal variantions includes 'interchromosomal amplicon to amplicon', 'interchromosomal amplicon to non-amplified dna', 'interchromosomal insertion', 'Interchromosomal unknown type'. |
 |
| - For Intra-chromosomal Variations |
| * Intra-chromosomal variantions includes 'intrachromosomal amplicon to amplicon', 'intrachromosomal amplicon to non-amplified dna', 'intrachromosomal deletion', 'intrachromosomal fold-back inversion', 'intrachromosomal inversion', 'intrachromosomal tandem duplication', 'Intrachromosomal unknown type', 'intrachromosomal with inverted orientation', 'intrachromosomal with non-inverted orientation'. |
 |
| Sample | Symbol_a | Chr_a | Start_a | End_a | Symbol_b | Chr_b | Start_b | End_b |
| haematopoietic_and_lymphoid_tissue | ALG14 | chr1 | 95474122 | 95474122 | ALG14 | chr1 | 95474122 | 95474122 |
| prostate | ALG14 | chr1 | 95506321 | 95508321 | chr2 | 159585322 | 159587322 |
| cf) Tissue number; Tissue name (1;Breast, 2;Central_nervous_system, 3;Haematopoietic_and_lymphoid_tissue, 4;Large_intestine, 5;Liver, 6;Lung, 7;Ovary, 8;Pancreas, 9;Prostate, 10;Skin, 11;Soft_tissue, 12;Upper_aerodigestive_tract) |
| * From mRNA Sanger sequences, Chitars2.0 arranged chimeric transcripts. This table shows ALG14 related fusion information. |
| ID | Head Gene | Tail Gene | Accession | Gene_a | qStart_a | qEnd_a | Chromosome_a | tStart_a | tEnd_a | Gene_a | qStart_a | qEnd_a | Chromosome_a | tStart_a | tEnd_a |
| DA767890 | ALG14 | 1 | 308 | 1 | 95530421 | 95538473 | LOC158435 | 307 | 719 | 9 | 98855307 | 98857548 | |
| Top |
| Mutation type/ Tissue ID | brca | cns | cerv | endome | haematopo | kidn | Lintest | liver | lung | ns | ovary | pancre | prost | skin | stoma | thyro | urina | |||
| Total # sample | 1 | |||||||||||||||||||
| GAIN (# sample) | 1 | |||||||||||||||||||
| LOSS (# sample) |
| cf) Tissue ID; Tissue type (1; Breast, 2; Central_nervous_system, 3; Cervix, 4; Endometrium, 5; Haematopoietic_and_lymphoid_tissue, 6; Kidney, 7; Large_intestine, 8; Liver, 9; Lung, 10; NS, 11; Ovary, 12; Pancreas, 13; Prostate, 14; Skin, 15; Stomach, 16; Thyroid, 17; Urinary_tract) |
| Top |
|
 |
| Top |
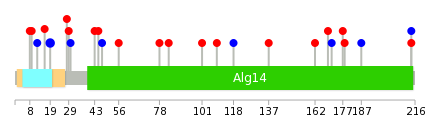
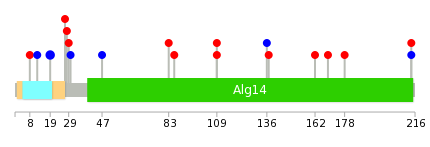
| Stat. for Non-Synonymous SNVs (# total SNVs=14) | (# total SNVs=6) |
 |  |
(# total SNVs=0) | (# total SNVs=0) |
| Top |
| * When you move the cursor on each content, you can see more deailed mutation information on the Tooltip. Those are primary_site,primary_histology,mutation(aa),pubmedID. |
| GRCh37 position | Mutation(aa) | Unique sampleID count |
| chr1:95538398-95538398 | p.I19I | 2 |
| chr1:95538365-95538365 | p.D30D | 1 |
| chr1:95492695-95492695 | p.K137T | 1 |
| chr1:95538368-95538368 | p.M29I | 1 |
| chr1:95492751-95492751 | p.T118T | 1 |
| chr1:95538372-95538372 | p.S28F | 1 |
| chr1:95492780-95492780 | p.R109W | 1 |
| chr1:95448642-95448642 | p.R214Q | 1 |
| chr1:95492803-95492803 | p.Y101C | 1 |
| chr1:95538408-95538408 | p.V16G | 1 |
| Top |
|
 |
| Point Mutation/ Tissue ID | 1 | 2 | 3 | 4 | 5 | 6 | 7 | 8 | 9 | 10 | 11 | 12 | 13 | 14 | 15 | 16 | 17 | 18 | 19 | 20 |
| # sample | 1 | 3 | 2 | 2 | 1 | 1 | 4 | 2 | 3 | |||||||||||
| # mutation | 1 | 3 | 2 | 2 | 1 | 1 | 3 | 2 | 3 | |||||||||||
| nonsynonymous SNV | 1 | 3 | 1 | 2 | 2 | 1 | 2 | |||||||||||||
| synonymous SNV | 1 | 1 | 1 | 1 | 1 | 1 |
| cf) Tissue ID; Tissue type (1; BLCA[Bladder Urothelial Carcinoma], 2; BRCA[Breast invasive carcinoma], 3; CESC[Cervical squamous cell carcinoma and endocervical adenocarcinoma], 4; COAD[Colon adenocarcinoma], 5; GBM[Glioblastoma multiforme], 6; Glioma Low Grade, 7; HNSC[Head and Neck squamous cell carcinoma], 8; KICH[Kidney Chromophobe], 9; KIRC[Kidney renal clear cell carcinoma], 10; KIRP[Kidney renal papillary cell carcinoma], 11; LAML[Acute Myeloid Leukemia], 12; LUAD[Lung adenocarcinoma], 13; LUSC[Lung squamous cell carcinoma], 14; OV[Ovarian serous cystadenocarcinoma ], 15; PAAD[Pancreatic adenocarcinoma], 16; PRAD[Prostate adenocarcinoma], 17; SKCM[Skin Cutaneous Melanoma], 18:STAD[Stomach adenocarcinoma], 19:THCA[Thyroid carcinoma], 20:UCEC[Uterine Corpus Endometrial Carcinoma]) |
| Top |
| * We represented just top 10 SNVs. When you move the cursor on each content, you can see more deailed mutation information on the Tooltip. Those are primary_site, primary_histology, mutation(aa), pubmedID. |
| Genomic Position | Mutation(aa) | Unique sampleID count |
| chr1:95538398 | p.I19I | 2 |
| chr1:95538433 | p.S83Y | 1 |
| chr1:95492780 | p.G47G | 1 |
| chr1:95530454 | p.D30D | 1 |
| chr1:95530462 | p.M29I | 1 |
| chr1:95448642 | p.S28F | 1 |
| chr1:95530569 | p.R27C | 1 |
| chr1:95448643 | p.R214Q | 1 |
| chr1:95538365 | p.R214R | 1 |
| chr1:95448750 | p.G12G | 1 |
| * Copy number data were extracted from TCGA using R package TCGA-Assembler. The URLs of all public data files on TCGA DCC data server were gathered on Jan-05-2015. Function ProcessCNAData in TCGA-Assembler package was used to obtain gene-level copy number value which is calculated as the average copy number of the genomic region of a gene. |
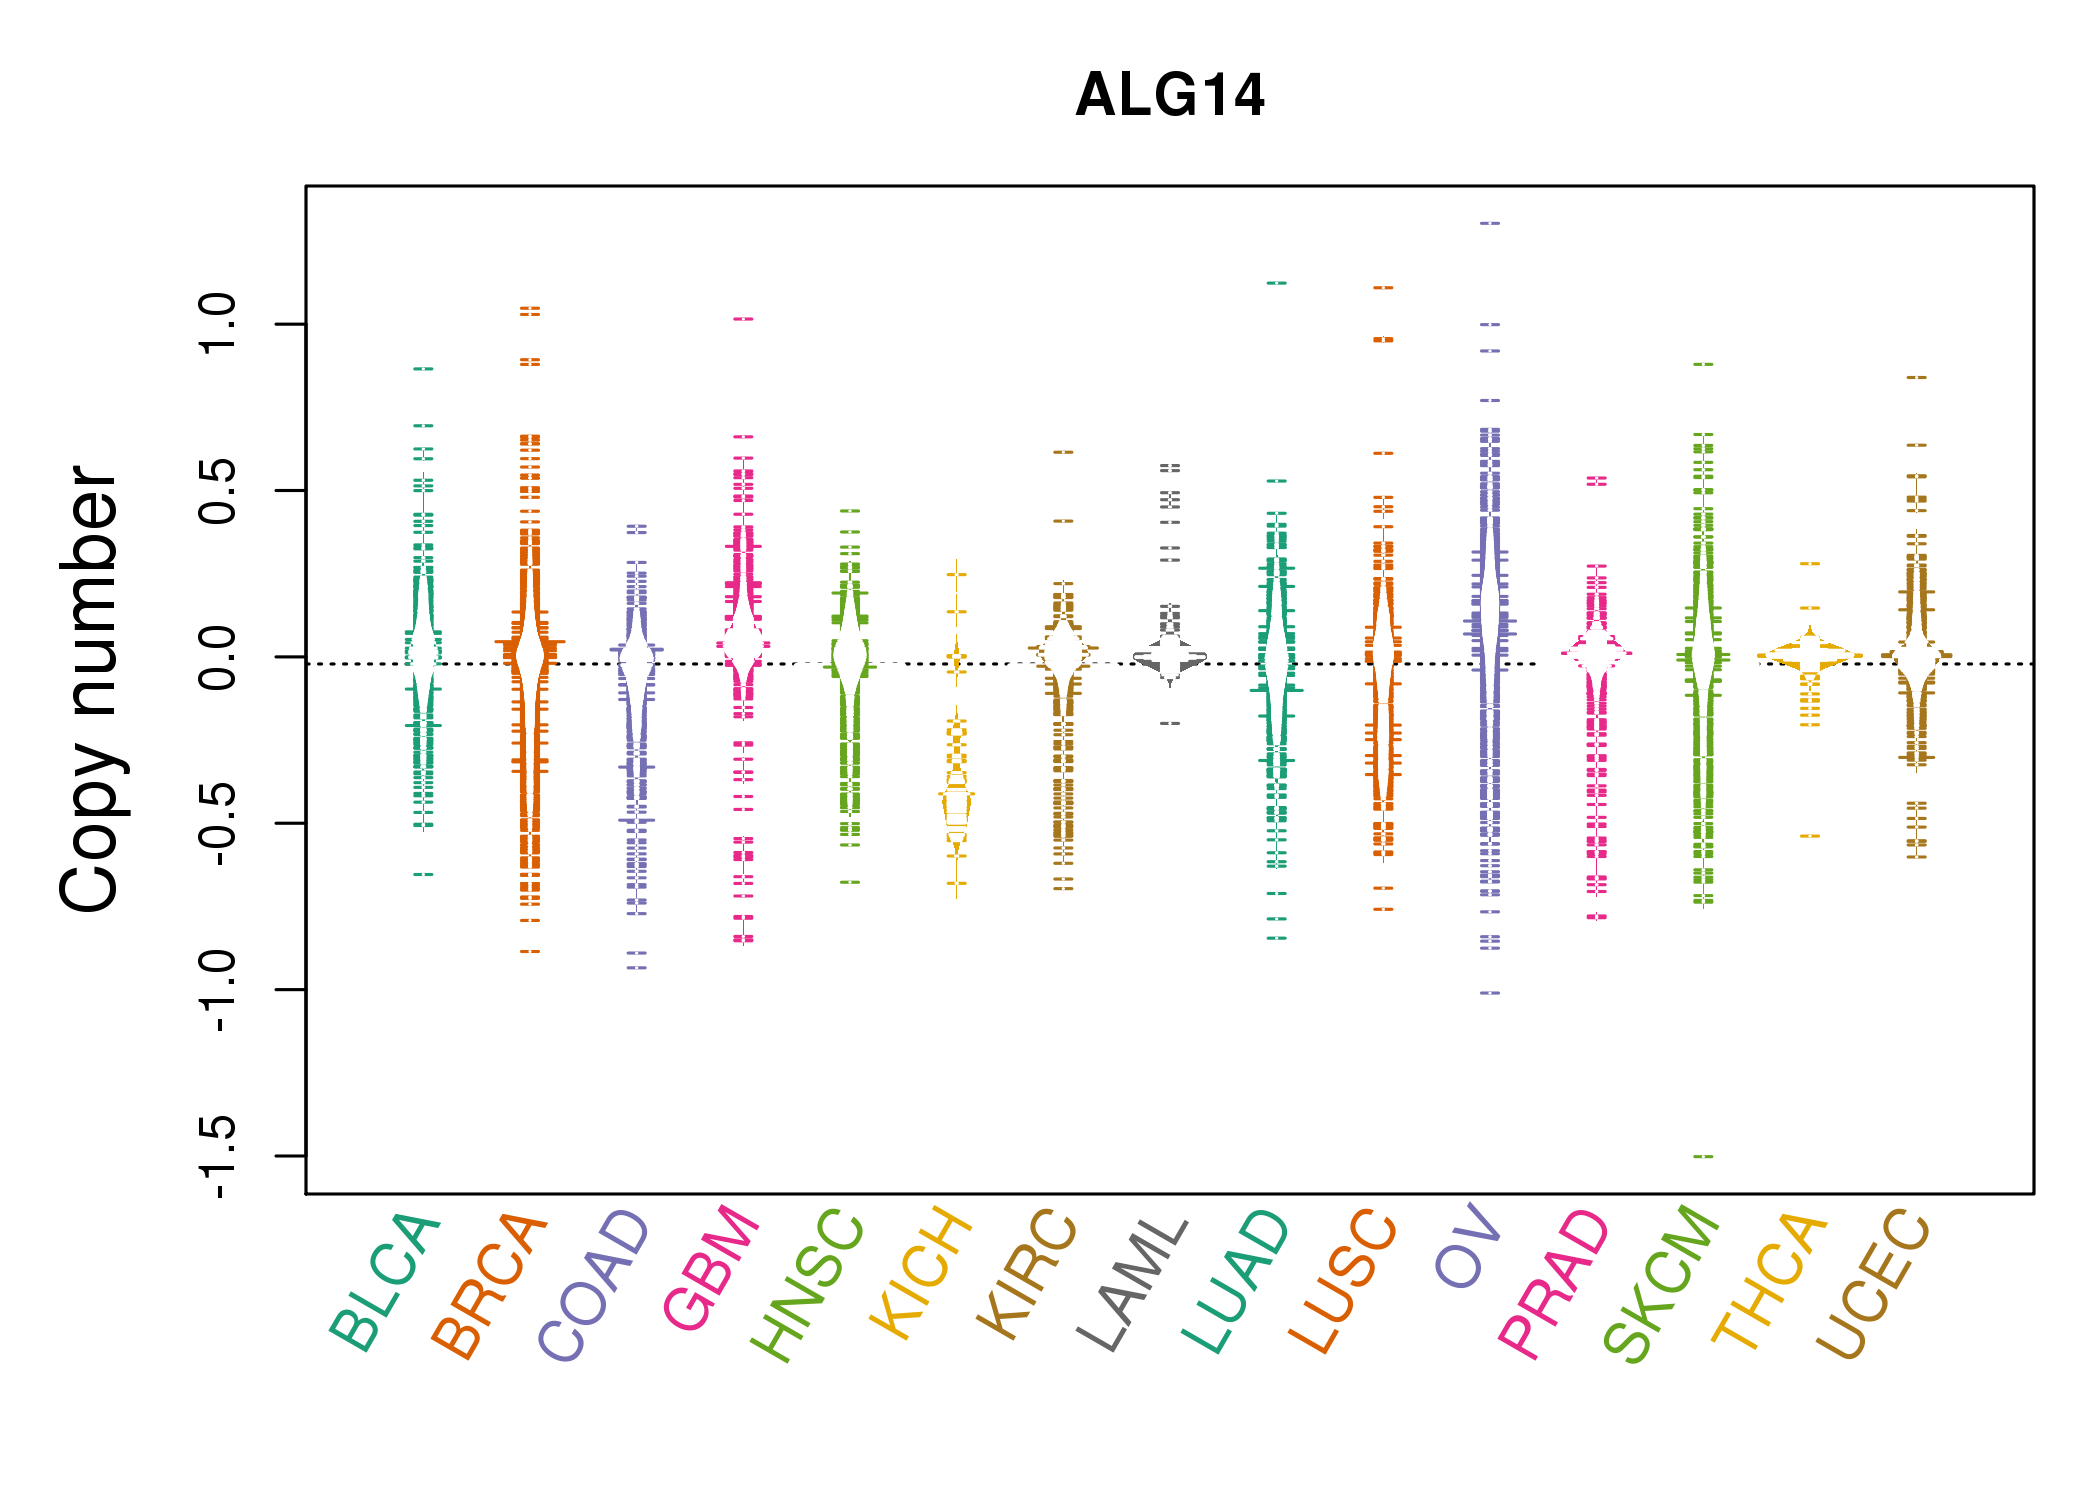 |
| cf) Tissue ID[Tissue type]: BLCA[Bladder Urothelial Carcinoma], BRCA[Breast invasive carcinoma], CESC[Cervical squamous cell carcinoma and endocervical adenocarcinoma], COAD[Colon adenocarcinoma], GBM[Glioblastoma multiforme], Glioma Low Grade, HNSC[Head and Neck squamous cell carcinoma], KICH[Kidney Chromophobe], KIRC[Kidney renal clear cell carcinoma], KIRP[Kidney renal papillary cell carcinoma], LAML[Acute Myeloid Leukemia], LUAD[Lung adenocarcinoma], LUSC[Lung squamous cell carcinoma], OV[Ovarian serous cystadenocarcinoma ], PAAD[Pancreatic adenocarcinoma], PRAD[Prostate adenocarcinoma], SKCM[Skin Cutaneous Melanoma], STAD[Stomach adenocarcinoma], THCA[Thyroid carcinoma], UCEC[Uterine Corpus Endometrial Carcinoma] |
| Top |
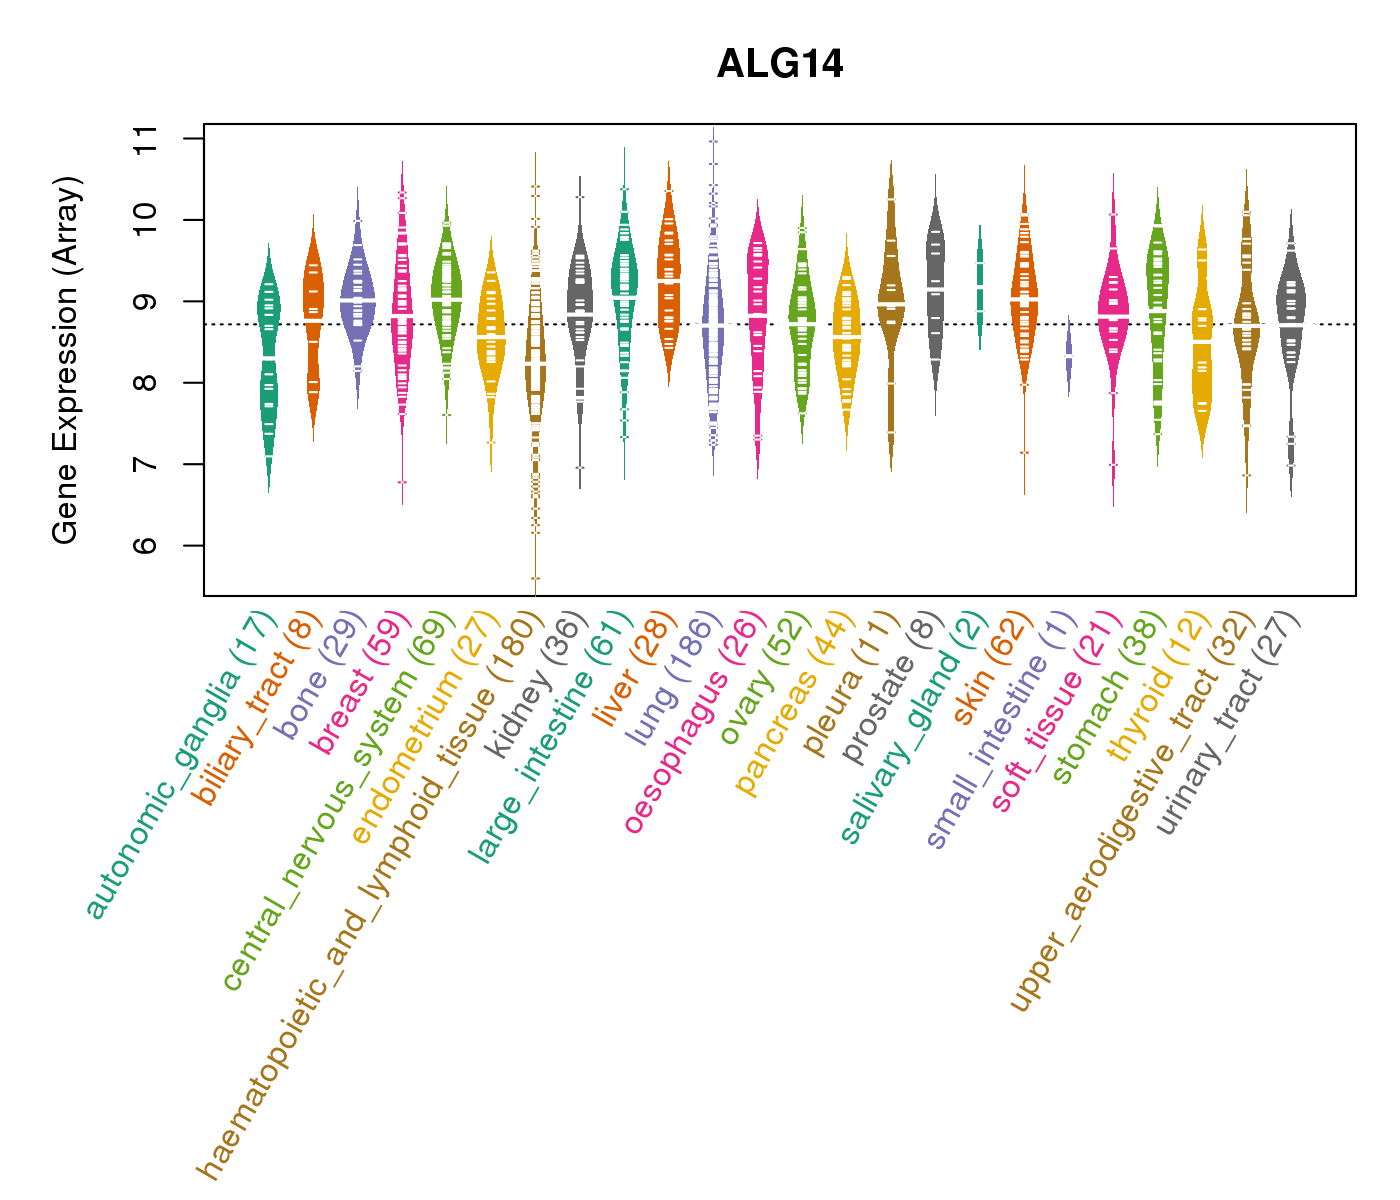
| Gene Expression for ALG14 |
| * CCLE gene expression data were extracted from CCLE_Expression_Entrez_2012-10-18.res: Gene-centric RMA-normalized mRNA expression data. |
 |
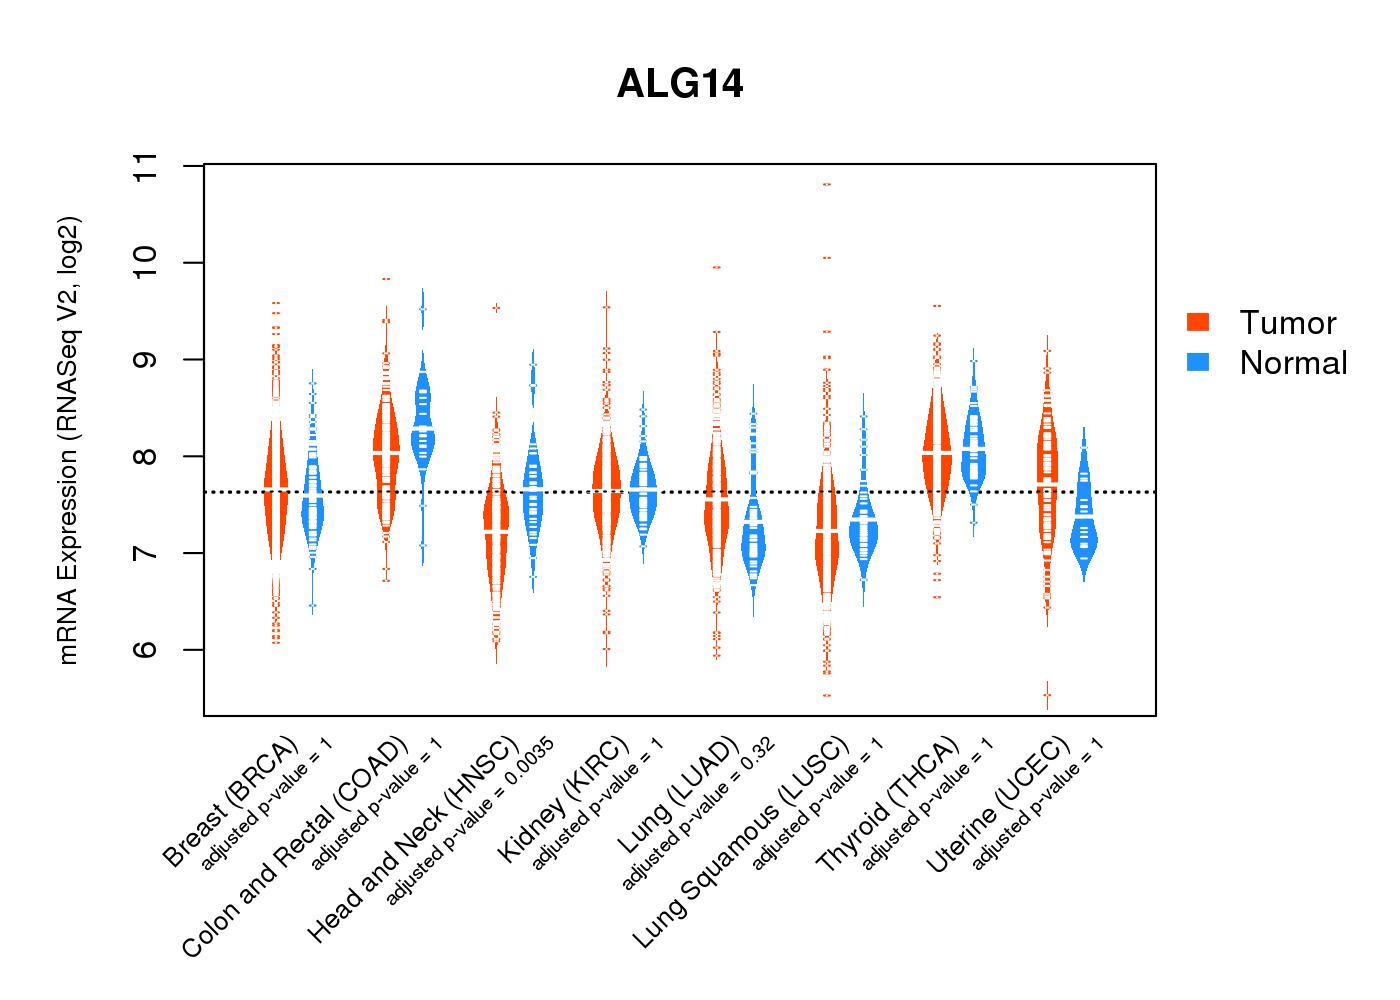
| * Normalized gene expression data of RNASeqV2 was extracted from TCGA using R package TCGA-Assembler. The URLs of all public data files on TCGA DCC data server were gathered at Jan-05-2015. Only eight cancer types have enough normal control samples for differential expression analysis. (t test, adjusted p<0.05 (using Benjamini-Hochberg FDR)) |
 |
| Top |
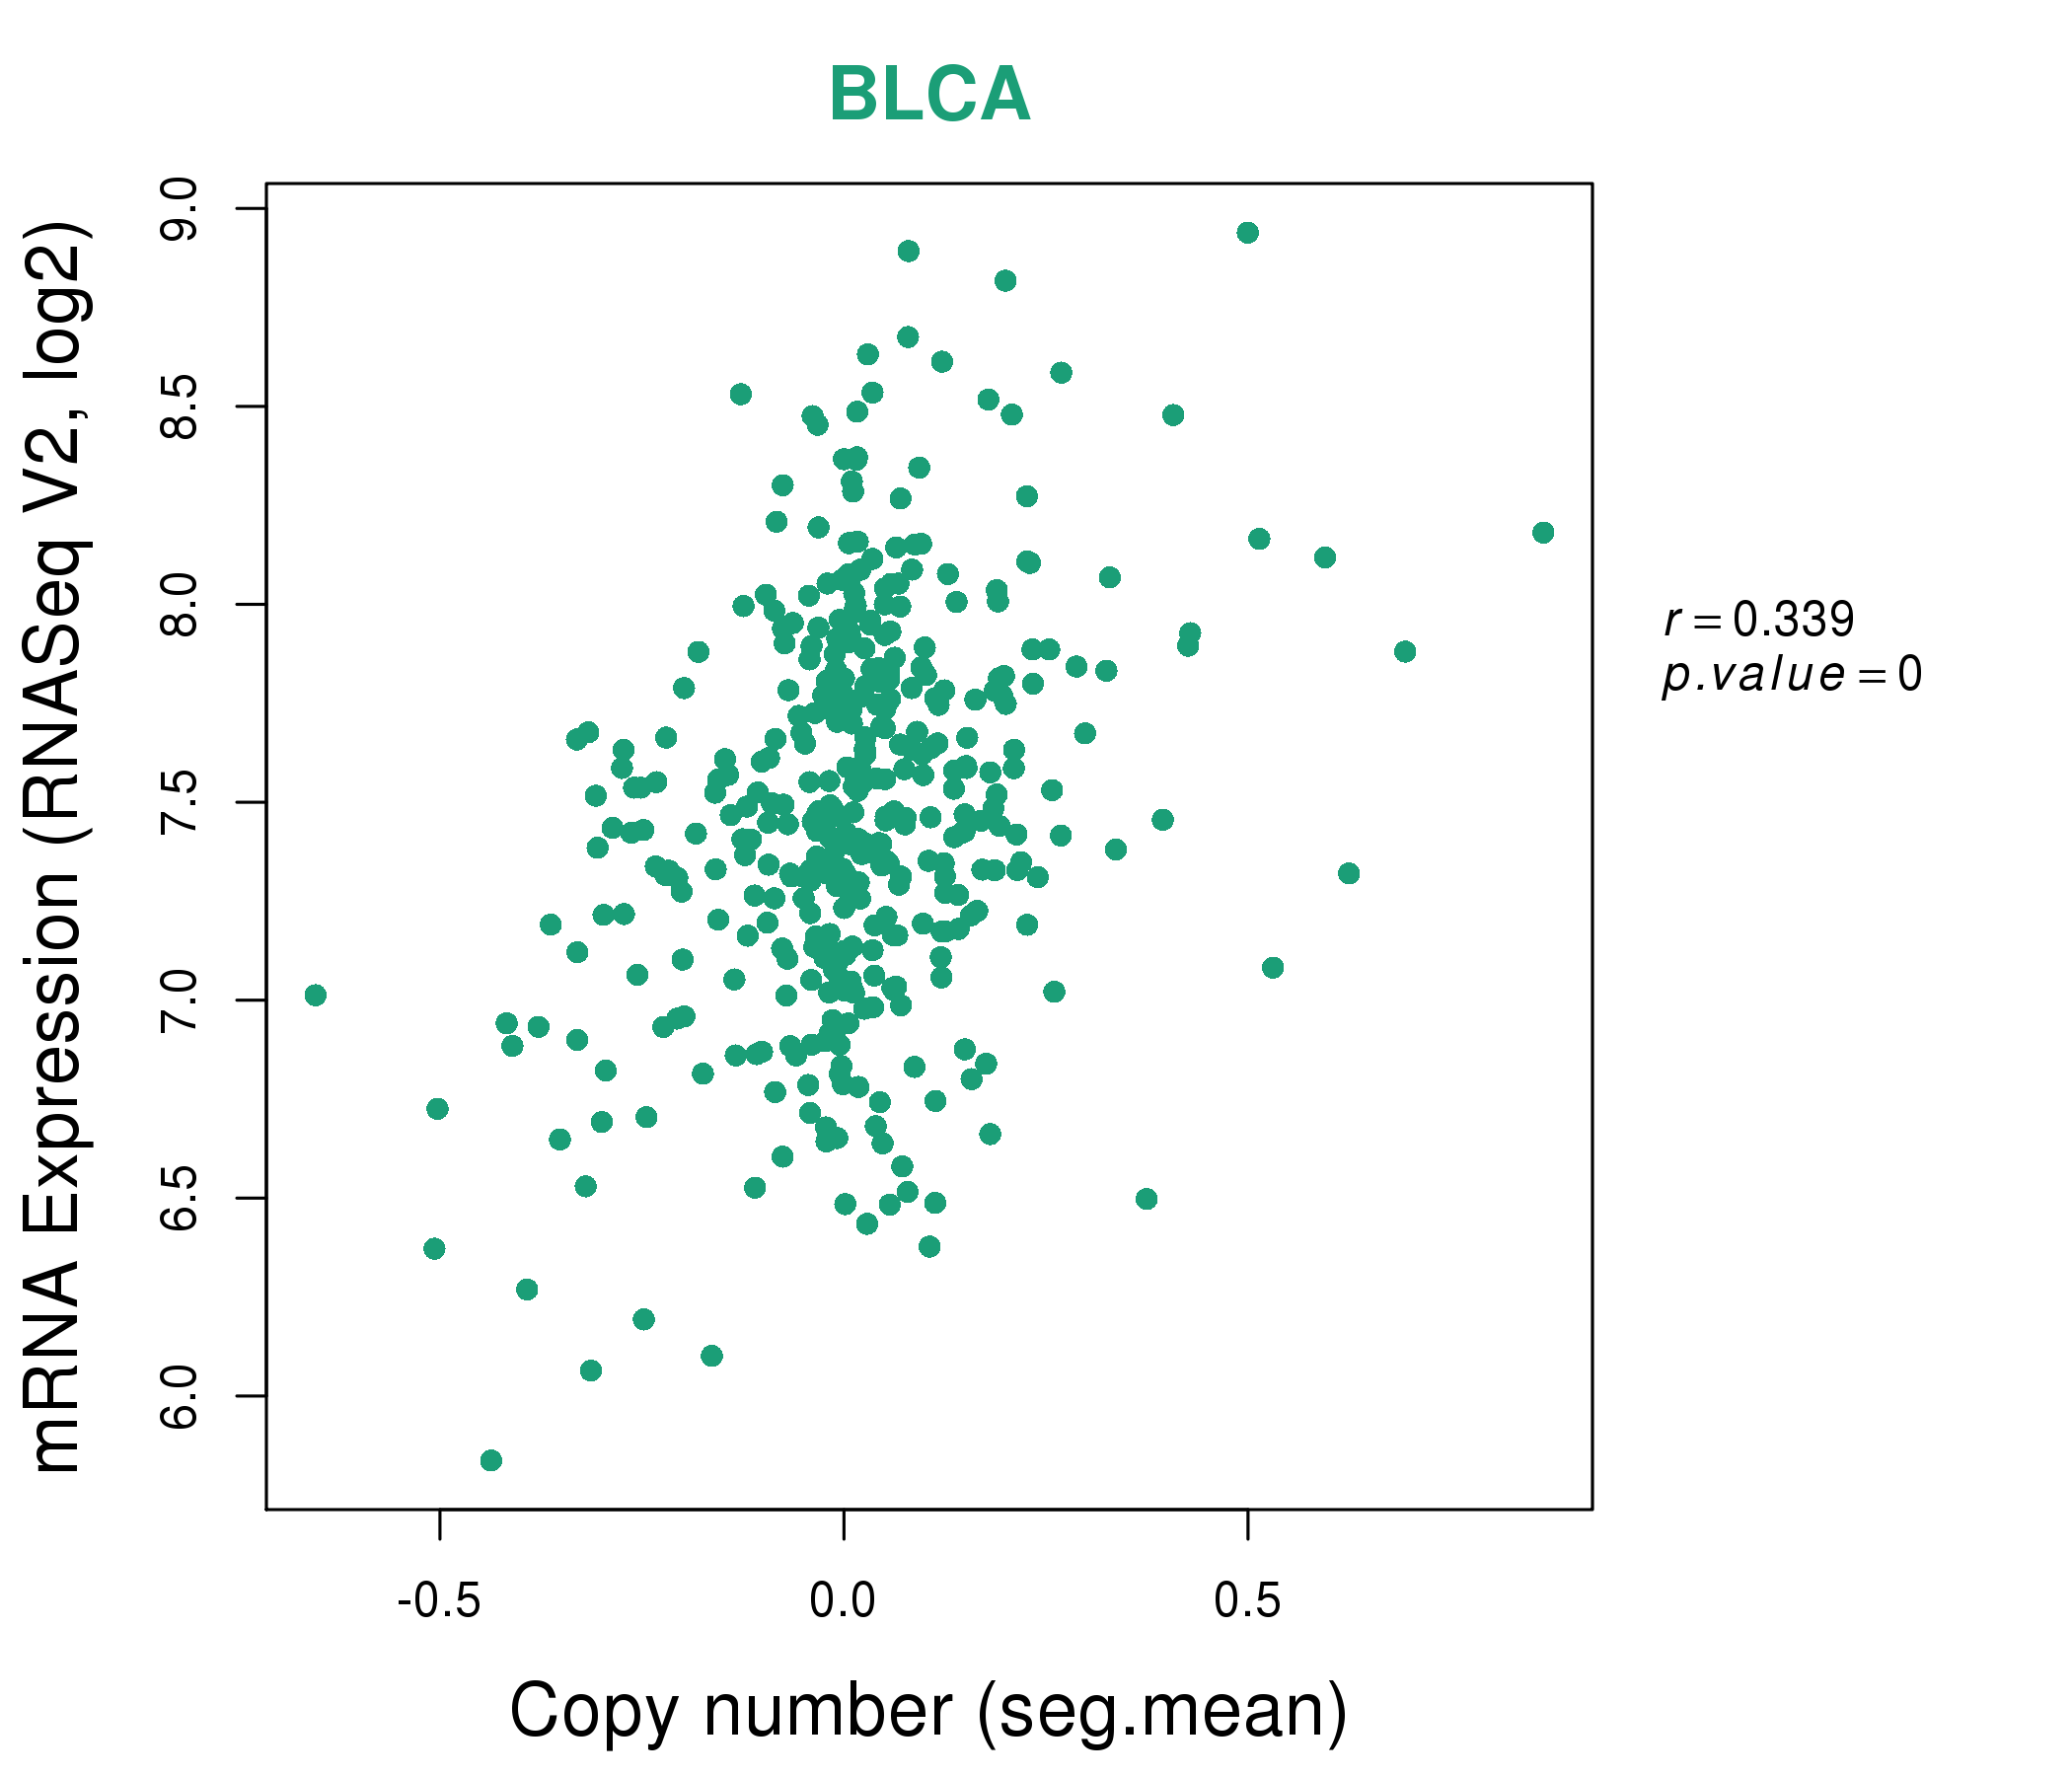
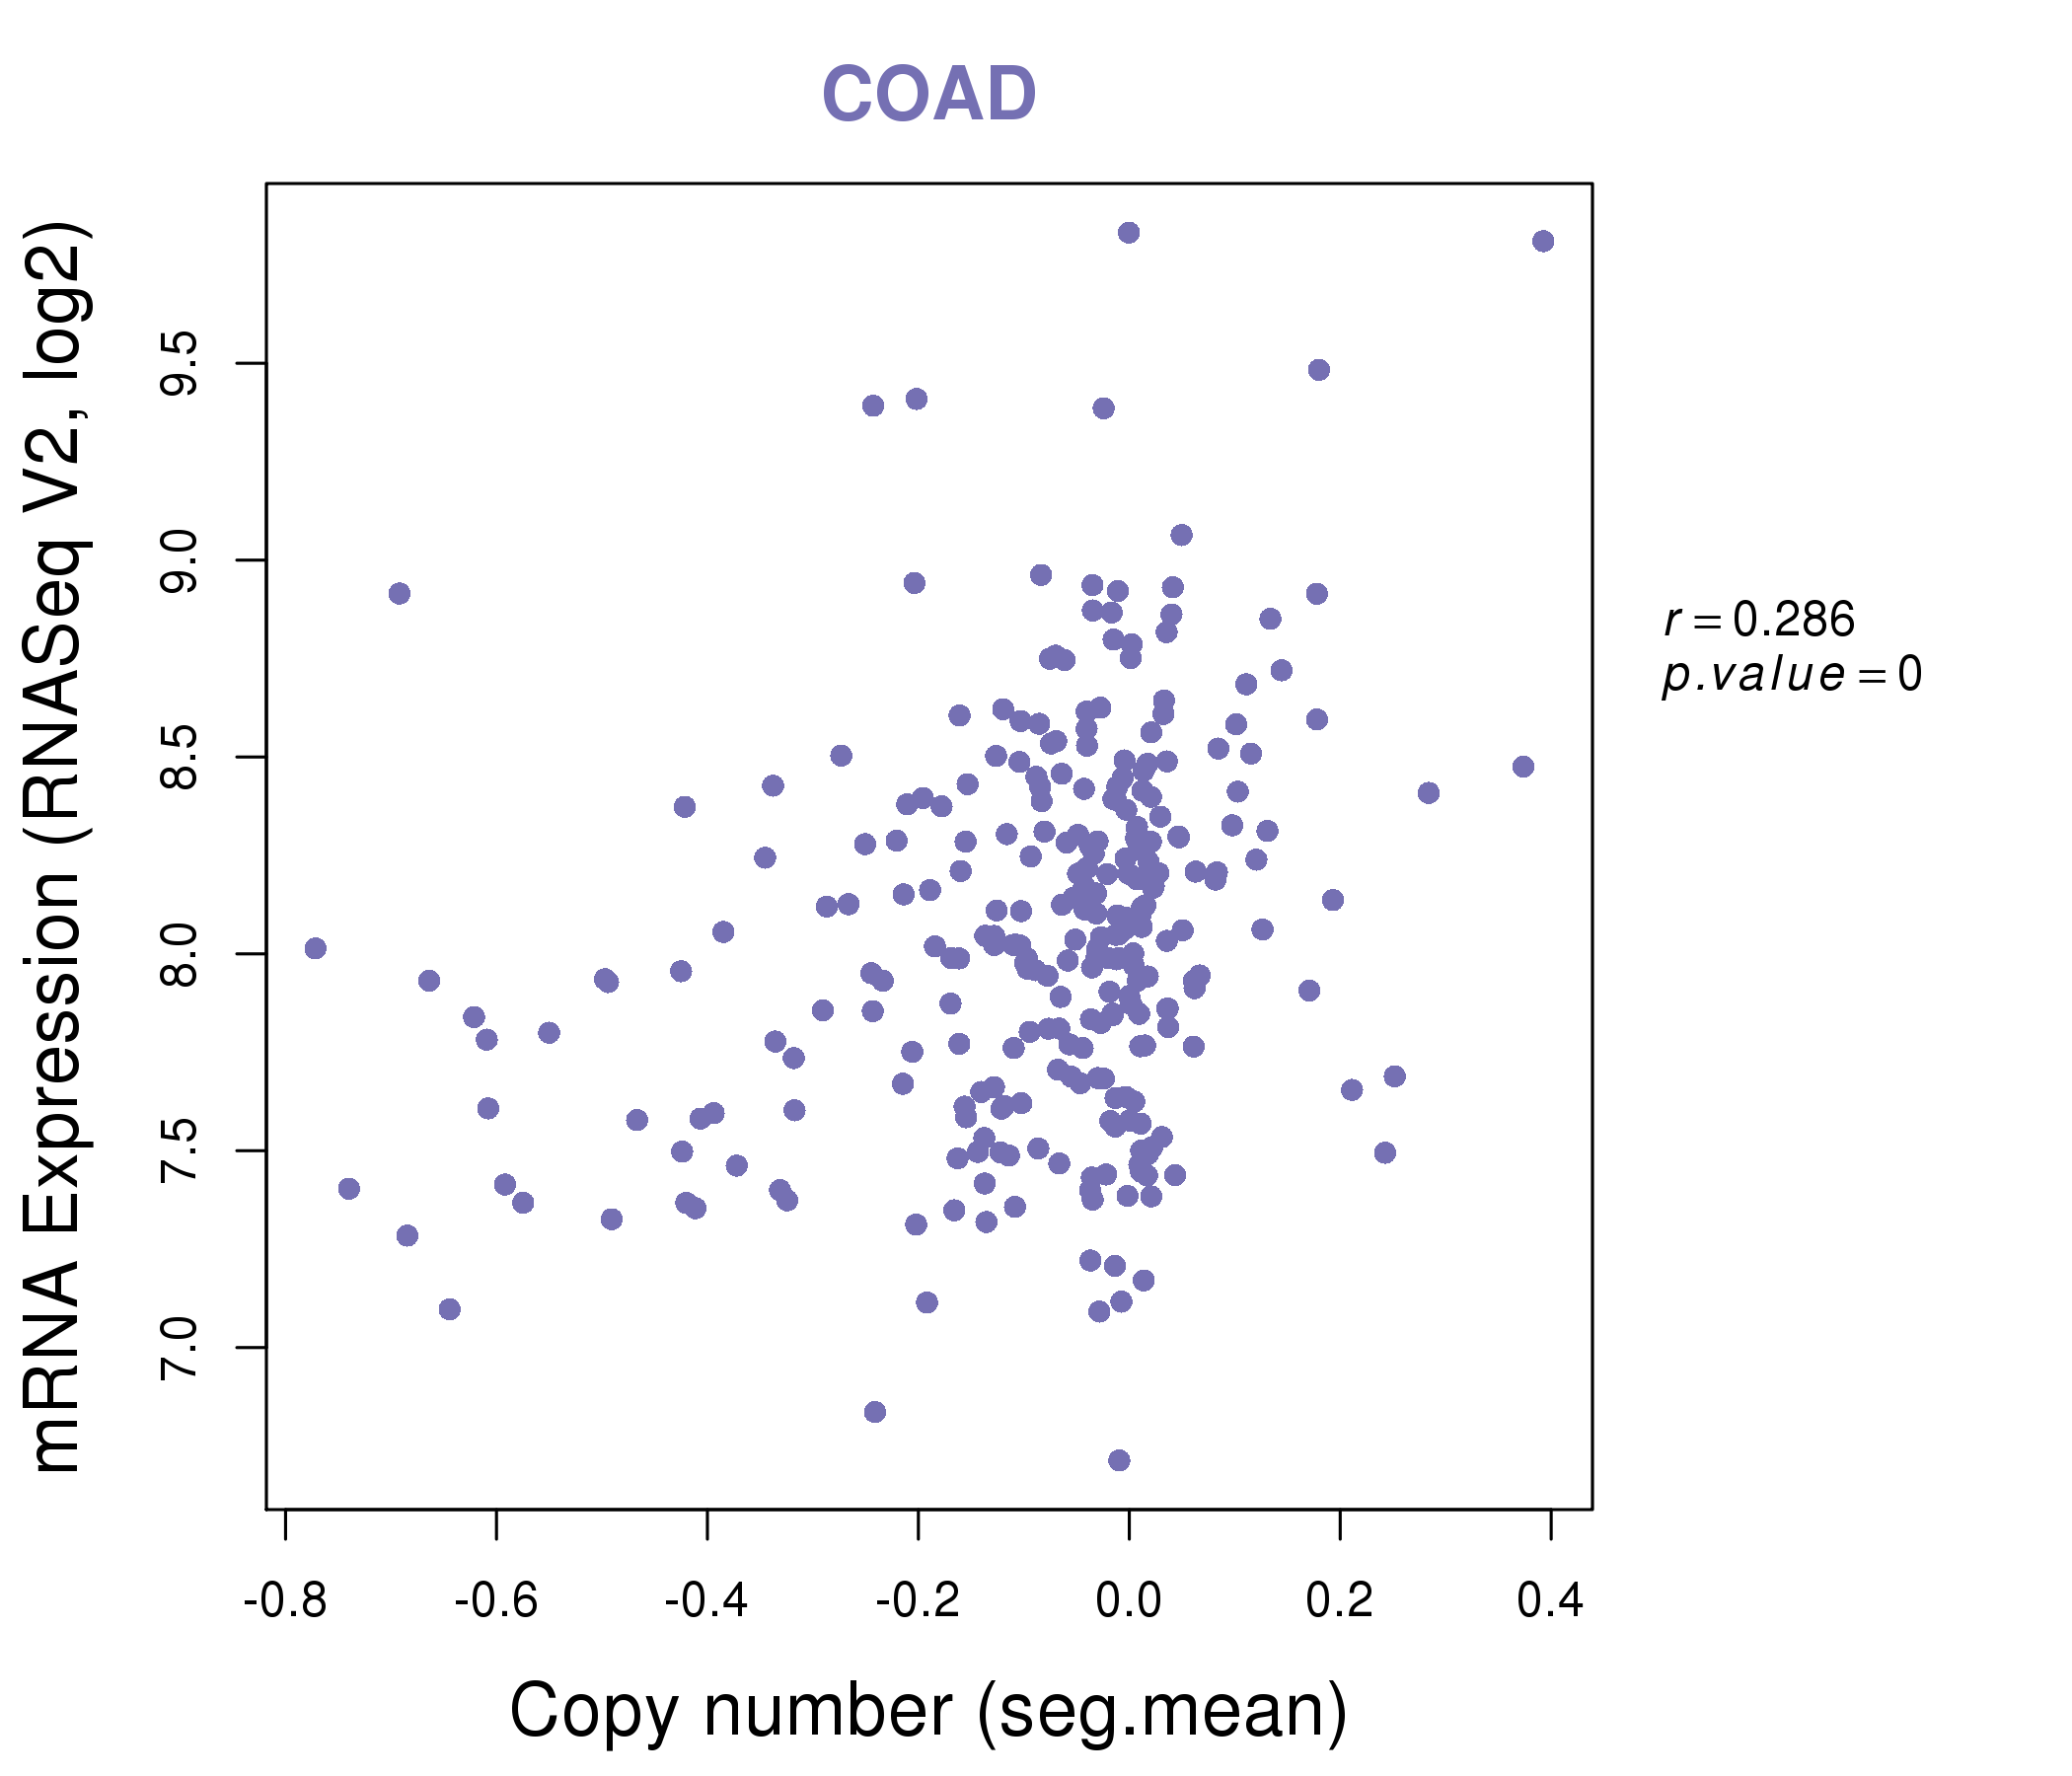
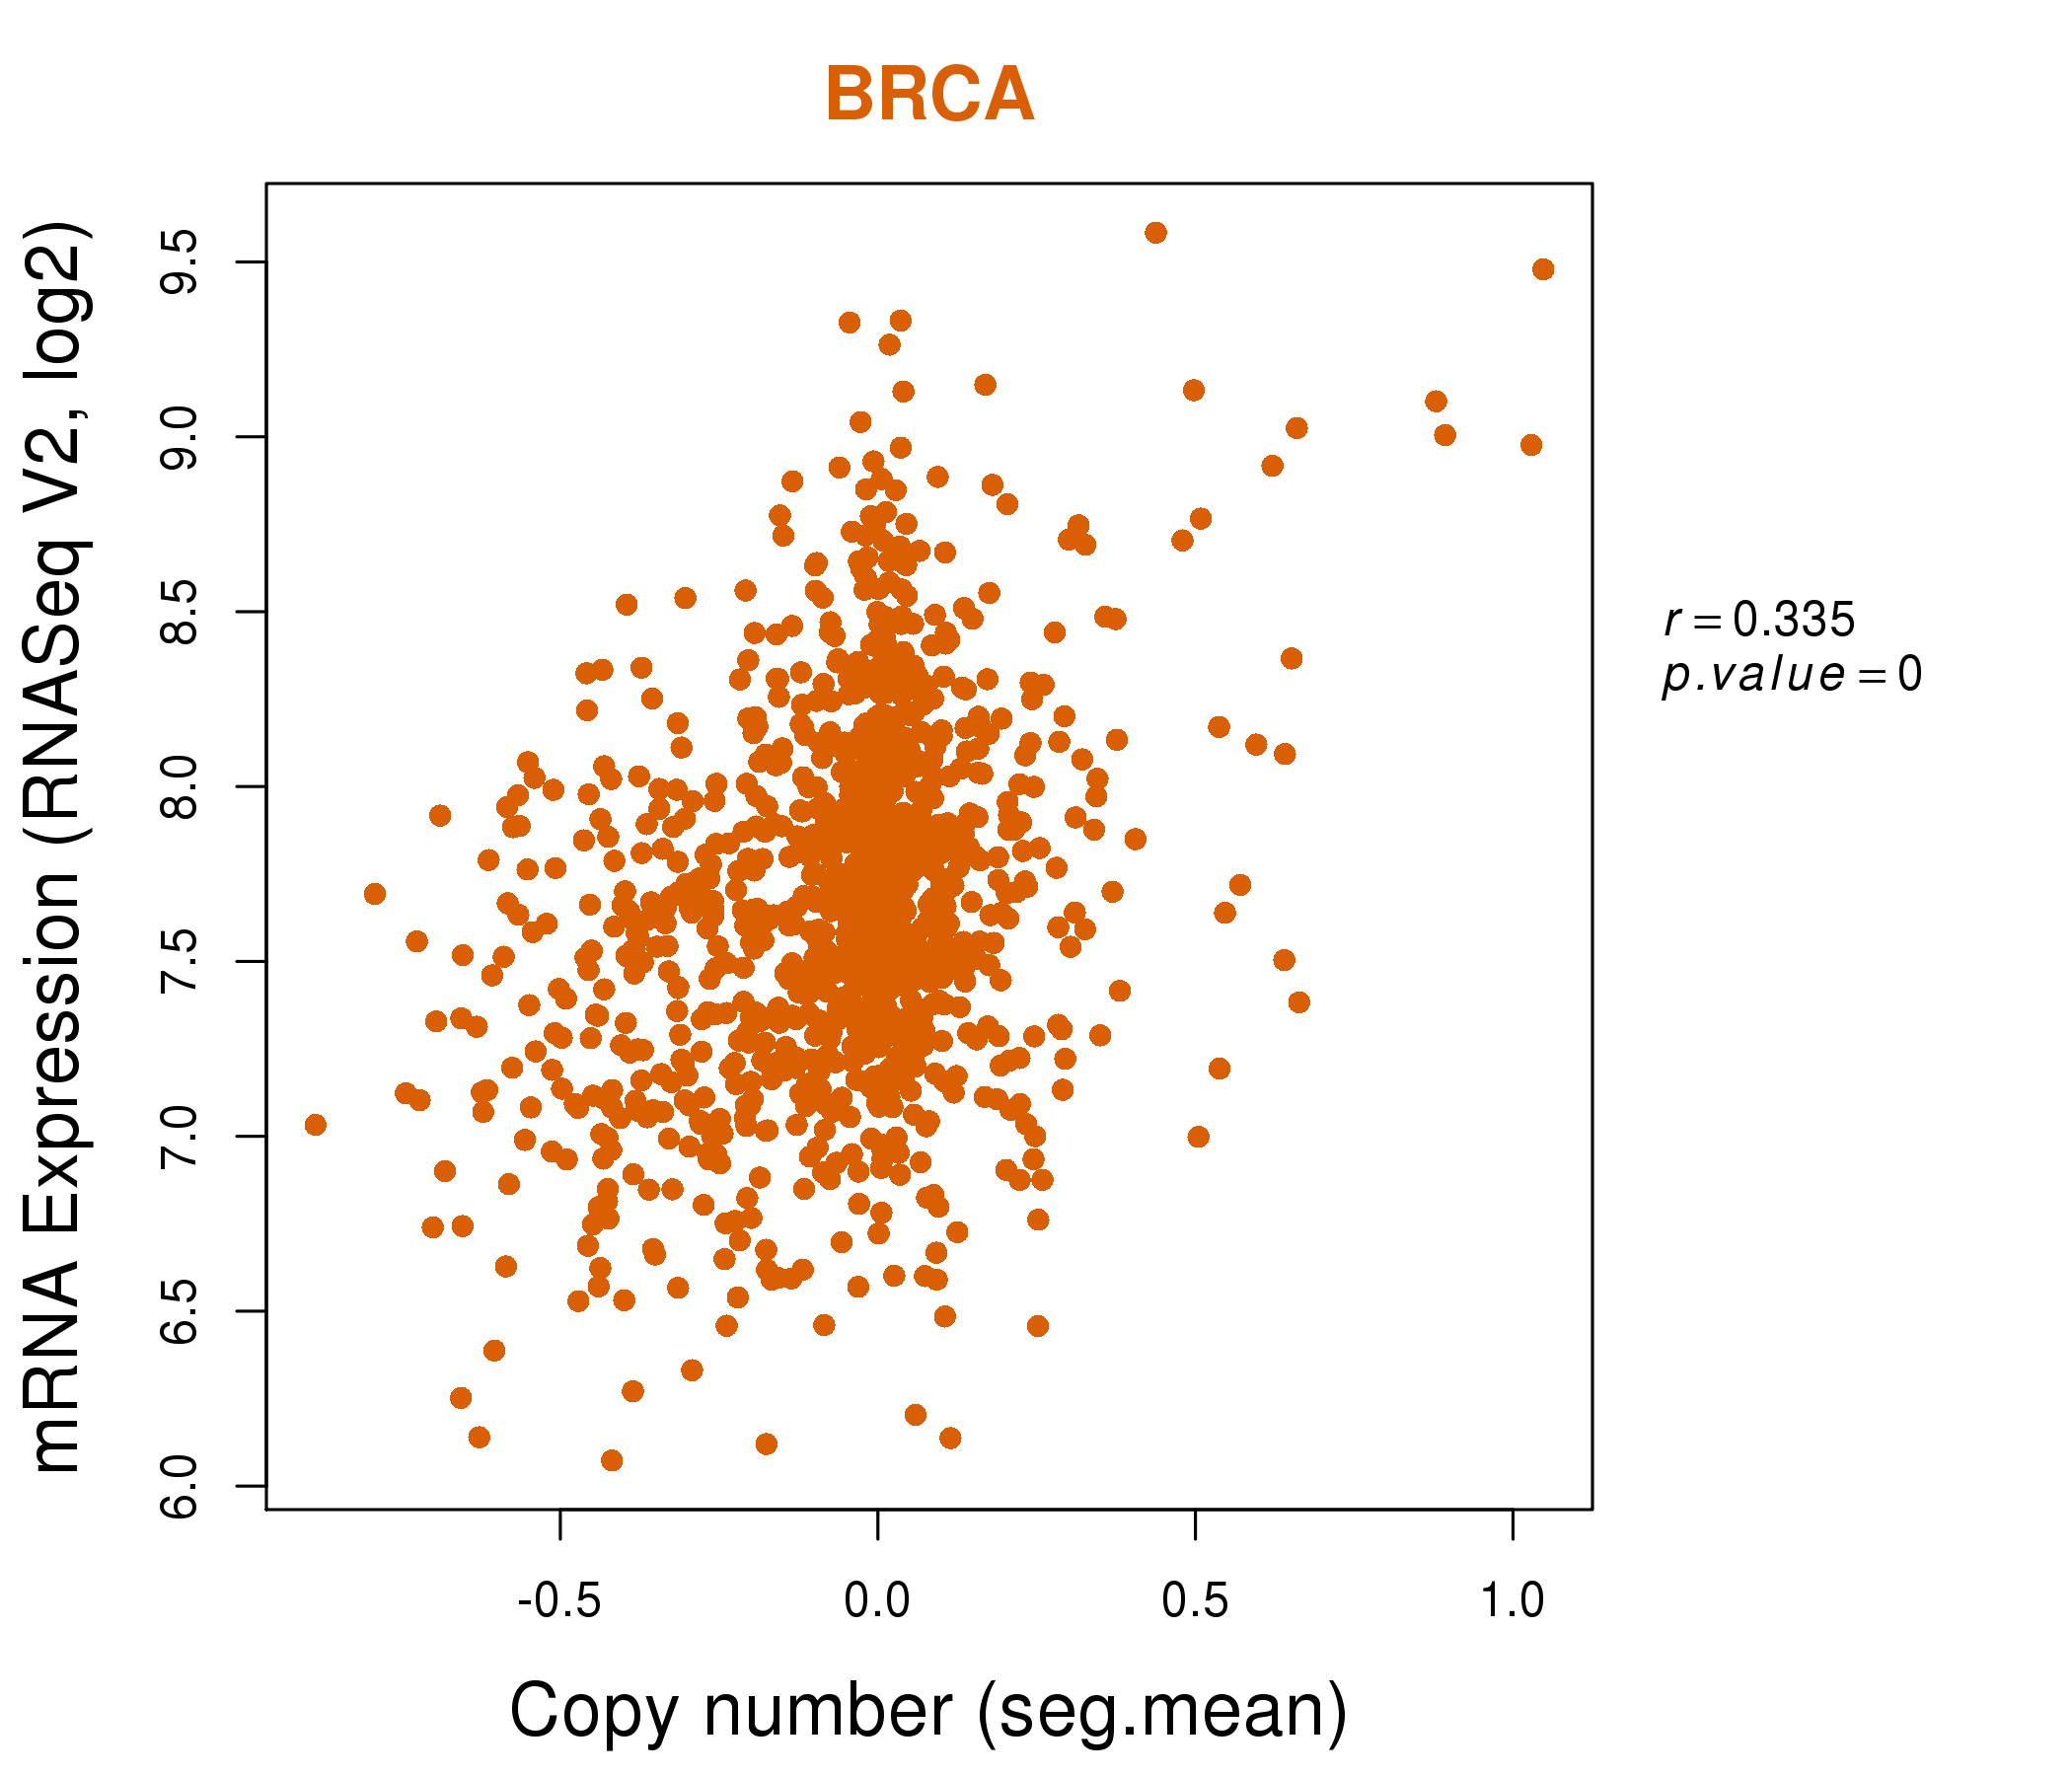
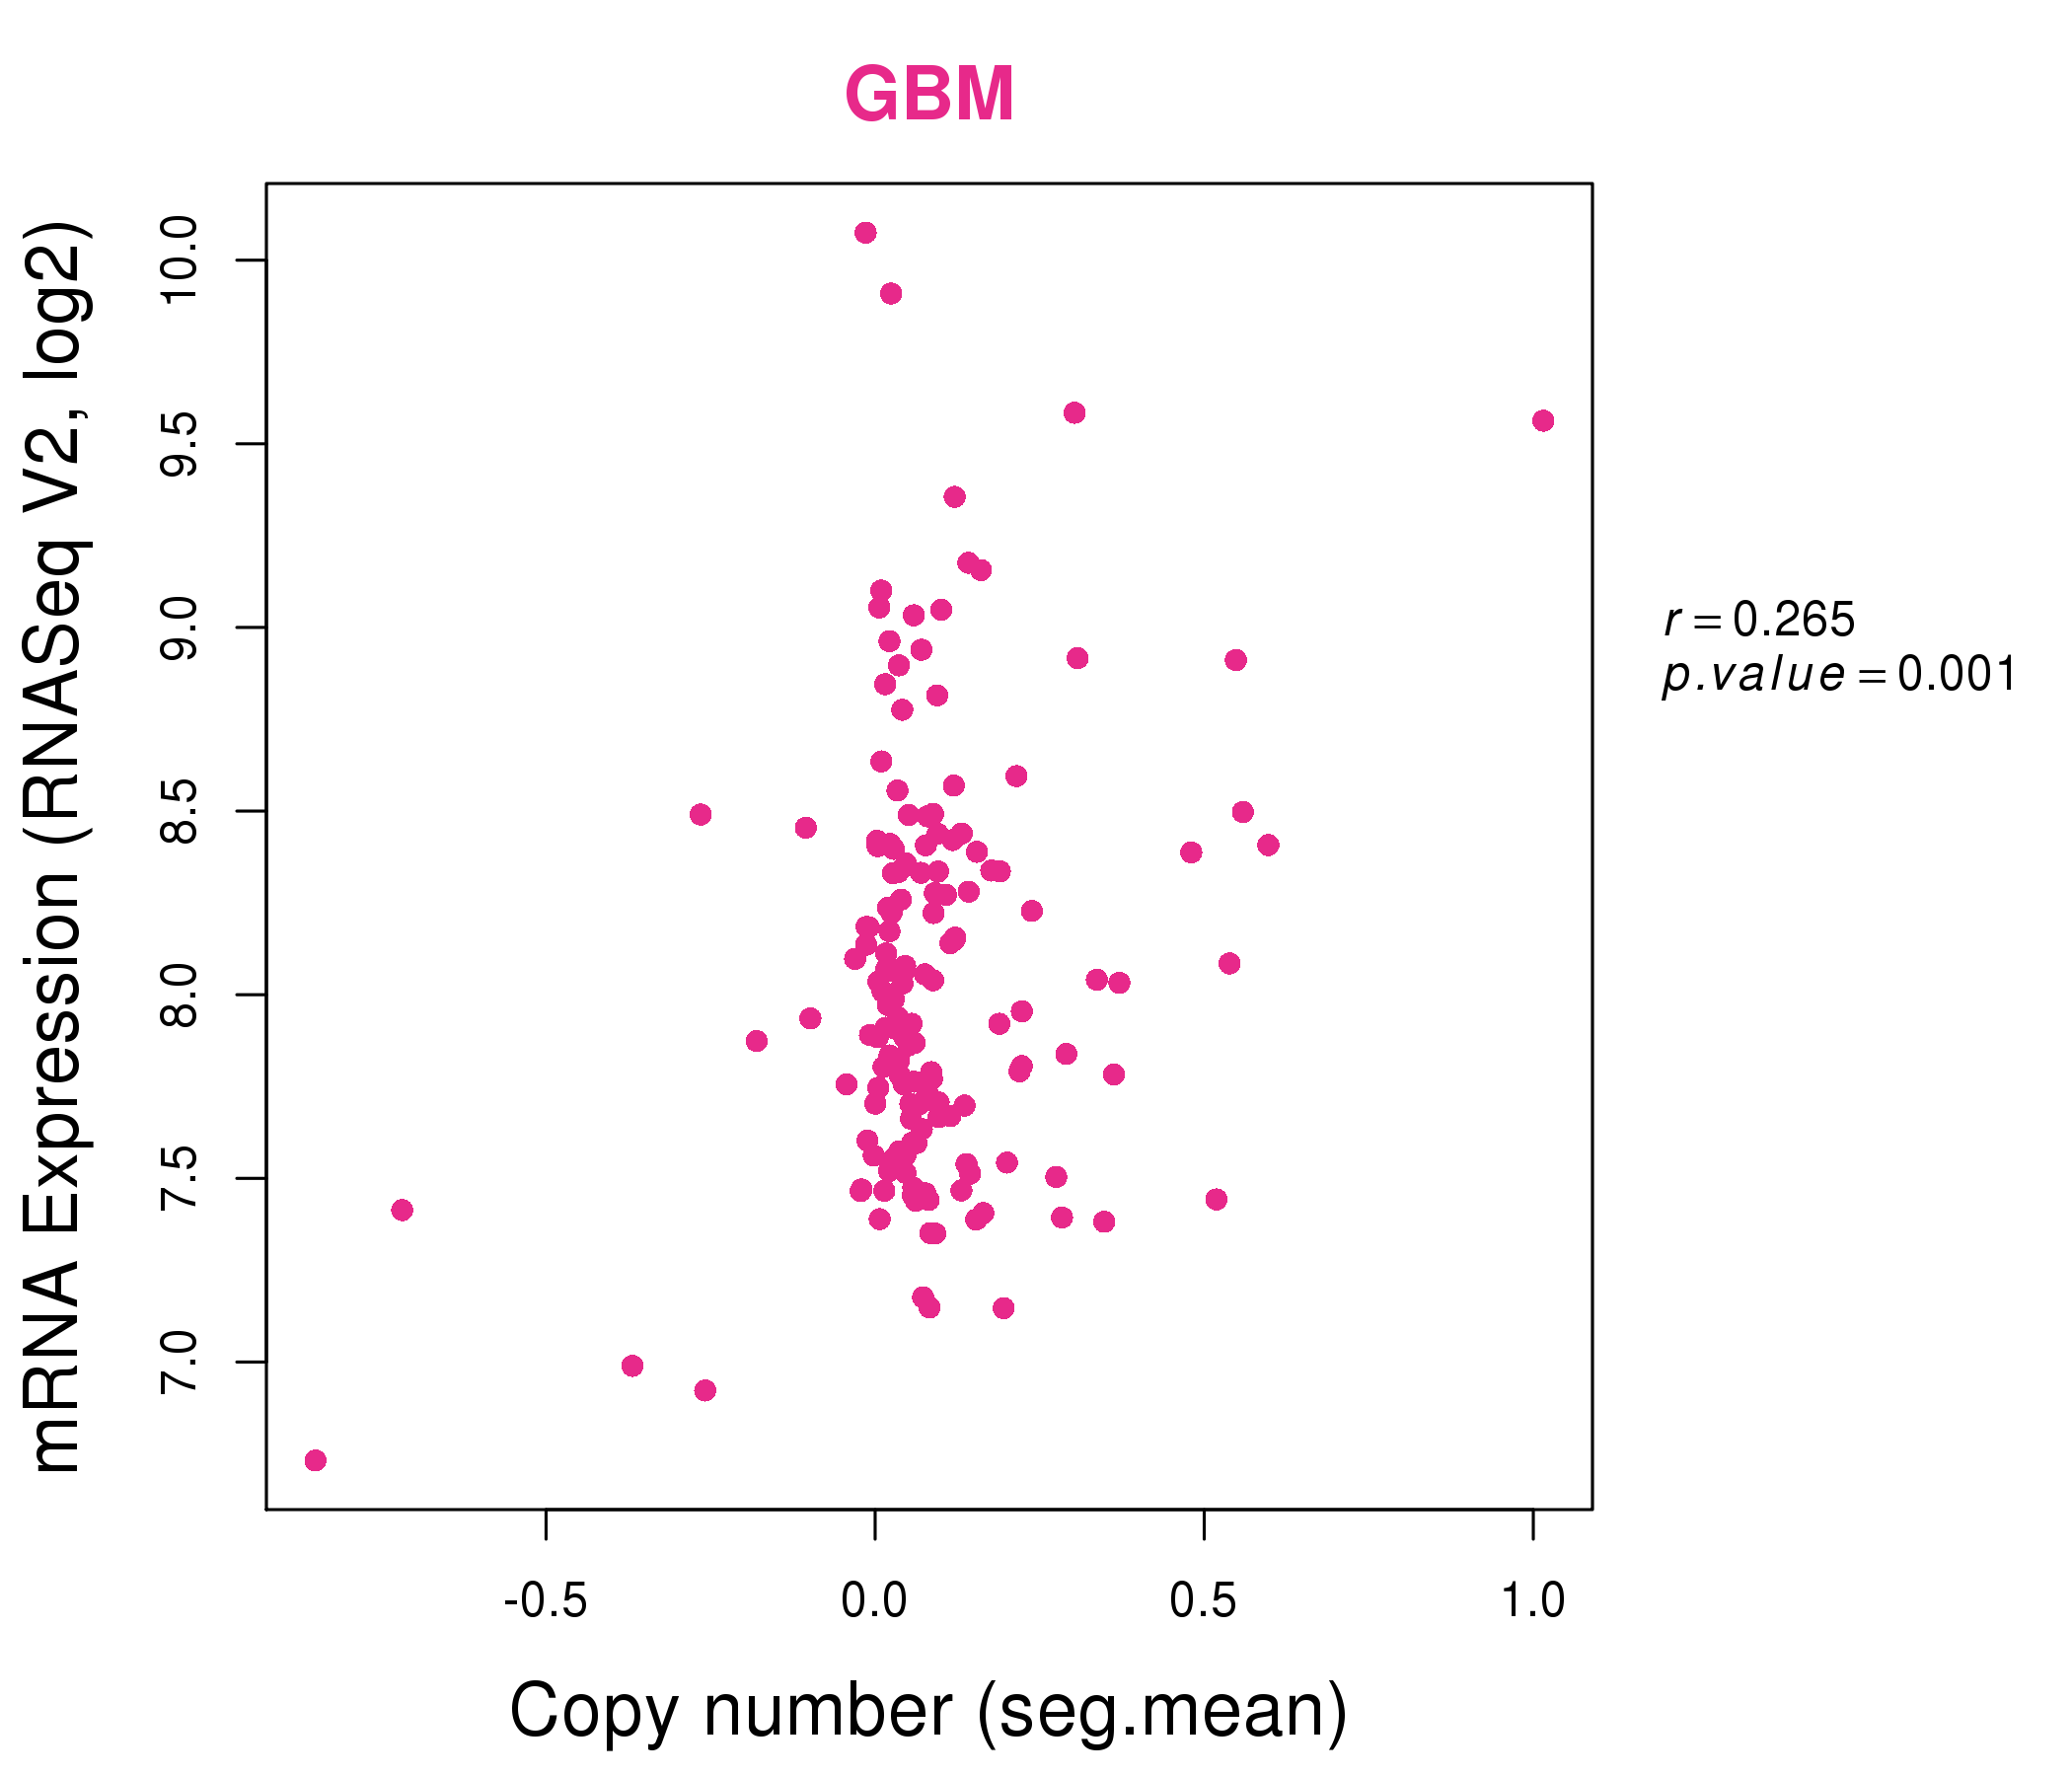
| * This plots show the correlation between CNV and gene expression. |
: Open all plots for all cancer types
 |
|
 |
|
| Top |
| Gene-Gene Network Information |
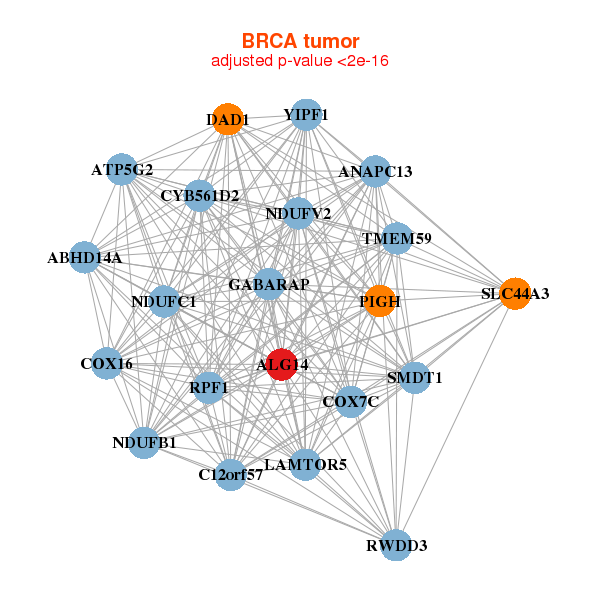
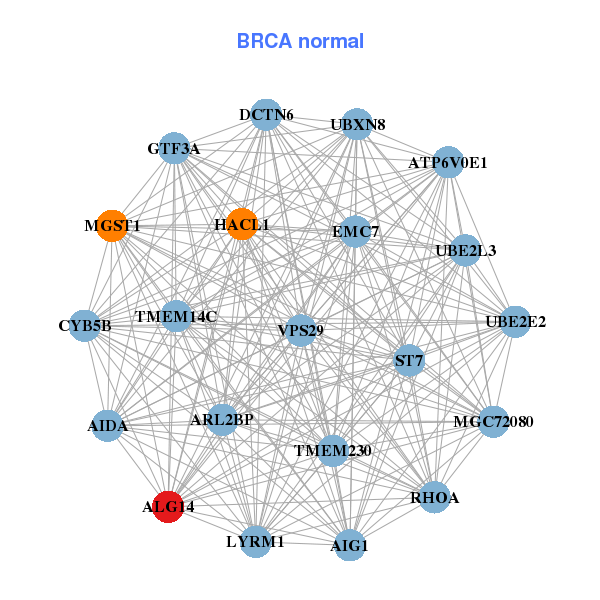
| * Co-Expression network figures were drawn using R package igraph. Only the top 20 genes with the highest correlations were shown. Red circle: input gene, orange circle: cell metabolism gene, sky circle: other gene |
: Open all plots for all cancer types
 |
|
| ABHD14A,ALG14,ANAPC13,ATP5G2,C12orf57,SMDT1,COX16, COX7C,CYB561D2,DAD1,GABARAP,LAMTOR5,NDUFB1,NDUFC1, NDUFV2,PIGH,RPF1,RWDD3,SLC44A3,TMEM59,YIPF1 | AIDA,AIG1,ALG14,ARL2BP,ATP6V0E1,EMC7,TMEM230, CYB5B,DCTN6,GTF3A,HACL1,LYRM1,MGC72080,MGST1, RHOA,ST7,TMEM14C,UBE2E2,UBE2L3,UBXN8,VPS29 |
 |
|
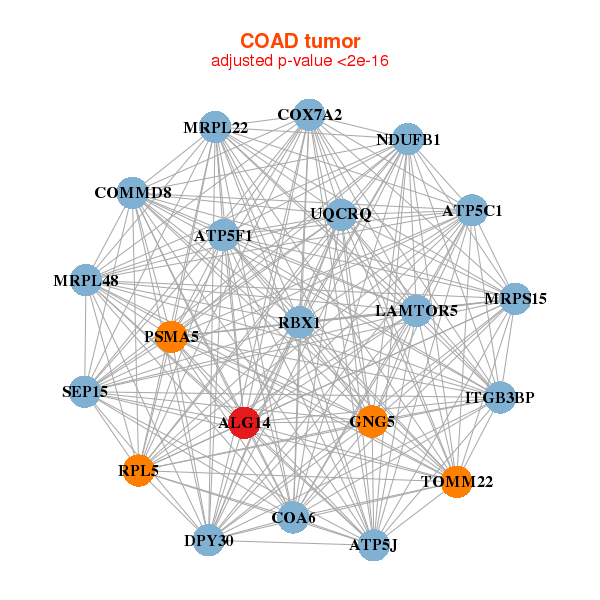
| ALG14,ATP5C1,ATP5F1,ATP5J,COA6,COMMD8,COX7A2, DPY30,GNG5,LAMTOR5,ITGB3BP,MRPL22,MRPL48,MRPS15, NDUFB1,PSMA5,RBX1,RPL5,SEP15,TOMM22,UQCRQ | ALG14,ATP5C1,ATP5G3,ATPIF1,MPC1,C15orf48,MIEN1, COA3,CLIC1,FAM118B,MLX,MRPL27,MRPS11,NDUFB9, PDCD6,POLR2H,PPCS,TSG101,UQCR10,UQCRFS1,VPS25 |
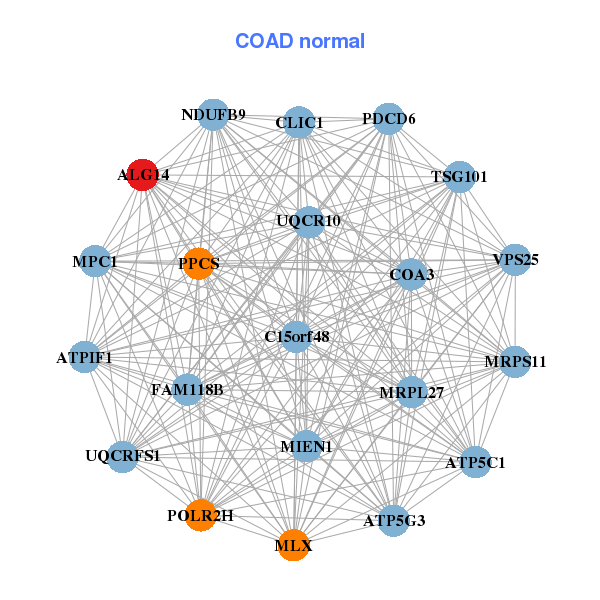
| * Co-Expression network figures were drawn using R package igraph. Only the top 20 genes with the highest correlations were shown. Red circle: input gene, orange circle: cell metabolism gene, sky circle: other gene |
: Open all plots for all cancer types
| Top |
: Open all interacting genes' information including KEGG pathway for all interacting genes from DAVID
| Top |
| Pharmacological Information for ALG14 |
| There's no related Drug. |
| Top |
| Cross referenced IDs for ALG14 |
| * We obtained these cross-references from Uniprot database. It covers 150 different DBs, 18 categories. http://www.uniprot.org/help/cross_references_section |
: Open all cross reference information
|
Copyright © 2016-Present - The Univsersity of Texas Health Science Center at Houston @ |