|
|||||||||||||||||||||||||||||||||||||||||||||||||||||||||||||||||||||||||||||||||||||||||||||||||||||||||||||||||||||||||||||||||||||||||||||||||||||||||||||||||||||||||||||||||||||||||||||||||||||||||||||||||||||||||||||||||||||||||||||||||||||||||||||||||||||||||||||||||||||||||||||||||||||||||||||||||||||||||||||||||||||||||||||
| |
| Phenotypic Information (metabolism pathway, cancer, disease, phenome) |
| |
| |
| Gene-Gene Network Information: Co-Expression Network, Interacting Genes & KEGG |
| |
|


| Gene Summary for A2M |
| Basic gene info. | Gene symbol | A2M |
| Gene name | alpha-2-macroglobulin | |
| Synonyms | A2MD|CPAMD5|FWP007|S863-7 | |
| Cytomap | UCSC genome browser: 12p13.31 | |
| Genomic location | chr12 :9220303-9268558 | |
| Type of gene | protein-coding | |
| RefGenes | NM_000014.4, | |
| Ensembl id | ENSG00000175899 | |
| Description | C3 and PZP-like alpha-2-macroglobulin domain-containing protein 5alpha-2-M | |
| Modification date | 20141207 | |
| dbXrefs | MIM : 103950 | |
| HGNC : HGNC | ||
| Ensembl : ENSG00000175899 | ||
| HPRD : 00072 | ||
| Vega : OTTHUMG00000150267 | ||
| Protein | UniProt: go to UniProt's Cross Reference DB Table | |
| Expression | CleanEX: HS_A2M | |
| BioGPS: 2 | ||
| Gene Expression Atlas: ENSG00000175899 | ||
| The Human Protein Atlas: ENSG00000175899 | ||
| Pathway | NCI Pathway Interaction Database: A2M | |
| KEGG: A2M | ||
| REACTOME: A2M | ||
| ConsensusPathDB | ||
| Pathway Commons: A2M | ||
| Metabolism | MetaCyc: A2M | |
| HUMANCyc: A2M | ||
| Regulation | Ensembl's Regulation: ENSG00000175899 | |
| miRBase: chr12 :9,220,303-9,268,558 | ||
| TargetScan: NM_000014 | ||
| cisRED: ENSG00000175899 | ||
| Context | iHOP: A2M | |
| cancer metabolism search in PubMed: A2M | ||
| UCL Cancer Institute: A2M | ||
| Assigned class in ccmGDB | C | |
| Top |
| Phenotypic Information for A2M(metabolism pathway, cancer, disease, phenome) |
| Cancer | CGAP: A2M |
| Familial Cancer Database: A2M | |
| * This gene is included in those cancer gene databases. |
|
|
|
|
|
|
| |||||||||||||||||||||||||||||||||||||||||||||||||||||||||||||||||||||||||||||||||||||||||||||||||||||||||||||||||||||||||||||||||||||||||||||||||||||||||||||||||||||||||||||||||||||||||||||||||||||||||||||||||||||||||||||||||||||||||||||||||||||||||||||||||||||||||||||||||||||||||||||||||||||||||||||||||||||||||||||||||||||||
Oncogene 1 | Significant driver gene in | ||||||||||||||||||||||||||||||||||||||||||||||||||||||||||||||||||||||||||||||||||||||||||||||||||||||||||||||||||||||||||||||||||||||||||||||||||||||||||||||||||||||||||||||||||||||||||||||||||||||||||||||||||||||||||||||||||||||||||||||||||||||||||||||||||||||||||||||||||||||||||||||||||||||||||||||||||||||||||||||||||||||||||||
| cf) number; DB name 1 Oncogene; http://nar.oxfordjournals.org/content/35/suppl_1/D721.long, 2 Tumor Suppressor gene; https://bioinfo.uth.edu/TSGene/, 3 Cancer Gene Census; http://www.nature.com/nrc/journal/v4/n3/abs/nrc1299.html, 4 CancerGenes; http://nar.oxfordjournals.org/content/35/suppl_1/D721.long, 5 Network of Cancer Gene; http://ncg.kcl.ac.uk/index.php, 1Therapeutic Vulnerabilities in Cancer; http://cbio.mskcc.org/cancergenomics/statius/ |
| REACTOME_METABOLISM_OF_LIPIDS_AND_LIPOPROTEINS REACTOME_LIPOPROTEIN_METABOLISM | |
| OMIM | |
| Orphanet | |
| Disease | KEGG Disease: A2M |
| MedGen: A2M (Human Medical Genetics with Condition) | |
| ClinVar: A2M | |
| Phenotype | MGI: A2M (International Mouse Phenotyping Consortium) |
| PhenomicDB: A2M | |
| Mutations for A2M |
| * Under tables are showing count per each tissue to give us broad intuition about tissue specific mutation patterns.You can go to the detailed page for each mutation database's web site. |
| There's no structural variation information in COSMIC data for this gene. |
| * From mRNA Sanger sequences, Chitars2.0 arranged chimeric transcripts. This table shows A2M related fusion information. |
| ID | Head Gene | Tail Gene | Accession | Gene_a | qStart_a | qEnd_a | Chromosome_a | tStart_a | tEnd_a | Gene_a | qStart_a | qEnd_a | Chromosome_a | tStart_a | tEnd_a |
| BF923332 | LOC100128682 | 105 | 127 | 19 | 35897551 | 35897573 | A2M | 117 | 289 | 12 | 9221369 | 9223117 | |
| DB150819 | TUBB4B | 1 | 402 | 9 | 140135739 | 140136997 | A2M | 398 | 584 | 12 | 9246089 | 9247668 | |
| W90454 | A2M | 1 | 284 | 12 | 9243915 | 9247627 | AFMID | 278 | 411 | 17 | 76203648 | 76203780 | |
| AA804941 | A2M | 1 | 138 | 12 | 9229998 | 9230419 | A2M | 132 | 429 | 12 | 9230399 | 9232391 | |
| BF849872 | A2M | 11 | 264 | 12 | 9243885 | 9246176 | EPN2 | 260 | 377 | 17 | 19184805 | 19184922 | |
| BF880179 | A2M | 1 | 56 | 12 | 9248234 | 9248289 | A2M | 52 | 307 | 12 | 9251205 | 9252083 | |
| Top |
| Mutation type/ Tissue ID | brca | cns | cerv | endome | haematopo | kidn | Lintest | liver | lung | ns | ovary | pancre | prost | skin | stoma | thyro | urina | |||
| Total # sample | 1 | |||||||||||||||||||
| GAIN (# sample) | 1 | |||||||||||||||||||
| LOSS (# sample) |
| cf) Tissue ID; Tissue type (1; Breast, 2; Central_nervous_system, 3; Cervix, 4; Endometrium, 5; Haematopoietic_and_lymphoid_tissue, 6; Kidney, 7; Large_intestine, 8; Liver, 9; Lung, 10; NS, 11; Ovary, 12; Pancreas, 13; Prostate, 14; Skin, 15; Stomach, 16; Thyroid, 17; Urinary_tract) |
| Top |
|
 |
| Top |
| Stat. for Non-Synonymous SNVs (# total SNVs=140) | (# total SNVs=51) |
 |  |
(# total SNVs=1) | (# total SNVs=0) |
 |
| Top |
| * When you move the cursor on each content, you can see more deailed mutation information on the Tooltip. Those are primary_site,primary_histology,mutation(aa),pubmedID. |
| GRCh37 position | Mutation(aa) | Unique sampleID count |
| chr12:9264799-9264799 | p.R147C | 4 |
| chr12:9246106-9246106 | p.R732Q | 3 |
| chr12:9242597-9242597 | p.S873S | 3 |
| chr12:9265031-9265031 | p.N124N | 3 |
| chr12:9262615-9262615 | p.R174H | 3 |
| chr12:9264798-9264798 | p.R147H | 2 |
| chr12:9266120-9266120 | p.P36S | 2 |
| chr12:9258822-9258822 | p.? | 2 |
| chr12:9251204-9251204 | p.S617L | 2 |
| chr12:9254179-9254179 | p.S453C | 2 |
| Top |
|
 |
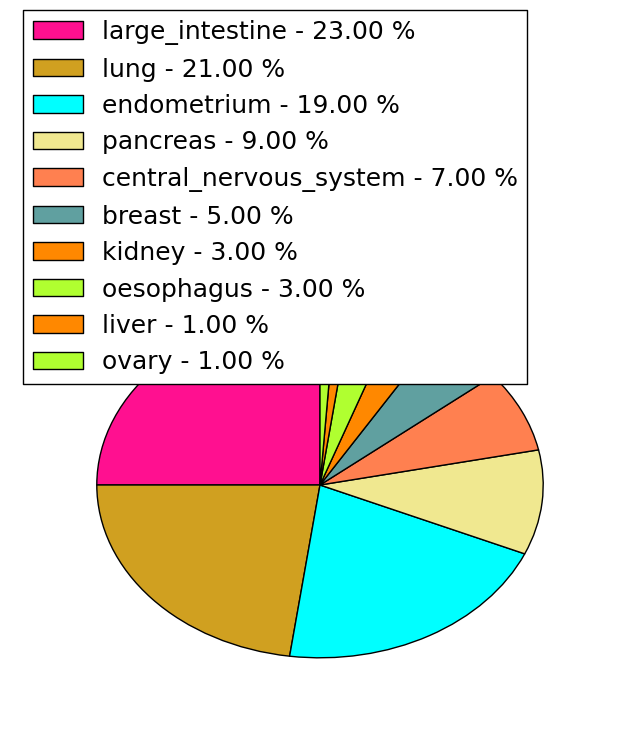
| Point Mutation/ Tissue ID | 1 | 2 | 3 | 4 | 5 | 6 | 7 | 8 | 9 | 10 | 11 | 12 | 13 | 14 | 15 | 16 | 17 | 18 | 19 | 20 |
| # sample | 9 | 5 | 2 | 30 | 7 | 7 | 6 | 20 | 15 | 3 | 25 | 22 | 1 | 17 | ||||||
| # mutation | 9 | 5 | 2 | 33 | 7 | 8 | 7 | 21 | 15 | 4 | 26 | 27 | 1 | 29 | ||||||
| nonsynonymous SNV | 6 | 2 | 2 | 25 | 3 | 3 | 6 | 19 | 9 | 2 | 13 | 16 | 1 | 19 | ||||||
| synonymous SNV | 3 | 3 | 8 | 4 | 5 | 1 | 2 | 6 | 2 | 13 | 11 | 10 |
| cf) Tissue ID; Tissue type (1; BLCA[Bladder Urothelial Carcinoma], 2; BRCA[Breast invasive carcinoma], 3; CESC[Cervical squamous cell carcinoma and endocervical adenocarcinoma], 4; COAD[Colon adenocarcinoma], 5; GBM[Glioblastoma multiforme], 6; Glioma Low Grade, 7; HNSC[Head and Neck squamous cell carcinoma], 8; KICH[Kidney Chromophobe], 9; KIRC[Kidney renal clear cell carcinoma], 10; KIRP[Kidney renal papillary cell carcinoma], 11; LAML[Acute Myeloid Leukemia], 12; LUAD[Lung adenocarcinoma], 13; LUSC[Lung squamous cell carcinoma], 14; OV[Ovarian serous cystadenocarcinoma ], 15; PAAD[Pancreatic adenocarcinoma], 16; PRAD[Prostate adenocarcinoma], 17; SKCM[Skin Cutaneous Melanoma], 18:STAD[Stomach adenocarcinoma], 19:THCA[Thyroid carcinoma], 20:UCEC[Uterine Corpus Endometrial Carcinoma]) |
| Top |
| * We represented just top 10 SNVs. When you move the cursor on each content, you can see more deailed mutation information on the Tooltip. Those are primary_site, primary_histology, mutation(aa), pubmedID. |
| Genomic Position | Mutation(aa) | Unique sampleID count |
| chr12:9246106 | p.R732Q | 3 |
| chr12:9225356 | p.E737E | 2 |
| chr12:9251308 | p.I175I | 2 |
| chr12:9266120 | p.R174H | 2 |
| chr12:9231867 | p.R147H | 2 |
| chr12:9225293 | p.P36S | 2 |
| chr12:9262610 | p.R147C | 2 |
| chr12:9262611 | p.E1311K | 2 |
| chr12:9246090 | p.F1290L | 2 |
| chr12:9264798 | p.H582H | 2 |
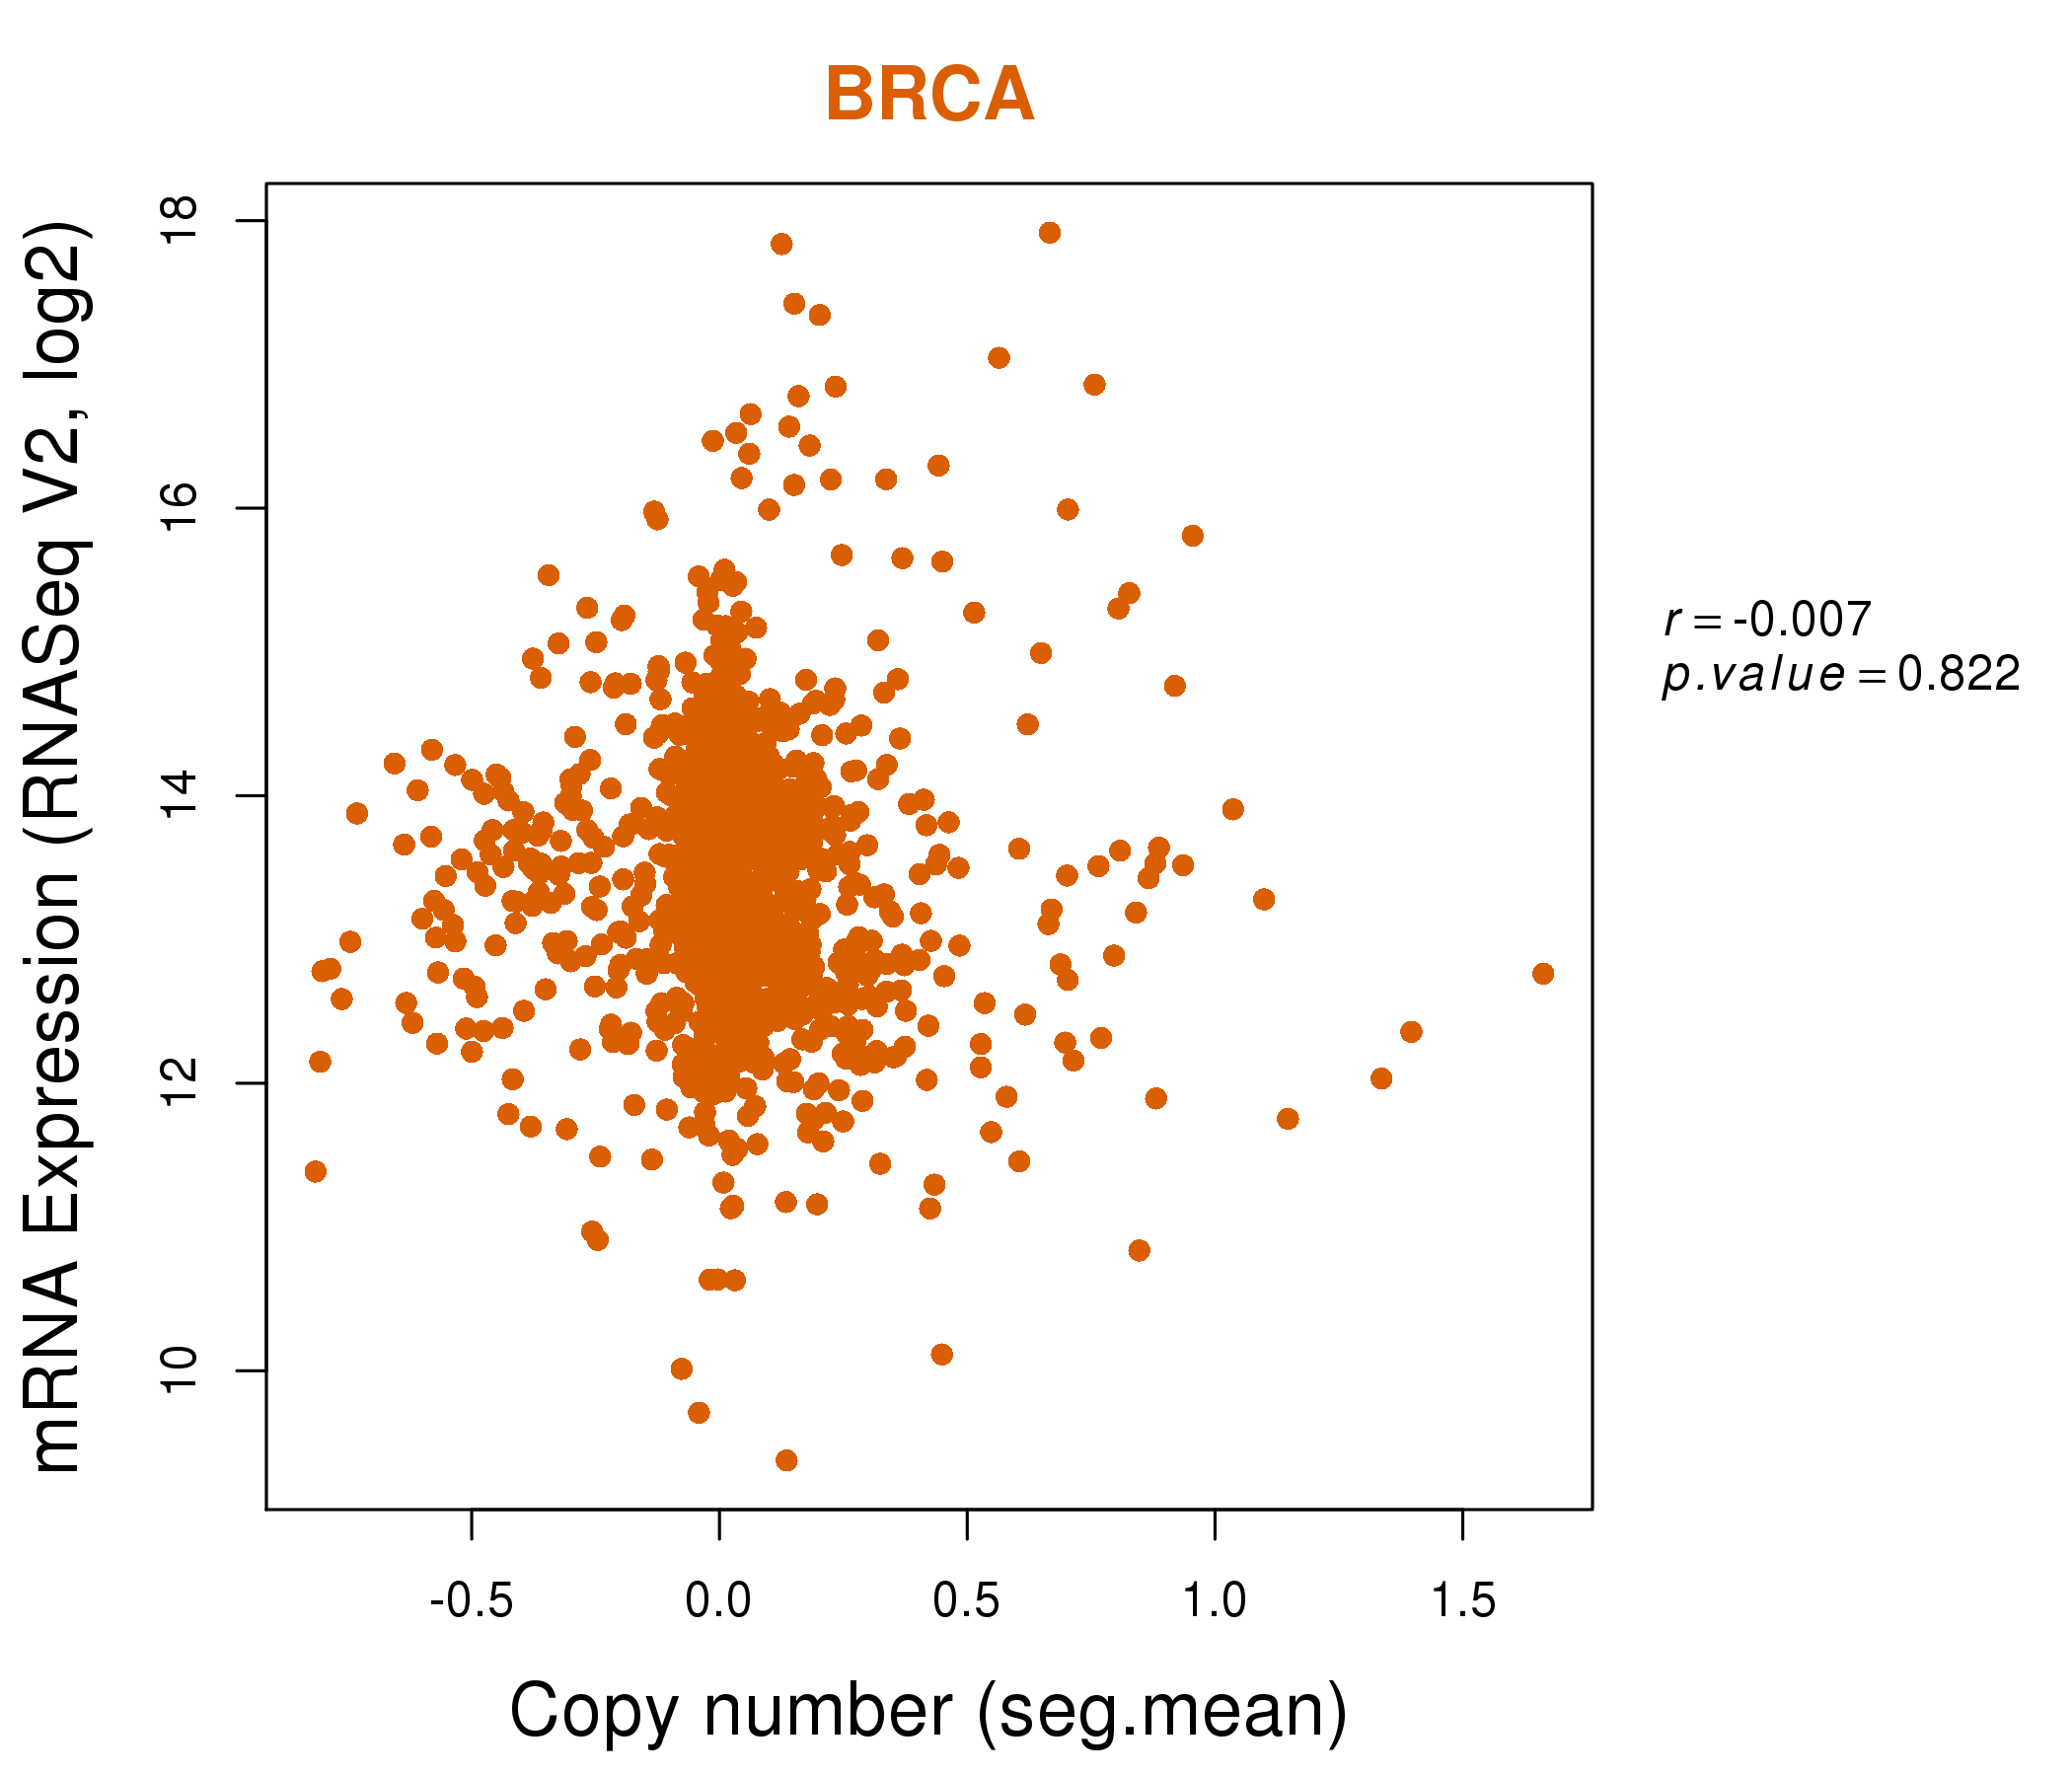
| * Copy number data were extracted from TCGA using R package TCGA-Assembler. The URLs of all public data files on TCGA DCC data server were gathered on Jan-05-2015. Function ProcessCNAData in TCGA-Assembler package was used to obtain gene-level copy number value which is calculated as the average copy number of the genomic region of a gene. |
 |
| cf) Tissue ID[Tissue type]: BLCA[Bladder Urothelial Carcinoma], BRCA[Breast invasive carcinoma], CESC[Cervical squamous cell carcinoma and endocervical adenocarcinoma], COAD[Colon adenocarcinoma], GBM[Glioblastoma multiforme], Glioma Low Grade, HNSC[Head and Neck squamous cell carcinoma], KICH[Kidney Chromophobe], KIRC[Kidney renal clear cell carcinoma], KIRP[Kidney renal papillary cell carcinoma], LAML[Acute Myeloid Leukemia], LUAD[Lung adenocarcinoma], LUSC[Lung squamous cell carcinoma], OV[Ovarian serous cystadenocarcinoma ], PAAD[Pancreatic adenocarcinoma], PRAD[Prostate adenocarcinoma], SKCM[Skin Cutaneous Melanoma], STAD[Stomach adenocarcinoma], THCA[Thyroid carcinoma], UCEC[Uterine Corpus Endometrial Carcinoma] |
| Top |
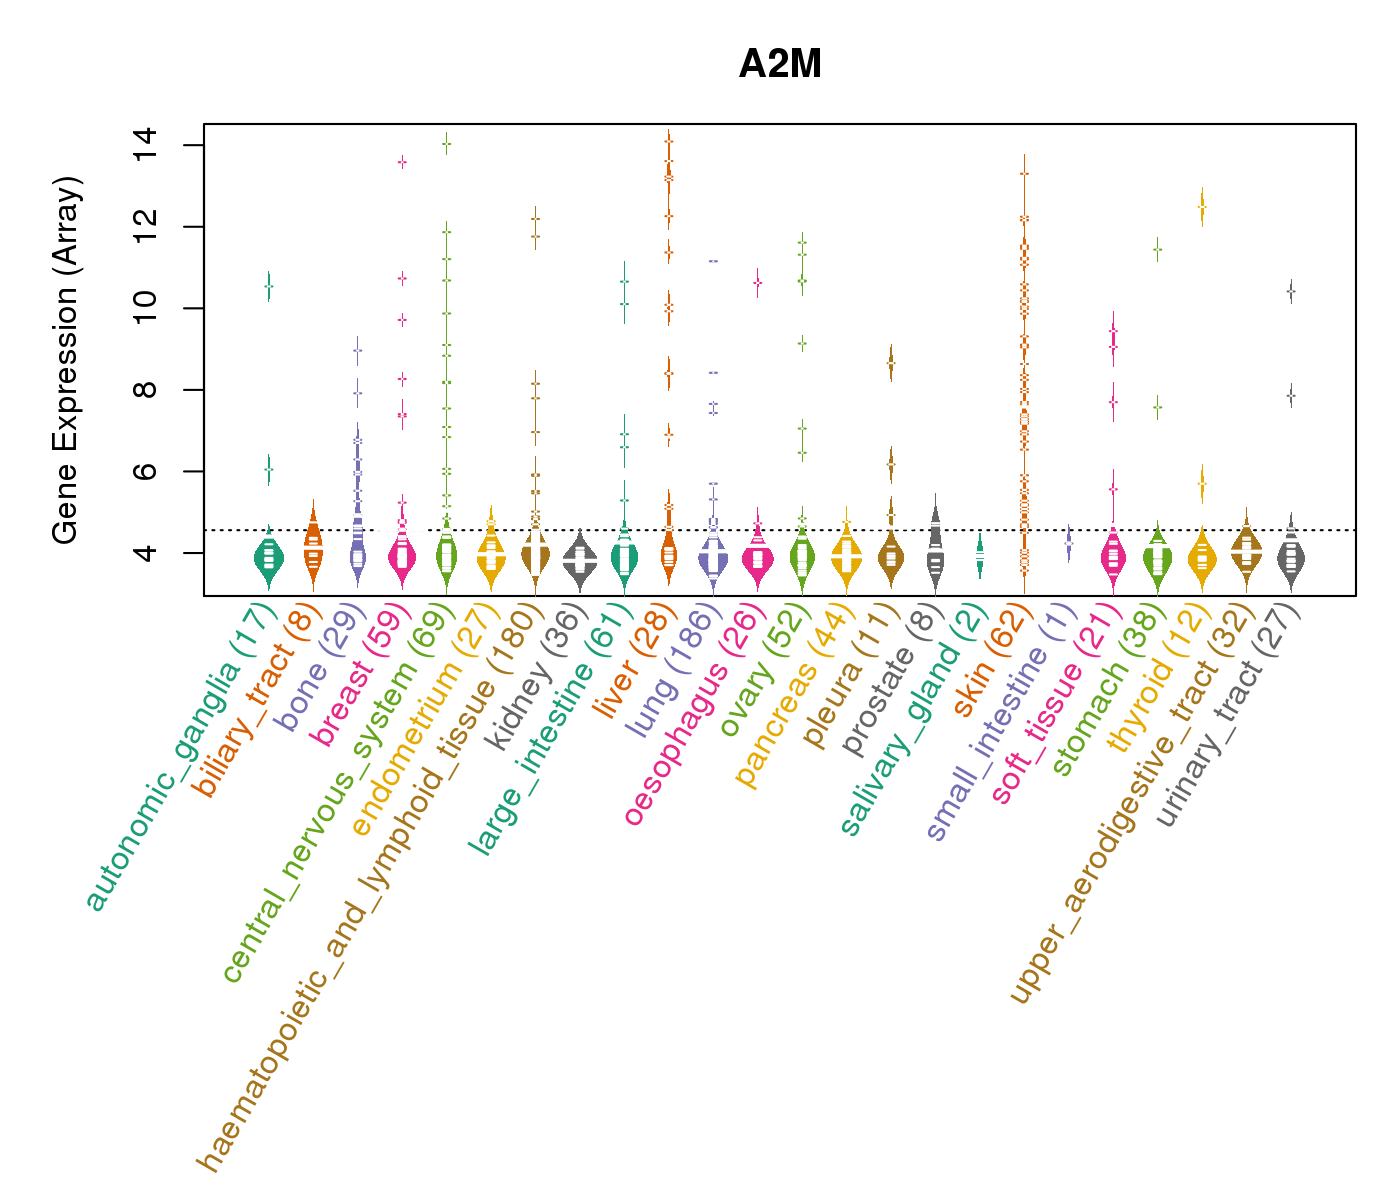
| Gene Expression for A2M |
| * CCLE gene expression data were extracted from CCLE_Expression_Entrez_2012-10-18.res: Gene-centric RMA-normalized mRNA expression data. |
 |
| * Normalized gene expression data of RNASeqV2 was extracted from TCGA using R package TCGA-Assembler. The URLs of all public data files on TCGA DCC data server were gathered at Jan-05-2015. Only eight cancer types have enough normal control samples for differential expression analysis. (t test, adjusted p<0.05 (using Benjamini-Hochberg FDR)) |
 |
| Top |
| * This plots show the correlation between CNV and gene expression. |
: Open all plots for all cancer types
 |
|
 |
|

| Top |
| Gene-Gene Network Information |
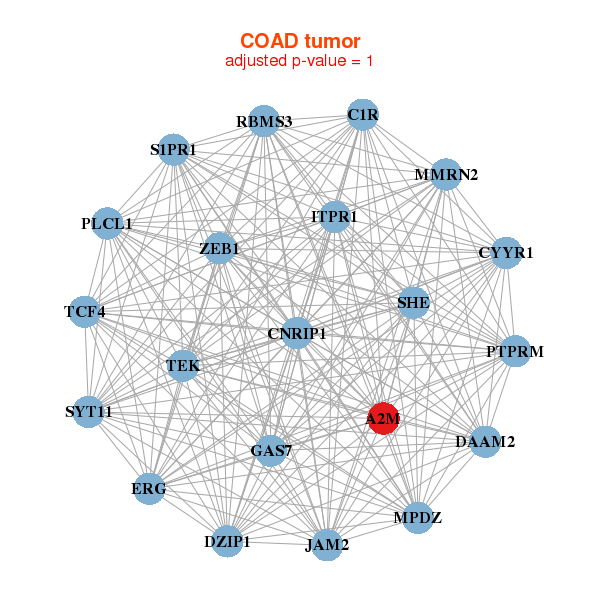
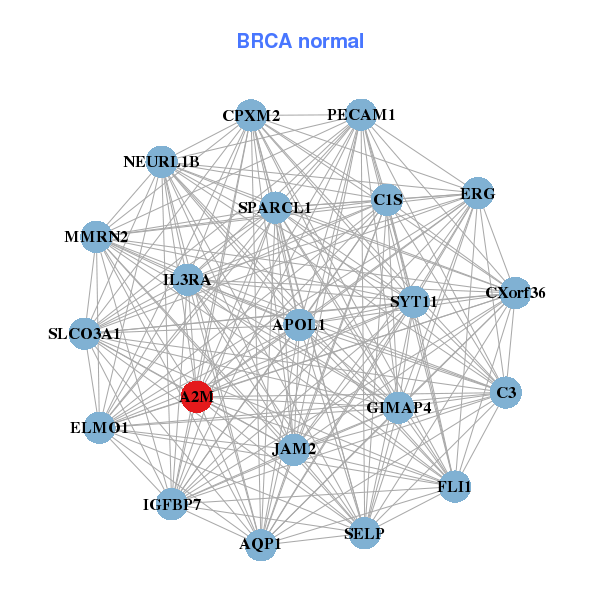
| * Co-Expression network figures were drawn using R package igraph. Only the top 20 genes with the highest correlations were shown. Red circle: input gene, orange circle: cell metabolism gene, sky circle: other gene |
: Open all plots for all cancer types
 |
| ||||
| A2M,ARHGAP31,BOC,CHST3,COL4A2,CSPG4,DPYSL2, EPHB1,ITGA10,ITGA9,KCNMB1,MAML2,MEF2A,MYLK, NPR2,PALM2,PALM2-AKAP2,PAQR8,PDE1C,PLS3,SYNM | A2M,APOL1,AQP1,C1S,C3,CPXM2,CXorf36, ELMO1,ERG,FLI1,GIMAP4,IGFBP7,IL3RA,JAM2, MMRN2,NEURL1B,PECAM1,SELP,SLCO3A1,SPARCL1,SYT11 | ||||
 |
| ||||
| A2M,C1R,CNRIP1,CYYR1,DAAM2,DZIP1,ERG, GAS7,ITPR1,JAM2,MMRN2,MPDZ,PLCL1,PTPRM, RBMS3,S1PR1,SHE,SYT11,TCF4,TEK,ZEB1 | A2M,BCAT1,COLEC12,GPIHBP1,GPR116,GPRC5B,ITGAM, LOXL3,MAN1C1,MMP2,NRP1,PCDH12,PLXND1,PODN, RPS6KA2,SERPINF1,SVEP1,TGFBR2,THBS2,VWF,ZEB2 |
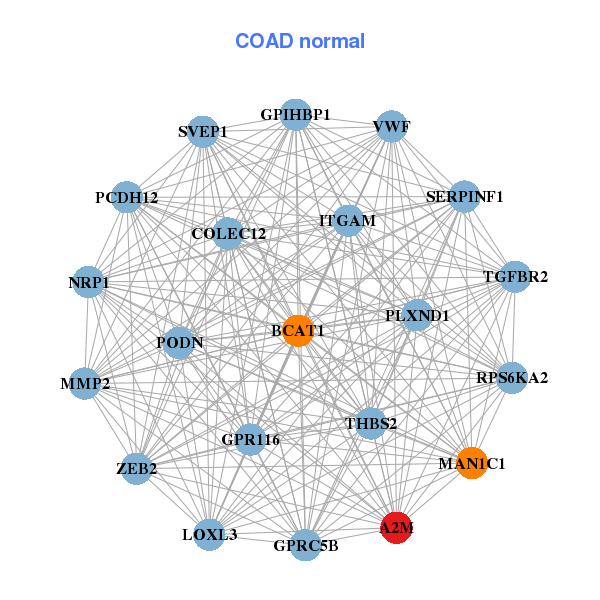
| * Co-Expression network figures were drawn using R package igraph. Only the top 20 genes with the highest correlations were shown. Red circle: input gene, orange circle: cell metabolism gene, sky circle: other gene |
: Open all plots for all cancer types
| Top |
: Open all interacting genes' information including KEGG pathway for all interacting genes from DAVID
| Top |
| Pharmacological Information for A2M |
| DB Category | DB Name | DB's ID and Url link |
| * Gene Centered Interaction Network. |
 |
| * Drug Centered Interaction Network. |
| DrugBank ID | Target Name | Drug Groups | Generic Name | Drug Centered Network | Drug Structure |
| DB00626 | alpha-2-macroglobulin | approved | Bacitracin | 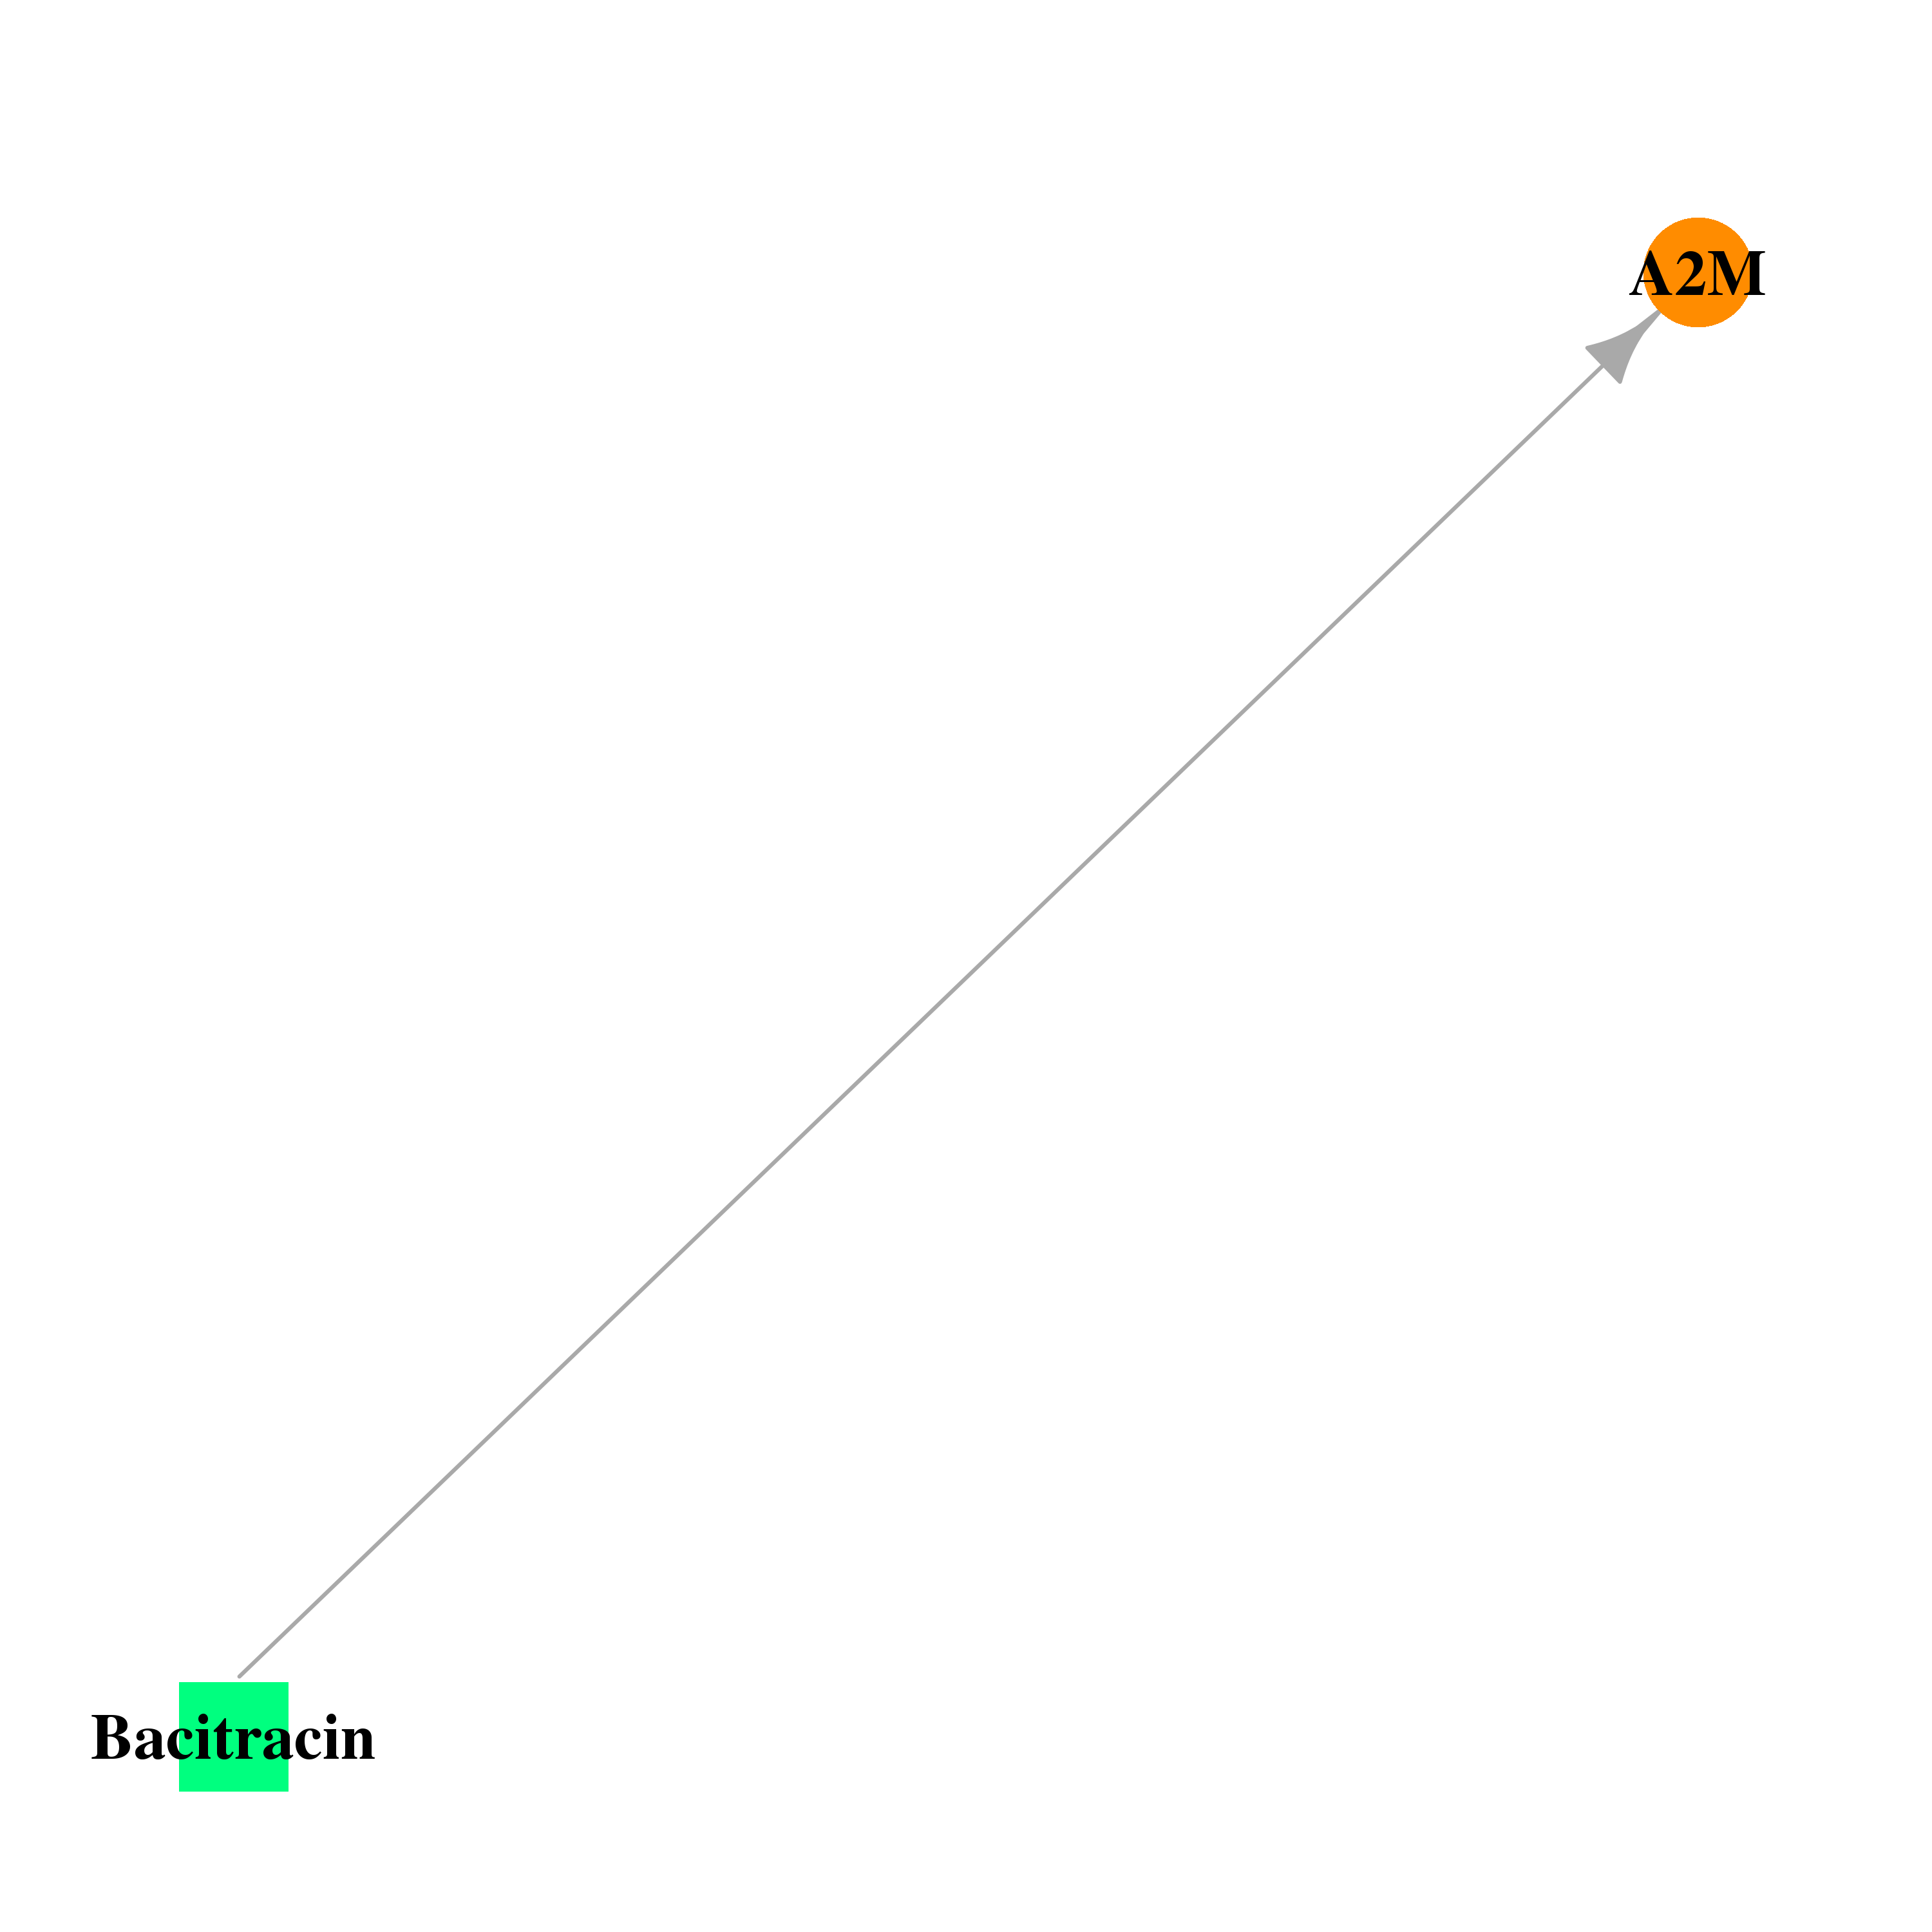 |  |
| Top |
| Cross referenced IDs for A2M |
| * We obtained these cross-references from Uniprot database. It covers 150 different DBs, 18 categories. http://www.uniprot.org/help/cross_references_section |
: Open all cross reference information
|
Copyright © 2016-Present - The Univsersity of Texas Health Science Center at Houston @ |