|
||||||||||||||||||||
| |
| Phenotypic Information (metabolism pathway, cancer, disease, phenome) |
| |
| |
| Gene-Gene Network Information: Co-Expression Network, Interacting Genes & KEGG |
| |
|


| Gene Summary for PLD6 |
| Basic gene info. | Gene symbol | PLD6 |
| Gene name | phospholipase D family, member 6 | |
| Synonyms | ZUC | |
| Cytomap | UCSC genome browser: 17p11.2 | |
| Genomic location | chr17 :17104308-17109646 | |
| Type of gene | protein-coding | |
| RefGenes | NM_178836.3, | |
| Ensembl id | ENSG00000179598 | |
| Description | PLD 6choline phosphatase 6mitoPLDmitochondrial cardiolipin hydrolasemitochondrial phospholipasephosphatidylcholine-hydrolyzing phospholipase D6phospholipase D6protein zucchini homolog | |
| Modification date | 20141207 | |
| dbXrefs | MIM : 614960 | |
| HGNC : HGNC | ||
| Ensembl : ENSG00000179598 | ||
| HPRD : 14126 | ||
| Vega : OTTHUMG00000059278 | ||
| Protein | UniProt: go to UniProt's Cross Reference DB Table | |
| Expression | CleanEX: HS_PLD6 | |
| BioGPS: 201164 | ||
| Gene Expression Atlas: ENSG00000179598 | ||
| The Human Protein Atlas: ENSG00000179598 | ||
| Pathway | NCI Pathway Interaction Database: PLD6 | |
| KEGG: PLD6 | ||
| REACTOME: PLD6 | ||
| ConsensusPathDB | ||
| Pathway Commons: PLD6 | ||
| Metabolism | MetaCyc: PLD6 | |
| HUMANCyc: PLD6 | ||
| Regulation | Ensembl's Regulation: ENSG00000179598 | |
| miRBase: chr17 :17,104,308-17,109,646 | ||
| TargetScan: NM_178836 | ||
| cisRED: ENSG00000179598 | ||
| Context | iHOP: PLD6 | |
| cancer metabolism search in PubMed: PLD6 | ||
| UCL Cancer Institute: PLD6 | ||
| Assigned class in ccmGDB | C | |
| Top |
| Phenotypic Information for PLD6(metabolism pathway, cancer, disease, phenome) |
| Cancer | CGAP: PLD6 |
| Familial Cancer Database: PLD6 | |
| * This gene is included in those cancer gene databases. |
|
|
|
|
|
|
| ||||||||||||||
Oncogene 1 | Significant driver gene in | |||||||||||||||||||
| cf) number; DB name 1 Oncogene; http://nar.oxfordjournals.org/content/35/suppl_1/D721.long, 2 Tumor Suppressor gene; https://bioinfo.uth.edu/TSGene/, 3 Cancer Gene Census; http://www.nature.com/nrc/journal/v4/n3/abs/nrc1299.html, 4 CancerGenes; http://nar.oxfordjournals.org/content/35/suppl_1/D721.long, 5 Network of Cancer Gene; http://ncg.kcl.ac.uk/index.php, 1Therapeutic Vulnerabilities in Cancer; http://cbio.mskcc.org/cancergenomics/statius/ |
| REACTOME_PHOSPHOLIPID_METABOLISM REACTOME_METABOLISM_OF_LIPIDS_AND_LIPOPROTEINS | |
| OMIM | |
| Orphanet | |
| Disease | KEGG Disease: PLD6 |
| MedGen: PLD6 (Human Medical Genetics with Condition) | |
| ClinVar: PLD6 | |
| Phenotype | MGI: PLD6 (International Mouse Phenotyping Consortium) |
| PhenomicDB: PLD6 | |
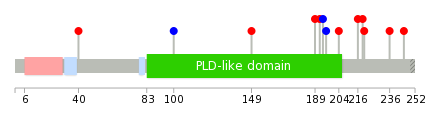
| Mutations for PLD6 |
| * Under tables are showing count per each tissue to give us broad intuition about tissue specific mutation patterns.You can go to the detailed page for each mutation database's web site. |
| There's no structural variation information in COSMIC data for this gene. |
| * From mRNA Sanger sequences, Chitars2.0 arranged chimeric transcripts. This table shows PLD6 related fusion information. |
| ID | Head Gene | Tail Gene | Accession | Gene_a | qStart_a | qEnd_a | Chromosome_a | tStart_a | tEnd_a | Gene_a | qStart_a | qEnd_a | Chromosome_a | tStart_a | tEnd_a |
| BF732578 | PLD6 | 1 | 64 | 17 | 17109569 | 17109632 | TNS1 | 58 | 729 | 2 | 218677091 | 218682697 | |
| BC015725 | PLD6 | 1 | 1829 | 17 | 17116084 | 17124925 | IFNAR1 | 1825 | 1886 | 21 | 34728286 | 34728347 | |
| BI053091 | BMP7 | 34 | 198 | 20 | 55745997 | 55746161 | PLD6 | 192 | 406 | 17 | 17134619 | 17134833 | |
| Top |
| There's no copy number variation information in COSMIC data for this gene. |
| Top |
|
 |
| Top |
| Stat. for Non-Synonymous SNVs (# total SNVs=8) | (# total SNVs=2) |
 |  |
(# total SNVs=0) | (# total SNVs=0) |
| Top |
| * When you move the cursor on each content, you can see more deailed mutation information on the Tooltip. Those are primary_site,primary_histology,mutation(aa),pubmedID. |
| GRCh37 position | Mutation(aa) | Unique sampleID count |
| chr17:17106258-17106258 | p.Y194Y | 1 |
| chr17:17106266-17106266 | p.D192N | 1 |
| chr17:17106274-17106274 | p.T189M | 1 |
| chr17:17106395-17106395 | p.D149N | 1 |
| chr17:17106107-17106107 | p.G245S | 1 |
| chr17:17109301-17109301 | p.A100A | 1 |
| chr17:17106133-17106133 | p.R236K | 1 |
| chr17:17109483-17109483 | p.E40K | 1 |
| chr17:17106180-17106180 | p.K220N | 1 |
| chr17:17109597-17109597 | p.G2* | 1 |
| Top |
|
 |
| Point Mutation/ Tissue ID | 1 | 2 | 3 | 4 | 5 | 6 | 7 | 8 | 9 | 10 | 11 | 12 | 13 | 14 | 15 | 16 | 17 | 18 | 19 | 20 |
| # sample | 1 | 3 | 1 | 1 | 2 | |||||||||||||||
| # mutation | 1 | 3 | 1 | 1 | 2 | |||||||||||||||
| nonsynonymous SNV | 1 | 2 | 1 | 1 | 2 | |||||||||||||||
| synonymous SNV | 1 |
| cf) Tissue ID; Tissue type (1; BLCA[Bladder Urothelial Carcinoma], 2; BRCA[Breast invasive carcinoma], 3; CESC[Cervical squamous cell carcinoma and endocervical adenocarcinoma], 4; COAD[Colon adenocarcinoma], 5; GBM[Glioblastoma multiforme], 6; Glioma Low Grade, 7; HNSC[Head and Neck squamous cell carcinoma], 8; KICH[Kidney Chromophobe], 9; KIRC[Kidney renal clear cell carcinoma], 10; KIRP[Kidney renal papillary cell carcinoma], 11; LAML[Acute Myeloid Leukemia], 12; LUAD[Lung adenocarcinoma], 13; LUSC[Lung squamous cell carcinoma], 14; OV[Ovarian serous cystadenocarcinoma ], 15; PAAD[Pancreatic adenocarcinoma], 16; PRAD[Prostate adenocarcinoma], 17; SKCM[Skin Cutaneous Melanoma], 18:STAD[Stomach adenocarcinoma], 19:THCA[Thyroid carcinoma], 20:UCEC[Uterine Corpus Endometrial Carcinoma]) |
| Top |
| * We represented just top 10 SNVs. When you move the cursor on each content, you can see more deailed mutation information on the Tooltip. Those are primary_site, primary_histology, mutation(aa), pubmedID. |
| Genomic Position | Mutation(aa) | Unique sampleID count |
| chr17:17109483 | p.T189M | 1 |
| chr17:17106133 | p.D149N | 1 |
| chr17:17106185 | p.E40K | 1 |
| chr17:17106194 | p.R236K | 1 |
| chr17:17106258 | p.P219S | 1 |
| chr17:17106266 | p.F216L | 1 |
| chr17:17106274 | p.Y194Y | 1 |
| chr17:17106395 | p.D192N | 1 |
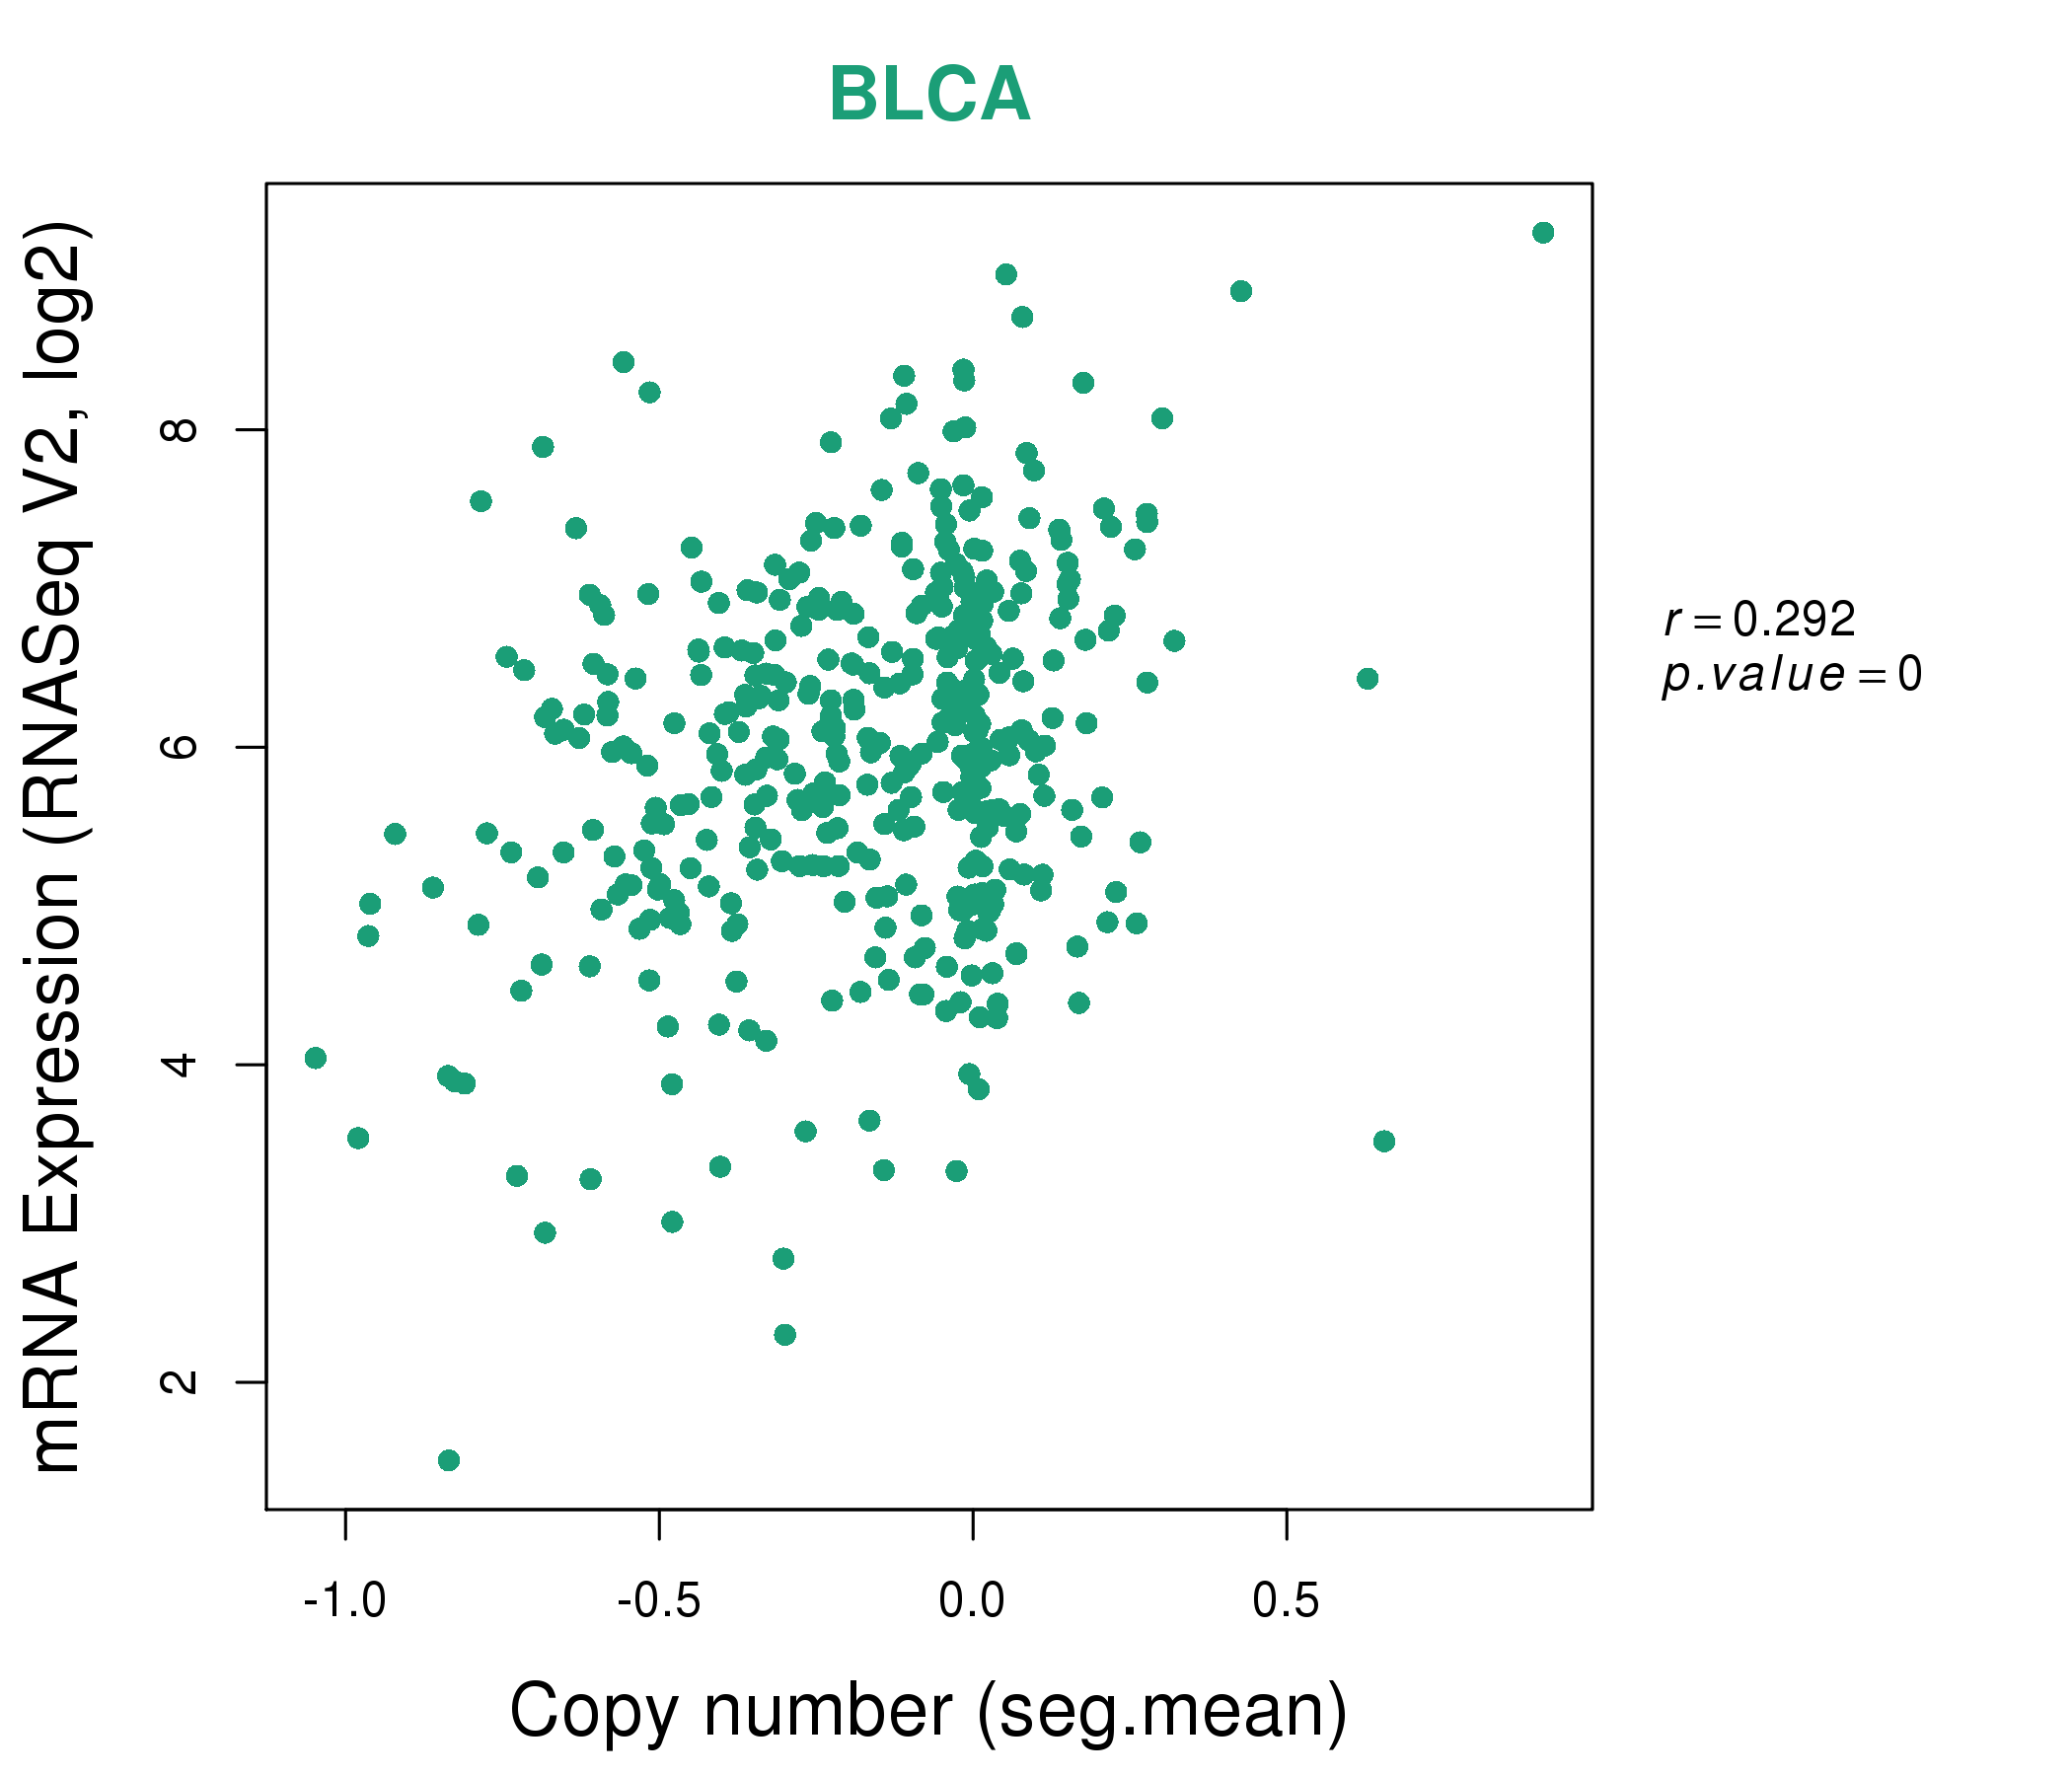
| * Copy number data were extracted from TCGA using R package TCGA-Assembler. The URLs of all public data files on TCGA DCC data server were gathered on Jan-05-2015. Function ProcessCNAData in TCGA-Assembler package was used to obtain gene-level copy number value which is calculated as the average copy number of the genomic region of a gene. |
 |
| cf) Tissue ID[Tissue type]: BLCA[Bladder Urothelial Carcinoma], BRCA[Breast invasive carcinoma], CESC[Cervical squamous cell carcinoma and endocervical adenocarcinoma], COAD[Colon adenocarcinoma], GBM[Glioblastoma multiforme], Glioma Low Grade, HNSC[Head and Neck squamous cell carcinoma], KICH[Kidney Chromophobe], KIRC[Kidney renal clear cell carcinoma], KIRP[Kidney renal papillary cell carcinoma], LAML[Acute Myeloid Leukemia], LUAD[Lung adenocarcinoma], LUSC[Lung squamous cell carcinoma], OV[Ovarian serous cystadenocarcinoma ], PAAD[Pancreatic adenocarcinoma], PRAD[Prostate adenocarcinoma], SKCM[Skin Cutaneous Melanoma], STAD[Stomach adenocarcinoma], THCA[Thyroid carcinoma], UCEC[Uterine Corpus Endometrial Carcinoma] |
| Top |
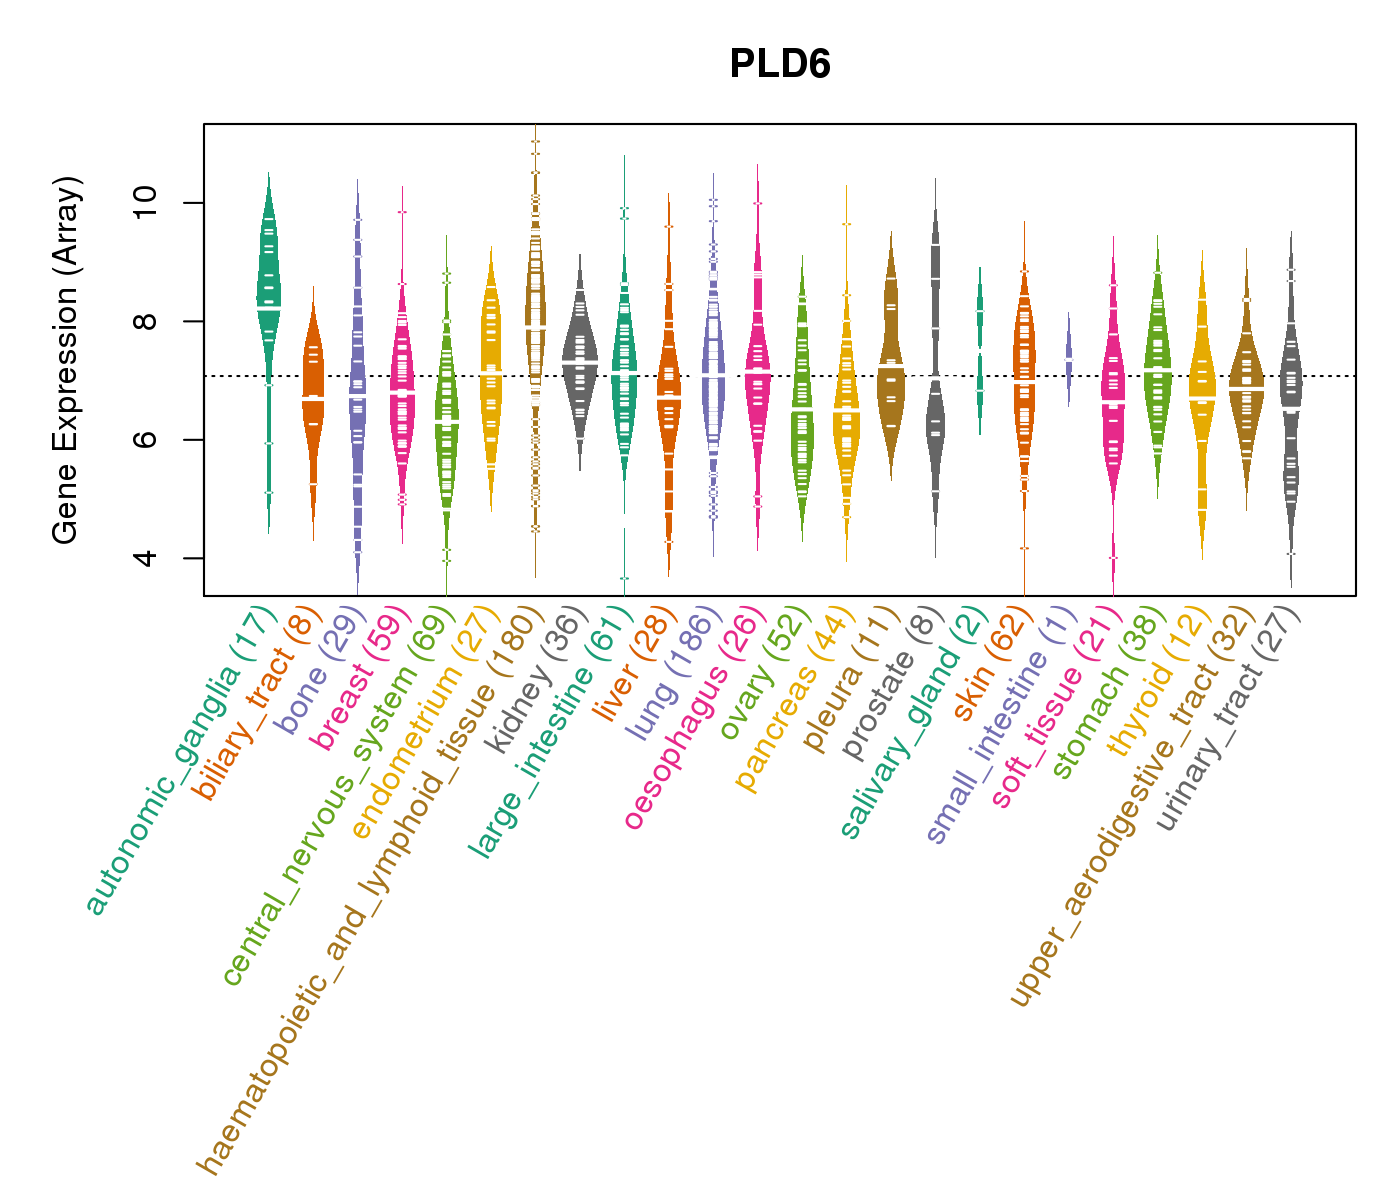
| Gene Expression for PLD6 |
| * CCLE gene expression data were extracted from CCLE_Expression_Entrez_2012-10-18.res: Gene-centric RMA-normalized mRNA expression data. |
 |
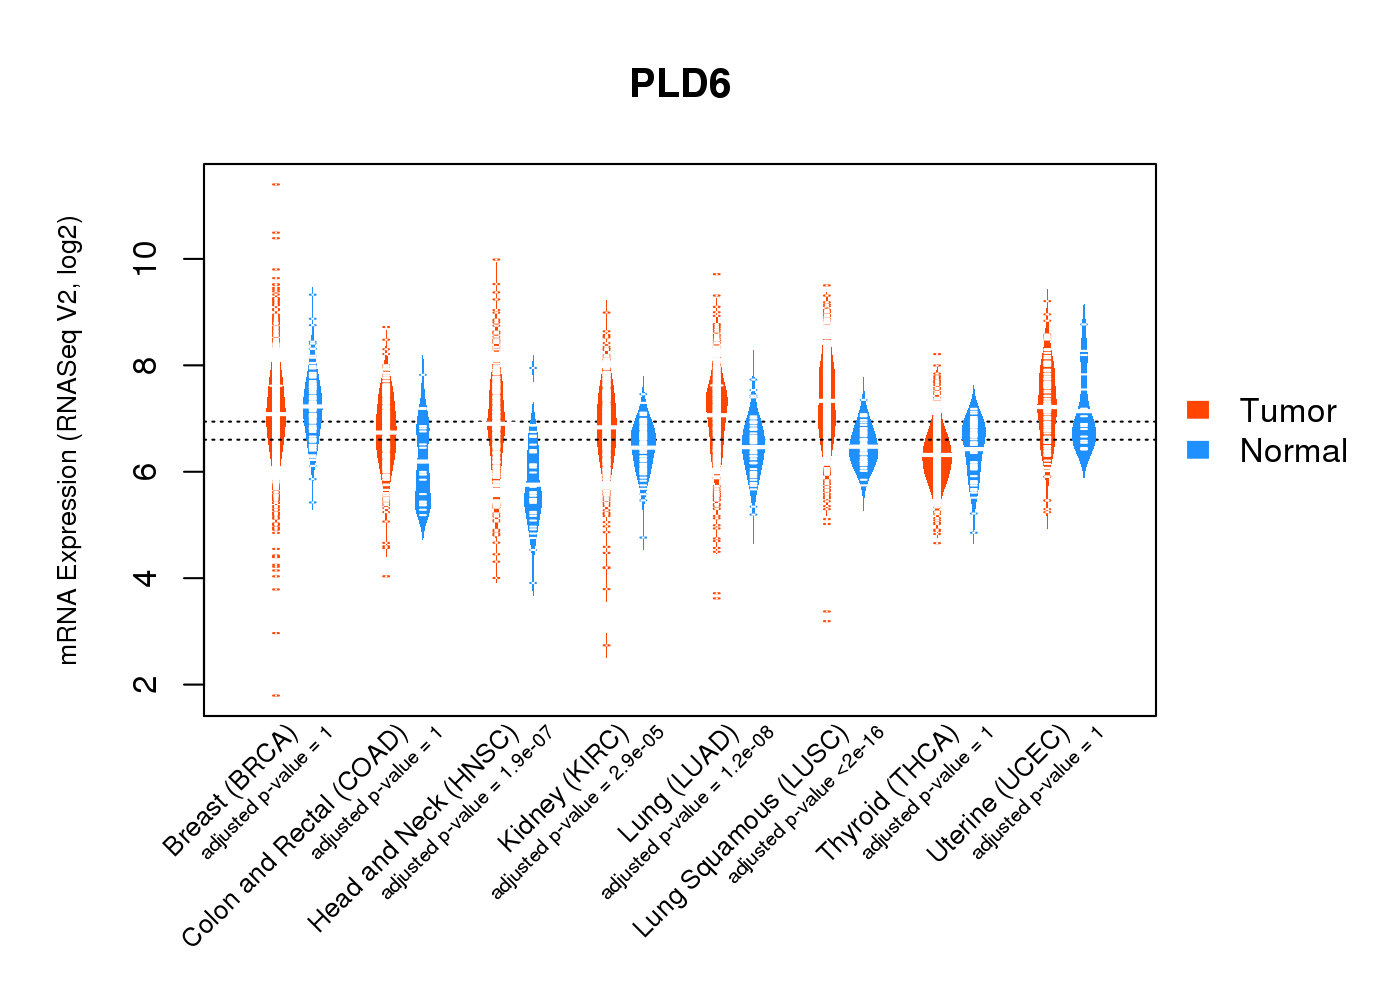
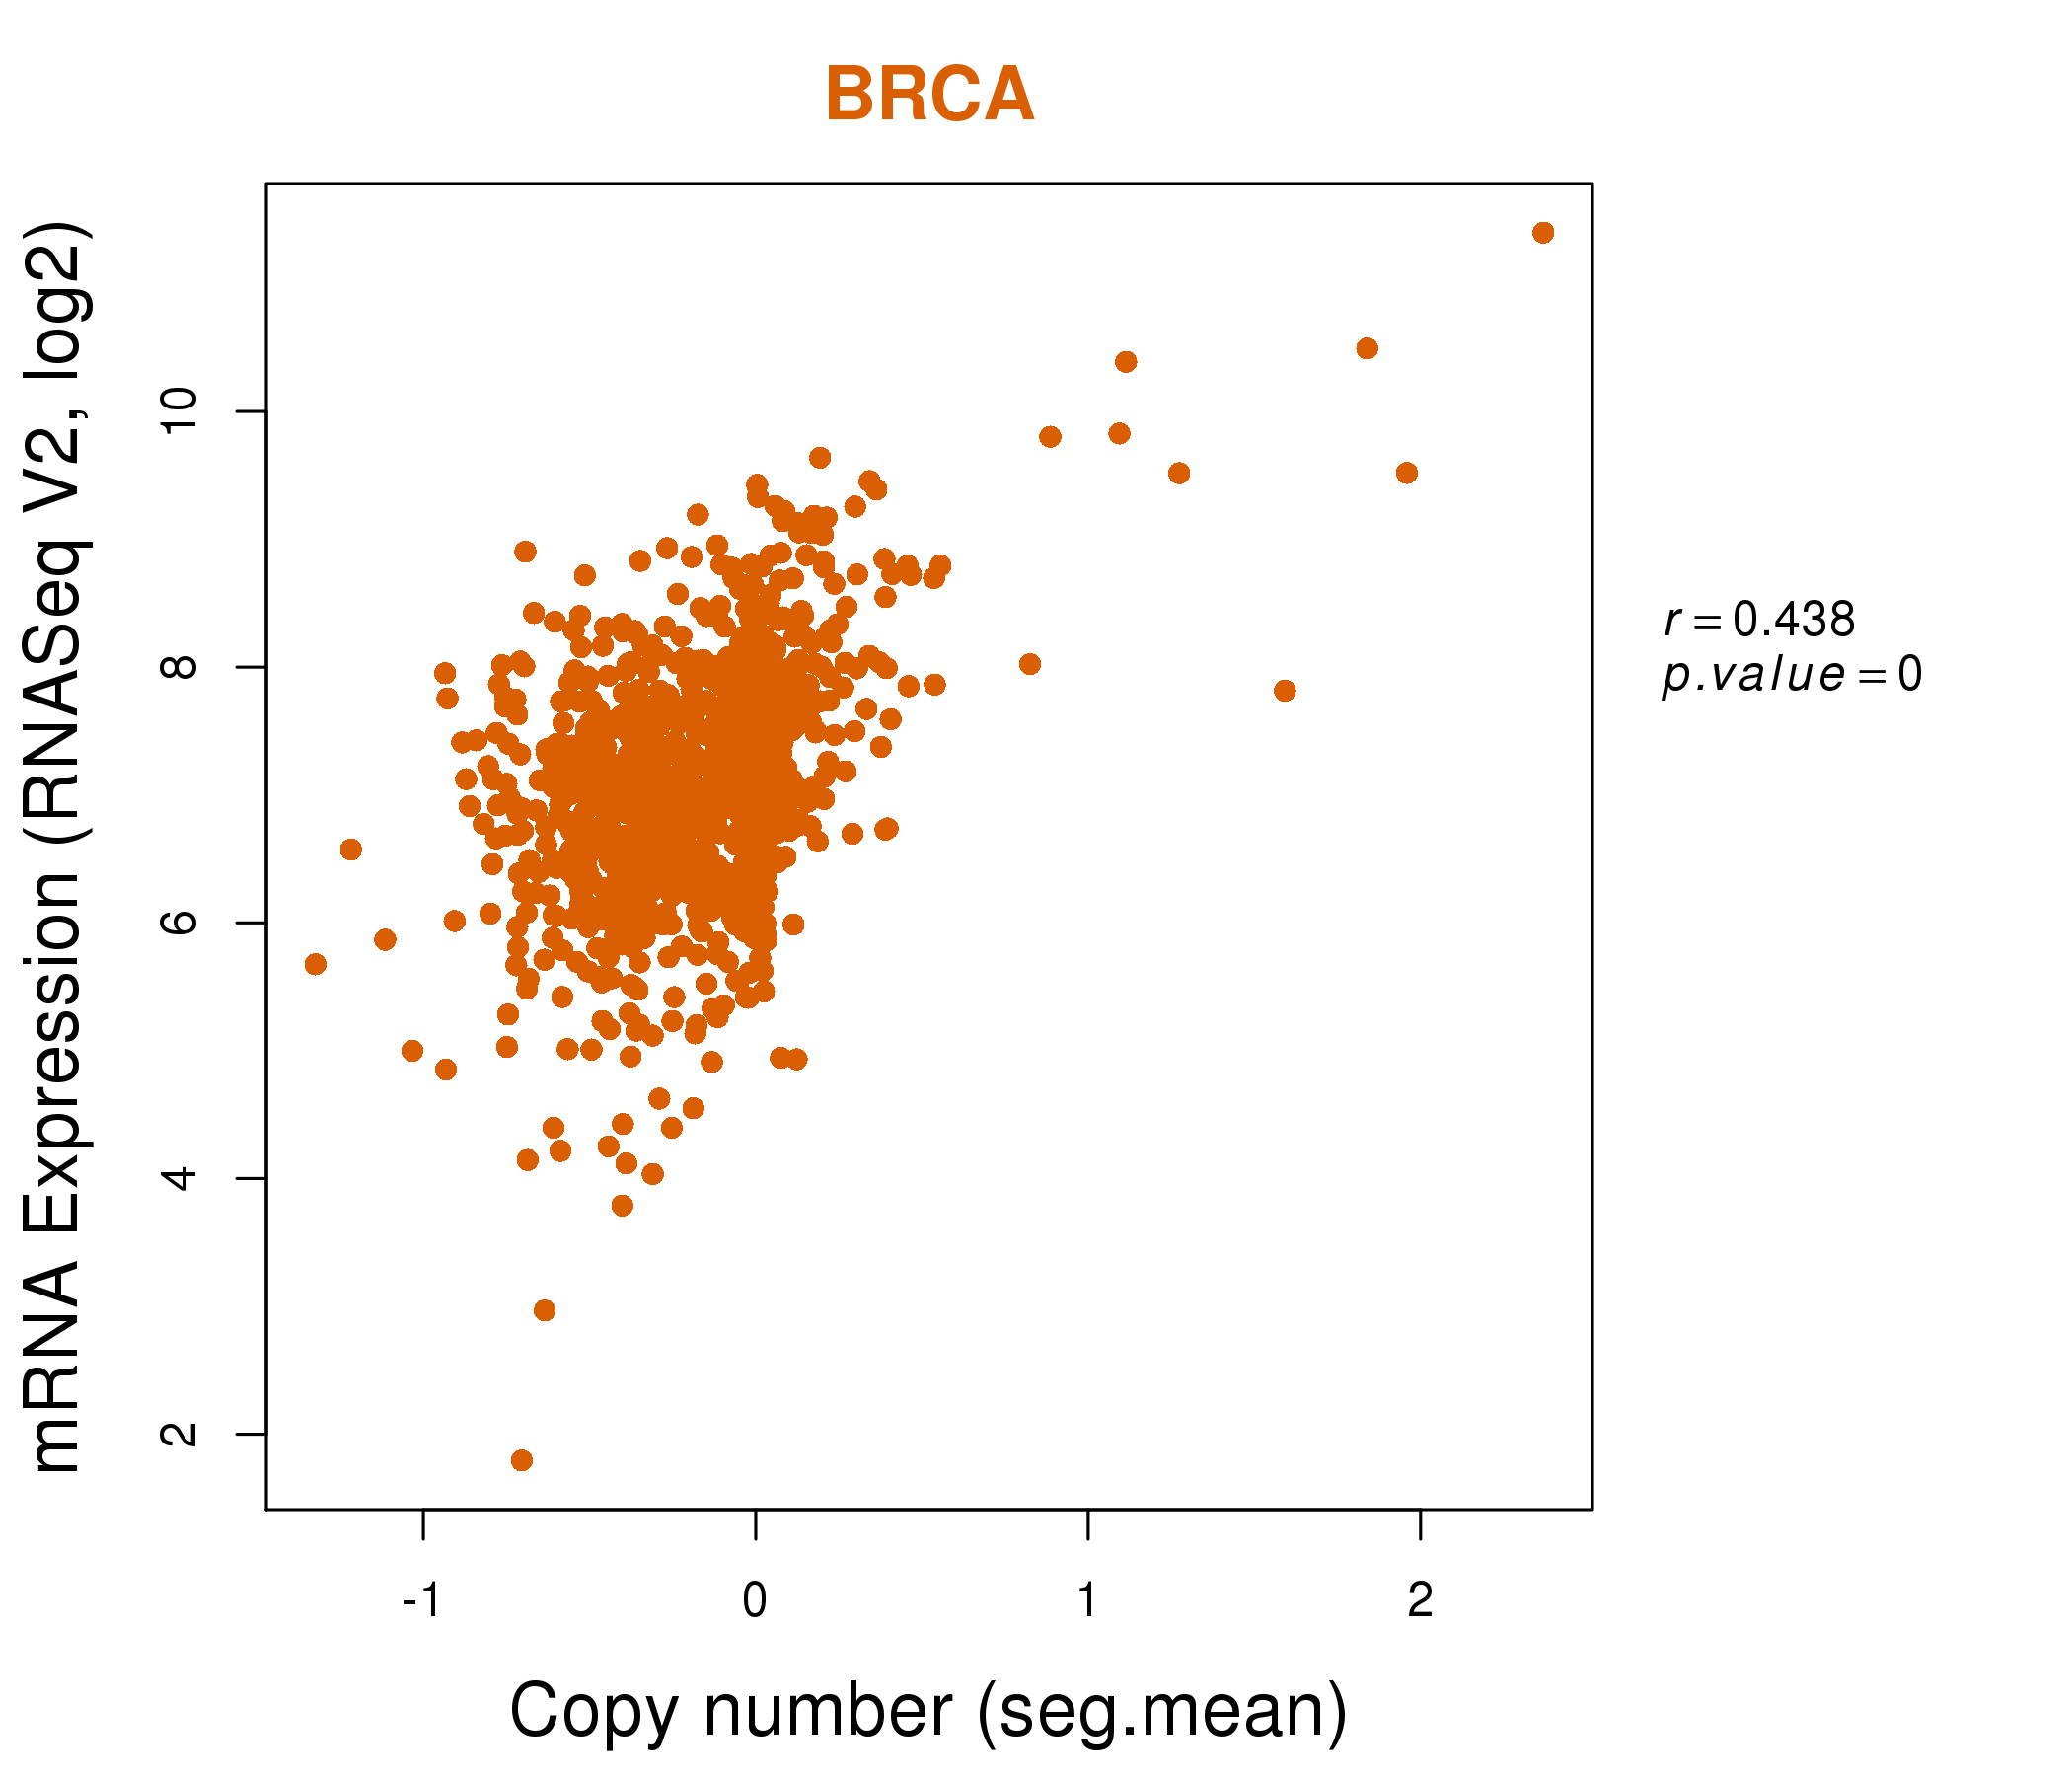
| * Normalized gene expression data of RNASeqV2 was extracted from TCGA using R package TCGA-Assembler. The URLs of all public data files on TCGA DCC data server were gathered at Jan-05-2015. Only eight cancer types have enough normal control samples for differential expression analysis. (t test, adjusted p<0.05 (using Benjamini-Hochberg FDR)) |
 |
| Top |
| * This plots show the correlation between CNV and gene expression. |
: Open all plots for all cancer types
 |
|
 |
|

| Top |
| Gene-Gene Network Information |
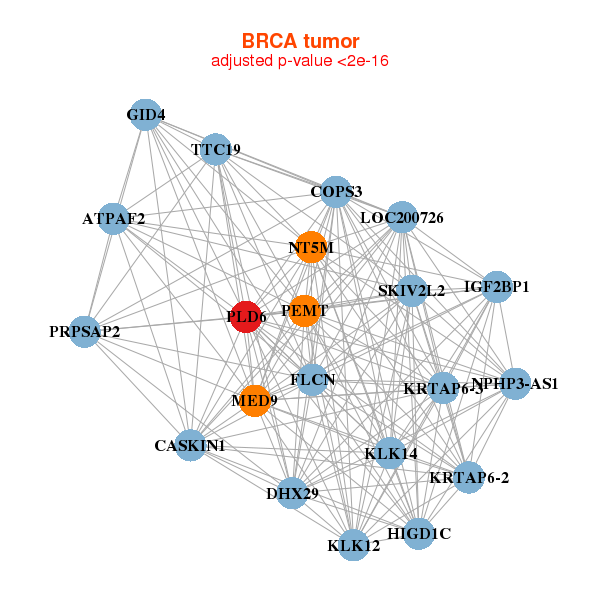
| * Co-Expression network figures were drawn using R package igraph. Only the top 20 genes with the highest correlations were shown. Red circle: input gene, orange circle: cell metabolism gene, sky circle: other gene |
: Open all plots for all cancer types
 |
|
| ATPAF2,GID4,CASKIN1,COPS3,DHX29,FLCN,HIGD1C, IGF2BP1,KLK12,KLK14,KRTAP6-2,KRTAP6-3,LOC200726,MED9, NPHP3-AS1,NT5M,PEMT,PLD6,PRPSAP2,SKIV2L2,TTC19 | ABCD2,ACVR1C,ADIPOQ,FAM219B,CABLES1,CBLN1,CPM, EHHADH,EIF4EBP2,FAM13A,FZD4,GABRE,LPL,PCK1, PDP2,PEX11A,PEX19,PHKA2,PKD1L2,PLD6,SLC7A10 |
 |
|
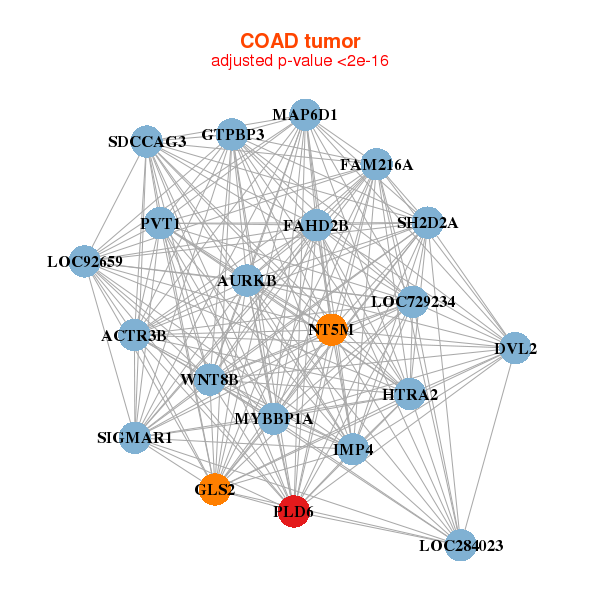
| ACTR3B,AURKB,FAM216A,DVL2,FAHD2B,GLS2,GTPBP3, HTRA2,IMP4,LOC284023,LOC729234,LOC92659,MAP6D1,MYBBP1A, NT5M,PLD6,PVT1,SDCCAG3,SH2D2A,SIGMAR1,WNT8B | CHST10,COPZ2,ENOX1,FIBIN,GNAI2,HAND2,KCNJ8, KLHDC8B,KLHL21,MEOX2,MITF,PELI3,PGM5P2,PHLDA3, PLD6,PPAPDC3,PRDM8,RAB34,TBKBP1,TMEM55A,TTC7B |


| * Co-Expression network figures were drawn using R package igraph. Only the top 20 genes with the highest correlations were shown. Red circle: input gene, orange circle: cell metabolism gene, sky circle: other gene |
: Open all plots for all cancer types
| Top |
: Open all interacting genes' information including KEGG pathway for all interacting genes from DAVID
| Top |
| Pharmacological Information for PLD6 |
| There's no related Drug. |
| Top |
| Cross referenced IDs for PLD6 |
| * We obtained these cross-references from Uniprot database. It covers 150 different DBs, 18 categories. http://www.uniprot.org/help/cross_references_section |
: Open all cross reference information
|
Copyright © 2016-Present - The Univsersity of Texas Health Science Center at Houston @ |