|
|||||||||||||||||||||||||||||||||||||||||||||||||||||||||||||||||||||||||||||||||||||||||||||||||||||||||||||||||||||||||||||||||||||||||||||||||||||||||||||||||||||||||||||||||||||||||||||||||||||||||||||||||||||||||||||||||||||||||||||||||||||||||||||||||||||||||||||||||||||||||||||||||||||||||||||||||||||||||||||||||||||||||||||||||||||||||
| |
| Phenotypic Information (metabolism pathway, cancer, disease, phenome) |
| |
| |
| Gene-Gene Network Information: Co-Expression Network, Interacting Genes & KEGG |
| |
|


| Gene Summary for ENO1 |
| Basic gene info. | Gene symbol | ENO1 |
| Gene name | enolase 1, (alpha) | |
| Synonyms | ENO1L1|MPB1|NNE|PPH | |
| Cytomap | UCSC genome browser: 1p36.2 | |
| Genomic location | chr1 :8921058-8939151 | |
| Type of gene | protein-coding | |
| RefGenes | NM_001201483.1, NM_001428.3, | |
| Ensembl id | ENSG00000074800 | |
| Description | 2-phospho-D-glycerate hydro-lyaseMYC promoter-binding protein 1alpha enolase like 1alpha-enolaseenolase-alphanon-neural enolasephosphopyruvate hydrataseplasminogen-binding proteintau-crystallin | |
| Modification date | 20141222 | |
| dbXrefs | MIM : 172430 | |
| HGNC : HGNC | ||
| Ensembl : ENSG00000074800 | ||
| HPRD : 01400 | ||
| Vega : OTTHUMG00000001773 | ||
| Protein | UniProt: P06733 go to UniProt's Cross Reference DB Table | |
| Expression | CleanEX: HS_ENO1 | |
| BioGPS: 2023 | ||
| Gene Expression Atlas: ENSG00000074800 | ||
| The Human Protein Atlas: ENSG00000074800 | ||
| Pathway | NCI Pathway Interaction Database: ENO1 | |
| KEGG: ENO1 | ||
| REACTOME: ENO1 | ||
| ConsensusPathDB | ||
| Pathway Commons: ENO1 | ||
| Metabolism | MetaCyc: ENO1 | |
| HUMANCyc: ENO1 | ||
| Regulation | Ensembl's Regulation: ENSG00000074800 | |
| miRBase: chr1 :8,921,058-8,939,151 | ||
| TargetScan: NM_001201483 | ||
| cisRED: ENSG00000074800 | ||
| Context | iHOP: ENO1 | |
| cancer metabolism search in PubMed: ENO1 | ||
| UCL Cancer Institute: ENO1 | ||
| Assigned class in ccmGDB | A - This gene has a literature evidence and it belongs to cancer gene. | |
| References showing role of ENO1 in cancer cell metabolism | 1. Bobrovnikova-Marjon E, Hurov JB (2014) Targeting metabolic changes in cancer: novel therapeutic approaches. Annu Rev Med 65: 157-170. doi: 10.1146/annurev-med-092012-112344. go to article 2. Konieczna A, Szczepanska A, Sawiuk K, Wegrzyn G, Lyzen R (2015) Effects of partial silencing of genes coding for enzymes involved in glycolysis and tricarboxylic acid cycle on the enterance of human fibroblasts to the S phase. BMC Cell Biol 16: 16. doi: 10.1186/s12860-015-0062-8. pmid: 4446904. go to article 3. Fu QF, Liu Y, Fan Y, Hua SN, Qu HY, et al. (2015) Alpha-enolase promotes cell glycolysis, growth, migration, and invasion in non-small cell lung cancer through FAK-mediated PI3K/AKT pathway. J Hematol Oncol 8: 22. doi: 10.1186/s13045-015-0117-5. pmid: 4359783. go to article 4. Muller FL, Colla S, Aquilanti E, Manzo VE, Genovese G, et al. (2012) Passenger deletions generate therapeutic vulnerabilities in cancer. Nature 488: 337-342. doi: 10.1038/nature11331. pmid: 3712624. go to article 5. Migneco G, Whitaker-Menezes D, Chiavarina B, Castello-Cros R, Pavlides S, et al. (2010) Glycolytic cancer associated fibroblasts promote breast cancer tumor growth, without a measurable increase in angiogenesis: evidence for stromal-epithelial metabolic coupling. Cell Cycle 9: 2412-2422. go to article | |
| Top |
| Phenotypic Information for ENO1(metabolism pathway, cancer, disease, phenome) |
| Cancer | CGAP: ENO1 |
| Familial Cancer Database: ENO1 | |
| * This gene is included in those cancer gene databases. |
|
|
|
|
|
|
| |||||||||||||||||||||||||||||||||||||||||||||||||||||||||||||||||||||||||||||||||||||||||||||||||||||||||||||||||||||||||||||||||||||||||||||||||||||||||||||||||||||||||||||||||||||||||||||||||||||||||||||||||||||||||||||||||||||||||||||||||||||||||||||||||||||||||||||||||||||||||||||||||||||||||||||||||||||||||||||||||||||||||||||||||||
Oncogene 1 | Significant driver gene in | ||||||||||||||||||||||||||||||||||||||||||||||||||||||||||||||||||||||||||||||||||||||||||||||||||||||||||||||||||||||||||||||||||||||||||||||||||||||||||||||||||||||||||||||||||||||||||||||||||||||||||||||||||||||||||||||||||||||||||||||||||||||||||||||||||||||||||||||||||||||||||||||||||||||||||||||||||||||||||||||||||||||||||||||||||||||||
| cf) number; DB name 1 Oncogene; http://nar.oxfordjournals.org/content/35/suppl_1/D721.long, 2 Tumor Suppressor gene; https://bioinfo.uth.edu/TSGene/, 3 Cancer Gene Census; http://www.nature.com/nrc/journal/v4/n3/abs/nrc1299.html, 4 CancerGenes; http://nar.oxfordjournals.org/content/35/suppl_1/D721.long, 5 Network of Cancer Gene; http://ncg.kcl.ac.uk/index.php, 1Therapeutic Vulnerabilities in Cancer; http://cbio.mskcc.org/cancergenomics/statius/ |
| KEGG_GLYCOLYSIS_GLUCONEOGENESIS BIOCARTA_GLYCOLYSIS_PATHWAY REACTOME_METABOLISM_OF_CARBOHYDRATES REACTOME_GLUCOSE_METABOLISM | |
| OMIM | 172430; gene. 172430; gene. |
| Orphanet | |
| Disease | KEGG Disease: ENO1 |
| MedGen: ENO1 (Human Medical Genetics with Condition) | |
| ClinVar: ENO1 | |
| Phenotype | MGI: ENO1 (International Mouse Phenotyping Consortium) |
| PhenomicDB: ENO1 | |
| Mutations for ENO1 |
| * Under tables are showing count per each tissue to give us broad intuition about tissue specific mutation patterns.You can go to the detailed page for each mutation database's web site. |
| - Statistics for Tissue and Mutation type | Top |
 |
| - For Inter-chromosomal Variations |
| There's no inter-chromosomal structural variation. |
| - For Intra-chromosomal Variations |
| * Intra-chromosomal variantions includes 'intrachromosomal amplicon to amplicon', 'intrachromosomal amplicon to non-amplified dna', 'intrachromosomal deletion', 'intrachromosomal fold-back inversion', 'intrachromosomal inversion', 'intrachromosomal tandem duplication', 'Intrachromosomal unknown type', 'intrachromosomal with inverted orientation', 'intrachromosomal with non-inverted orientation'. |
 |
| Sample | Symbol_a | Chr_a | Start_a | End_a | Symbol_b | Chr_b | Start_b | End_b |
| ovary | ENO1 | chr1 | 8937630 | 8937650 | chr1 | 8891596 | 8891616 | |
| pancreas | ENO1 | chr1 | 8933320 | 8933320 | CAPZB | chr1 | 19703969 | 19703969 |
| cf) Tissue number; Tissue name (1;Breast, 2;Central_nervous_system, 3;Haematopoietic_and_lymphoid_tissue, 4;Large_intestine, 5;Liver, 6;Lung, 7;Ovary, 8;Pancreas, 9;Prostate, 10;Skin, 11;Soft_tissue, 12;Upper_aerodigestive_tract) |
| * From mRNA Sanger sequences, Chitars2.0 arranged chimeric transcripts. This table shows ENO1 related fusion information. |
| ID | Head Gene | Tail Gene | Accession | Gene_a | qStart_a | qEnd_a | Chromosome_a | tStart_a | tEnd_a | Gene_a | qStart_a | qEnd_a | Chromosome_a | tStart_a | tEnd_a |
| AW362574 | ENO1 | 1 | 54 | 1 | 8926432 | 8926485 | COL4A2 | 49 | 159 | 13 | 111121594 | 111125307 | |
| BM015435 | ENO1 | 1 | 302 | 1 | 8926441 | 8928094 | CCDC90A | 294 | 636 | 6 | 13787862 | 13788202 | |
| DA702843 | IFI16 | 1 | 78 | 1 | 158979716 | 158979793 | ENO1 | 79 | 508 | 1 | 8928047 | 8938749 | |
| BU192820 | IQCG | 42 | 479 | 3 | 197677812 | 197682722 | ENO1 | 474 | 800 | 1 | 8925376 | 8926493 | |
| AY703046 | AKNA | 1 | 2234 | 9 | 117098442 | 117122378 | ENO1 | 2235 | 2315 | 1 | 8938650 | 8938730 | |
| BG611652 | ENO1 | 2 | 398 | 1 | 8928076 | 8938745 | MAPRE1 | 398 | 750 | 20 | 31424542 | 31434538 | |
| BQ940416 | ESYT2 | 1 | 577 | 7 | 158524160 | 158524736 | ENO1 | 577 | 720 | 1 | 8938643 | 8938785 | |
| AK090592 | CCDC58 | 1 | 552 | 3 | 122078635 | 122102074 | ENO1 | 551 | 2328 | 1 | 8921063 | 8938746 | |
| CR993092 | EXOSC6 | 1 | 226 | 16 | 70285575 | 70285799 | ENO1 | 222 | 560 | 1 | 8927188 | 8932037 | |
| BQ292604 | ENO1 | 22 | 452 | 1 | 8926394 | 8930570 | RPA1 | 451 | 562 | 17 | 1783837 | 1783948 | |
| AA157183 | LGMN | 1 | 85 | 14 | 93214868 | 93214953 | ENO1 | 86 | 422 | 1 | 8928060 | 8938673 | |
| AW074340 | ENO1 | 3 | 156 | 1 | 8921067 | 8921220 | APP | 152 | 362 | 21 | 27253998 | 27264161 | |
| CA419890 | ENO1 | 20 | 127 | 1 | 8923347 | 8924001 | ENO1 | 122 | 550 | 1 | 8923961 | 8926377 | |
| BE268890 | ICAM2 | 43 | 175 | 17 | 62084059 | 62097977 | ENO1 | 175 | 455 | 1 | 8931949 | 8938728 | |
| DA665291 | LOC100507412 | 1 | 106 | ? | 112074 | 112179 | ENO1 | 106 | 513 | 1 | 8928063 | 8938743 | |
| BG389117 | ARHGDIB | 1 | 461 | 12 | 15097711 | 15114517 | ENO1 | 462 | 746 | 1 | 8931542 | 8938731 | |
| BG036247 | ENO1 | 1 | 271 | 1 | 8921208 | 8921478 | ENO1 | 266 | 431 | 1 | 8921064 | 8921229 | |
| U88968 | ENO1 | 1 | 1169 | 1 | 8921062 | 8926511 | ENO1 | 1169 | 1346 | 1 | 8934884 | 8938723 | |
| BQ360948 | ENO1 | 9 | 85 | 1 | 8921255 | 8921333 | ENO1 | 80 | 150 | 1 | 8921166 | 8921235 | |
| BQ646179 | ENO1 | 39 | 575 | 1 | 8921061 | 8923343 | CCT7 | 575 | 790 | 2 | 73461450 | 73466921 | |
| BF926899 | SPTBN1 | 1 | 144 | 2 | 54894747 | 54895594 | ENO1 | 131 | 323 | 1 | 8931100 | 8931292 | |
| BE267696 | ICAM2 | 43 | 178 | 17 | 62084057 | 62097977 | ENO1 | 178 | 570 | 1 | 8928063 | 8938728 | |
| AW882184 | ENO1 | 13 | 184 | 1 | 8921371 | 8923000 | ENO1 | 174 | 236 | 1 | 8923302 | 8923364 | |
| CN406714 | ENO1 | 16 | 171 | 1 | 8934881 | 8938698 | ENO1 | 168 | 611 | 1 | 8926450 | 8932019 | |
| BI088704 | ENO1 | 18 | 73 | 1 | 8921238 | 8921293 | ENO1 | 72 | 251 | 1 | 8921064 | 8921242 | |
| BI023233 | SAAL1 | 4 | 228 | 11 | 18103075 | 18103299 | ENO1 | 221 | 303 | 1 | 8921085 | 8921167 | |
| Top |
| Mutation type/ Tissue ID | brca | cns | cerv | endome | haematopo | kidn | Lintest | liver | lung | ns | ovary | pancre | prost | skin | stoma | thyro | urina | |||
| Total # sample | 1 | 1 | ||||||||||||||||||
| GAIN (# sample) | ||||||||||||||||||||
| LOSS (# sample) | 1 | 1 |
| cf) Tissue ID; Tissue type (1; Breast, 2; Central_nervous_system, 3; Cervix, 4; Endometrium, 5; Haematopoietic_and_lymphoid_tissue, 6; Kidney, 7; Large_intestine, 8; Liver, 9; Lung, 10; NS, 11; Ovary, 12; Pancreas, 13; Prostate, 14; Skin, 15; Stomach, 16; Thyroid, 17; Urinary_tract) |
| Top |
|
 |
| Top |
| Stat. for Non-Synonymous SNVs (# total SNVs=18) | (# total SNVs=14) |
 |  |
(# total SNVs=1) | (# total SNVs=0) |
 |
| Top |
| * When you move the cursor on each content, you can see more deailed mutation information on the Tooltip. Those are primary_site,primary_histology,mutation(aa),pubmedID. |
| GRCh37 position | Mutation(aa) | Unique sampleID count |
| chr1:8922989-8922989 | p.P398S | 2 |
| chr1:8928072-8928072 | p.I95I | 2 |
| chr1:8924018-8924018 | p.N333N | 2 |
| chr1:8927294-8927294 | p.N109S | 1 |
| chr1:8922979-8922979 | p.S401F | 1 |
| chr1:8925441-8925441 | p.K256N | 1 |
| chr1:8932046-8932046 | p.? | 1 |
| chr1:8926394-8926394 | p.A204V | 1 |
| chr1:8927296-8927296 | p.A108A | 1 |
| chr1:8922984-8922984 | p.C399C | 1 |
| Top |
|
 |
| Point Mutation/ Tissue ID | 1 | 2 | 3 | 4 | 5 | 6 | 7 | 8 | 9 | 10 | 11 | 12 | 13 | 14 | 15 | 16 | 17 | 18 | 19 | 20 |
| # sample | 2 | 1 | 7 | 1 | 1 | 2 | 5 | 2 | 2 | 5 | 6 | |||||||||
| # mutation | 2 | 1 | 6 | 1 | 1 | 2 | 5 | 2 | 1 | 5 | 7 | |||||||||
| nonsynonymous SNV | 1 | 1 | 3 | 1 | 2 | 4 | 1 | 3 | 5 | |||||||||||
| synonymous SNV | 1 | 3 | 1 | 1 | 2 | 2 | 2 |
| cf) Tissue ID; Tissue type (1; BLCA[Bladder Urothelial Carcinoma], 2; BRCA[Breast invasive carcinoma], 3; CESC[Cervical squamous cell carcinoma and endocervical adenocarcinoma], 4; COAD[Colon adenocarcinoma], 5; GBM[Glioblastoma multiforme], 6; Glioma Low Grade, 7; HNSC[Head and Neck squamous cell carcinoma], 8; KICH[Kidney Chromophobe], 9; KIRC[Kidney renal clear cell carcinoma], 10; KIRP[Kidney renal papillary cell carcinoma], 11; LAML[Acute Myeloid Leukemia], 12; LUAD[Lung adenocarcinoma], 13; LUSC[Lung squamous cell carcinoma], 14; OV[Ovarian serous cystadenocarcinoma ], 15; PAAD[Pancreatic adenocarcinoma], 16; PRAD[Prostate adenocarcinoma], 17; SKCM[Skin Cutaneous Melanoma], 18:STAD[Stomach adenocarcinoma], 19:THCA[Thyroid carcinoma], 20:UCEC[Uterine Corpus Endometrial Carcinoma]) |
| Top |
| * We represented just top 10 SNVs. When you move the cursor on each content, you can see more deailed mutation information on the Tooltip. Those are primary_site, primary_histology, mutation(aa), pubmedID. |
| Genomic Position | Mutation(aa) | Unique sampleID count |
| chr1:8928072 | p.P305S,ENO1 | 2 |
| chr1:8922989 | p.I2I,ENO1 | 2 |
| chr1:8934961 | p.M72I,ENO1 | 1 |
| chr1:8923329 | p.L24L | 1 |
| chr1:8926394 | p.N47S,ENO1 | 1 |
| chr1:8927294 | p.I3V | 1 |
| chr1:8923352 | p.I288F,ENO1 | 1 |
| chr1:8926457 | p.A45T,ENO1 | 1 |
| chr1:8927297 | p.S280L,ENO1 | 1 |
| chr1:8924010 | p.I41I,ENO1 | 1 |
| * Copy number data were extracted from TCGA using R package TCGA-Assembler. The URLs of all public data files on TCGA DCC data server were gathered on Jan-05-2015. Function ProcessCNAData in TCGA-Assembler package was used to obtain gene-level copy number value which is calculated as the average copy number of the genomic region of a gene. |
 |
| cf) Tissue ID[Tissue type]: BLCA[Bladder Urothelial Carcinoma], BRCA[Breast invasive carcinoma], CESC[Cervical squamous cell carcinoma and endocervical adenocarcinoma], COAD[Colon adenocarcinoma], GBM[Glioblastoma multiforme], Glioma Low Grade, HNSC[Head and Neck squamous cell carcinoma], KICH[Kidney Chromophobe], KIRC[Kidney renal clear cell carcinoma], KIRP[Kidney renal papillary cell carcinoma], LAML[Acute Myeloid Leukemia], LUAD[Lung adenocarcinoma], LUSC[Lung squamous cell carcinoma], OV[Ovarian serous cystadenocarcinoma ], PAAD[Pancreatic adenocarcinoma], PRAD[Prostate adenocarcinoma], SKCM[Skin Cutaneous Melanoma], STAD[Stomach adenocarcinoma], THCA[Thyroid carcinoma], UCEC[Uterine Corpus Endometrial Carcinoma] |
| Top |
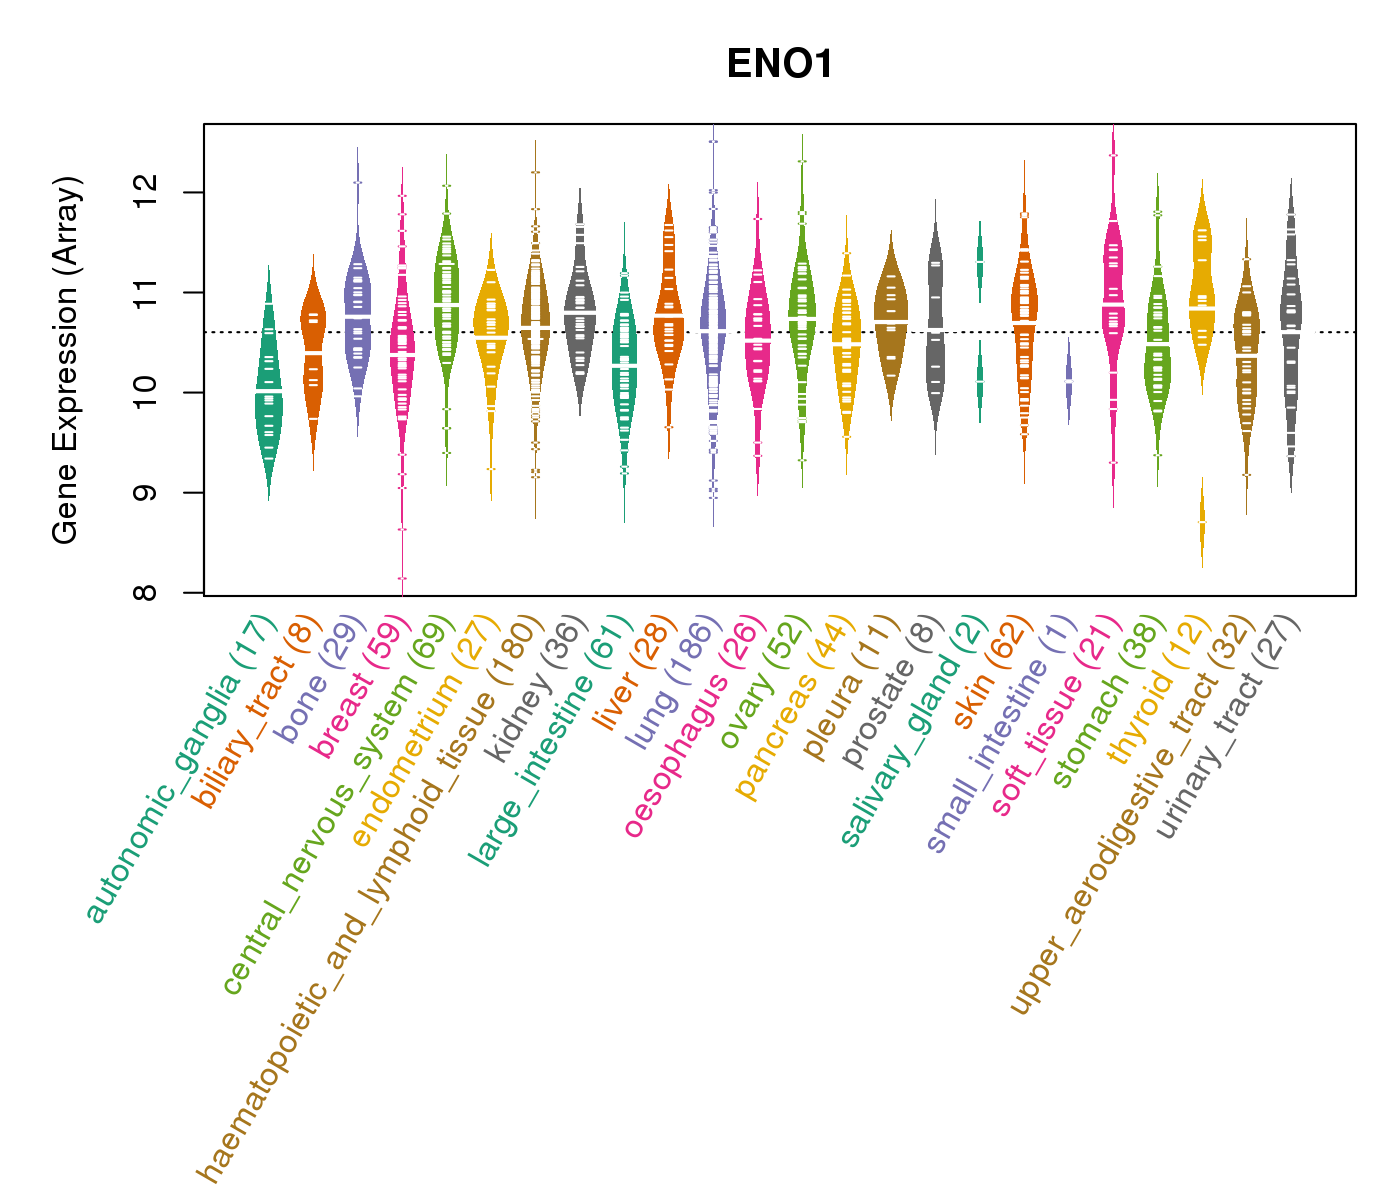
| Gene Expression for ENO1 |
| * CCLE gene expression data were extracted from CCLE_Expression_Entrez_2012-10-18.res: Gene-centric RMA-normalized mRNA expression data. |
 |
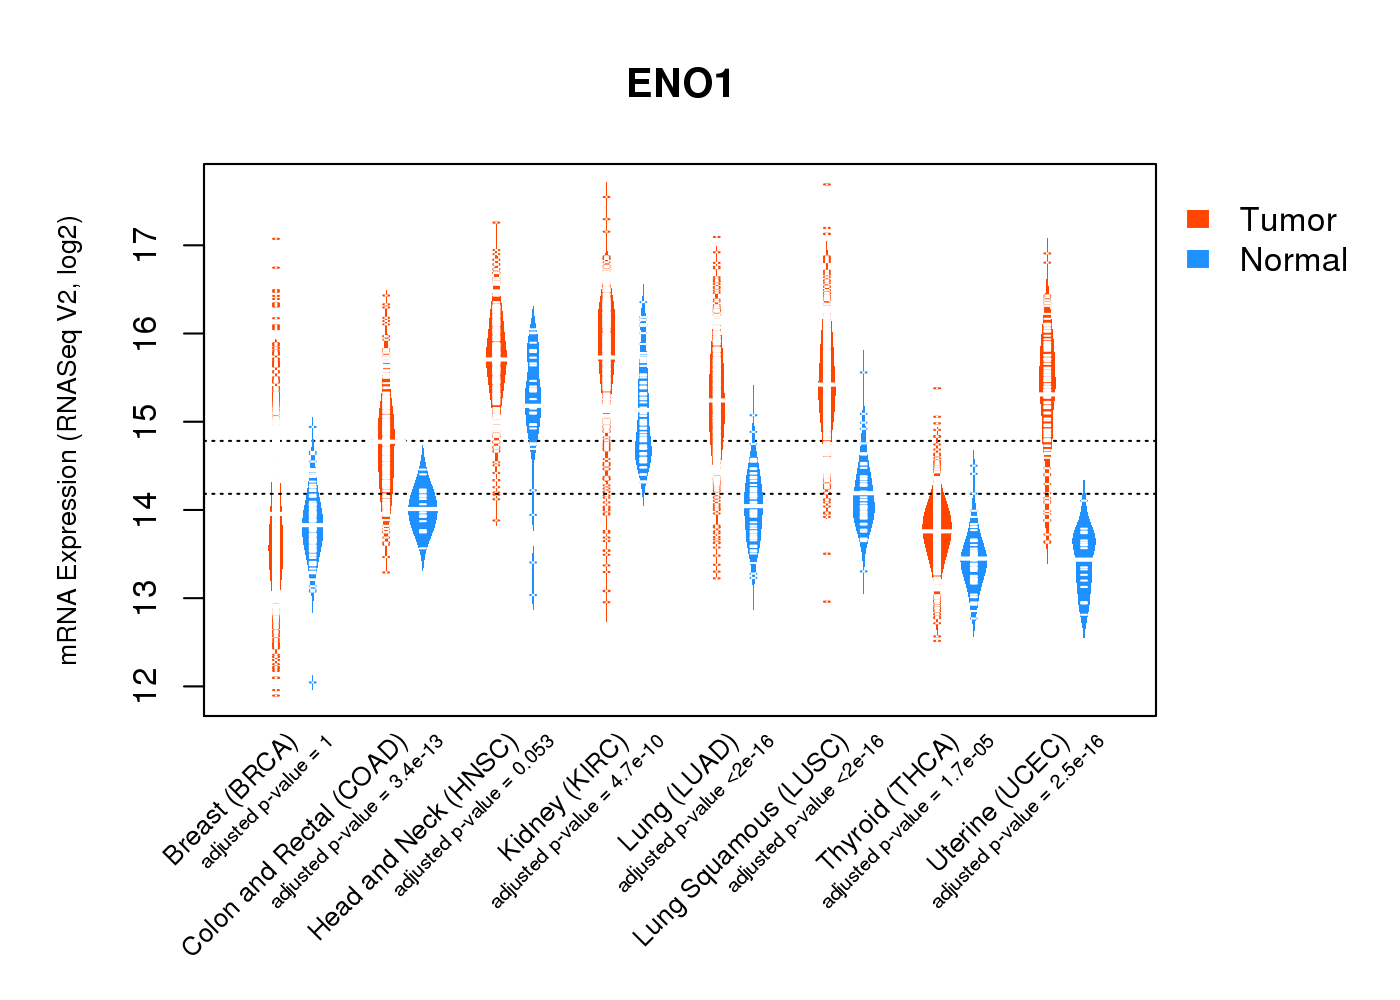
| * Normalized gene expression data of RNASeqV2 was extracted from TCGA using R package TCGA-Assembler. The URLs of all public data files on TCGA DCC data server were gathered at Jan-05-2015. Only eight cancer types have enough normal control samples for differential expression analysis. (t test, adjusted p<0.05 (using Benjamini-Hochberg FDR)) |
 |
| Top |
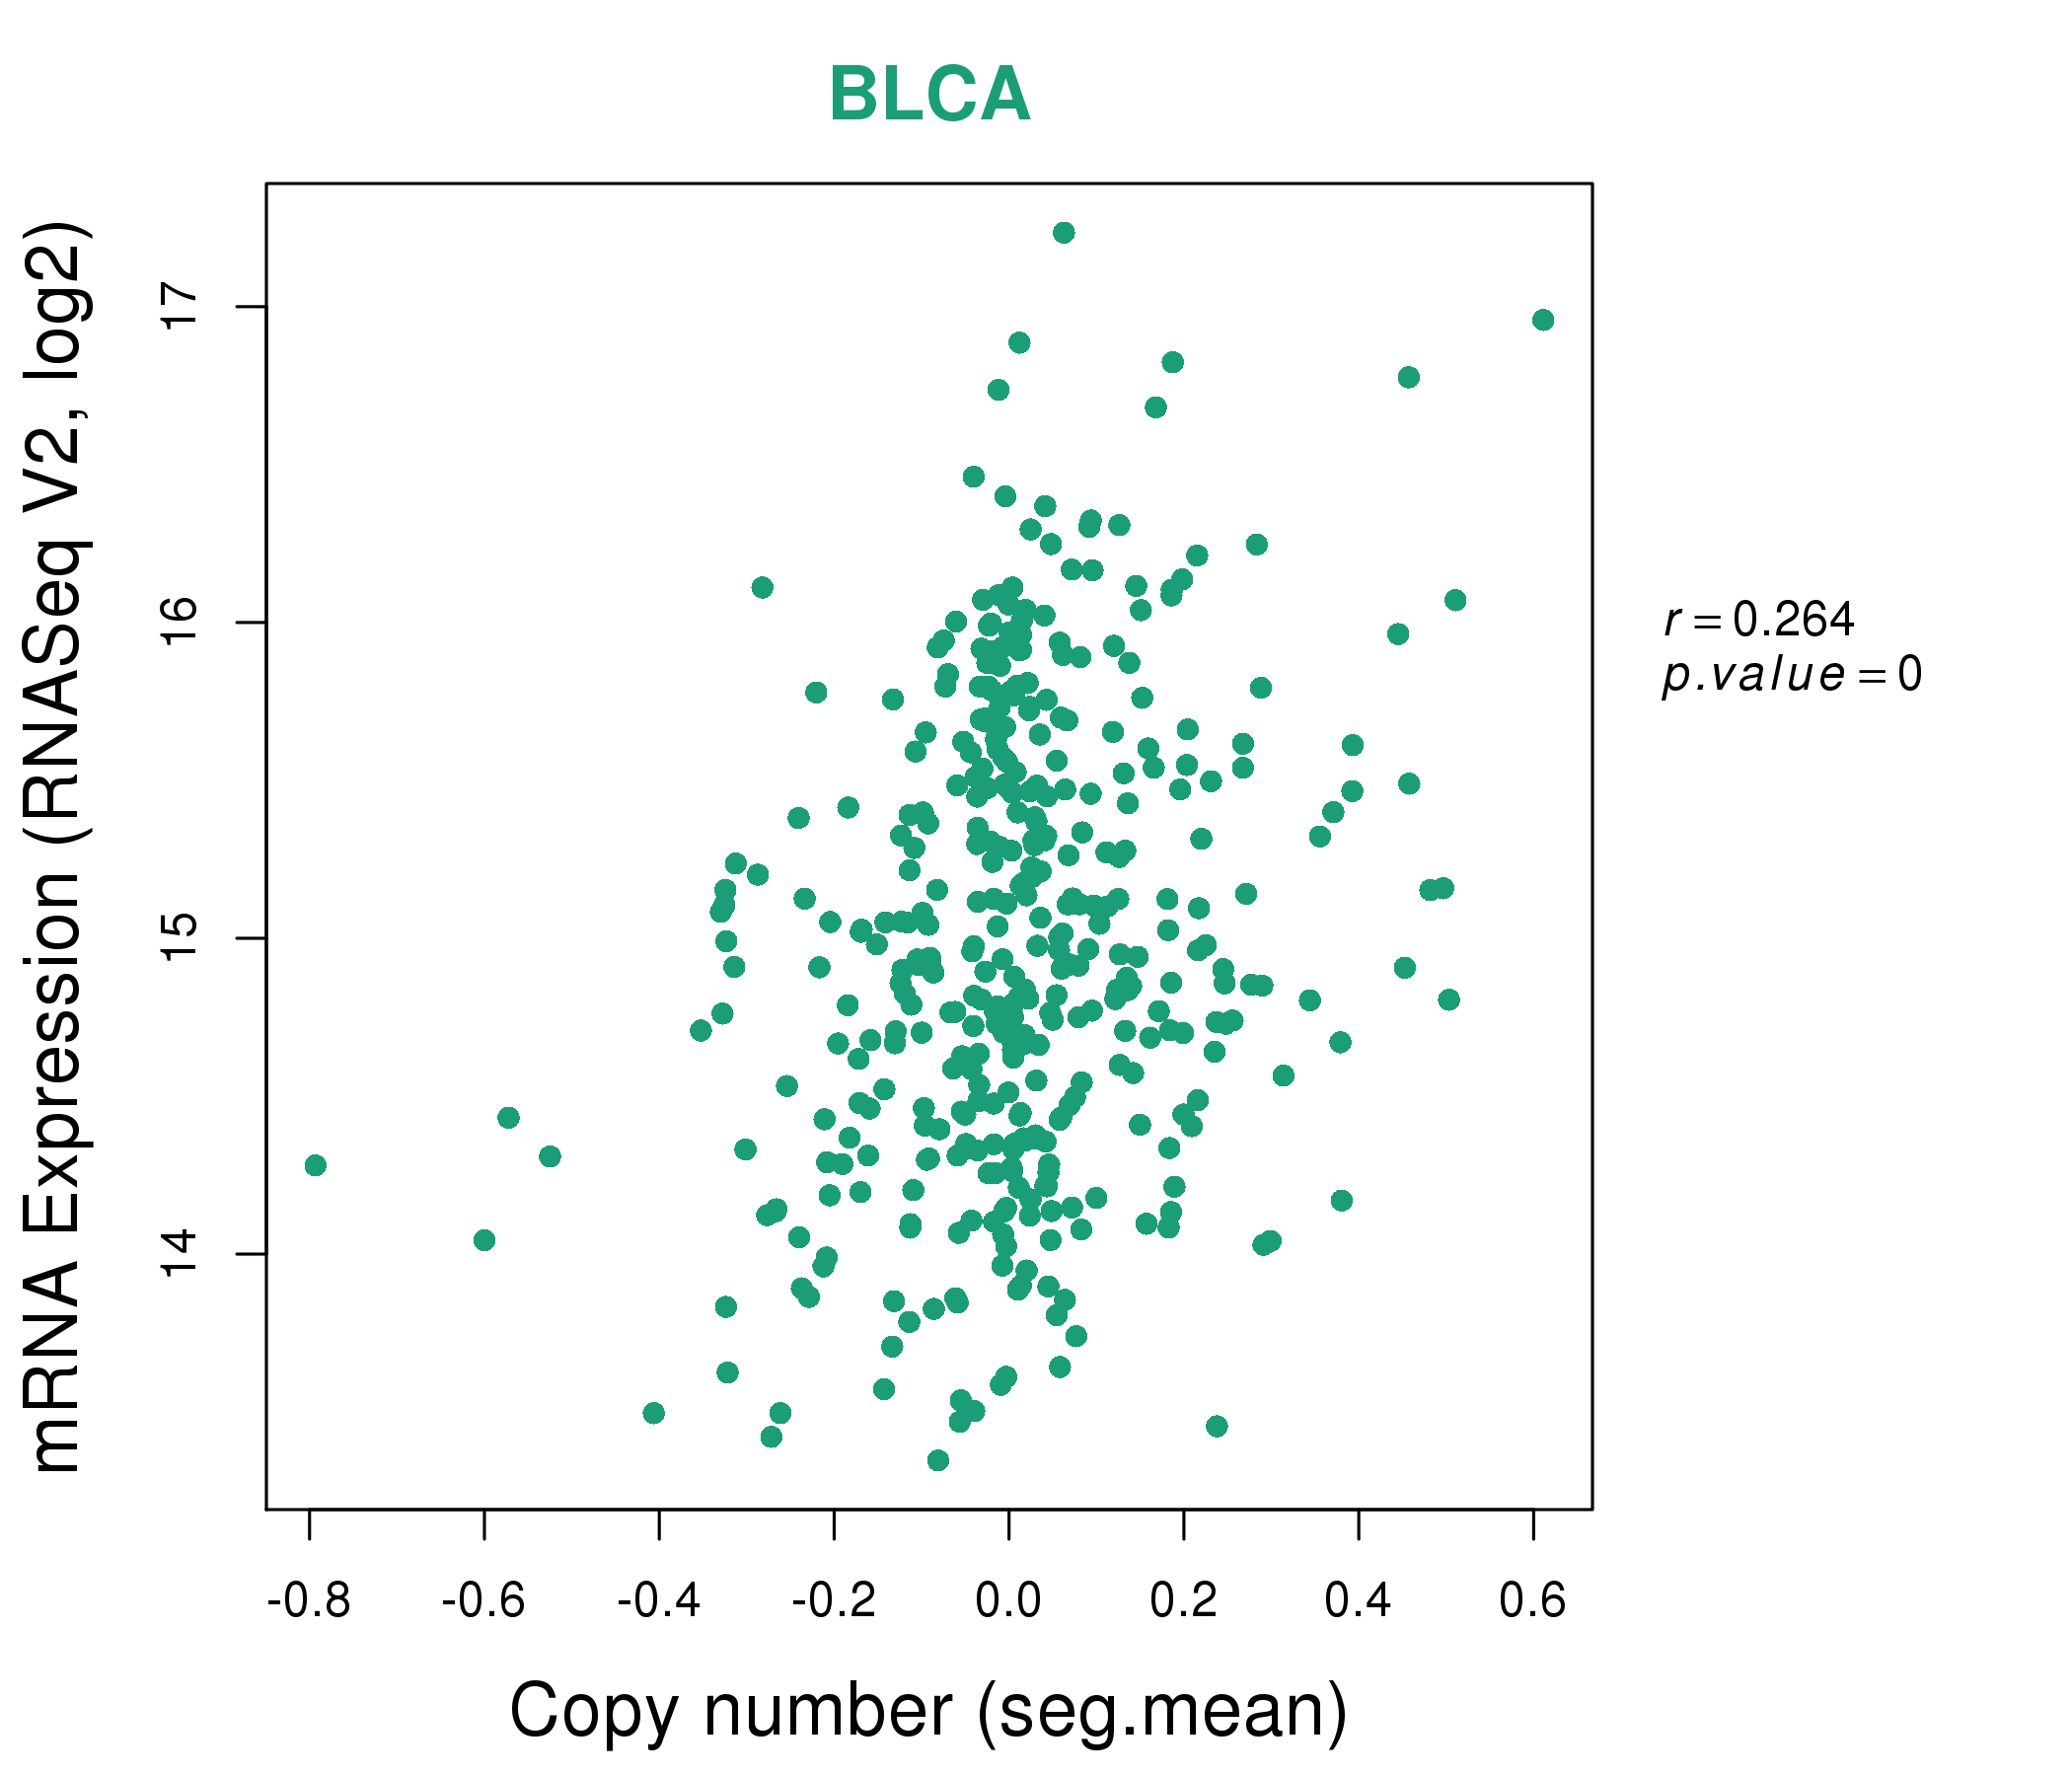
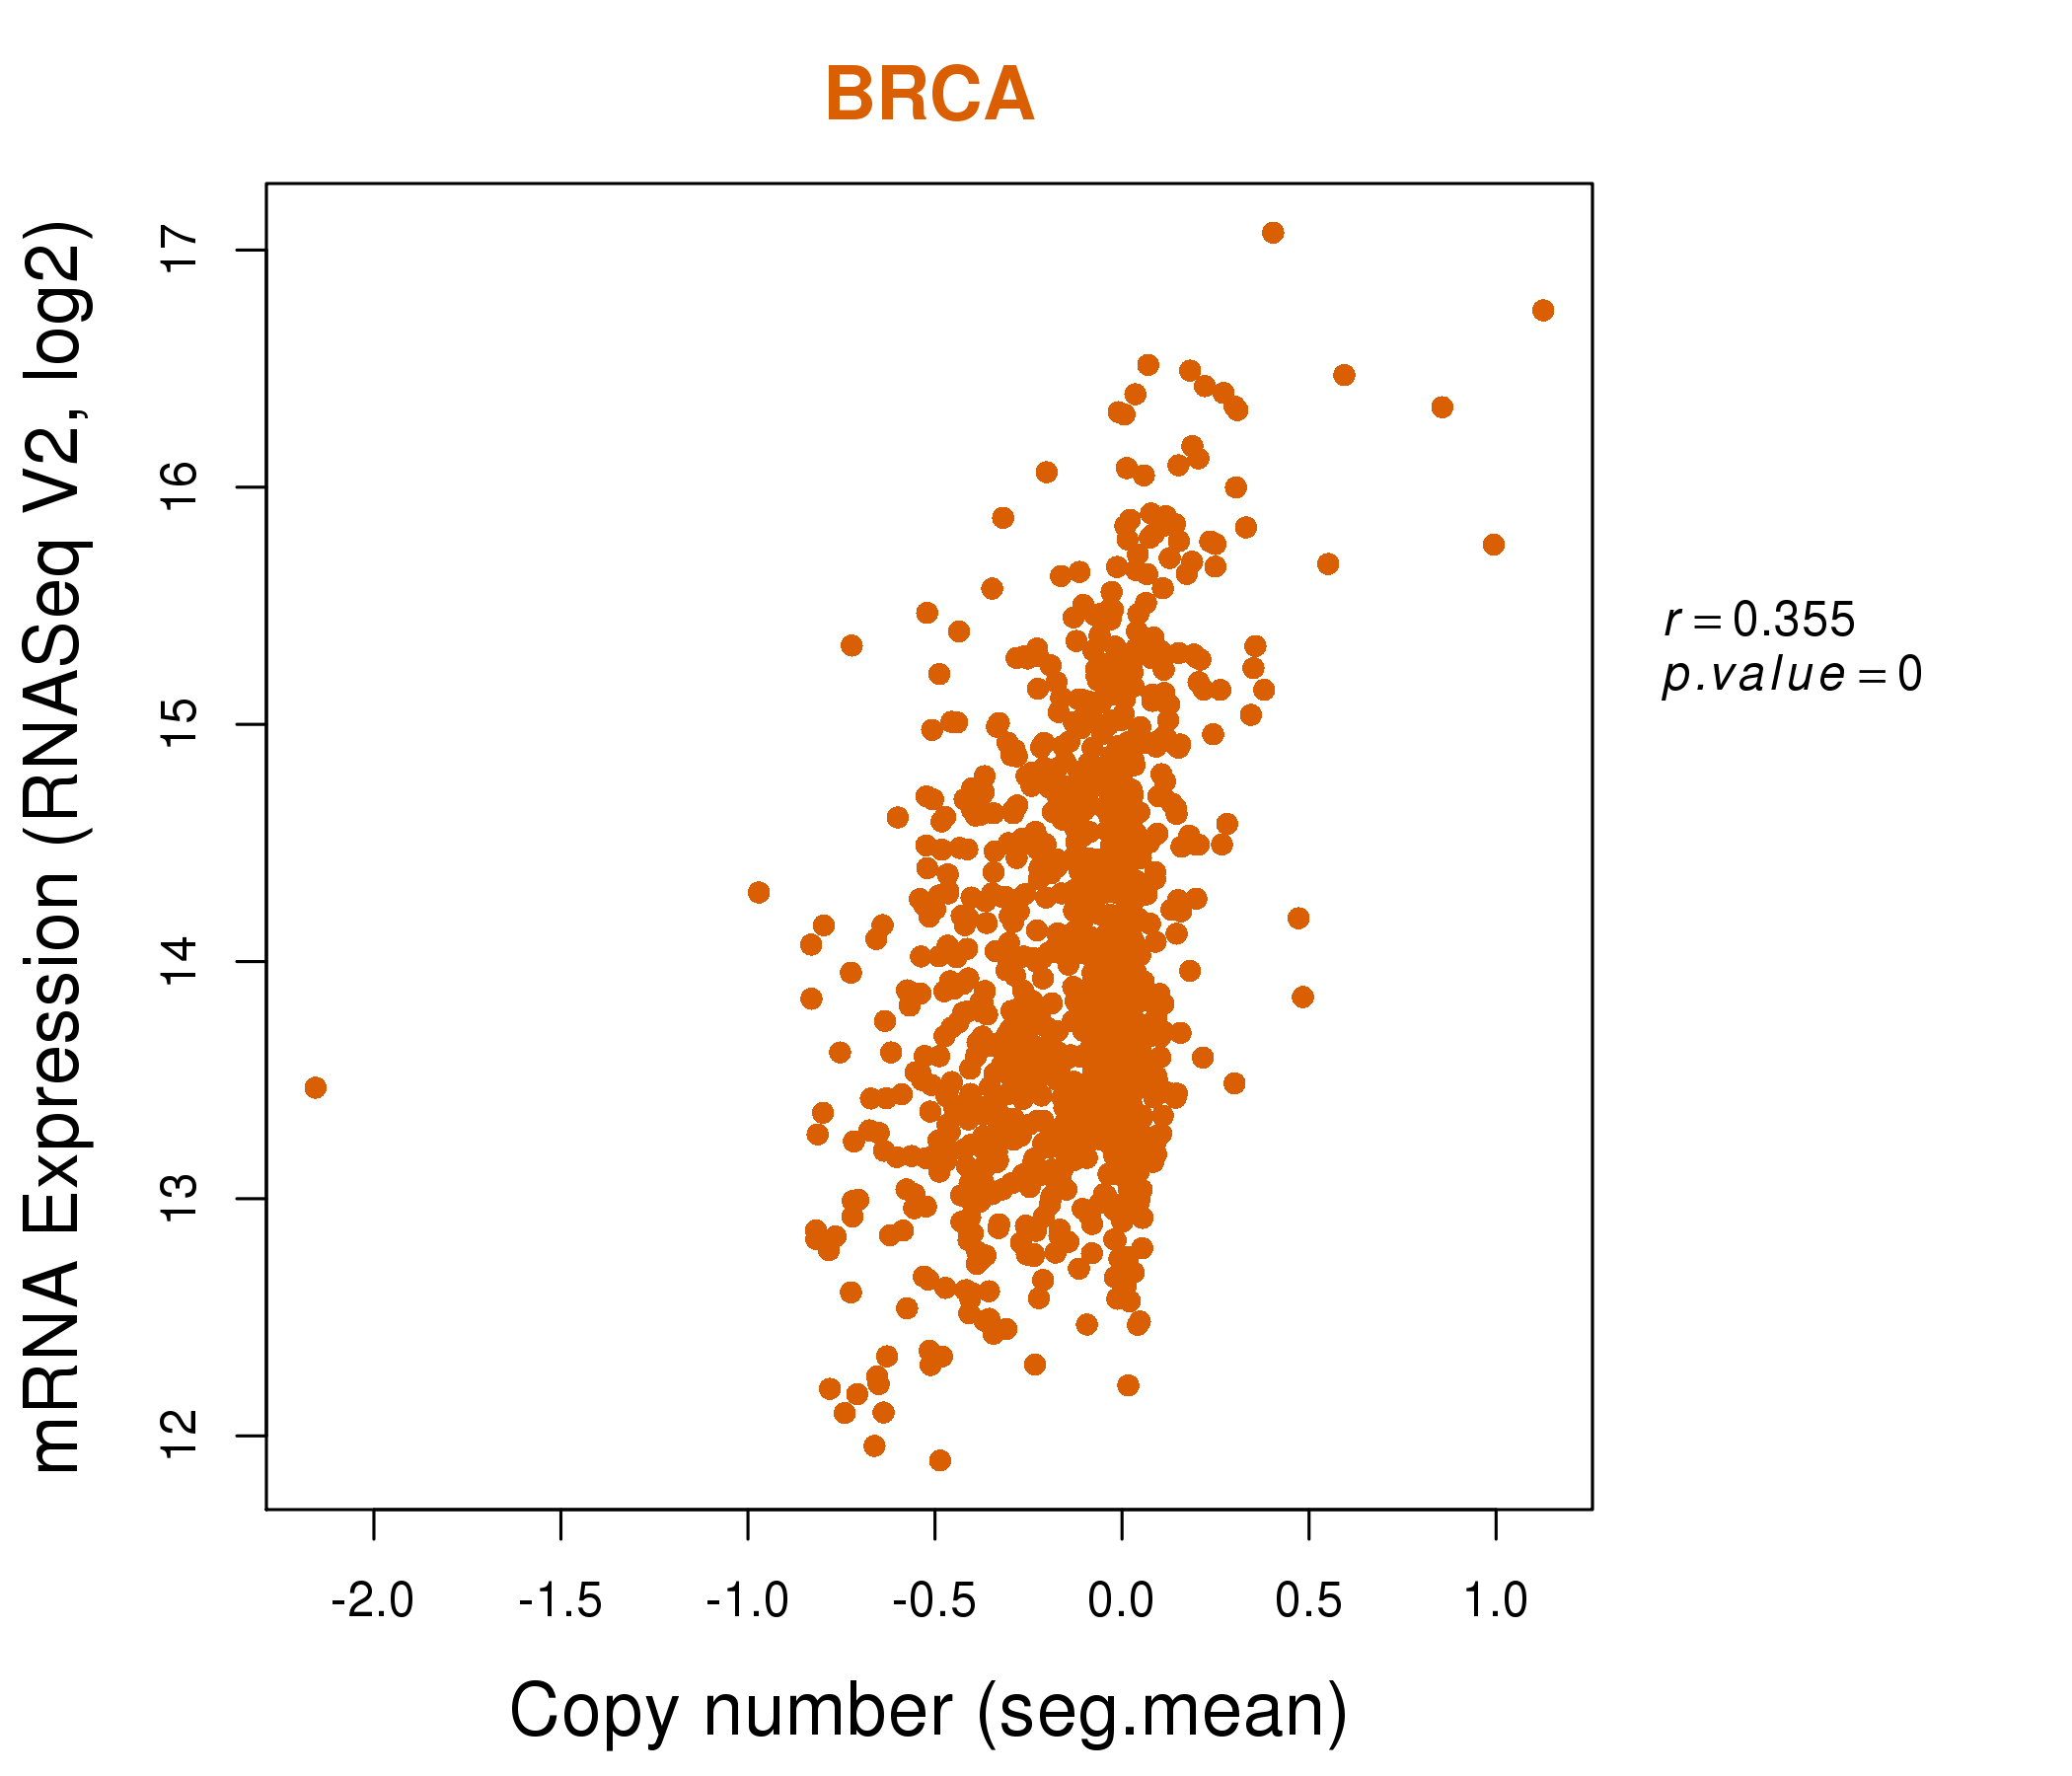
| * This plots show the correlation between CNV and gene expression. |
: Open all plots for all cancer types
 |
|
 |
|

| Top |
| Gene-Gene Network Information |
| * Co-Expression network figures were drawn using R package igraph. Only the top 20 genes with the highest correlations were shown. Red circle: input gene, orange circle: cell metabolism gene, sky circle: other gene |
: Open all plots for all cancer types
 |
| ||||
| ATAD3A,BRI3,MSANTD3,CA9,CDC20,CTNNBIP1,ENO1, FSCN1,GAPDH,GPI,KIAA2013,MICALL1,PFKP,PGAM1, PKM,PLOD1,PSMB2,S100A10,TMEM201,TPI1,TUBA1C | APRT,DDOST,EIF3B,ENO1,F12,FBXW9,JMJD4, MCM5,MRTO4,NHP2,NME1,NPM3,PAFAH1B3,PES1, PRELID1,PRKCSH,RUVBL1,RUVBL2,SLC27A5,TRAF7,TRIP6 | ||||
 |
| ||||
| ACOT7,APITD1,CDC20,CDC45,CENPM,EIF5A,EIF5AL1, ENO1,FEN1,GAPDH,H2AFZ,MRTO4,NUDC,PGAM1, PKM,POLA2,RCC1,SNRPD1,TK1,TPI1,TUBA1B | CALR,CRELD2,DNAJB11,ENO1,GAPDH,GINS4,GMPPB, HSPA5,HYOU1,LRRC59,NOS2,OR52I1,PDIA3,PDIA3P1, PDIA4,PKM,PSMB2,PSMC4,PSMD2,RPN1,RPN2 |

| * Co-Expression network figures were drawn using R package igraph. Only the top 20 genes with the highest correlations were shown. Red circle: input gene, orange circle: cell metabolism gene, sky circle: other gene |
: Open all plots for all cancer types
| Top |
: Open all interacting genes' information including KEGG pathway for all interacting genes from DAVID
| Top |
| Pharmacological Information for ENO1 |
| DB Category | DB Name | DB's ID and Url link |
| Organism-specific databases | PharmGKB | PA27786; -. |
| Organism-specific databases | PharmGKB | PA27786; -. |
| Organism-specific databases | CTD | 2023; -. |
| Organism-specific databases | CTD | 2023; -. |
| * Gene Centered Interaction Network. |
 |
| * Drug Centered Interaction Network. |
| DrugBank ID | Target Name | Drug Groups | Generic Name | Drug Centered Network | Drug Structure |
| DB04066 | enolase 1, (alpha) | experimental | Para-Coumaric Acid |  |  |
| Top |
| Cross referenced IDs for ENO1 |
| * We obtained these cross-references from Uniprot database. It covers 150 different DBs, 18 categories. http://www.uniprot.org/help/cross_references_section |
: Open all cross reference information
|
Copyright © 2016-Present - The Univsersity of Texas Health Science Center at Houston @ |