|
||||||||||||||||||||||||||||||||||||||||||||||||||||||||||||||||||||||||||||||||||||||||||||||||||||||||||||||||||||||||||||||||||||||||||||||||||||||||||||||||||||||||||||||||||||||||||||||||||||||||||||||||||||||||||||||||||||||||||||||||||||||||||||||||||||||||||||||||||||||||||||||||||||||||||||||||||||||||||
| |
| Phenotypic Information (metabolism pathway, cancer, disease, phenome) |
| |
| |
| Gene-Gene Network Information: Co-Expression Network, Interacting Genes & KEGG |
| |
|


| Gene Summary for ENO2 |
| Basic gene info. | Gene symbol | ENO2 |
| Gene name | enolase 2 (gamma, neuronal) | |
| Synonyms | HEL-S-279|NSE | |
| Cytomap | UCSC genome browser: 12p13 | |
| Genomic location | chr12 :7023613-7032859 | |
| Type of gene | protein-coding | |
| RefGenes | NM_001975.2, | |
| Ensembl id | ENSG00000269528 | |
| Description | 2-phospho-D-glycerate hydro-lyase2-phospho-D-glycerate hydrolyaseepididymis secretory protein Li 279gamma-enolaseneural enolaseneuron specific gamma enolaseneuron-specific enolaseneurone-specific enolase | |
| Modification date | 20141207 | |
| dbXrefs | MIM : 131360 | |
| HGNC : HGNC | ||
| Ensembl : ENSG00000111674 | ||
| HPRD : 00573 | ||
| Vega : OTTHUMG00000168967 | ||
| Protein | UniProt: go to UniProt's Cross Reference DB Table | |
| Expression | CleanEX: HS_ENO2 | |
| BioGPS: 2026 | ||
| Gene Expression Atlas: ENSG00000269528 | ||
| The Human Protein Atlas: ENSG00000269528 | ||
| Pathway | NCI Pathway Interaction Database: ENO2 | |
| KEGG: ENO2 | ||
| REACTOME: ENO2 | ||
| ConsensusPathDB | ||
| Pathway Commons: ENO2 | ||
| Metabolism | MetaCyc: ENO2 | |
| HUMANCyc: ENO2 | ||
| Regulation | Ensembl's Regulation: ENSG00000269528 | |
| miRBase: chr12 :7,023,613-7,032,859 | ||
| TargetScan: NM_001975 | ||
| cisRED: ENSG00000269528 | ||
| Context | iHOP: ENO2 | |
| cancer metabolism search in PubMed: ENO2 | ||
| UCL Cancer Institute: ENO2 | ||
| Assigned class in ccmGDB | C | |
| Top |
| Phenotypic Information for ENO2(metabolism pathway, cancer, disease, phenome) |
| Cancer | CGAP: ENO2 |
| Familial Cancer Database: ENO2 | |
| * This gene is included in those cancer gene databases. |
|
|
|
|
|
|
| ||||||||||||||||||||||||||||||||||||||||||||||||||||||||||||||||||||||||||||||||||||||||||||||||||||||||||||||||||||||||||||||||||||||||||||||||||||||||||||||||||||||||||||||||||||||||||||||||||||||||||||||||||||||||||||||||||||||||||||||||||||||||||||||||||||||||||||||||||||||||||||||||||||||||||||||||||||
Oncogene 1 | Significant driver gene in | |||||||||||||||||||||||||||||||||||||||||||||||||||||||||||||||||||||||||||||||||||||||||||||||||||||||||||||||||||||||||||||||||||||||||||||||||||||||||||||||||||||||||||||||||||||||||||||||||||||||||||||||||||||||||||||||||||||||||||||||||||||||||||||||||||||||||||||||||||||||||||||||||||||||||||||||||||||||||
| cf) number; DB name 1 Oncogene; http://nar.oxfordjournals.org/content/35/suppl_1/D721.long, 2 Tumor Suppressor gene; https://bioinfo.uth.edu/TSGene/, 3 Cancer Gene Census; http://www.nature.com/nrc/journal/v4/n3/abs/nrc1299.html, 4 CancerGenes; http://nar.oxfordjournals.org/content/35/suppl_1/D721.long, 5 Network of Cancer Gene; http://ncg.kcl.ac.uk/index.php, 1Therapeutic Vulnerabilities in Cancer; http://cbio.mskcc.org/cancergenomics/statius/ |
| KEGG_GLYCOLYSIS_GLUCONEOGENESIS REACTOME_METABOLISM_OF_CARBOHYDRATES REACTOME_GLUCOSE_METABOLISM | |
| OMIM | |
| Orphanet | |
| Disease | KEGG Disease: ENO2 |
| MedGen: ENO2 (Human Medical Genetics with Condition) | |
| ClinVar: ENO2 | |
| Phenotype | MGI: ENO2 (International Mouse Phenotyping Consortium) |
| PhenomicDB: ENO2 | |
| Mutations for ENO2 |
| * Under tables are showing count per each tissue to give us broad intuition about tissue specific mutation patterns.You can go to the detailed page for each mutation database's web site. |
| - Statistics for Tissue and Mutation type | Top |
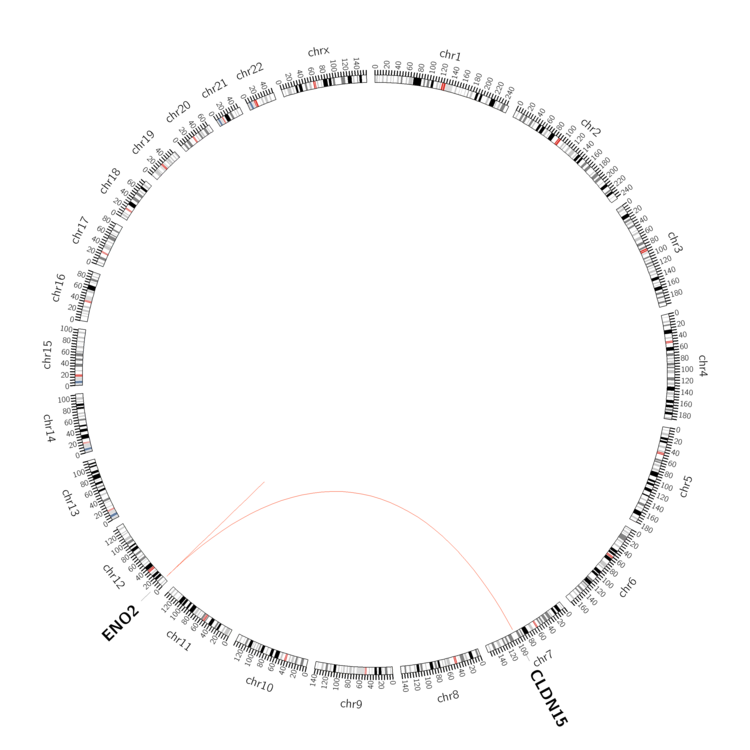 |
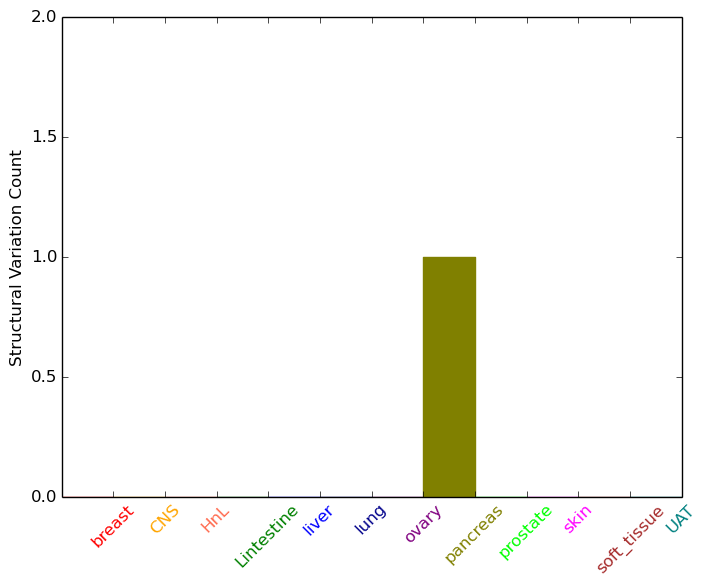
| - For Inter-chromosomal Variations |
| * Inter-chromosomal variantions includes 'interchromosomal amplicon to amplicon', 'interchromosomal amplicon to non-amplified dna', 'interchromosomal insertion', 'Interchromosomal unknown type'. |
 |
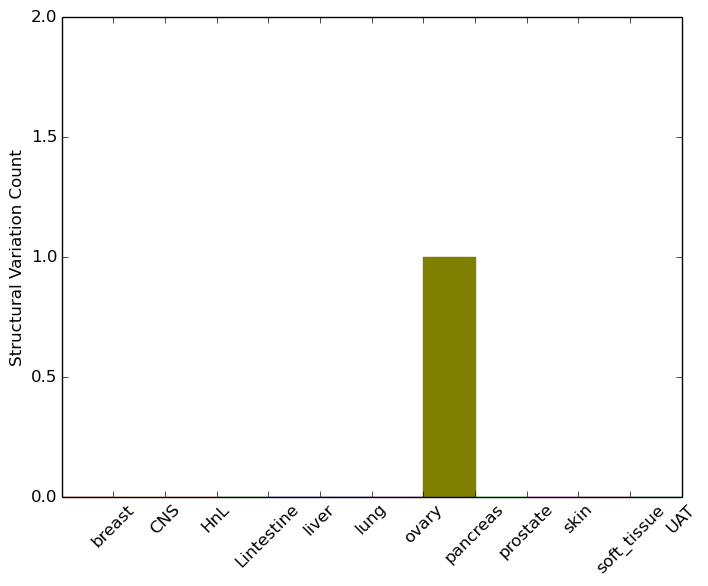
| - For Intra-chromosomal Variations |
| * Intra-chromosomal variantions includes 'intrachromosomal amplicon to amplicon', 'intrachromosomal amplicon to non-amplified dna', 'intrachromosomal deletion', 'intrachromosomal fold-back inversion', 'intrachromosomal inversion', 'intrachromosomal tandem duplication', 'Intrachromosomal unknown type', 'intrachromosomal with inverted orientation', 'intrachromosomal with non-inverted orientation'. |
 |
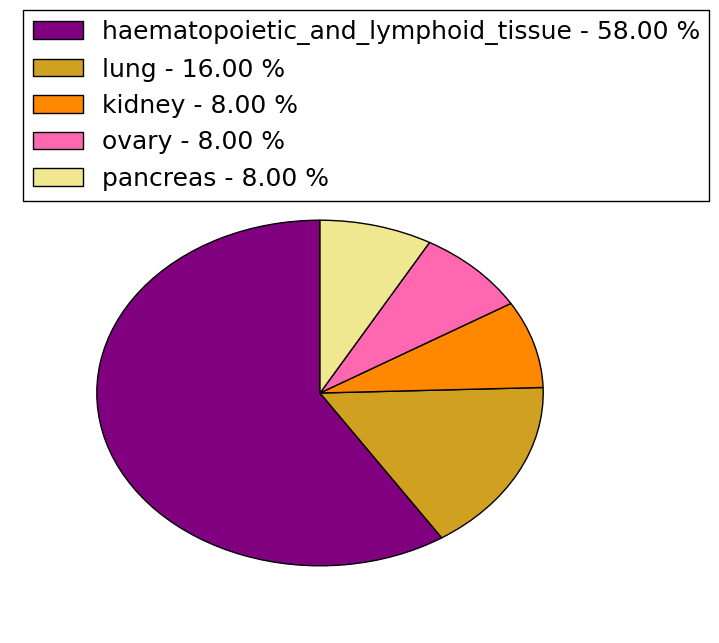
| Sample | Symbol_a | Chr_a | Start_a | End_a | Symbol_b | Chr_b | Start_b | End_b |
| pancreas | ENO2 | chr12 | 7027758 | 7027958 | ENO2 | chr12 | 7032286 | 7032486 |
| cf) Tissue number; Tissue name (1;Breast, 2;Central_nervous_system, 3;Haematopoietic_and_lymphoid_tissue, 4;Large_intestine, 5;Liver, 6;Lung, 7;Ovary, 8;Pancreas, 9;Prostate, 10;Skin, 11;Soft_tissue, 12;Upper_aerodigestive_tract) |
| * From mRNA Sanger sequences, Chitars2.0 arranged chimeric transcripts. This table shows ENO2 related fusion information. |
| ID | Head Gene | Tail Gene | Accession | Gene_a | qStart_a | qEnd_a | Chromosome_a | tStart_a | tEnd_a | Gene_a | qStart_a | qEnd_a | Chromosome_a | tStart_a | tEnd_a |
| AU142951 | NAE1 | 1 | 511 | 16 | 66842911 | 66850908 | ENO2 | 511 | 712 | 12 | 7023722 | 7025082 | |
| BQ302654 | CLASRP | 1 | 135 | 19 | 45557798 | 45557933 | ENO2 | 120 | 587 | 12 | 7030826 | 7032073 | |
| BQ316184 | ENO2 | 1 | 132 | 12 | 7031242 | 7031553 | TNRC18 | 127 | 642 | 7 | 5399156 | 5410034 | |
| DA094244 | LOC100507412 | 1 | 151 | ? | 112029 | 112179 | ENO2 | 150 | 563 | 12 | 7023742 | 7024155 | |
| Top |
| Mutation type/ Tissue ID | brca | cns | cerv | endome | haematopo | kidn | Lintest | liver | lung | ns | ovary | pancre | prost | skin | stoma | thyro | urina | |||
| Total # sample | 1 | |||||||||||||||||||
| GAIN (# sample) | 1 | |||||||||||||||||||
| LOSS (# sample) |
| cf) Tissue ID; Tissue type (1; Breast, 2; Central_nervous_system, 3; Cervix, 4; Endometrium, 5; Haematopoietic_and_lymphoid_tissue, 6; Kidney, 7; Large_intestine, 8; Liver, 9; Lung, 10; NS, 11; Ovary, 12; Pancreas, 13; Prostate, 14; Skin, 15; Stomach, 16; Thyroid, 17; Urinary_tract) |
| Top |
|
 |
| Top |
| Stat. for Non-Synonymous SNVs (# total SNVs=22) | (# total SNVs=12) |
 |  |
(# total SNVs=1) | (# total SNVs=0) |
 |
| Top |
| * When you move the cursor on each content, you can see more deailed mutation information on the Tooltip. Those are primary_site,primary_histology,mutation(aa),pubmedID. |
| GRCh37 position | Mutation(aa) | Unique sampleID count |
| chr12:7031324-7031324 | p.G391G | 7 |
| chr12:7028831-7028831 | p.Y257H | 3 |
| chr12:7025017-7025017 | p.W7* | 3 |
| chr12:7025874-7025874 | p.A74V | 2 |
| chr12:7026819-7026819 | p.P129A | 2 |
| chr12:7028928-7028928 | p.? | 2 |
| chr12:7031509-7031509 | p.I393M | 2 |
| chr12:7027206-7027206 | p.R183* | 1 |
| chr12:7030920-7030920 | p.G348S | 1 |
| chr12:7025671-7025671 | p.G59D | 1 |
| Top |
|
 |
| Point Mutation/ Tissue ID | 1 | 2 | 3 | 4 | 5 | 6 | 7 | 8 | 9 | 10 | 11 | 12 | 13 | 14 | 15 | 16 | 17 | 18 | 19 | 20 |
| # sample | 1 | 3 | 1 | 2 | 1 | 1 | 1 | 3 | 4 | 6 | ||||||||||
| # mutation | 1 | 3 | 1 | 2 | 1 | 1 | 1 | 3 | 4 | 6 | ||||||||||
| nonsynonymous SNV | 1 | 3 | 1 | 1 | 1 | 1 | 2 | 3 | 6 | |||||||||||
| synonymous SNV | 2 | 1 | 1 |
| cf) Tissue ID; Tissue type (1; BLCA[Bladder Urothelial Carcinoma], 2; BRCA[Breast invasive carcinoma], 3; CESC[Cervical squamous cell carcinoma and endocervical adenocarcinoma], 4; COAD[Colon adenocarcinoma], 5; GBM[Glioblastoma multiforme], 6; Glioma Low Grade, 7; HNSC[Head and Neck squamous cell carcinoma], 8; KICH[Kidney Chromophobe], 9; KIRC[Kidney renal clear cell carcinoma], 10; KIRP[Kidney renal papillary cell carcinoma], 11; LAML[Acute Myeloid Leukemia], 12; LUAD[Lung adenocarcinoma], 13; LUSC[Lung squamous cell carcinoma], 14; OV[Ovarian serous cystadenocarcinoma ], 15; PAAD[Pancreatic adenocarcinoma], 16; PRAD[Prostate adenocarcinoma], 17; SKCM[Skin Cutaneous Melanoma], 18:STAD[Stomach adenocarcinoma], 19:THCA[Thyroid carcinoma], 20:UCEC[Uterine Corpus Endometrial Carcinoma]) |
| Top |
| * We represented just top 10 SNVs. When you move the cursor on each content, you can see more deailed mutation information on the Tooltip. Those are primary_site, primary_histology, mutation(aa), pubmedID. |
| Genomic Position | Mutation(aa) | Unique sampleID count |
| chr12:7031310 | p.G387W | 2 |
| chr12:7031296 | p.R183Q | 1 |
| chr12:7026767 | p.T272T | 1 |
| chr12:7026819 | p.A278V | 1 |
| chr12:7031312 | p.W304L | 1 |
| chr12:7027203 | p.E333K | 1 |
| chr12:7031509 | p.M1I | 1 |
| chr12:7024999 | p.A336V | 1 |
| chr12:7027207 | p.K5Q | 1 |
| chr12:7031525 | p.G348S | 1 |
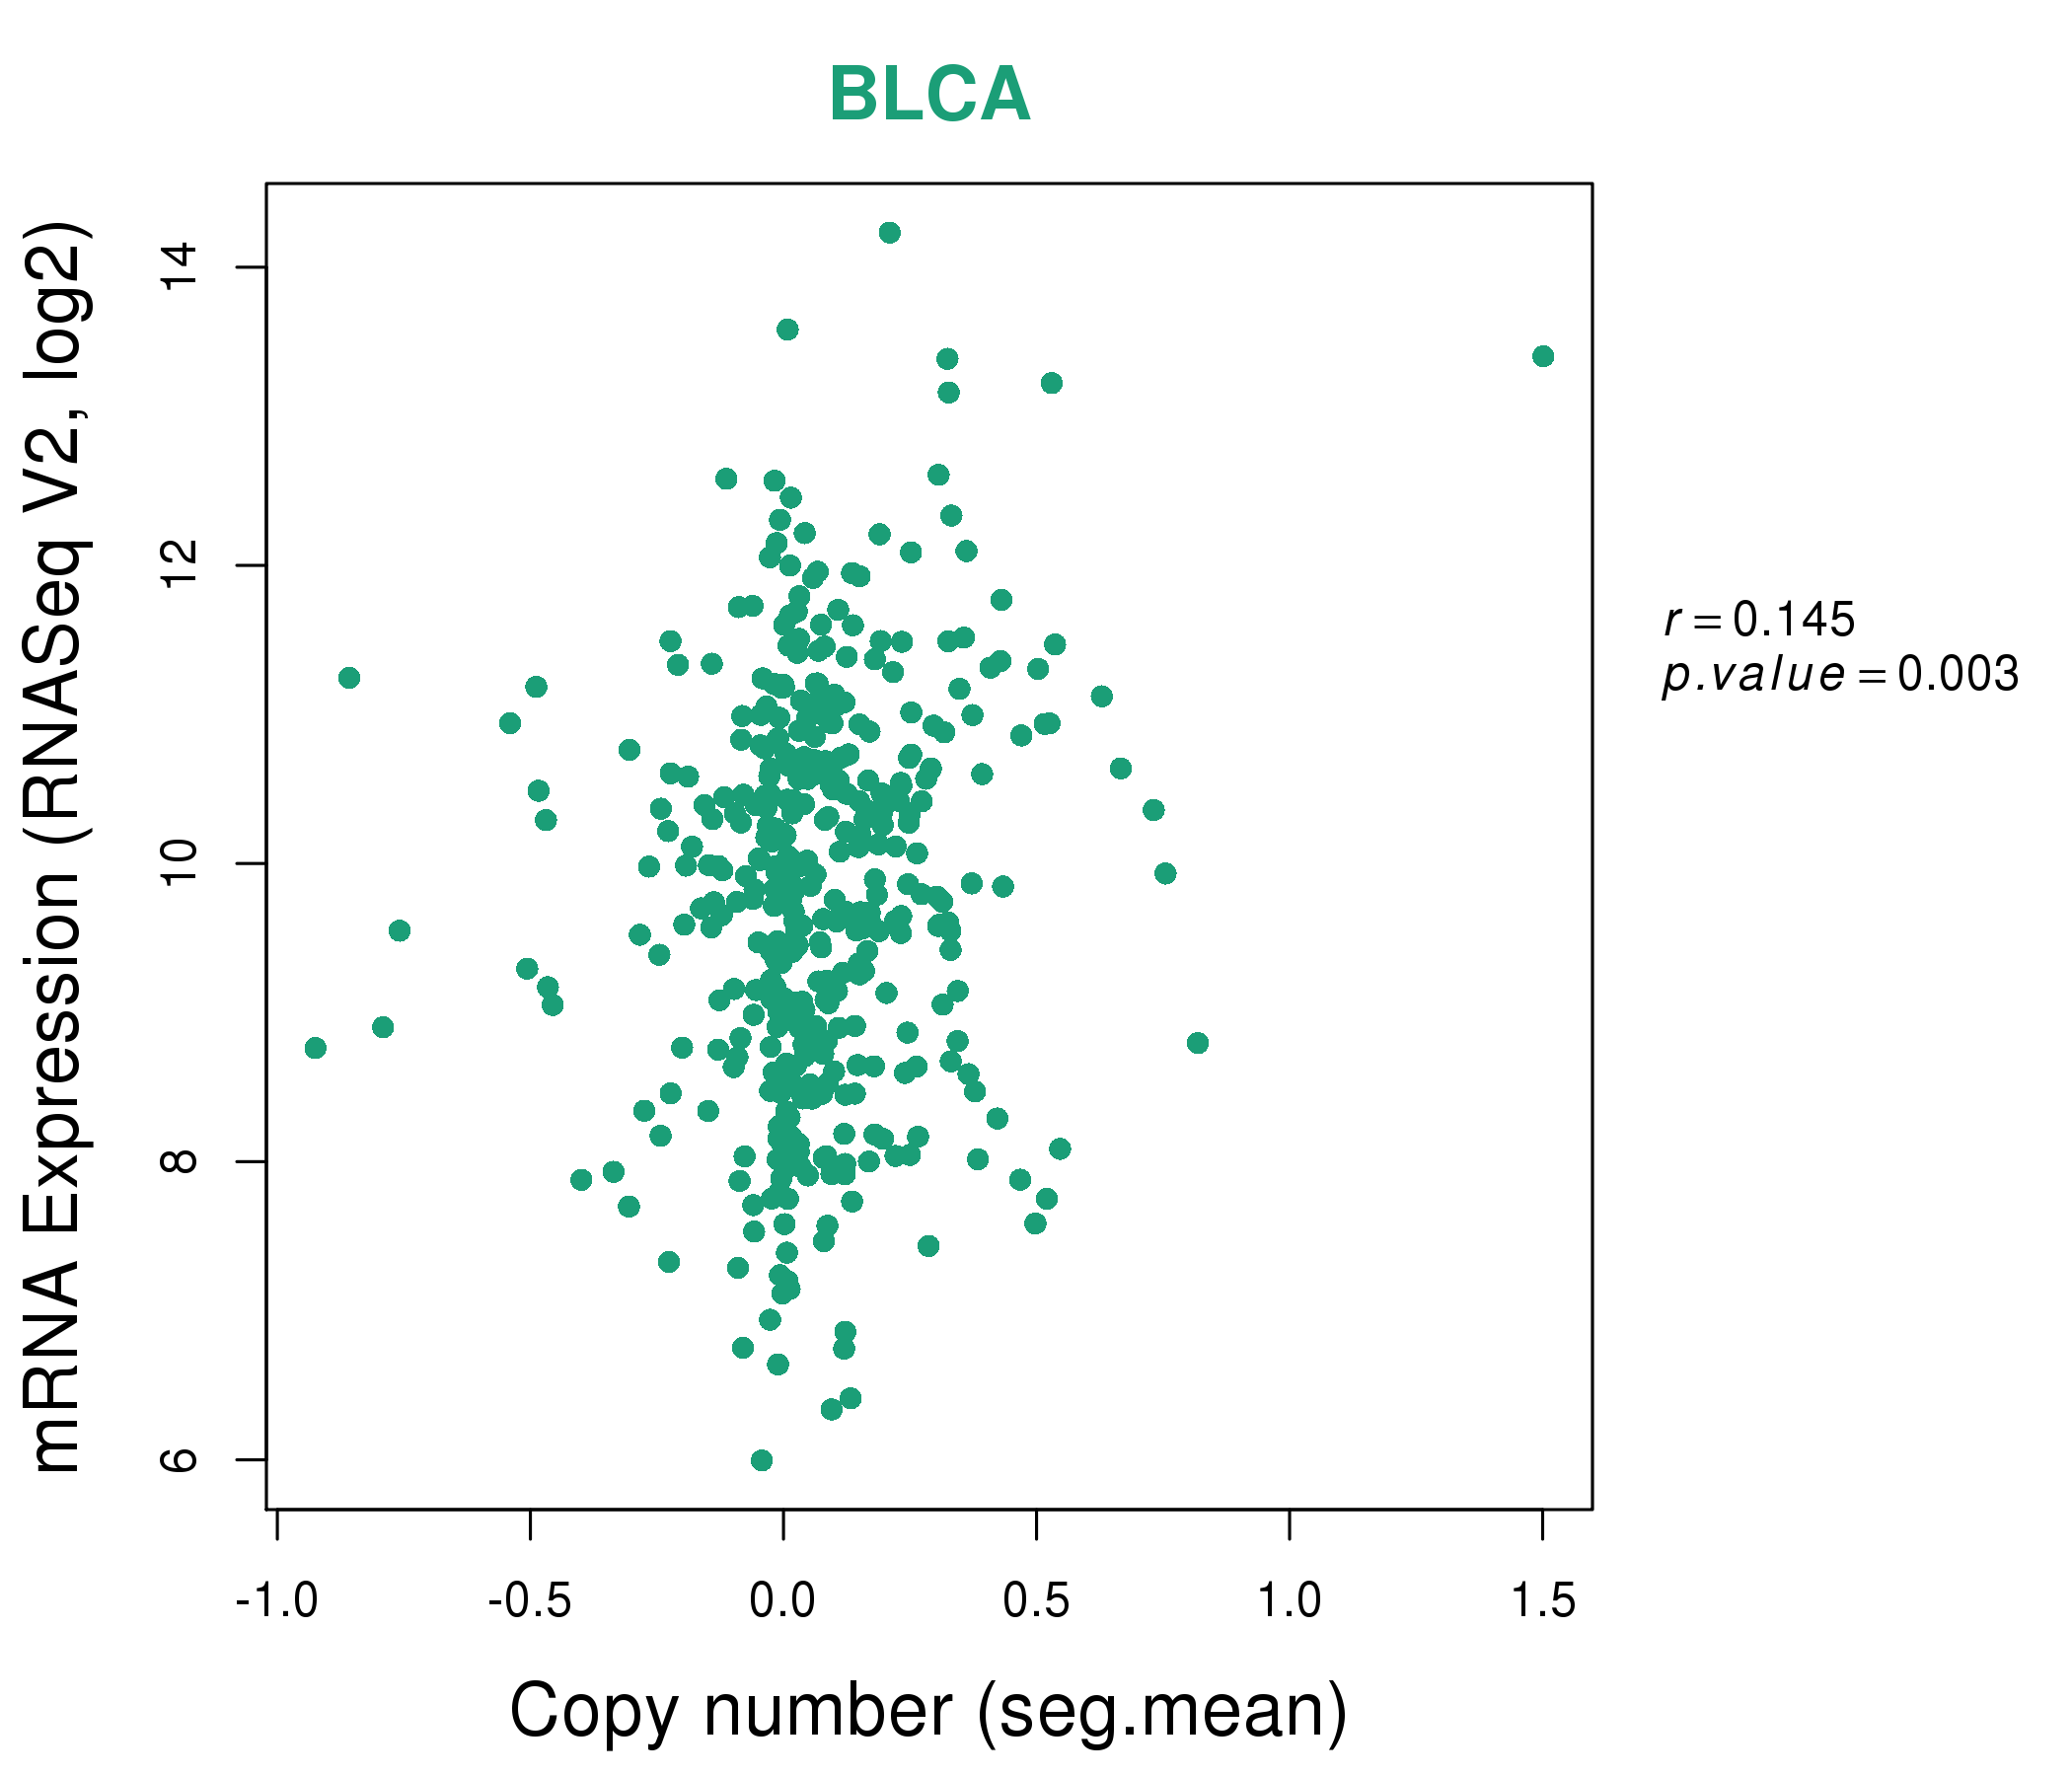
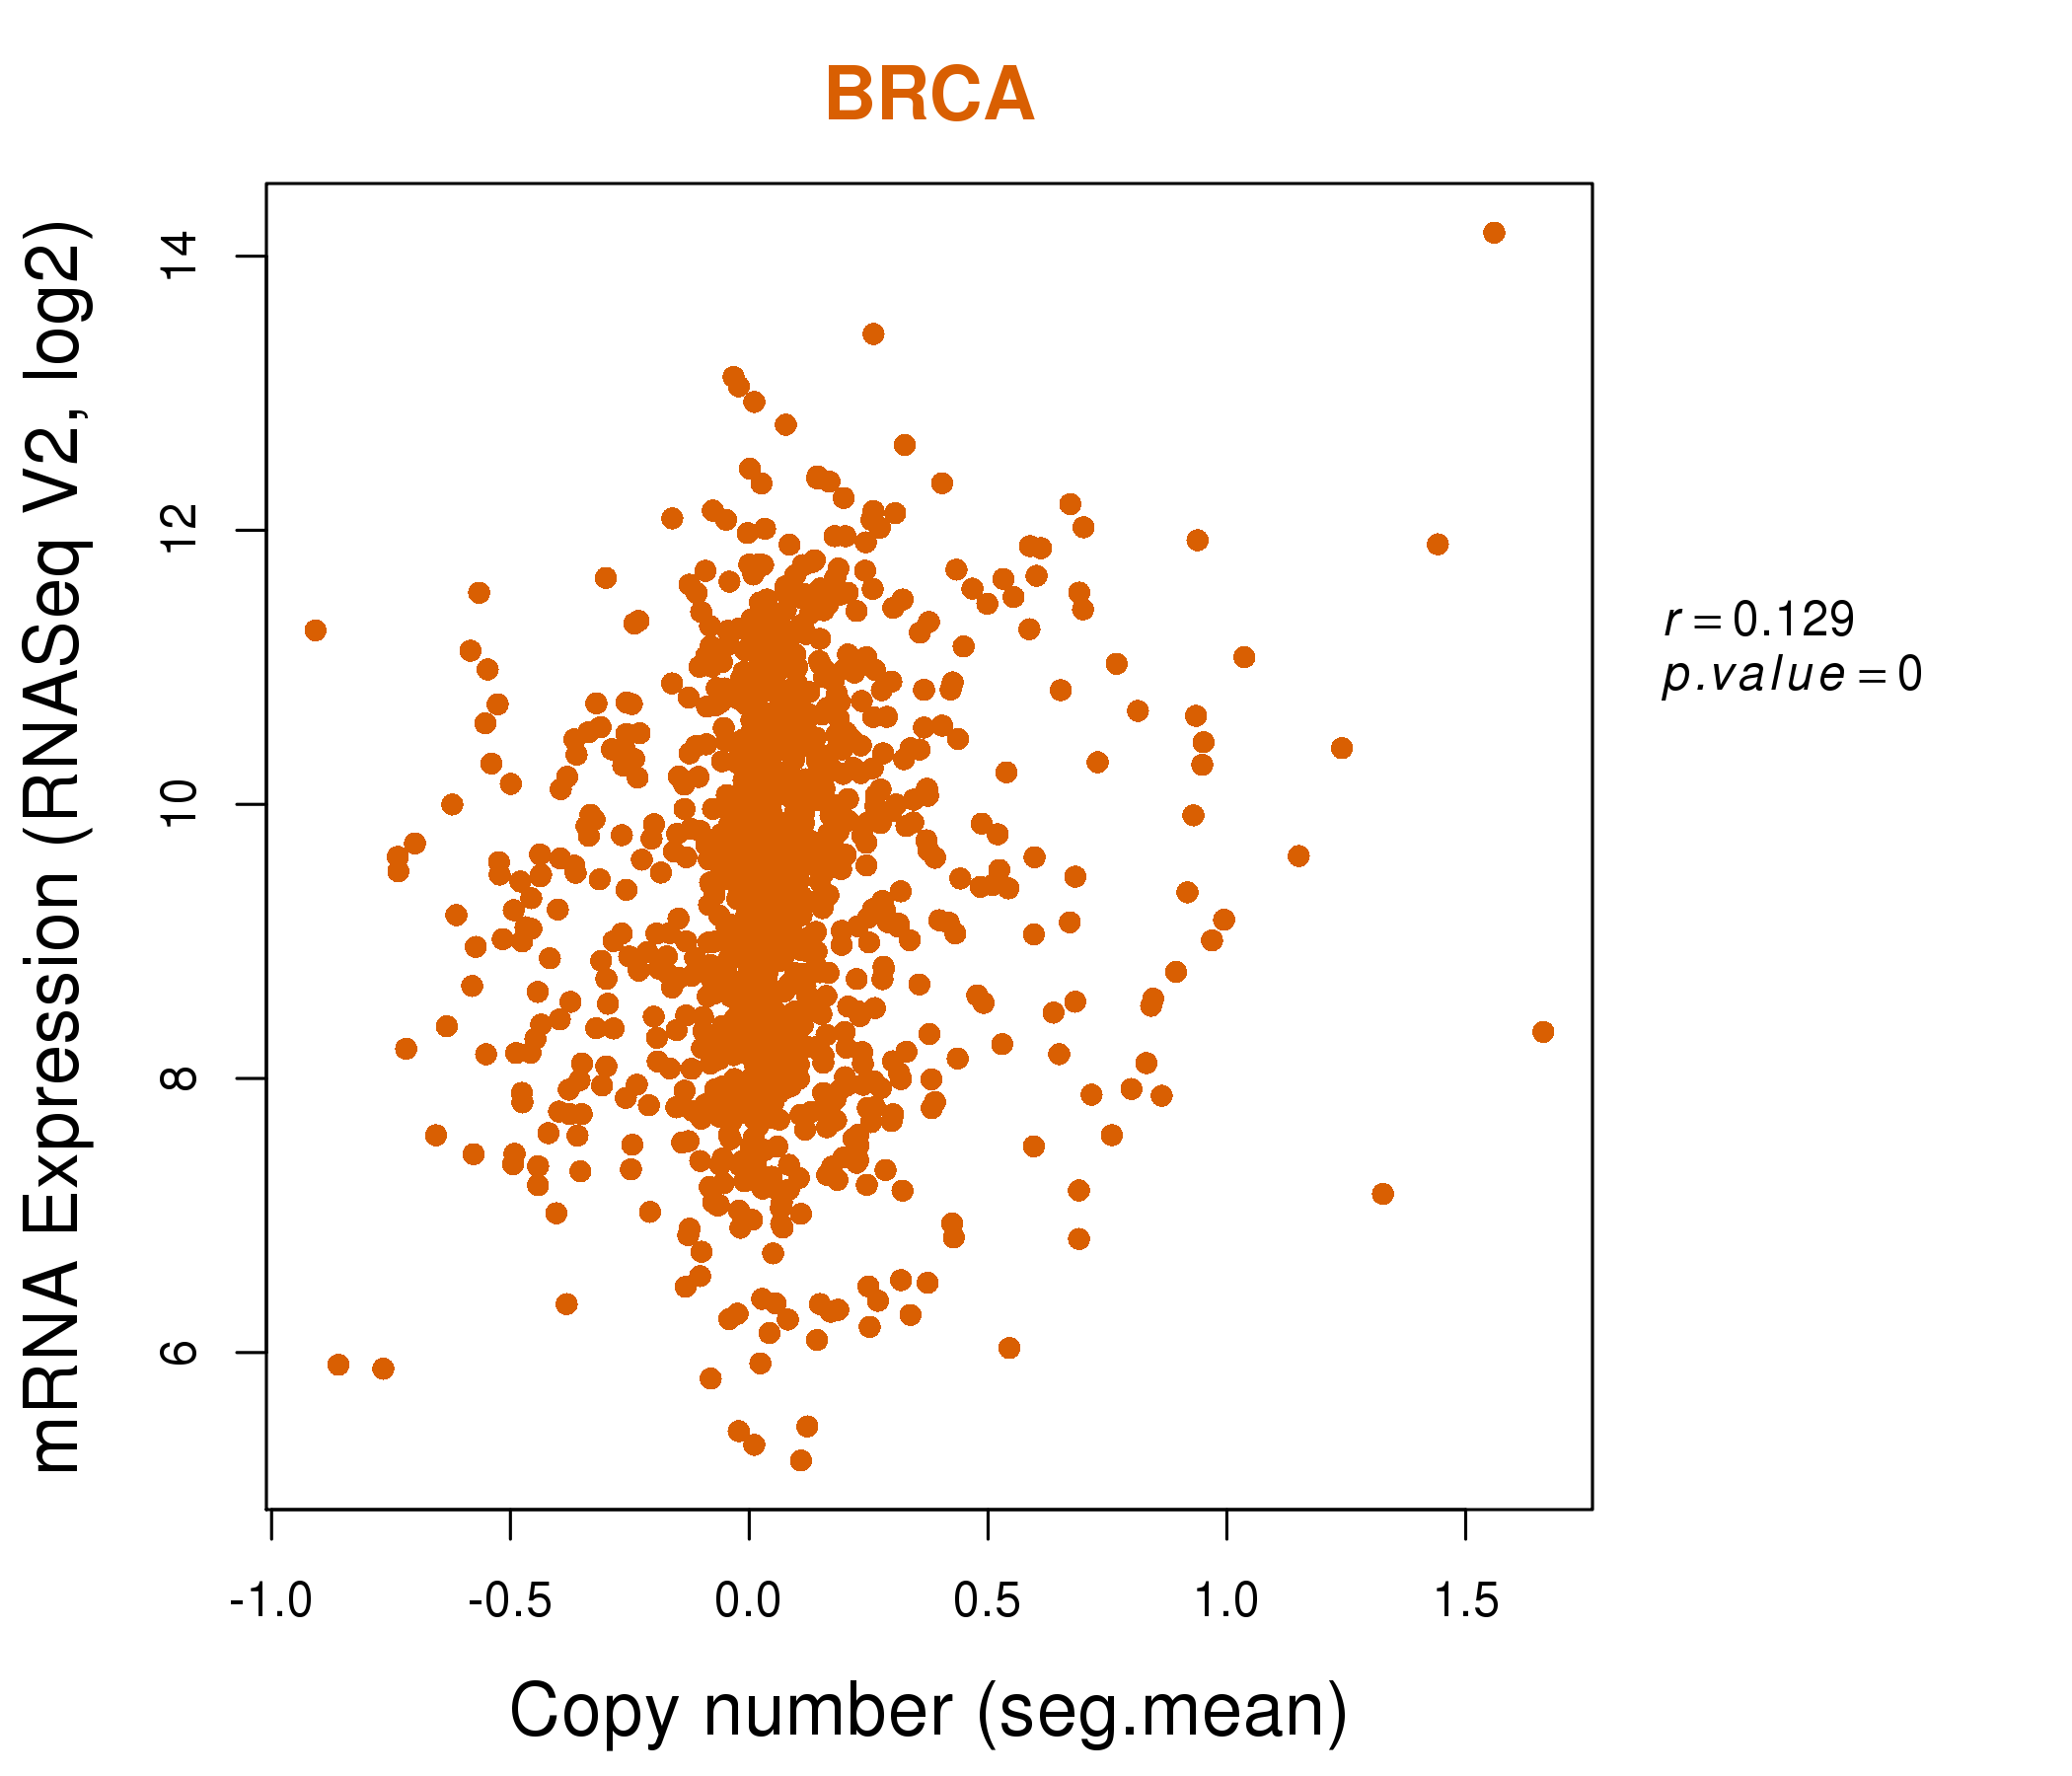
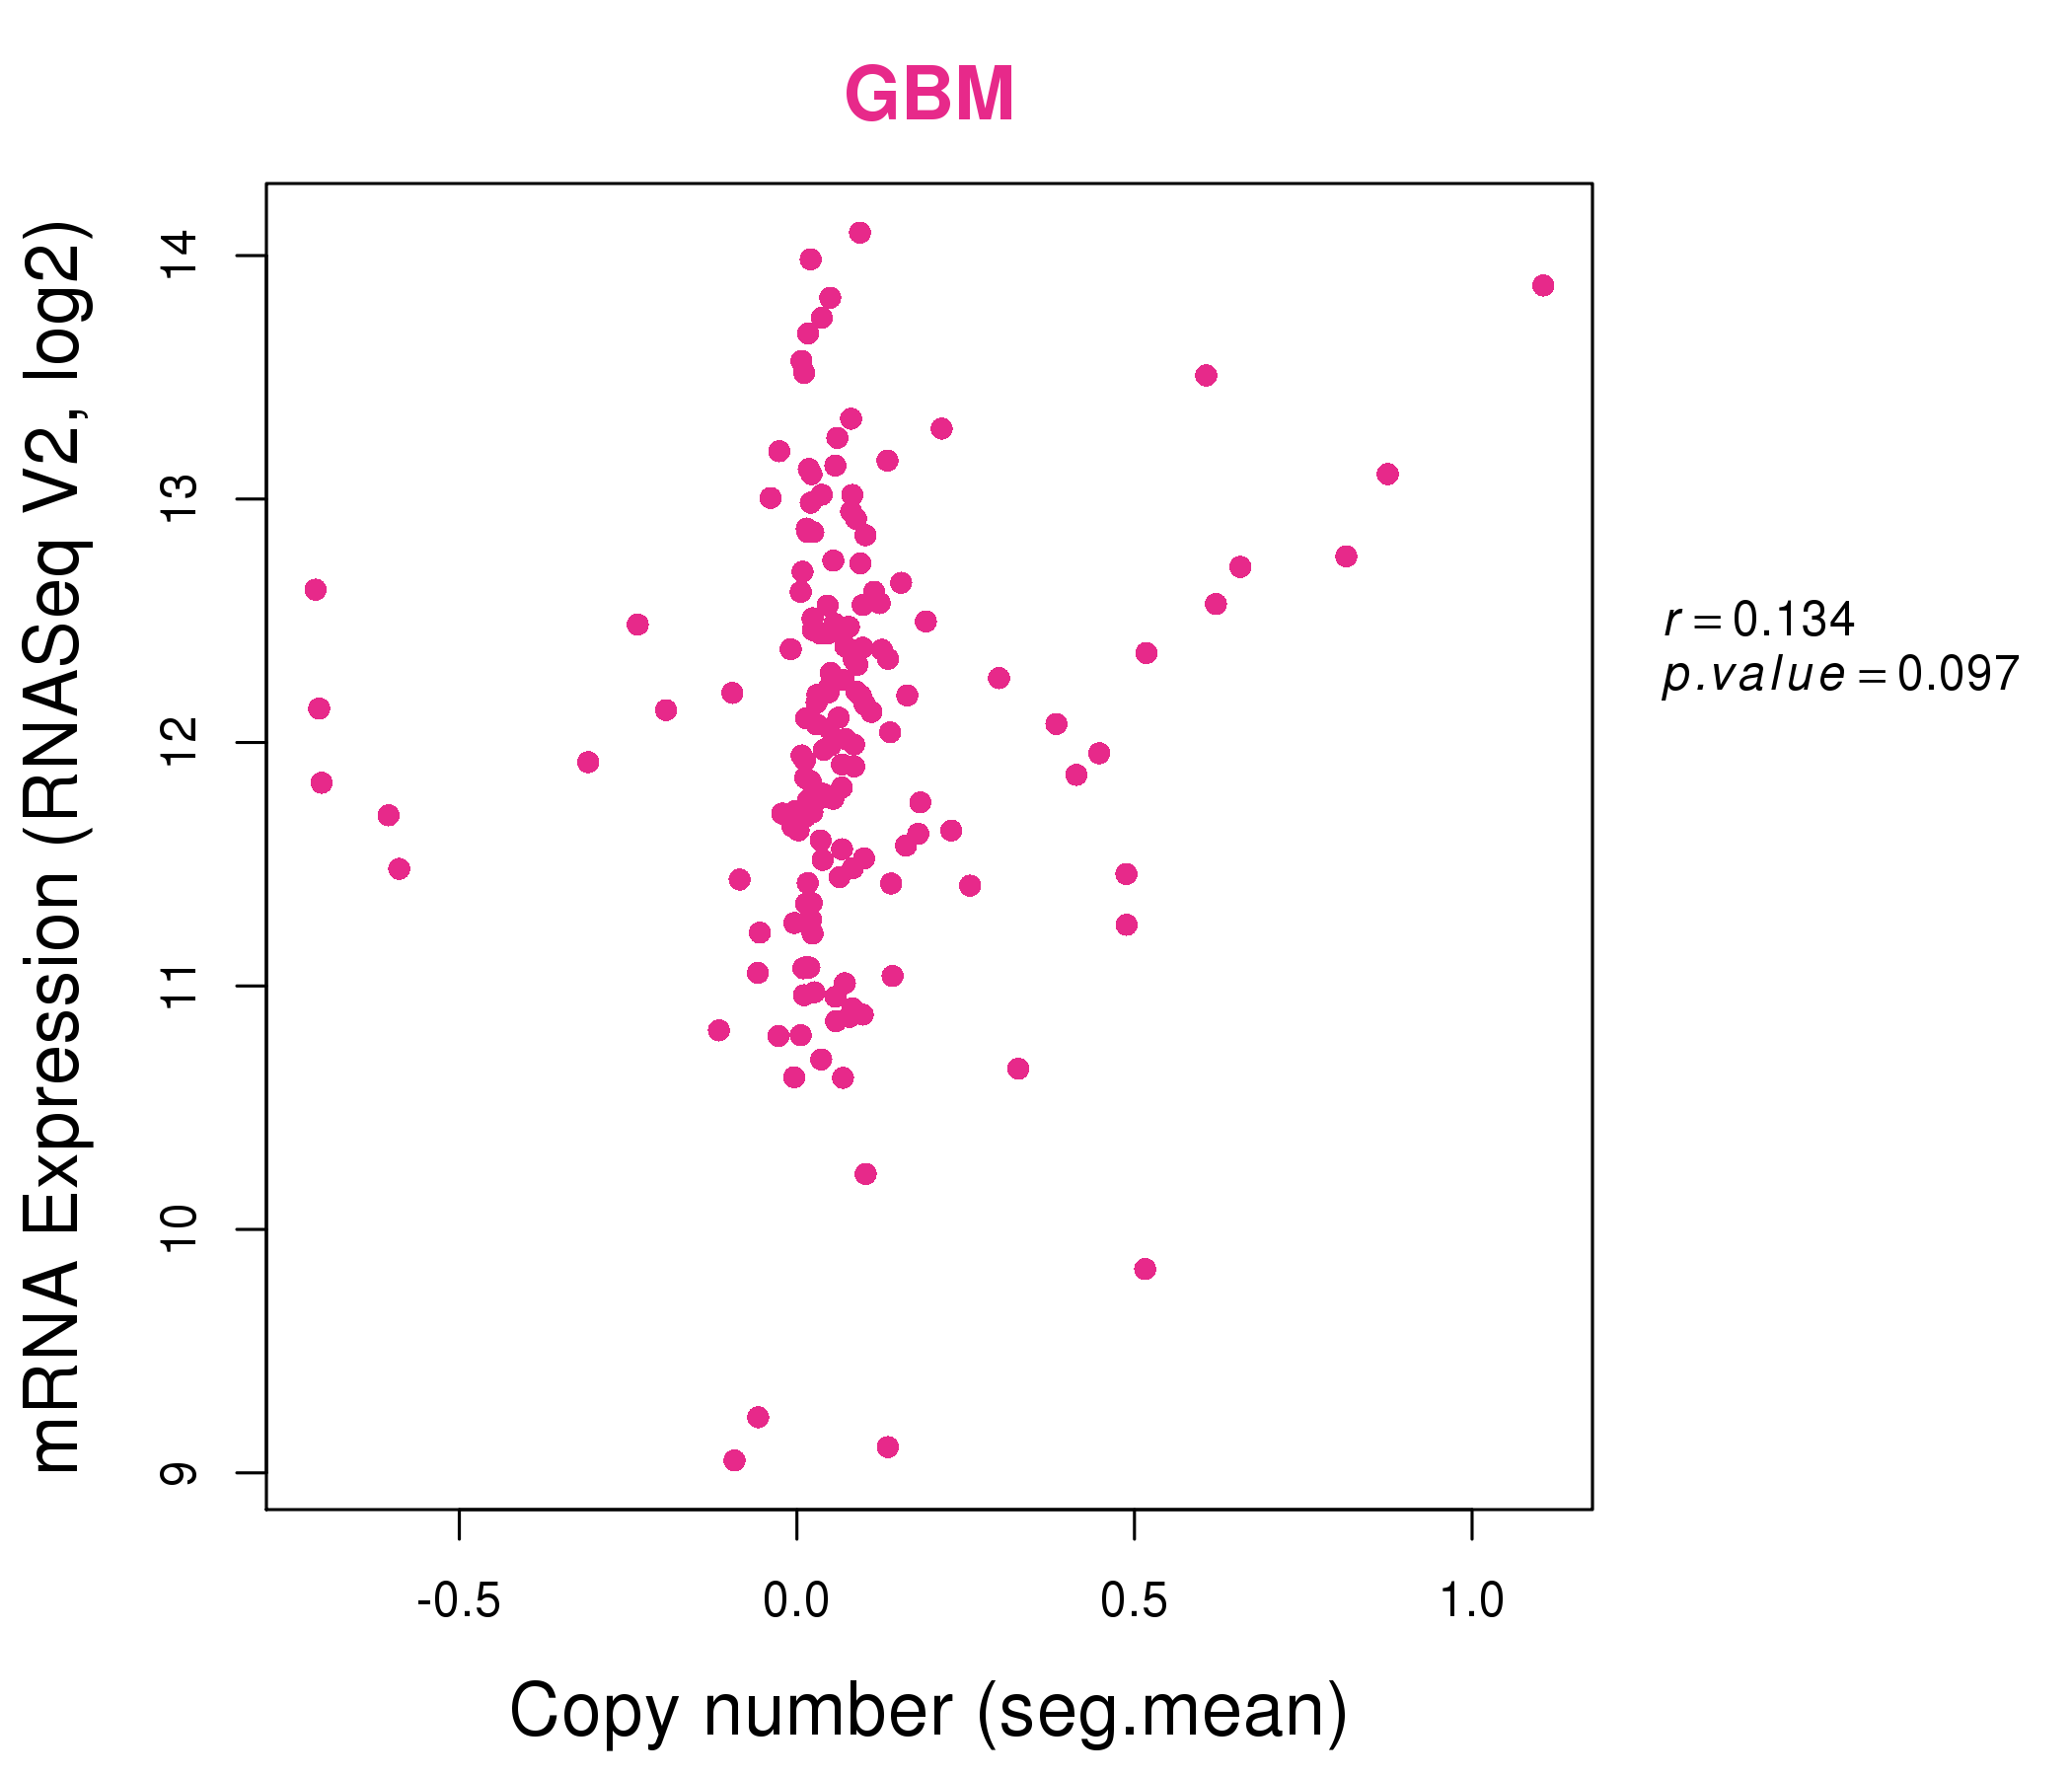
| * Copy number data were extracted from TCGA using R package TCGA-Assembler. The URLs of all public data files on TCGA DCC data server were gathered on Jan-05-2015. Function ProcessCNAData in TCGA-Assembler package was used to obtain gene-level copy number value which is calculated as the average copy number of the genomic region of a gene. |
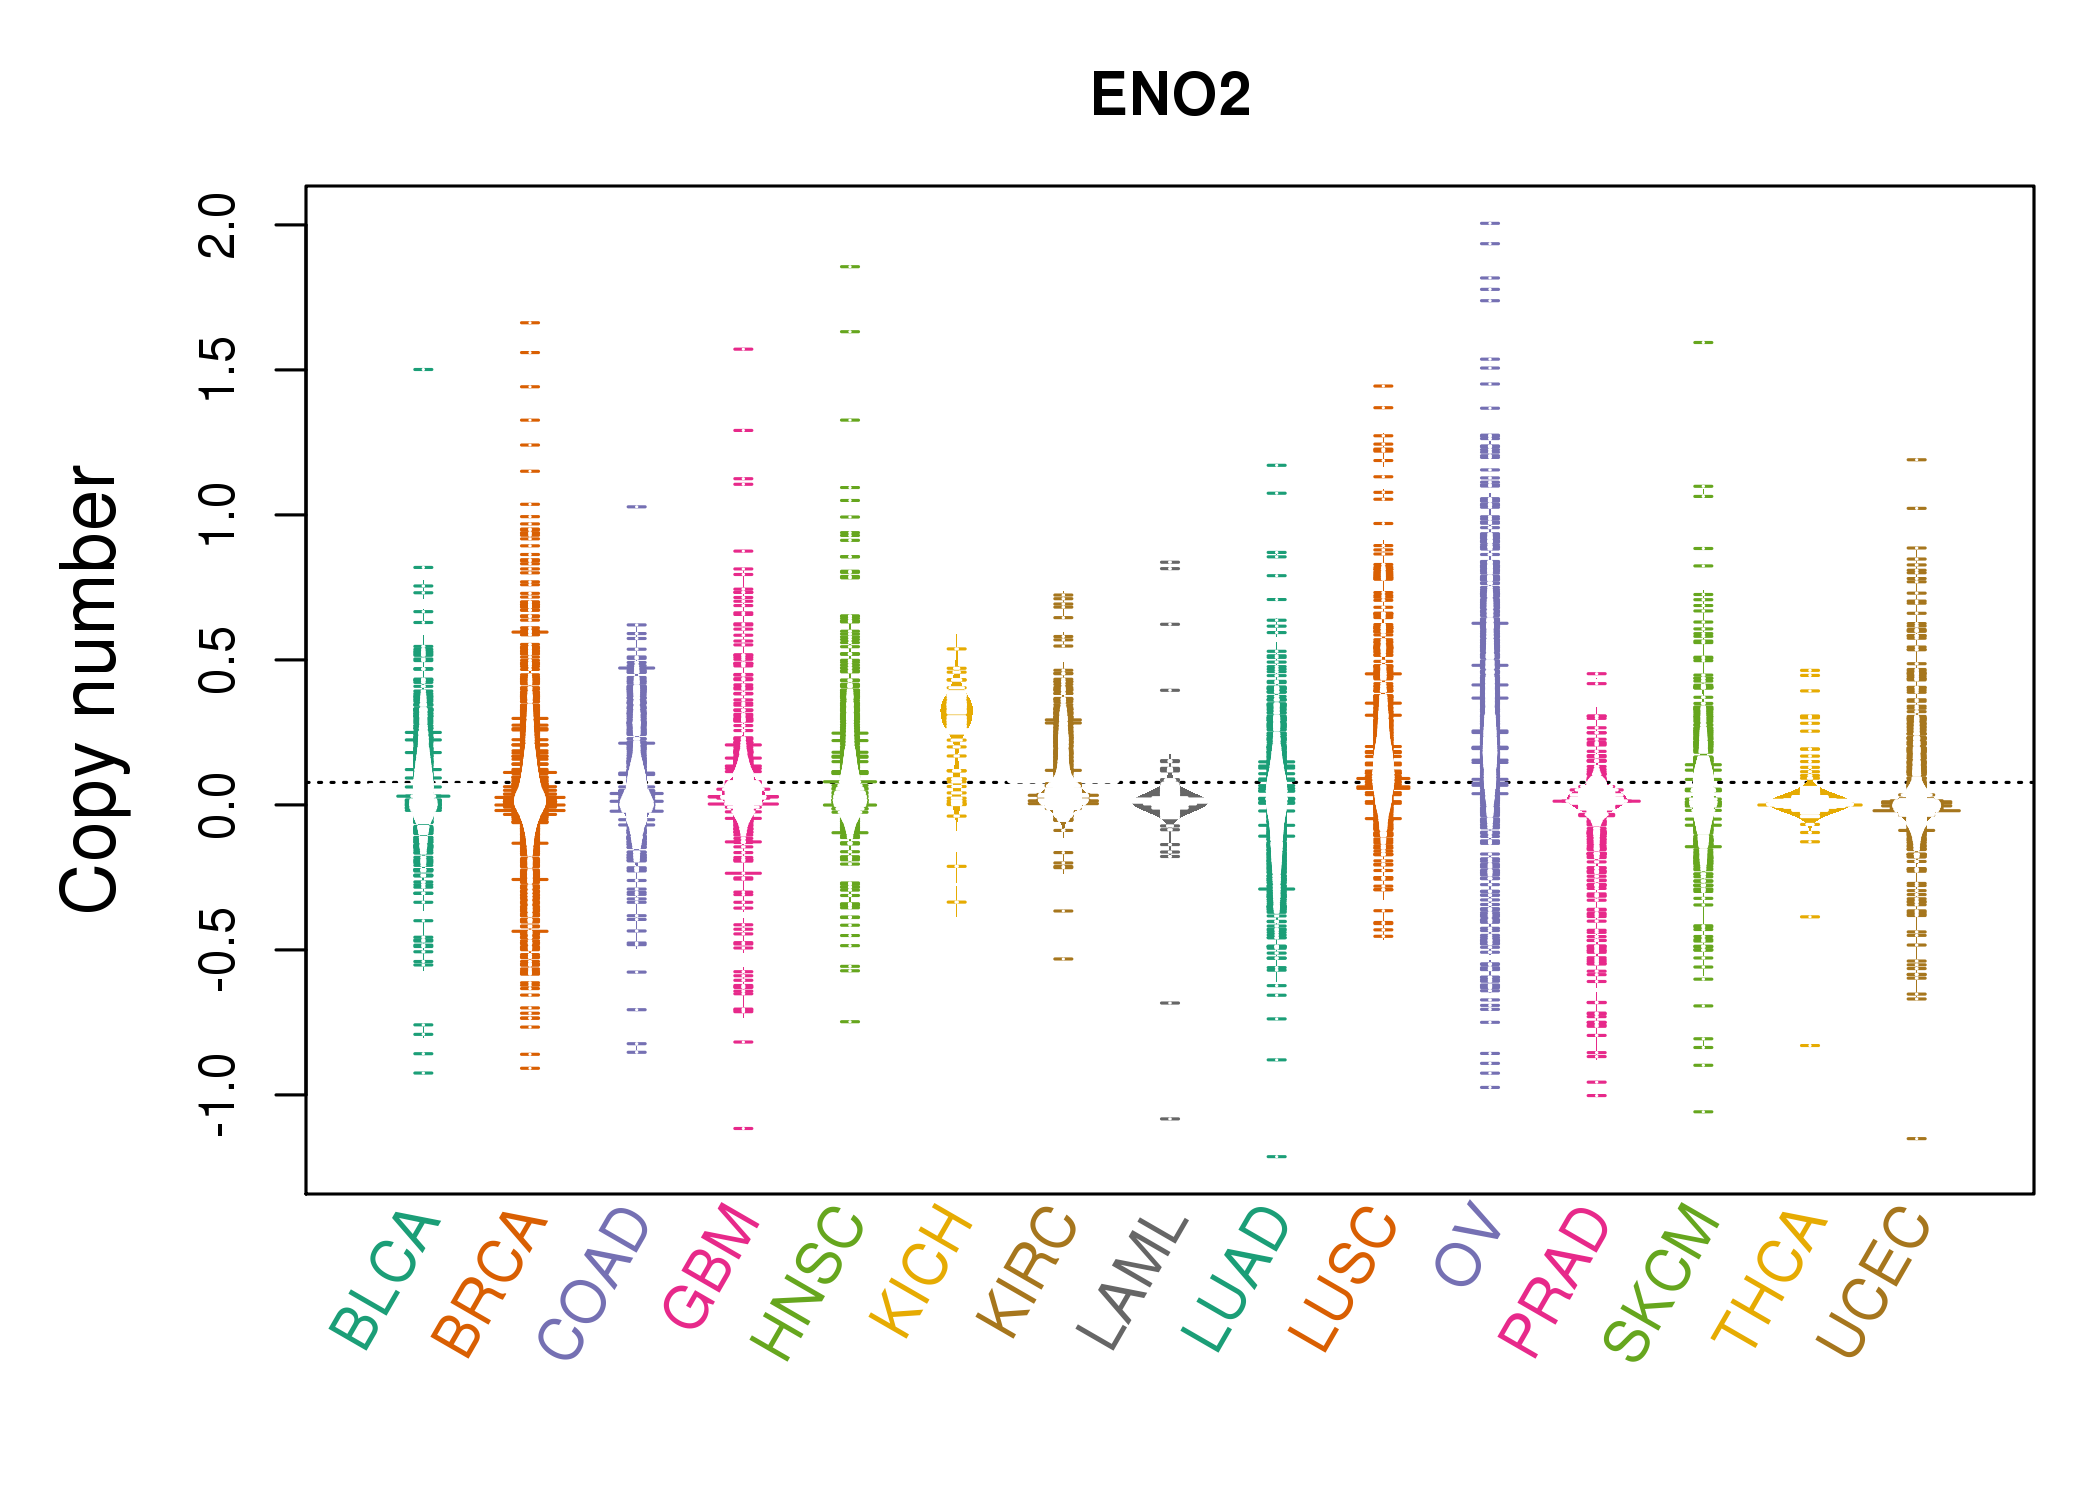 |
| cf) Tissue ID[Tissue type]: BLCA[Bladder Urothelial Carcinoma], BRCA[Breast invasive carcinoma], CESC[Cervical squamous cell carcinoma and endocervical adenocarcinoma], COAD[Colon adenocarcinoma], GBM[Glioblastoma multiforme], Glioma Low Grade, HNSC[Head and Neck squamous cell carcinoma], KICH[Kidney Chromophobe], KIRC[Kidney renal clear cell carcinoma], KIRP[Kidney renal papillary cell carcinoma], LAML[Acute Myeloid Leukemia], LUAD[Lung adenocarcinoma], LUSC[Lung squamous cell carcinoma], OV[Ovarian serous cystadenocarcinoma ], PAAD[Pancreatic adenocarcinoma], PRAD[Prostate adenocarcinoma], SKCM[Skin Cutaneous Melanoma], STAD[Stomach adenocarcinoma], THCA[Thyroid carcinoma], UCEC[Uterine Corpus Endometrial Carcinoma] |
| Top |
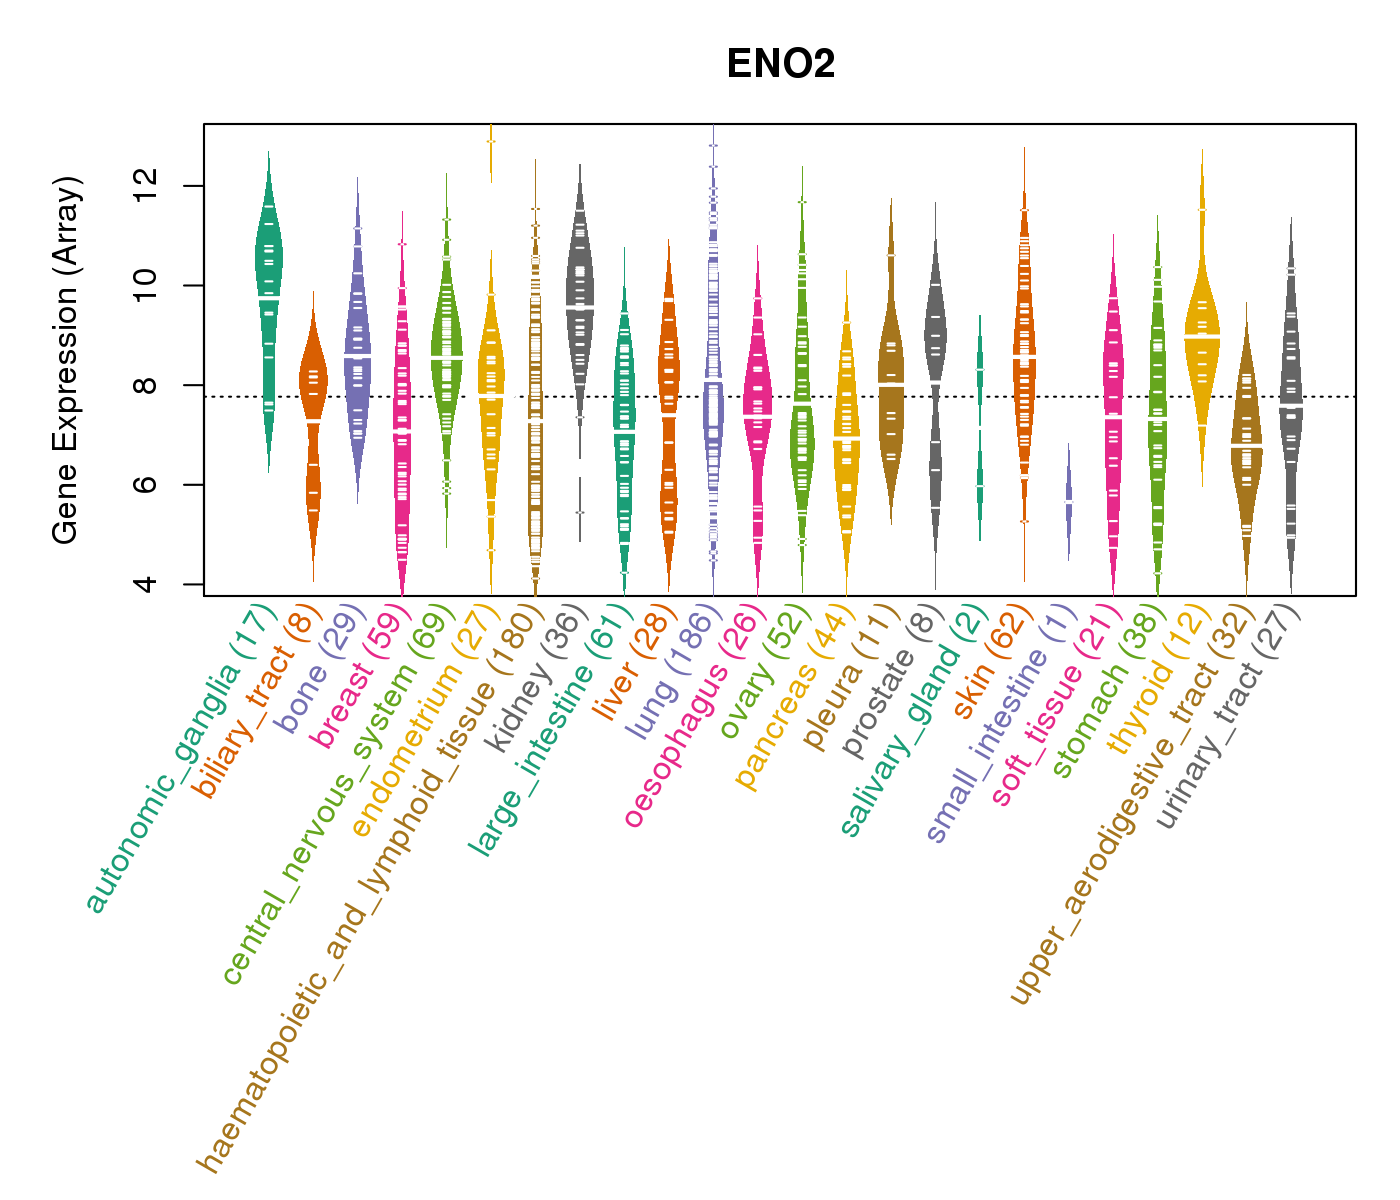
| Gene Expression for ENO2 |
| * CCLE gene expression data were extracted from CCLE_Expression_Entrez_2012-10-18.res: Gene-centric RMA-normalized mRNA expression data. |
 |
| * Normalized gene expression data of RNASeqV2 was extracted from TCGA using R package TCGA-Assembler. The URLs of all public data files on TCGA DCC data server were gathered at Jan-05-2015. Only eight cancer types have enough normal control samples for differential expression analysis. (t test, adjusted p<0.05 (using Benjamini-Hochberg FDR)) |
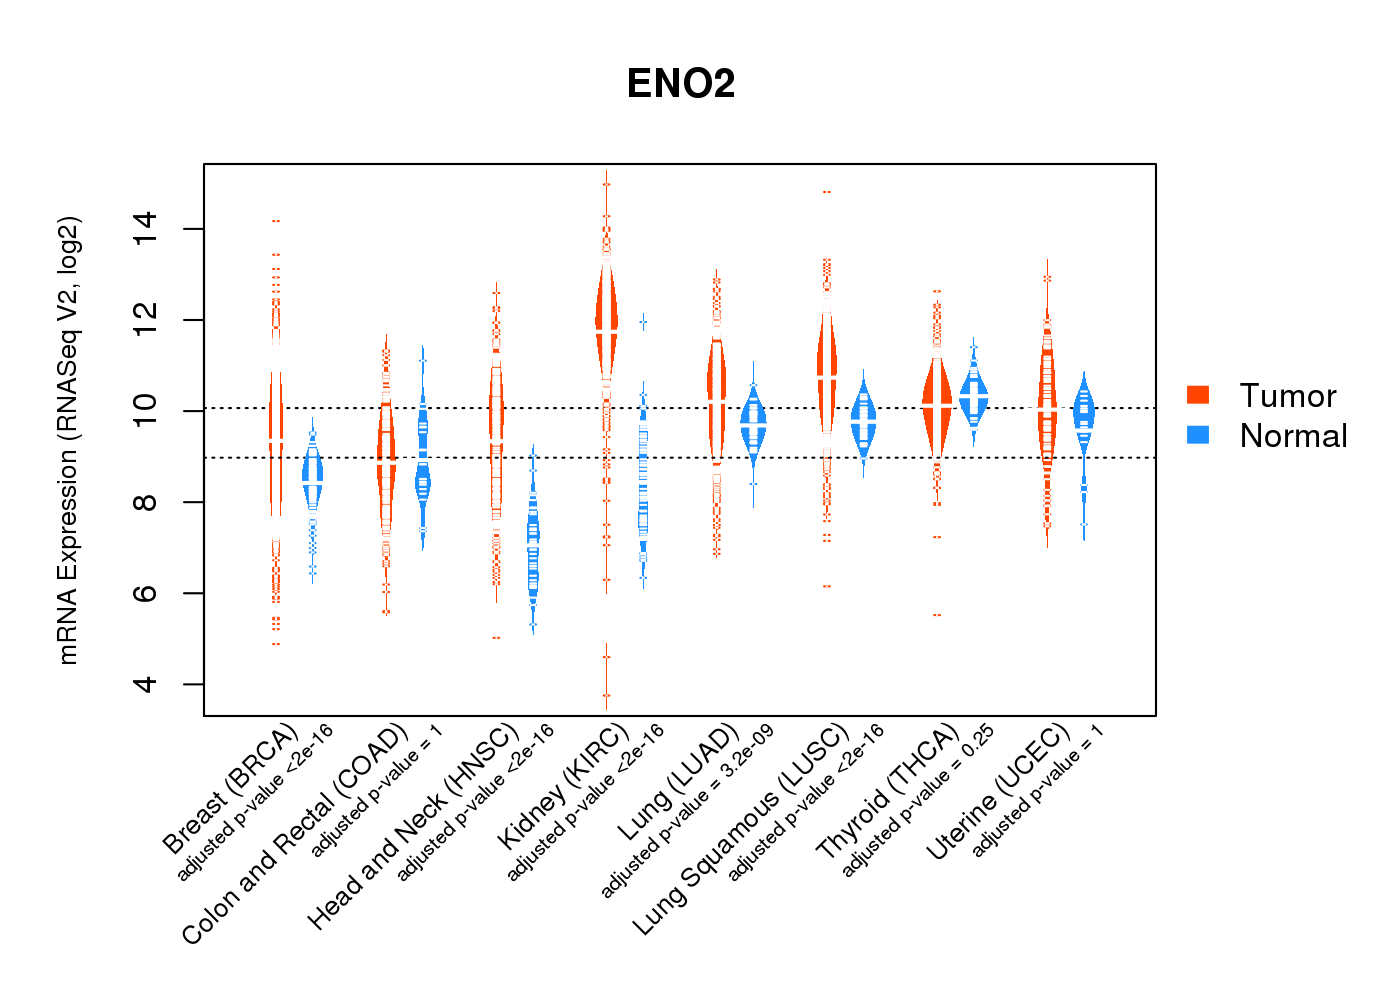 |
| Top |
| * This plots show the correlation between CNV and gene expression. |
: Open all plots for all cancer types
 |
|
 |
|
| Top |
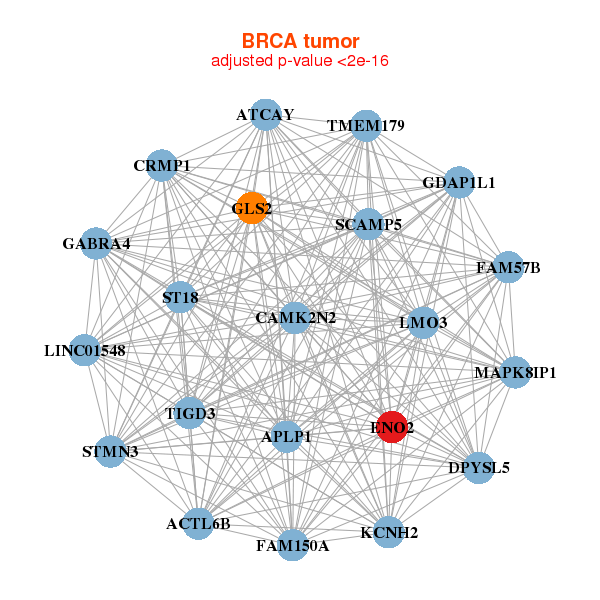
| Gene-Gene Network Information |
| * Co-Expression network figures were drawn using R package igraph. Only the top 20 genes with the highest correlations were shown. Red circle: input gene, orange circle: cell metabolism gene, sky circle: other gene |
: Open all plots for all cancer types
 |
|
| ACTL6B,APLP1,ATCAY,LINC01548,CAMK2N2,CRMP1,DPYSL5, ENO2,FAM150A,FAM57B,GABRA4,GDAP1L1,GLS2,KCNH2, LMO3,MAPK8IP1,SCAMP5,ST18,STMN3,TIGD3,TMEM179 | ACTR5,AZIN2,APOBEC3G,ATG9B,C11orf80,CABLES2,CDK2, DEF6,DGKA,DMKN,ENO2,FBXO41,FCHSD1,FER1L4, GNB5,HDAC1,LOC643008,MAPK15,RND2,SMAGP,WNT10A |
 |
|
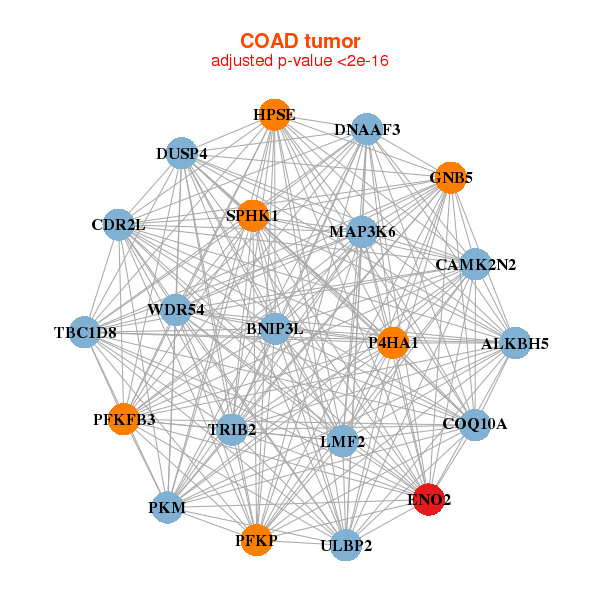
| ALKBH5,BNIP3L,DNAAF3,CAMK2N2,CDR2L,COQ10A,DUSP4, ENO2,GNB5,HPSE,LMF2,MAP3K6,P4HA1,PFKFB3, PFKP,PKM,SPHK1,TBC1D8,TRIB2,ULBP2,WDR54 | ADCY2,APBB1,CD81,CLIP3,DTX3,ENO2,FAM127C, FGFR1,GFRA1,GPRASP1,GRIK5,HAND2,JAM3,LIX1L, MAGED4B,MAGEE1,MEIS1,PGR,PLCL1,SLC4A3,SMARCA1 |
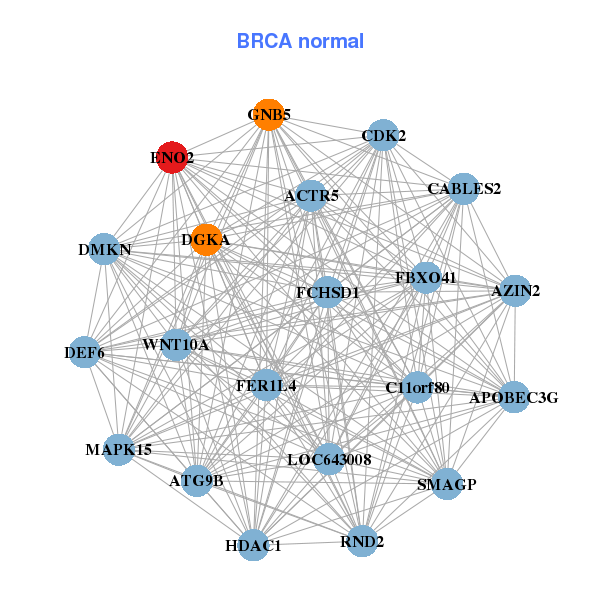
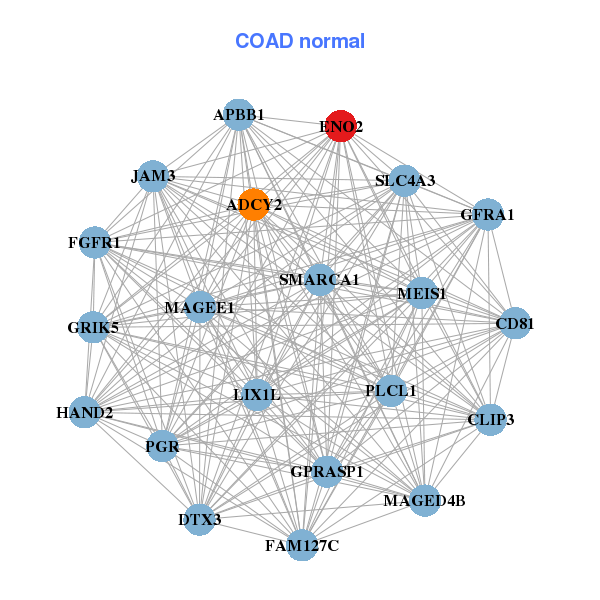
| * Co-Expression network figures were drawn using R package igraph. Only the top 20 genes with the highest correlations were shown. Red circle: input gene, orange circle: cell metabolism gene, sky circle: other gene |
: Open all plots for all cancer types
| Top |
: Open all interacting genes' information including KEGG pathway for all interacting genes from DAVID
| Top |
| Pharmacological Information for ENO2 |
| There's no related Drug. |
| Top |
| Cross referenced IDs for ENO2 |
| * We obtained these cross-references from Uniprot database. It covers 150 different DBs, 18 categories. http://www.uniprot.org/help/cross_references_section |
: Open all cross reference information
|
Copyright © 2016-Present - The Univsersity of Texas Health Science Center at Houston @ |