|
||||||||||||||||||||
| |
| Phenotypic Information (metabolism pathway, cancer, disease, phenome) |
| |
| |
| Gene-Gene Network Information: Co-Expression Network, Interacting Genes & KEGG |
| |
|


| Gene Summary for ENO3 |
| Basic gene info. | Gene symbol | ENO3 |
| Gene name | enolase 3 (beta, muscle) | |
| Synonyms | GSD13|MSE | |
| Cytomap | UCSC genome browser: 17p13.2 | |
| Genomic location | chr17 :4854383-4860426 | |
| Type of gene | protein-coding | |
| RefGenes | NM_001193503.1, NM_001976.4,NM_053013.3, | |
| Ensembl id | ENSG00000108515 | |
| Description | 2-phospho-D-glycerate hydrolyasebeta-enolasemuscle-specific enolaseskeletal muscle enolase | |
| Modification date | 20141207 | |
| dbXrefs | MIM : 131370 | |
| HGNC : HGNC | ||
| Ensembl : ENSG00000108515 | ||
| HPRD : 11746 | ||
| Vega : OTTHUMG00000099394 | ||
| Protein | UniProt: P13929 go to UniProt's Cross Reference DB Table | |
| Expression | CleanEX: HS_ENO3 | |
| BioGPS: 2027 | ||
| Gene Expression Atlas: ENSG00000108515 | ||
| The Human Protein Atlas: ENSG00000108515 | ||
| Pathway | NCI Pathway Interaction Database: ENO3 | |
| KEGG: ENO3 | ||
| REACTOME: ENO3 | ||
| ConsensusPathDB | ||
| Pathway Commons: ENO3 | ||
| Metabolism | MetaCyc: ENO3 | |
| HUMANCyc: ENO3 | ||
| Regulation | Ensembl's Regulation: ENSG00000108515 | |
| miRBase: chr17 :4,854,383-4,860,426 | ||
| TargetScan: NM_001193503 | ||
| cisRED: ENSG00000108515 | ||
| Context | iHOP: ENO3 | |
| cancer metabolism search in PubMed: ENO3 | ||
| UCL Cancer Institute: ENO3 | ||
| Assigned class in ccmGDB | A - This gene has a literature evidence and it belongs to cancer gene. | |
| References showing role of ENO3 in cancer cell metabolism | 1. Li JL, Fei Q, Yu J, Zhang HY, Wang P, et al. (2004) Correlation between methylation profile of promoter cpg islands of seven metastasis-associated genes and their expression states in six cell lines of liver origin. Ai Zheng 23: 985-991. go to article | |
| Top |
| Phenotypic Information for ENO3(metabolism pathway, cancer, disease, phenome) |
| Cancer | CGAP: ENO3 |
| Familial Cancer Database: ENO3 | |
| * This gene is included in those cancer gene databases. |
|
|
|
|
|
|
| ||||||||||||||
Oncogene 1 | Significant driver gene in | |||||||||||||||||||
| cf) number; DB name 1 Oncogene; http://nar.oxfordjournals.org/content/35/suppl_1/D721.long, 2 Tumor Suppressor gene; https://bioinfo.uth.edu/TSGene/, 3 Cancer Gene Census; http://www.nature.com/nrc/journal/v4/n3/abs/nrc1299.html, 4 CancerGenes; http://nar.oxfordjournals.org/content/35/suppl_1/D721.long, 5 Network of Cancer Gene; http://ncg.kcl.ac.uk/index.php, 1Therapeutic Vulnerabilities in Cancer; http://cbio.mskcc.org/cancergenomics/statius/ |
| KEGG_GLYCOLYSIS_GLUCONEOGENESIS REACTOME_METABOLISM_OF_CARBOHYDRATES REACTOME_GLUCOSE_METABOLISM | |
| OMIM | 131370; gene. 612932; phenotype. |
| Orphanet | 99849; Glycogen storage disease due to muscle beta-enolase deficiency. |
| Disease | KEGG Disease: ENO3 |
| MedGen: ENO3 (Human Medical Genetics with Condition) | |
| ClinVar: ENO3 | |
| Phenotype | MGI: ENO3 (International Mouse Phenotyping Consortium) |
| PhenomicDB: ENO3 | |
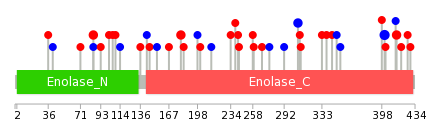
| Mutations for ENO3 |
| * Under tables are showing count per each tissue to give us broad intuition about tissue specific mutation patterns.You can go to the detailed page for each mutation database's web site. |
| There's no structural variation information in COSMIC data for this gene. |
| * From mRNA Sanger sequences, Chitars2.0 arranged chimeric transcripts. This table shows ENO3 related fusion information. |
| ID | Head Gene | Tail Gene | Accession | Gene_a | qStart_a | qEnd_a | Chromosome_a | tStart_a | tEnd_a | Gene_a | qStart_a | qEnd_a | Chromosome_a | tStart_a | tEnd_a |
| CV314769 | ENO3 | 17 | 273 | 17 | 4857362 | 4857622 | VIM | 258 | 433 | 10 | 17277580 | 17277755 | |
| Top |
| There's no copy number variation information in COSMIC data for this gene. |
| Top |
|
 |
| Top |
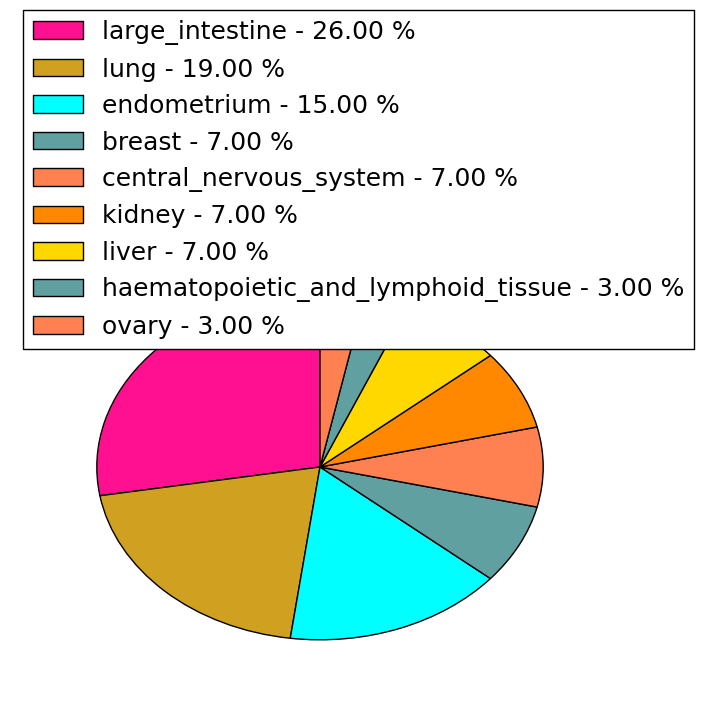
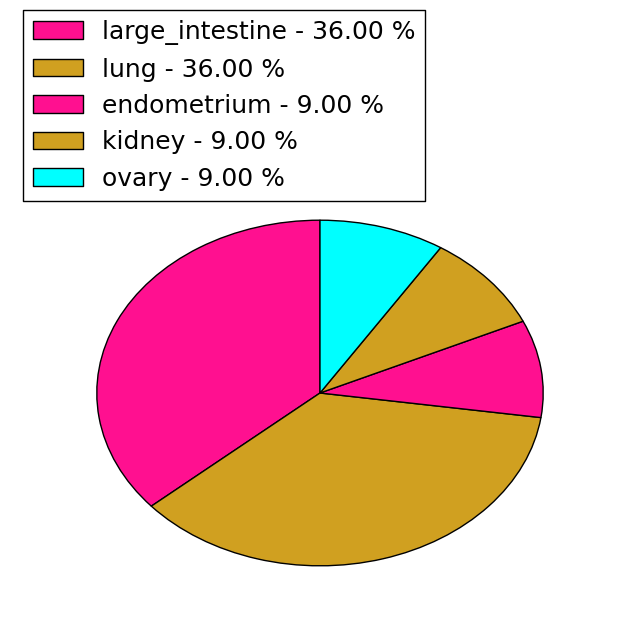
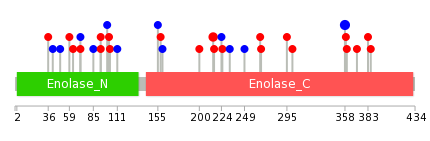
| Stat. for Non-Synonymous SNVs (# total SNVs=26) | (# total SNVs=11) |
 |  |
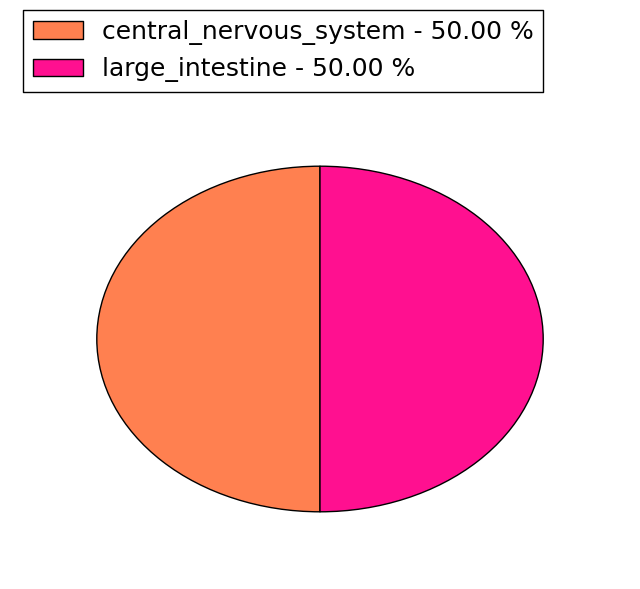
(# total SNVs=2) | (# total SNVs=0) |
 |
| Top |
| * When you move the cursor on each content, you can see more deailed mutation information on the Tooltip. Those are primary_site,primary_histology,mutation(aa),pubmedID. |
| GRCh37 position | Mutation(aa) | Unique sampleID count |
| chr17:4860152-4860152 | p.S401S | 3 |
| chr17:4856580-4856580 | p.V85A | 2 |
| chr17:4858465-4858465 | p.E180D | 2 |
| chr17:4859292-4859292 | p.F307F | 2 |
| chr17:4860277-4860277 | p.E414K | 2 |
| chr17:4858387-4858387 | p.N154N | 1 |
| chr17:4860313-4860313 | p.R426C | 1 |
| chr17:4858806-4858806 | p.D258N | 1 |
| chr17:4859418-4859418 | p.S349S | 1 |
| chr17:4858424-4858424 | p.E167K | 1 |
| Top |
|
 |
| Point Mutation/ Tissue ID | 1 | 2 | 3 | 4 | 5 | 6 | 7 | 8 | 9 | 10 | 11 | 12 | 13 | 14 | 15 | 16 | 17 | 18 | 19 | 20 |
| # sample | 2 | 2 | 6 | 1 | 7 | 2 | 1 | 5 | 5 | 5 | ||||||||||
| # mutation | 2 | 2 | 6 | 1 | 7 | 2 | 1 | 5 | 5 | 5 | ||||||||||
| nonsynonymous SNV | 1 | 2 | 4 | 1 | 3 | 1 | 3 | 3 | 4 | |||||||||||
| synonymous SNV | 1 | 2 | 4 | 1 | 1 | 2 | 2 | 1 |
| cf) Tissue ID; Tissue type (1; BLCA[Bladder Urothelial Carcinoma], 2; BRCA[Breast invasive carcinoma], 3; CESC[Cervical squamous cell carcinoma and endocervical adenocarcinoma], 4; COAD[Colon adenocarcinoma], 5; GBM[Glioblastoma multiforme], 6; Glioma Low Grade, 7; HNSC[Head and Neck squamous cell carcinoma], 8; KICH[Kidney Chromophobe], 9; KIRC[Kidney renal clear cell carcinoma], 10; KIRP[Kidney renal papillary cell carcinoma], 11; LAML[Acute Myeloid Leukemia], 12; LUAD[Lung adenocarcinoma], 13; LUSC[Lung squamous cell carcinoma], 14; OV[Ovarian serous cystadenocarcinoma ], 15; PAAD[Pancreatic adenocarcinoma], 16; PRAD[Prostate adenocarcinoma], 17; SKCM[Skin Cutaneous Melanoma], 18:STAD[Stomach adenocarcinoma], 19:THCA[Thyroid carcinoma], 20:UCEC[Uterine Corpus Endometrial Carcinoma]) |
| Top |
| * We represented just top 10 SNVs. When you move the cursor on each content, you can see more deailed mutation information on the Tooltip. Those are primary_site, primary_histology, mutation(aa), pubmedID. |
| Genomic Position | Mutation(aa) | Unique sampleID count |
| chr17:4860152 | p.S358S,ENO3 | 3 |
| chr17:4858806 | p.D215N,ENO3 | 2 |
| chr17:4860153 | p.L100L,ENO3 | 1 |
| chr17:4857014 | p.V301I,ENO3 | 1 |
| chr17:4858809 | p.P103L,ENO3 | 1 |
| chr17:4860157 | p.N111N,ENO3 | 1 |
| chr17:4857038 | p.E359K,ENO3 | 1 |
| chr17:4858835 | p.A155A,ENO3 | 1 |
| chr17:4860277 | p.R360H,ENO3 | 1 |
| chr17:4857102 | p.G158V,ENO3 | 1 |
| * Copy number data were extracted from TCGA using R package TCGA-Assembler. The URLs of all public data files on TCGA DCC data server were gathered on Jan-05-2015. Function ProcessCNAData in TCGA-Assembler package was used to obtain gene-level copy number value which is calculated as the average copy number of the genomic region of a gene. |
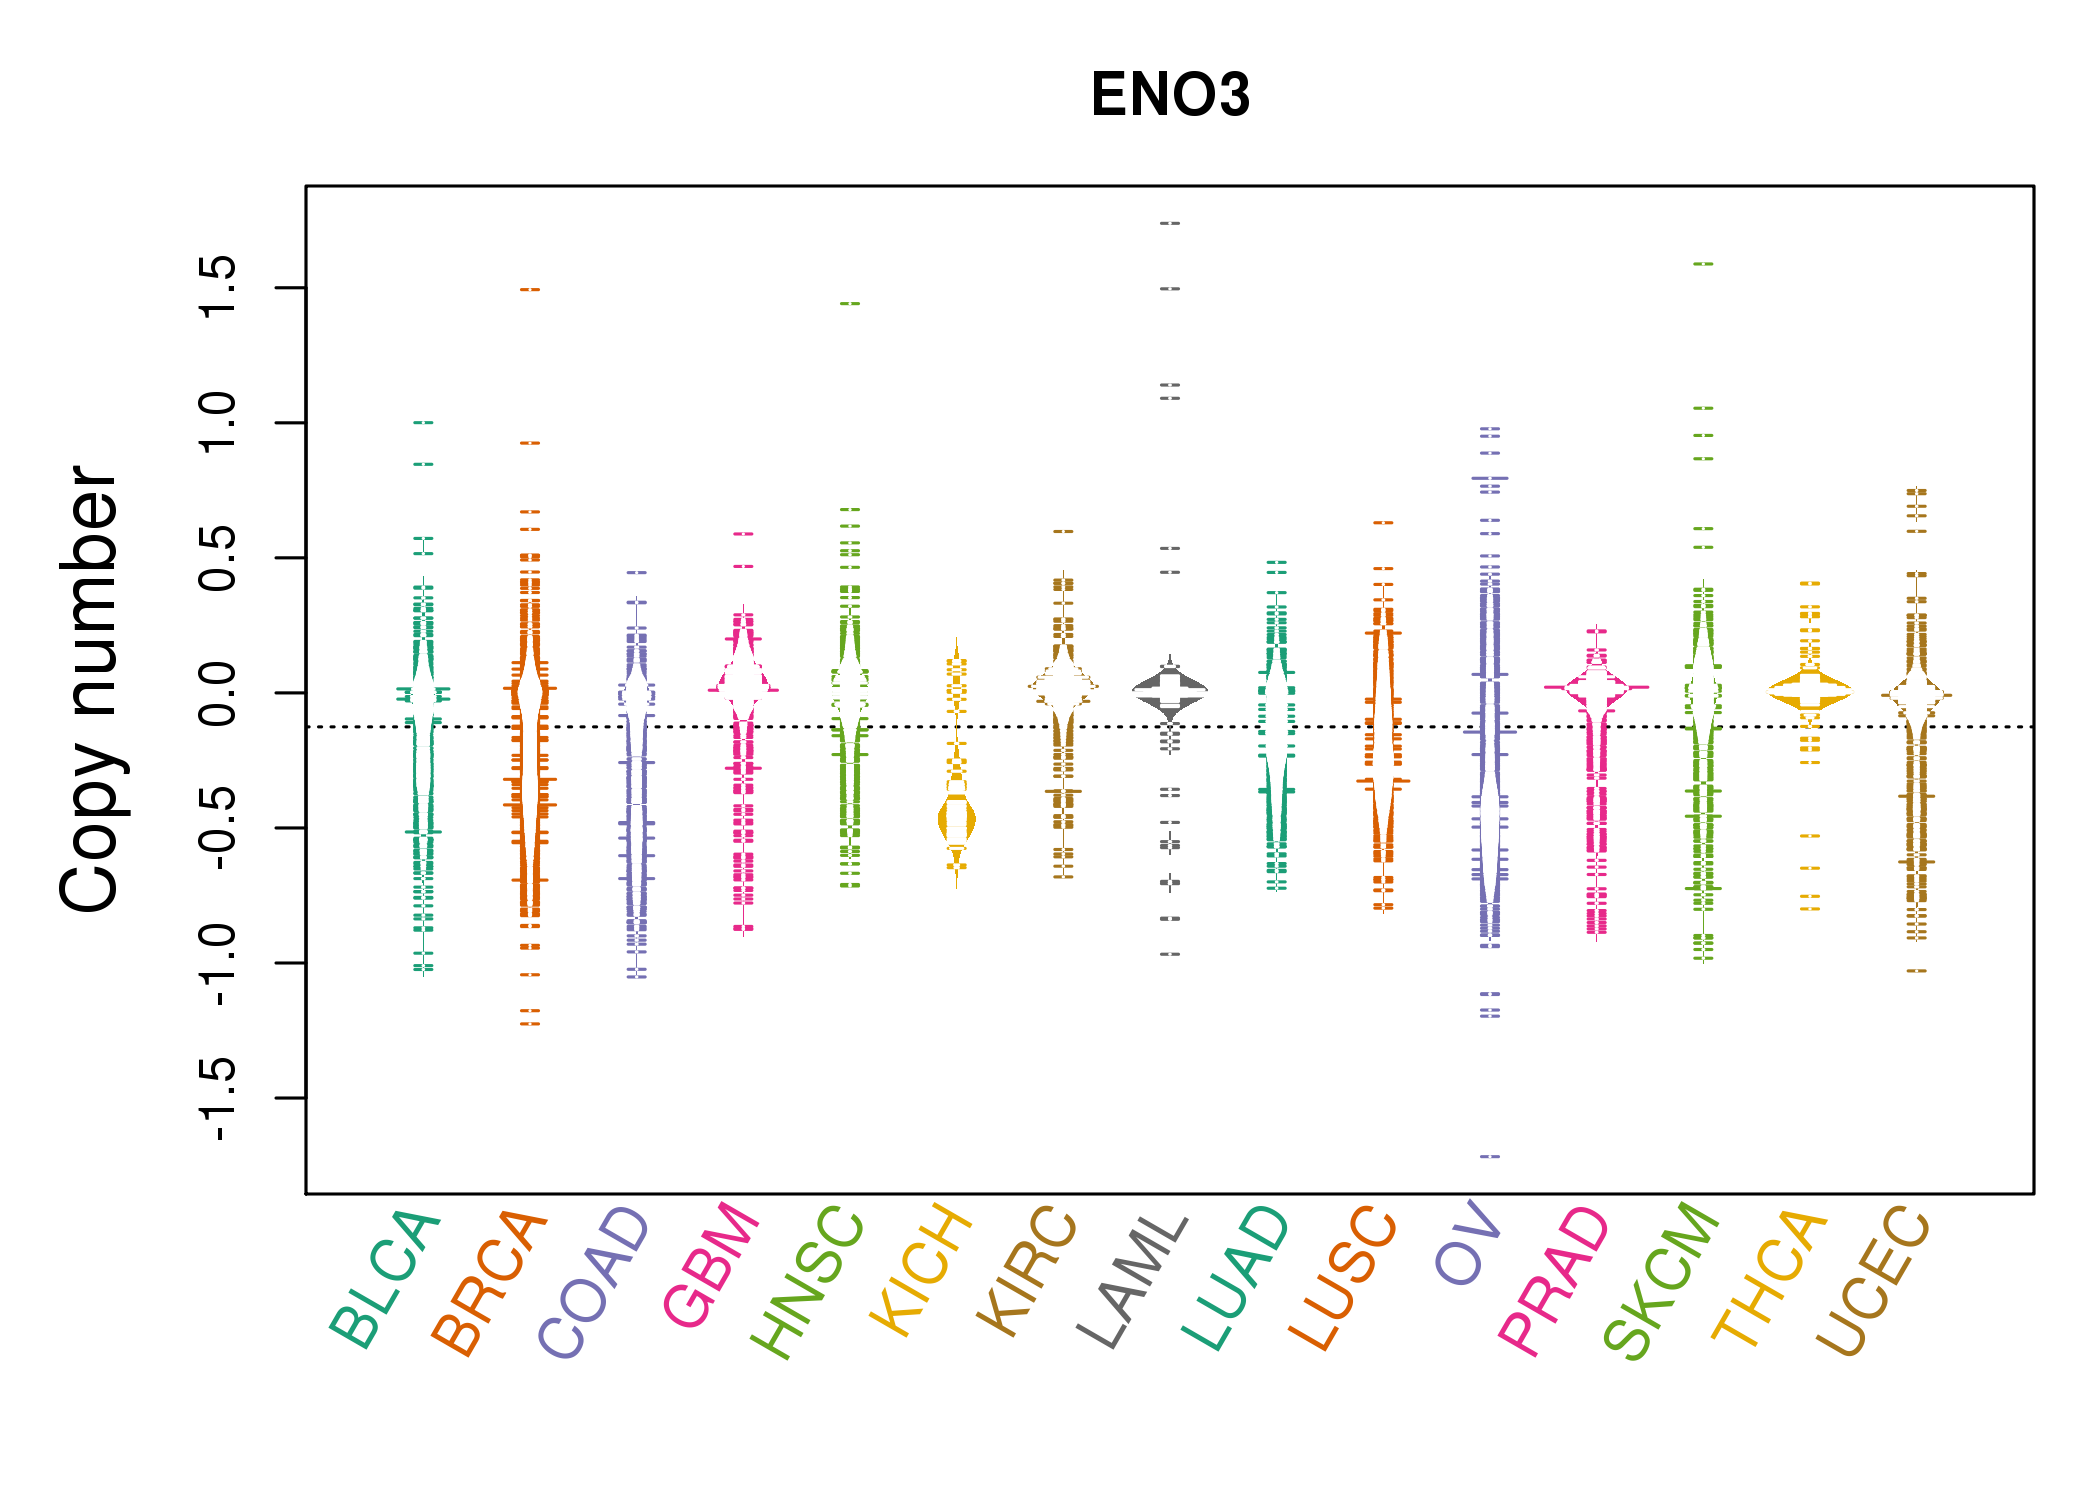 |
| cf) Tissue ID[Tissue type]: BLCA[Bladder Urothelial Carcinoma], BRCA[Breast invasive carcinoma], CESC[Cervical squamous cell carcinoma and endocervical adenocarcinoma], COAD[Colon adenocarcinoma], GBM[Glioblastoma multiforme], Glioma Low Grade, HNSC[Head and Neck squamous cell carcinoma], KICH[Kidney Chromophobe], KIRC[Kidney renal clear cell carcinoma], KIRP[Kidney renal papillary cell carcinoma], LAML[Acute Myeloid Leukemia], LUAD[Lung adenocarcinoma], LUSC[Lung squamous cell carcinoma], OV[Ovarian serous cystadenocarcinoma ], PAAD[Pancreatic adenocarcinoma], PRAD[Prostate adenocarcinoma], SKCM[Skin Cutaneous Melanoma], STAD[Stomach adenocarcinoma], THCA[Thyroid carcinoma], UCEC[Uterine Corpus Endometrial Carcinoma] |
| Top |
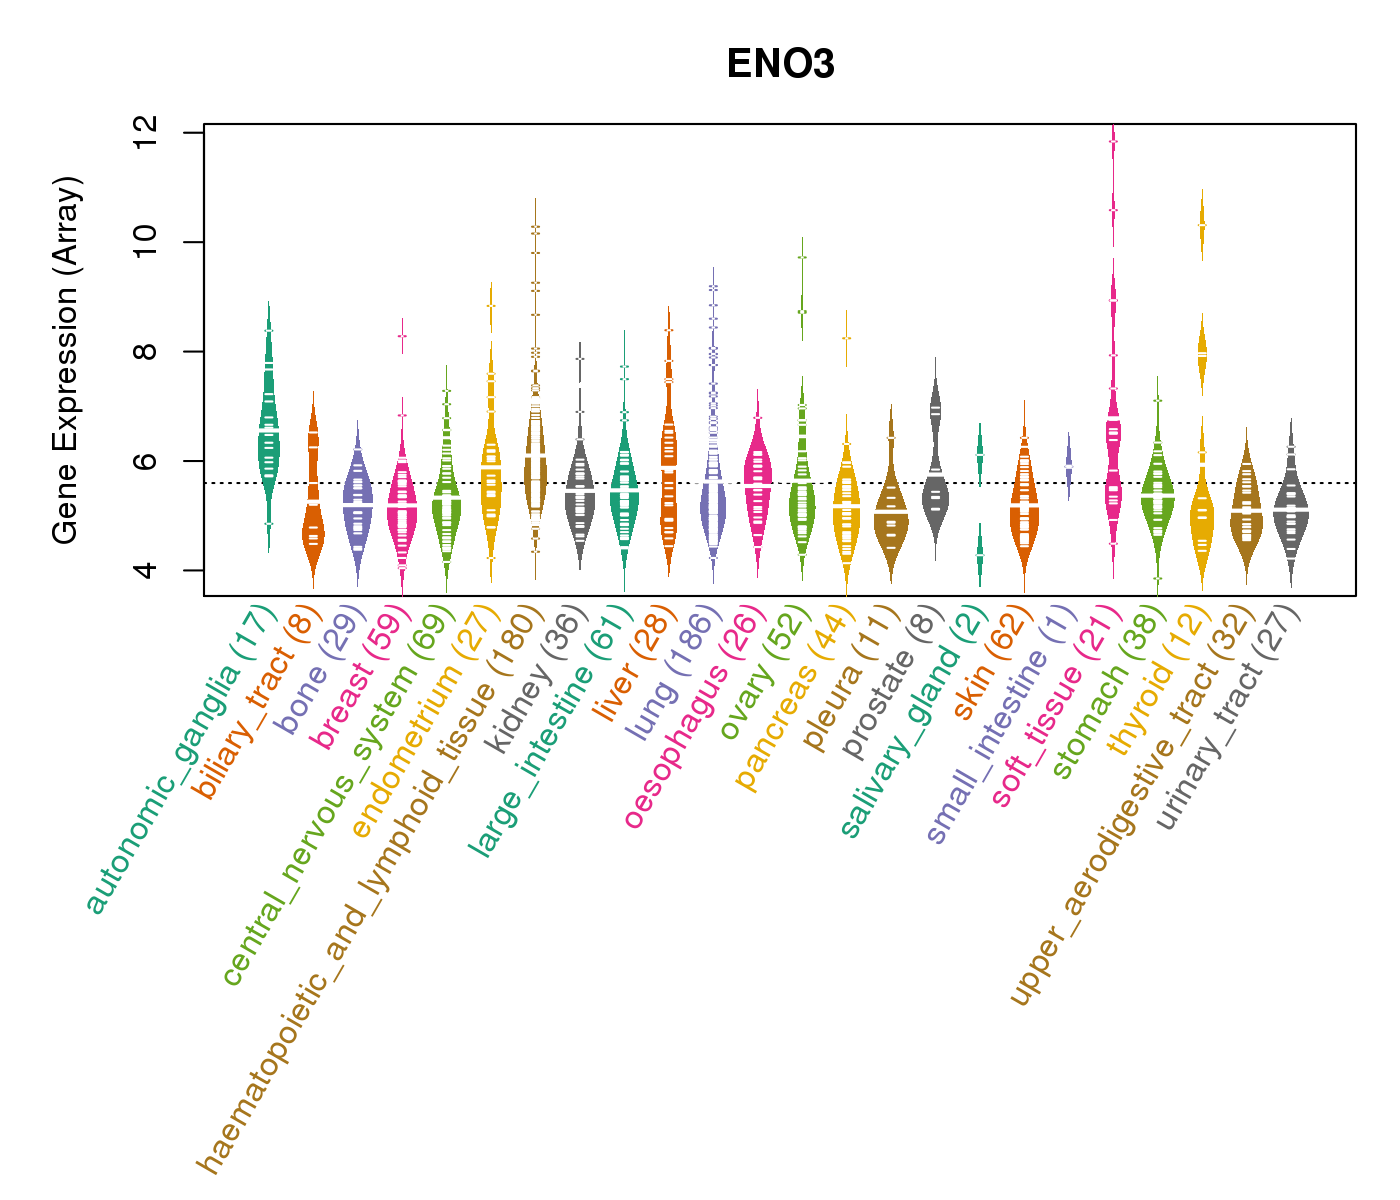
| Gene Expression for ENO3 |
| * CCLE gene expression data were extracted from CCLE_Expression_Entrez_2012-10-18.res: Gene-centric RMA-normalized mRNA expression data. |
 |
| * Normalized gene expression data of RNASeqV2 was extracted from TCGA using R package TCGA-Assembler. The URLs of all public data files on TCGA DCC data server were gathered at Jan-05-2015. Only eight cancer types have enough normal control samples for differential expression analysis. (t test, adjusted p<0.05 (using Benjamini-Hochberg FDR)) |
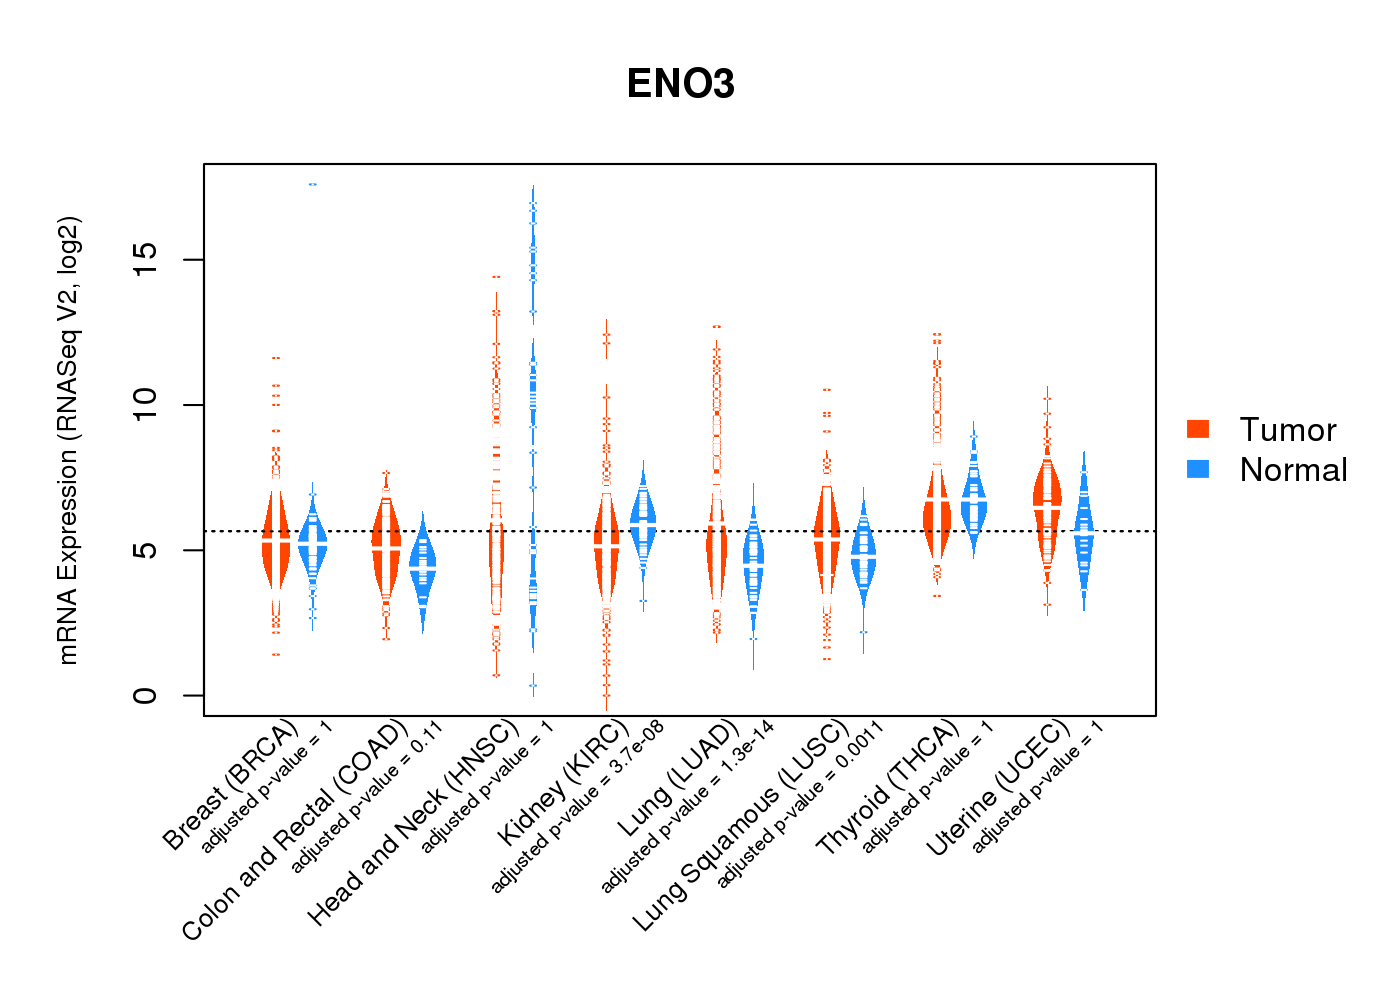 |
| Top |
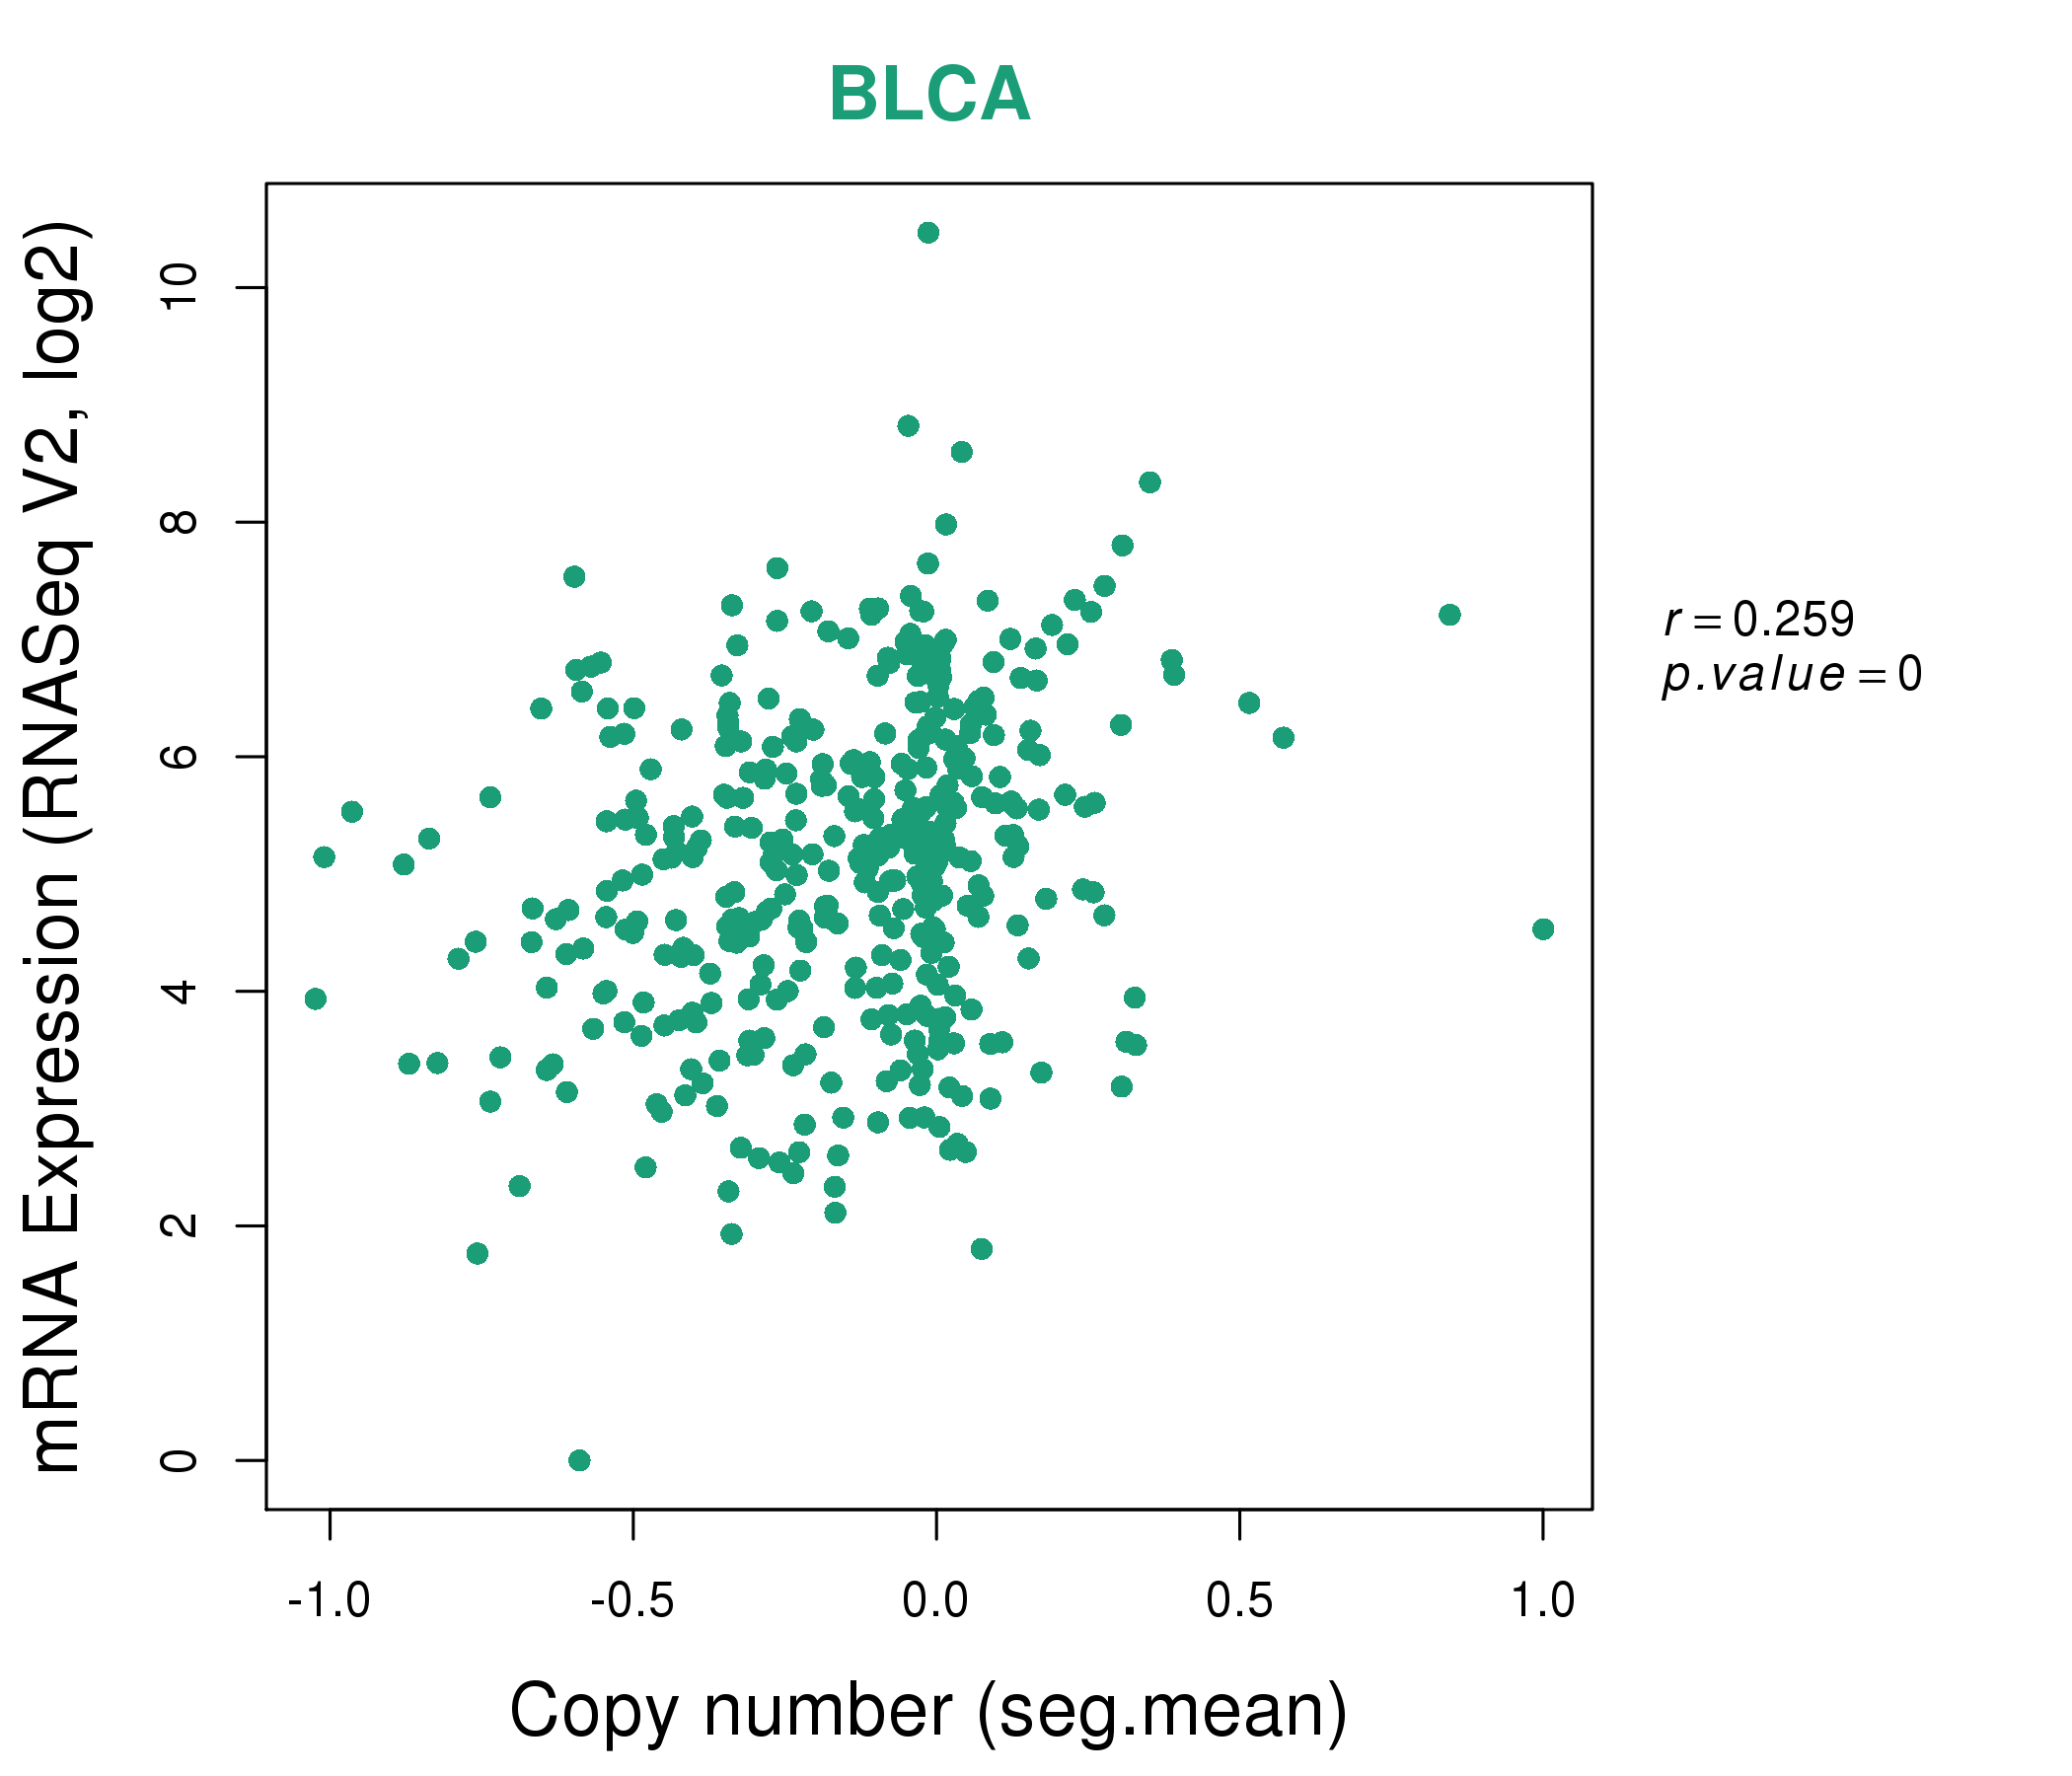
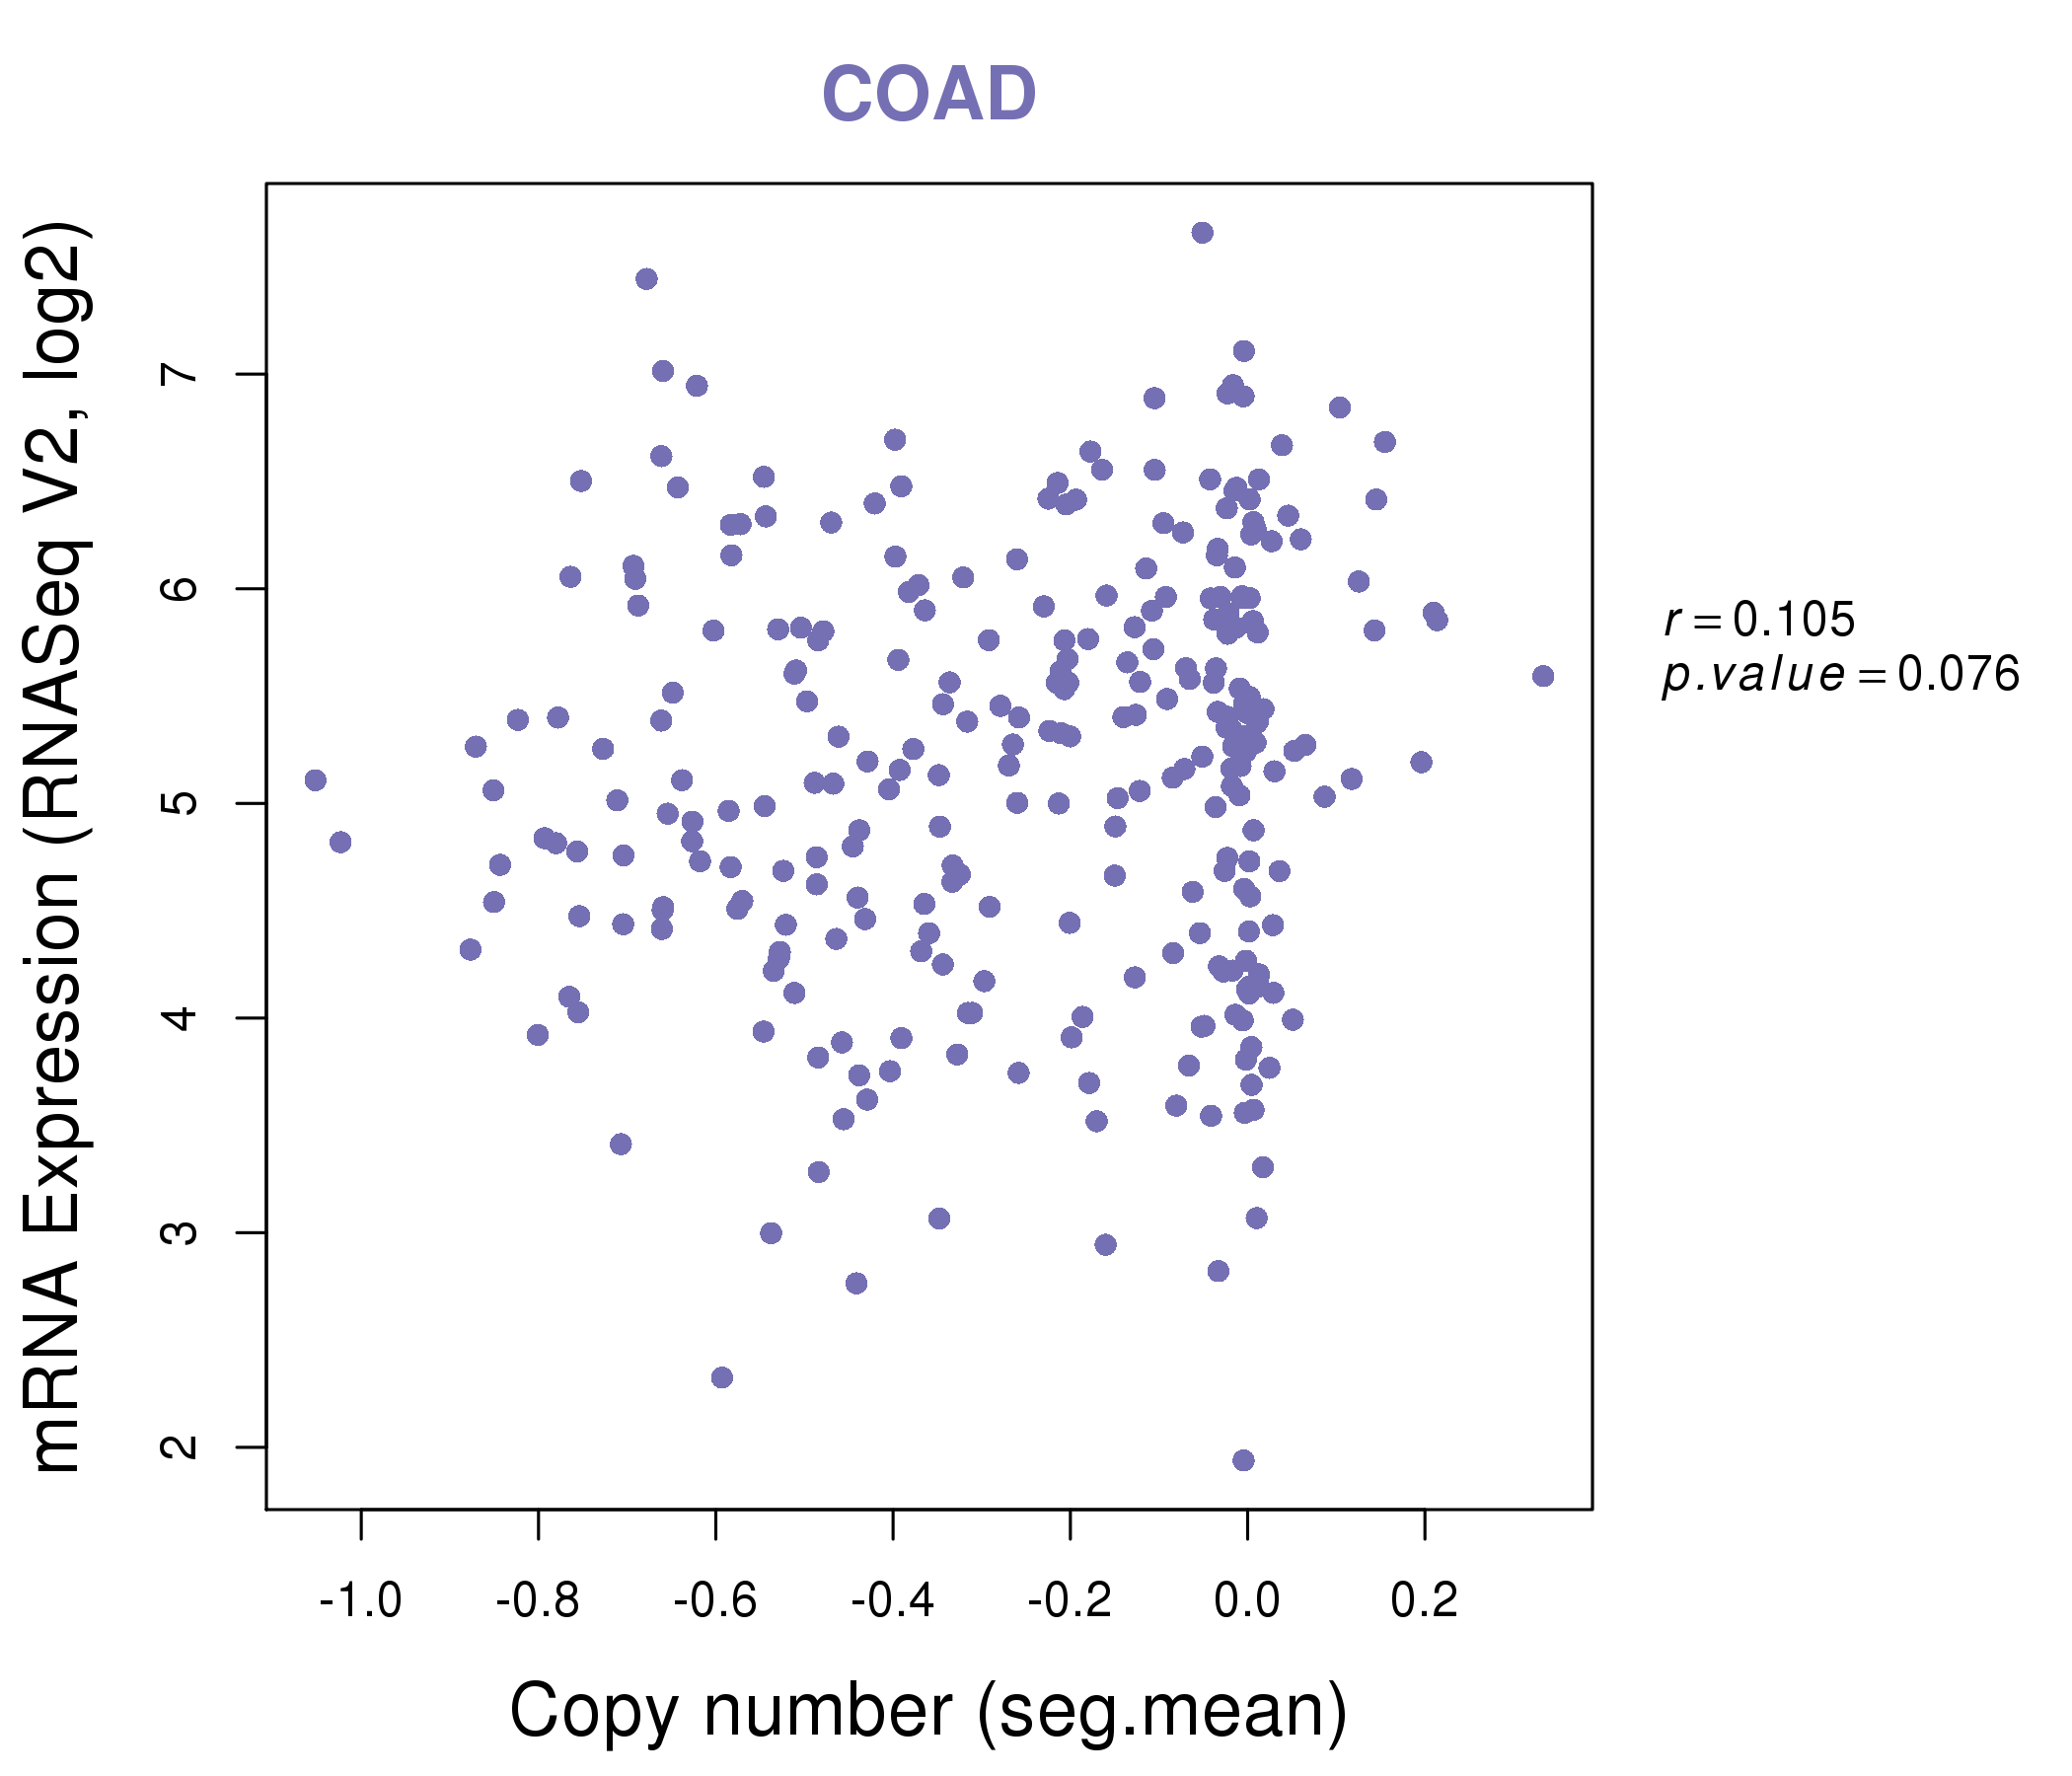
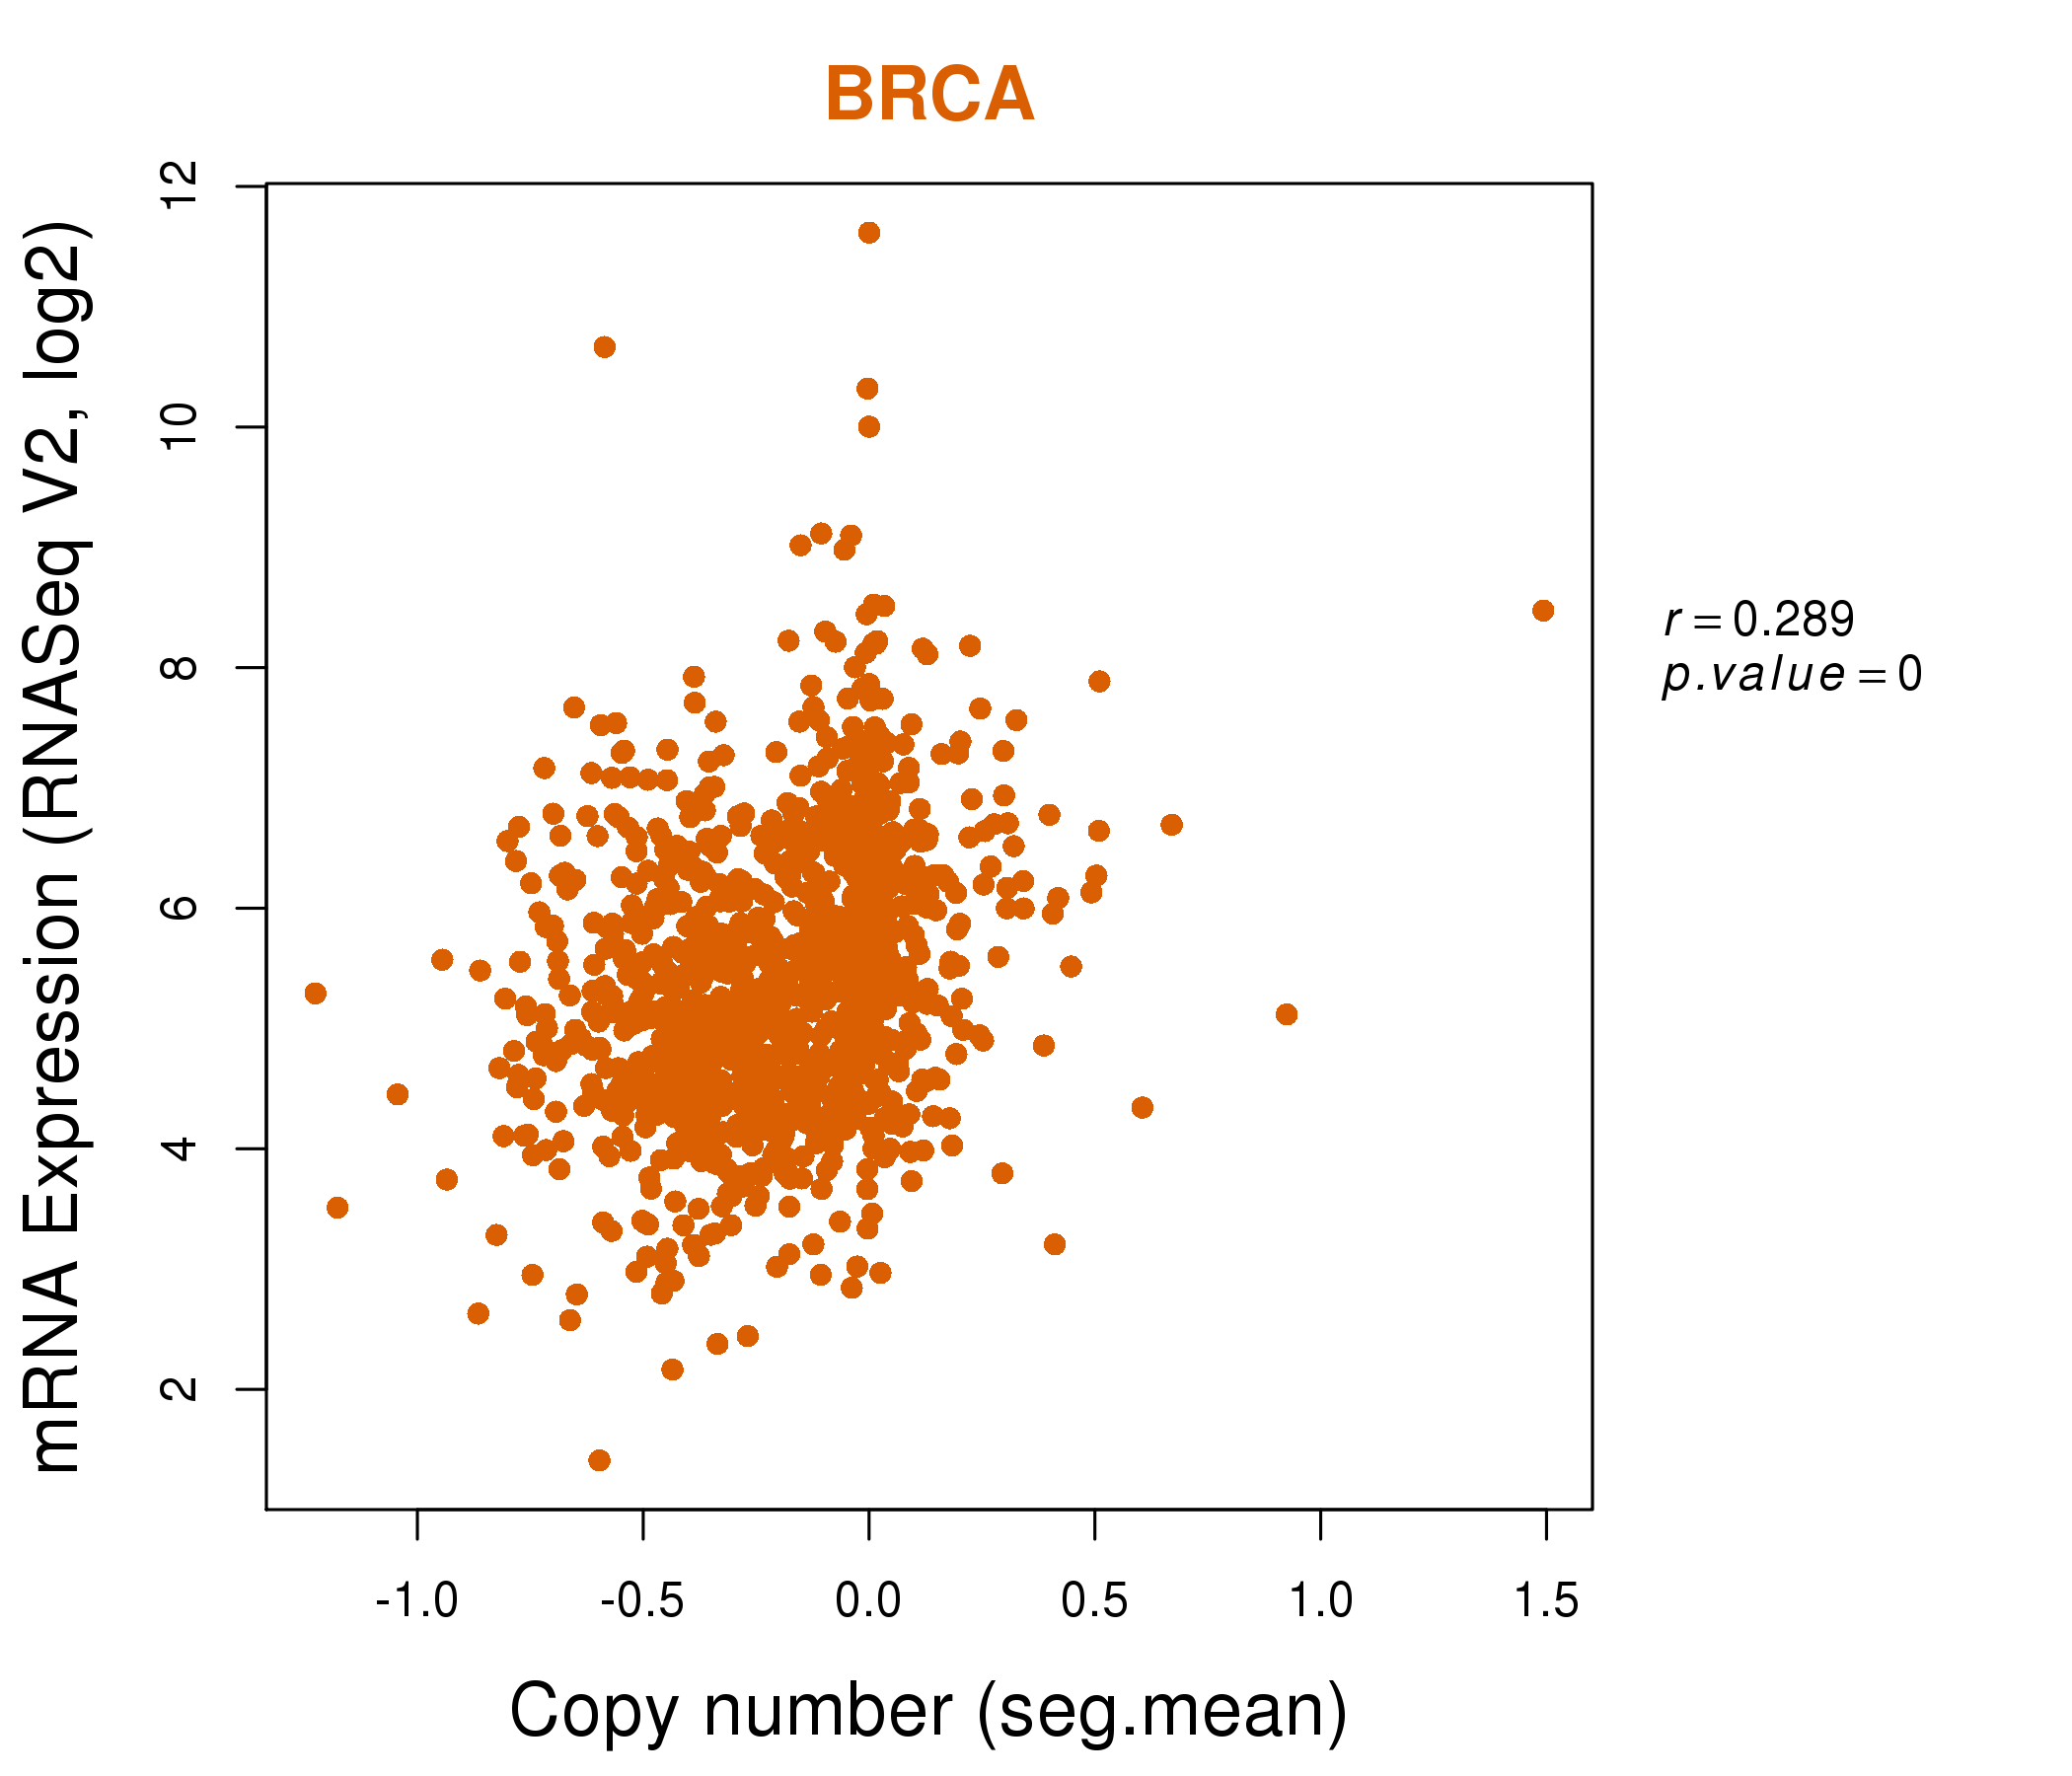
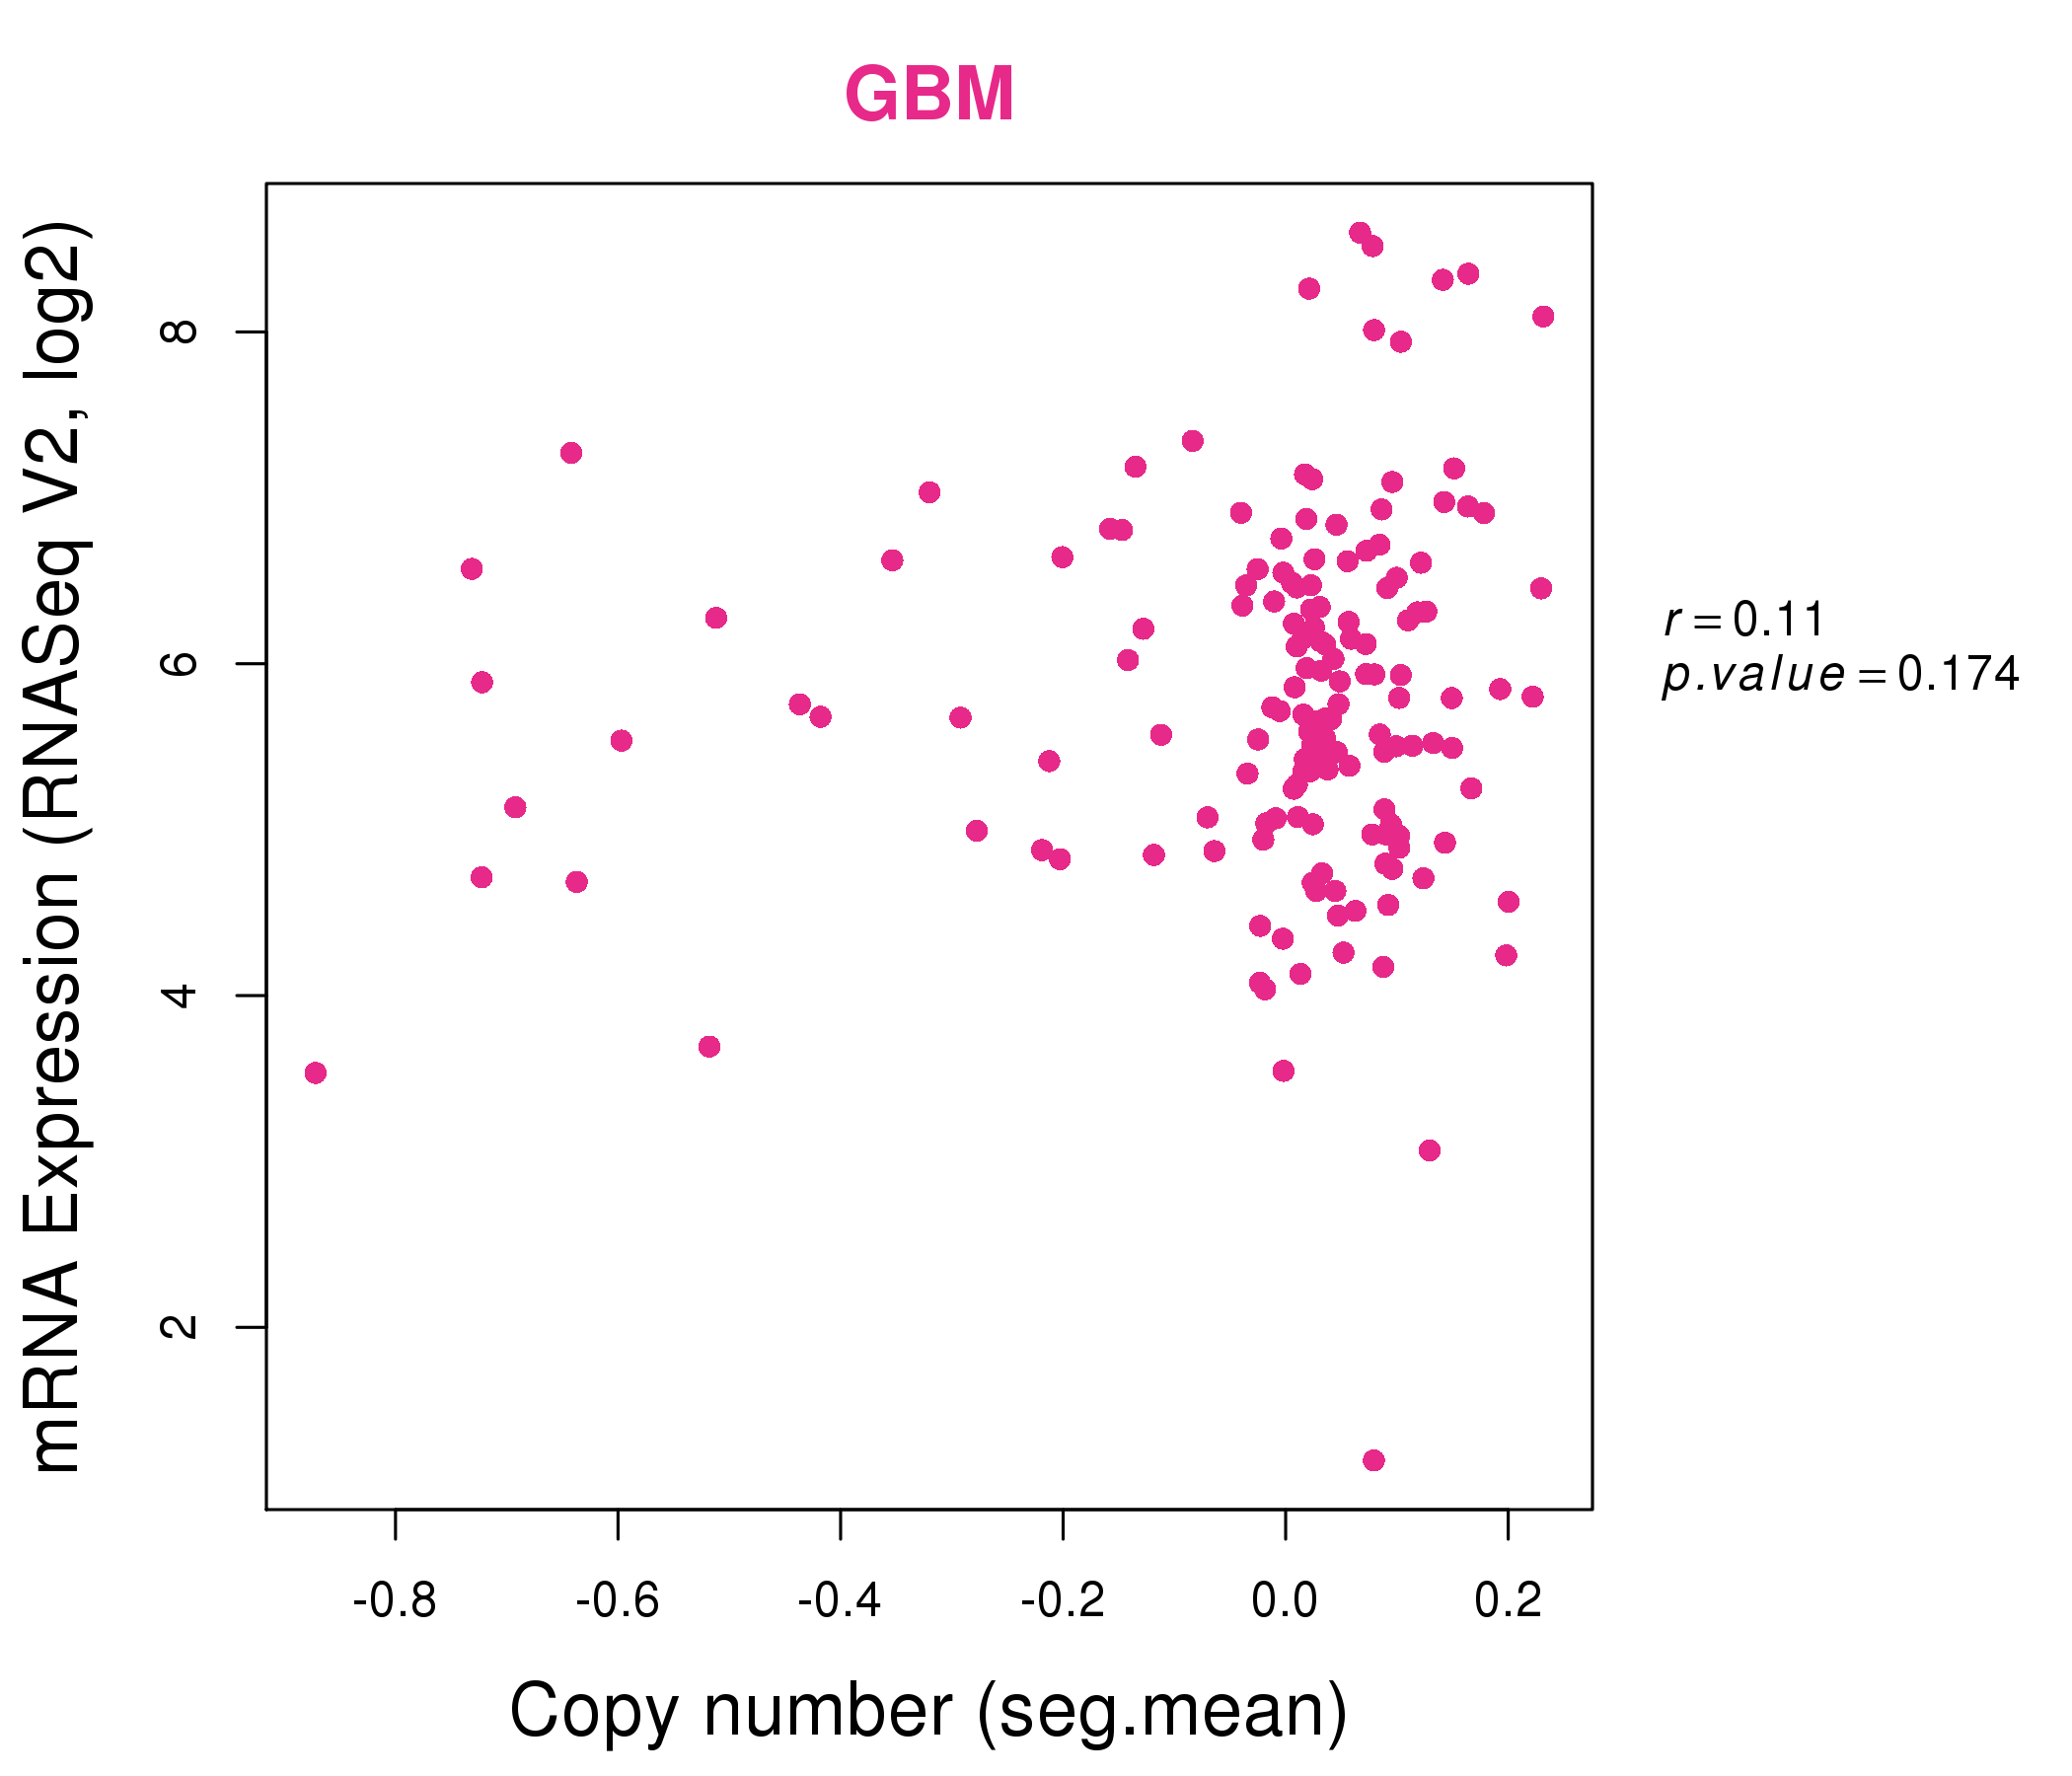
| * This plots show the correlation between CNV and gene expression. |
: Open all plots for all cancer types
 |
|
 |
|
| Top |
| Gene-Gene Network Information |
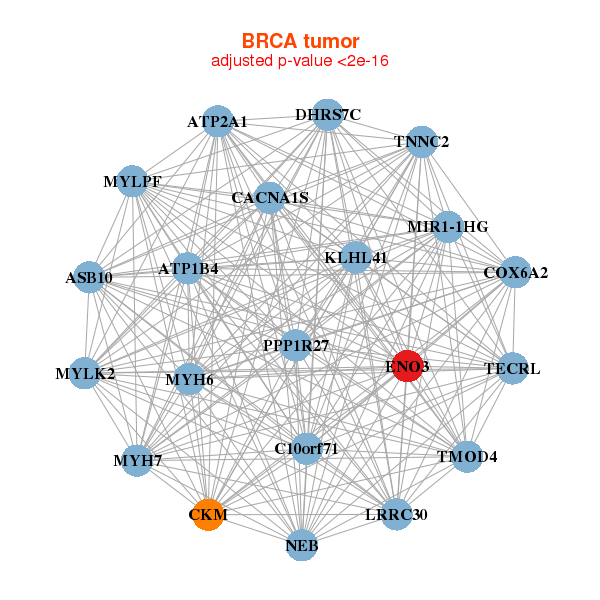
| * Co-Expression network figures were drawn using R package igraph. Only the top 20 genes with the highest correlations were shown. Red circle: input gene, orange circle: cell metabolism gene, sky circle: other gene |
: Open all plots for all cancer types
 |
|
| ASB10,ATP1B4,ATP2A1,C10orf71,MIR1-1HG,CACNA1S,CKM, COX6A2,DHRS7C,PPP1R27,ENO3,KLHL41,LRRC30,MYH6, MYH7,MYLK2,MYLPF,NEB,TECRL,TMOD4,TNNC2 | ATP2A1,MIR1-1HG,CKM,COX6A2,CSRP3,PPP1R27,ENO3, HFE2,LMOD2,LOC151300,MYH2,MYH6,MYH7,MYL1, MYL2,MYLPF,NRAP,OR5H15,P2RX6P,PPP1R3A,TCAP, T |
 |
|
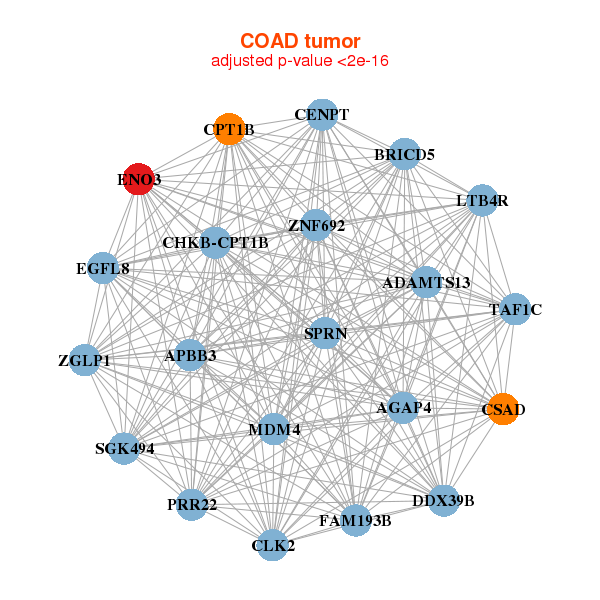
| ADAMTS13,AGAP4,APBB3,DDX39B,BRICD5,CENPT,CHKB-CPT1B, CLK2,CPT1B,CSAD,EGFL8,ENO3,FAM193B,LTB4R, MDM4,PRR22,SGK494,SPRN,TAF1C,ZGLP1,ZNF692 | AGAP11,AQP3,TMEM74B,CCDC108,DNASE1,DSG3,ENO3, GGN,MLXIPL,MST1,MUC17,NEB,PIK3C2G,PLB1, PRODH,RHOBTB2,SEC14L2,SLC5A2,TH,WNT9B,ZNF488 |
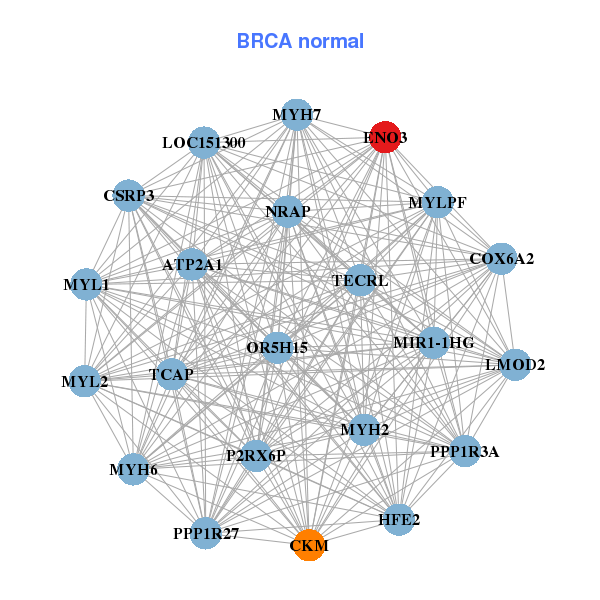
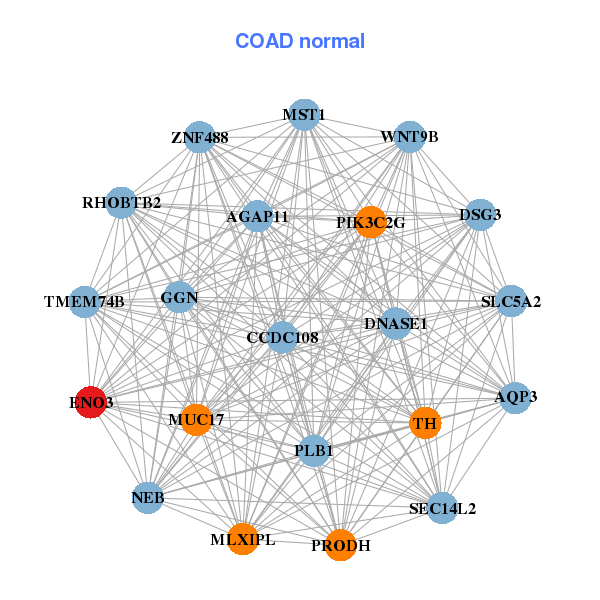
| * Co-Expression network figures were drawn using R package igraph. Only the top 20 genes with the highest correlations were shown. Red circle: input gene, orange circle: cell metabolism gene, sky circle: other gene |
: Open all plots for all cancer types
| Top |
: Open all interacting genes' information including KEGG pathway for all interacting genes from DAVID
| Top |
| Pharmacological Information for ENO3 |
| There's no related Drug. |
| Top |
| Cross referenced IDs for ENO3 |
| * We obtained these cross-references from Uniprot database. It covers 150 different DBs, 18 categories. http://www.uniprot.org/help/cross_references_section |
: Open all cross reference information
|
Copyright © 2016-Present - The Univsersity of Texas Health Science Center at Houston @ |