|
||||||||||||||||||||||||||||||||||||||||||||||||||||||||||||||||||||||||||||||||||||||||||||||||||||||||||||||||||||||||||||||||||||||||||||||||||||||||||||||||||||||||||||||||||||||||||||||||||||||||||||||||||||||||||||||||||||||||||||||||||||||||||||||||||||||||||||||||||||||||||||||||||||||||||||||||||||||||||||||||||||||||||||||||||||||||||||||||||||||||||||||||||||||||||||||||||||||||||||||||||
| |
| Phenotypic Information (metabolism pathway, cancer, disease, phenome) |
| |
| |
| Gene-Gene Network Information: Co-Expression Network, Interacting Genes & KEGG |
| |
|


| Gene Summary for EP300 |
| Basic gene info. | Gene symbol | EP300 |
| Gene name | E1A binding protein p300 | |
| Synonyms | KAT3B|RSTS2|p300 | |
| Cytomap | UCSC genome browser: 22q13.2 | |
| Genomic location | chr22 :41488613-41576081 | |
| Type of gene | protein-coding | |
| RefGenes | NM_001429.3, | |
| Ensembl id | ENSG00000100393 | |
| Description | E1A-associated protein p300E1A-binding protein, 300kDhistone acetyltransferase p300p300 HAT | |
| Modification date | 20141222 | |
| dbXrefs | MIM : 602700 | |
| HGNC : HGNC | ||
| Ensembl : ENSG00000100393 | ||
| HPRD : 04078 | ||
| Vega : OTTHUMG00000150937 | ||
| Protein | UniProt: Q09472 go to UniProt's Cross Reference DB Table | |
| Expression | CleanEX: HS_EP300 | |
| BioGPS: 2033 | ||
| Gene Expression Atlas: ENSG00000100393 | ||
| The Human Protein Atlas: ENSG00000100393 | ||
| Pathway | NCI Pathway Interaction Database: EP300 | |
| KEGG: EP300 | ||
| REACTOME: EP300 | ||
| ConsensusPathDB | ||
| Pathway Commons: EP300 | ||
| Metabolism | MetaCyc: EP300 | |
| HUMANCyc: EP300 | ||
| Regulation | Ensembl's Regulation: ENSG00000100393 | |
| miRBase: chr22 :41,488,613-41,576,081 | ||
| TargetScan: NM_001429 | ||
| cisRED: ENSG00000100393 | ||
| Context | iHOP: EP300 | |
| cancer metabolism search in PubMed: EP300 | ||
| UCL Cancer Institute: EP300 | ||
| Assigned class in ccmGDB | A - This gene has a literature evidence and it belongs to cancer gene. | |
| References showing role of EP300 in cancer cell metabolism | 1. Jeong E, Koo JE, Yeon SH, Kwak MK, Hwang DH, et al. (2014) PPARdelta deficiency disrupts hypoxia-mediated tumorigenic potential of colon cancer cells. Mol Carcinog 53: 926-937. doi: 10.1002/mc.22144. go to article 2. Yi P, Wang Z, Feng Q, Pintilie GD, Foulds CE, et al. (2015) Structure of a biologically active estrogen receptor-coactivator complex on DNA. Mol Cell 57: 1047-1058. doi: 10.1016/j.molcel.2015.01.025. pmid: 4369429. go to article 3. Sabari BR, Tang Z, Huang H, Yong-Gonzalez V, Molina H, et al. (2015) Intracellular crotonyl-CoA stimulates transcription through p300-catalyzed histone crotonylation. Mol Cell 58: 203-215. doi: 10.1016/j.molcel.2015.02.029. go to article | |
| Top |
| Phenotypic Information for EP300(metabolism pathway, cancer, disease, phenome) |
| Cancer | CGAP: EP300 |
| Familial Cancer Database: EP300 | |
| * This gene is included in those cancer gene databases. |
|
|
|
|
|
| . | ||||||||||||||||||||||||||||||||||||||||||||||||||||||||||||||||||||||||||||||||||||||||||||||||||||||||||||||||||||||||||||||||||||||||||||||||||||||||||||||||||||||||||||||||||||||||||||||||||||||||||||||||||||||||||||||||||||||||||||||||||||||||||||||||||||||||||||||||||||||||||||||||||||||||||||||||||||||||||||||||||||||||||||||||||||||||||||||||||||||||||||||||||||||||||||||||||||||||||||
Oncogene 1 | ||||||||||||||||||||||||||||||||||||||||||||||||||||||||||||||||||||||||||||||||||||||||||||||||||||||||||||||||||||||||||||||||||||||||||||||||||||||||||||||||||||||||||||||||||||||||||||||||||||||||||||||||||||||||||||||||||||||||||||||||||||||||||||||||||||||||||||||||||||||||||||||||||||||||||||||||||||||||||||||||||||||||||||||||||||||||||||||||||||||||||||||||||||||||||||||||||||||||||||||||||
| cf) number; DB name 1 Oncogene; http://nar.oxfordjournals.org/content/35/suppl_1/D721.long, 2 Tumor Suppressor gene; https://bioinfo.uth.edu/TSGene/, 3 Cancer Gene Census; http://www.nature.com/nrc/journal/v4/n3/abs/nrc1299.html, 4 CancerGenes; http://nar.oxfordjournals.org/content/35/suppl_1/D721.long, 5 Network of Cancer Gene; http://ncg.kcl.ac.uk/index.php, 6 http://www.nature.com/nature/journal/vaop/ncurrent/full/nature12965.html, 7 https://www.sciencemag.org/content/333/6046/1157, 8 http://www.nature.com/nature/journal/v497/n7447/full/nature12113.html, 9Therapeutic Vulnerabilities in Cancer; http://cbio.mskcc.org/cancergenomics/statius/ |
| REACTOME_METABOLISM_OF_LIPIDS_AND_LIPOPROTEINS | |
| OMIM | 602700; gene. 613684; phenotype. |
| Orphanet | 353284; Rubinstein-Taybi syndrome due to EP300 haploinsufficiency. |
| Disease | KEGG Disease: EP300 |
| MedGen: EP300 (Human Medical Genetics with Condition) | |
| ClinVar: EP300 | |
| Phenotype | MGI: EP300 (International Mouse Phenotyping Consortium) |
| PhenomicDB: EP300 | |
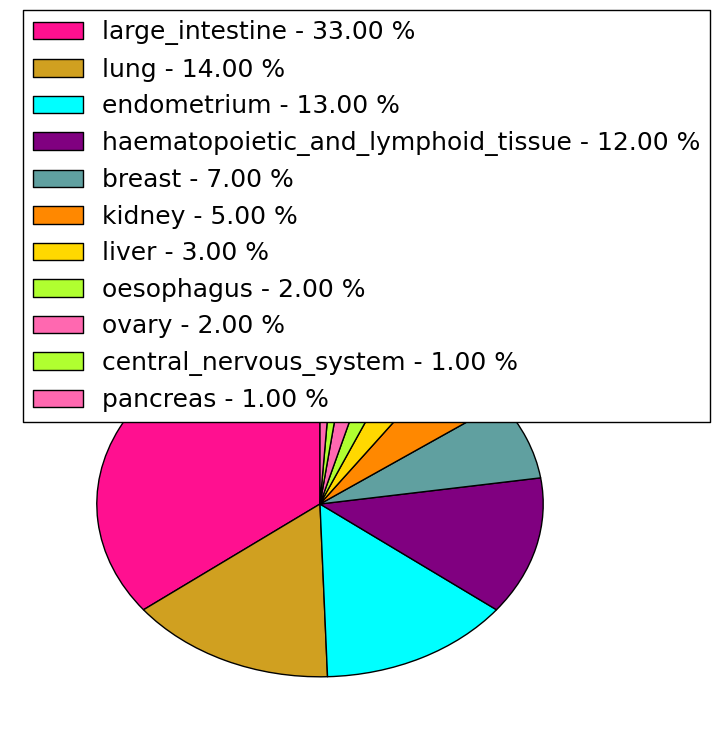
| Mutations for EP300 |
| * Under tables are showing count per each tissue to give us broad intuition about tissue specific mutation patterns.You can go to the detailed page for each mutation database's web site. |
| - Statistics for Tissue and Mutation type | Top |
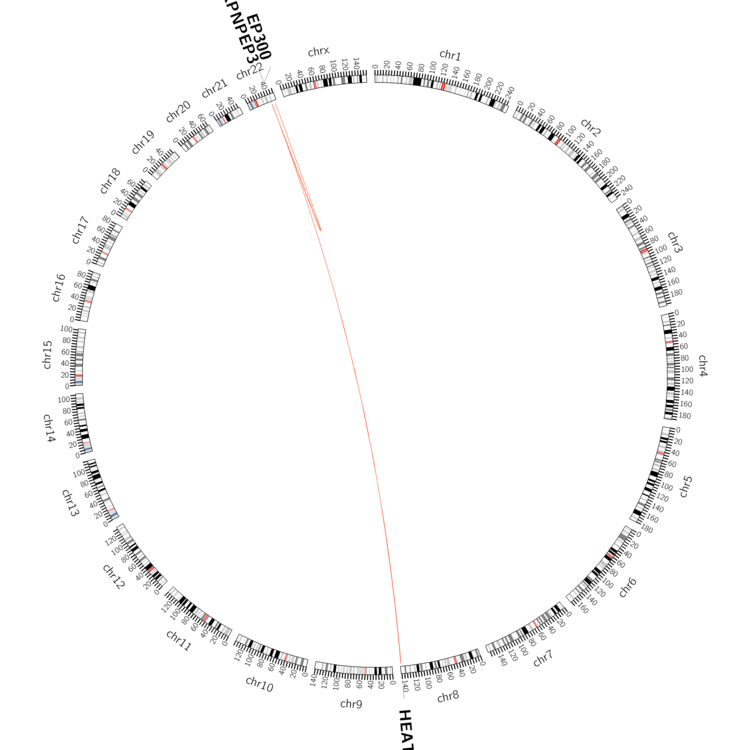 |
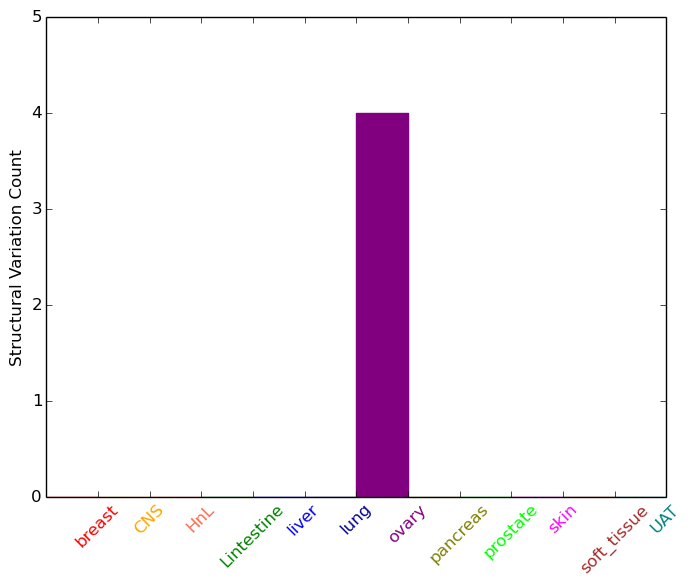
| - For Inter-chromosomal Variations |
| * Inter-chromosomal variantions includes 'interchromosomal amplicon to amplicon', 'interchromosomal amplicon to non-amplified dna', 'interchromosomal insertion', 'Interchromosomal unknown type'. |
 |
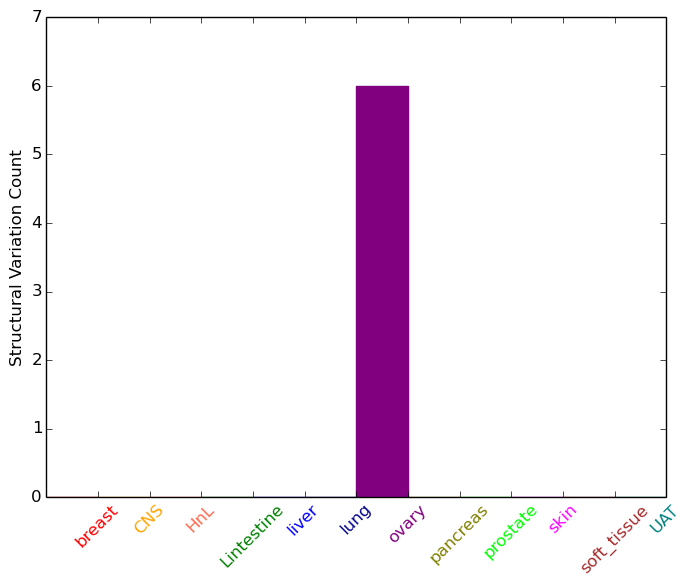
| - For Intra-chromosomal Variations |
| * Intra-chromosomal variantions includes 'intrachromosomal amplicon to amplicon', 'intrachromosomal amplicon to non-amplified dna', 'intrachromosomal deletion', 'intrachromosomal fold-back inversion', 'intrachromosomal inversion', 'intrachromosomal tandem duplication', 'Intrachromosomal unknown type', 'intrachromosomal with inverted orientation', 'intrachromosomal with non-inverted orientation'. |
 |
| Sample | Symbol_a | Chr_a | Start_a | End_a | Symbol_b | Chr_b | Start_b | End_b |
| ovary | EP300 | chr22 | 41513022 | 41513042 | chr22 | 47816718 | 47816738 | |
| ovary | EP300 | chr22 | 41513329 | 41513349 | chr8 | 144859393 | 144859413 | |
| ovary | EP300 | chr22 | 41548603 | 41548623 | EP300 | chr22 | 41551591 | 41551611 |
| ovary | EP300 | chr22 | 41551203 | 41551223 | chr22 | 41583055 | 41583075 | |
| ovary | EP300 | chr22 | 41567335 | 41567355 | XPNPEP3 | chr22 | 41303626 | 41303646 |
| ovary | EP300 | chr22 | 41568672 | 41568692 | EP300 | chr22 | 41567248 | 41567268 |
| cf) Tissue number; Tissue name (1;Breast, 2;Central_nervous_system, 3;Haematopoietic_and_lymphoid_tissue, 4;Large_intestine, 5;Liver, 6;Lung, 7;Ovary, 8;Pancreas, 9;Prostate, 10;Skin, 11;Soft_tissue, 12;Upper_aerodigestive_tract) |
| * From mRNA Sanger sequences, Chitars2.0 arranged chimeric transcripts. This table shows EP300 related fusion information. |
| ID | Head Gene | Tail Gene | Accession | Gene_a | qStart_a | qEnd_a | Chromosome_a | tStart_a | tEnd_a | Gene_a | qStart_a | qEnd_a | Chromosome_a | tStart_a | tEnd_a |
| AW366672 | EP300 | 1 | 156 | 22 | 41573842 | 41573997 | DAZAP2 | 152 | 229 | 12 | 51634135 | 51634212 | |
| AY187920 | MLL | 1 | 321 | 11 | 118353136 | 118355690 | EP300 | 320 | 361 | 22 | 41547835 | 41547876 | |
| BE071569 | LYRM1 | 22 | 99 | 16 | 20927209 | 20927287 | EP300 | 88 | 226 | 22 | 41574542 | 41574680 | |
| DA384171 | EP300 | 1 | 420 | 22 | 41521856 | 41523721 | SPPL3 | 416 | 553 | 12 | 121211275 | 121211412 | |
| BE704331 | LOC100505806 | 6 | 111 | 5 | 9550055 | 9550160 | EP300 | 107 | 413 | 22 | 41544492 | 41544797 | |
| AL044228 | TSPAN16 | 32 | 273 | 19 | 11435020 | 11435261 | EP300 | 273 | 339 | 22 | 41573606 | 41573672 | |
| AW580958 | EP300 | 1 | 54 | 22 | 41574952 | 41575005 | EP300 | 54 | 273 | 22 | 41574978 | 41575197 | |
| BF915954 | SPHK1 | 1 | 141 | 17 | 74383792 | 74383932 | EP300 | 139 | 289 | 22 | 41574556 | 41574706 | |
| BF766544 | RNF220 | 161 | 180 | 1 | 45109570 | 45109589 | EP300 | 169 | 321 | 22 | 41545970 | 41546122 | |
| Top |
| Mutation type/ Tissue ID | brca | cns | cerv | endome | haematopo | kidn | Lintest | liver | lung | ns | ovary | pancre | prost | skin | stoma | thyro | urina | |||
| Total # sample | 1 | 1 | 1 | 2 | 1 | |||||||||||||||
| GAIN (# sample) | 1 | 1 | 1 | |||||||||||||||||
| LOSS (# sample) | 1 | 2 |
| cf) Tissue ID; Tissue type (1; Breast, 2; Central_nervous_system, 3; Cervix, 4; Endometrium, 5; Haematopoietic_and_lymphoid_tissue, 6; Kidney, 7; Large_intestine, 8; Liver, 9; Lung, 10; NS, 11; Ovary, 12; Pancreas, 13; Prostate, 14; Skin, 15; Stomach, 16; Thyroid, 17; Urinary_tract) |
| Top |
|
 |
| Top |
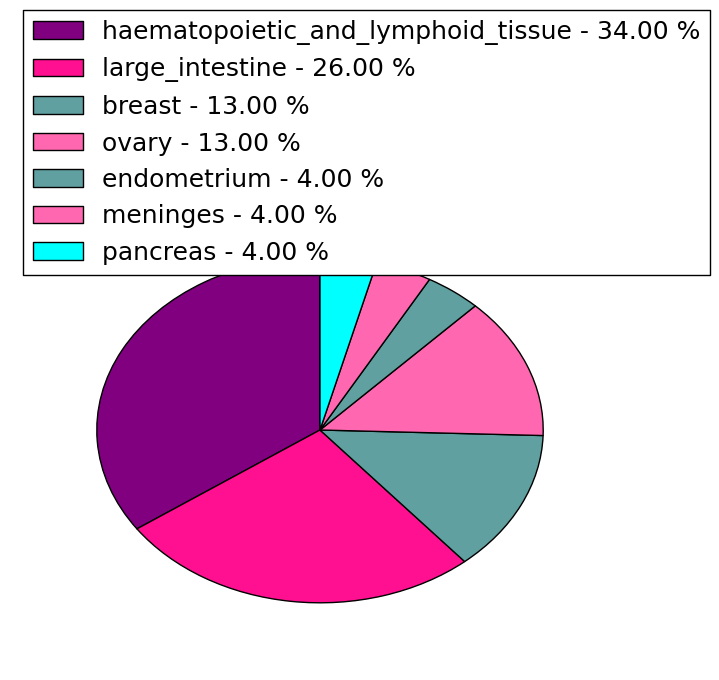
| Stat. for Non-Synonymous SNVs (# total SNVs=238) | (# total SNVs=50) |
 | 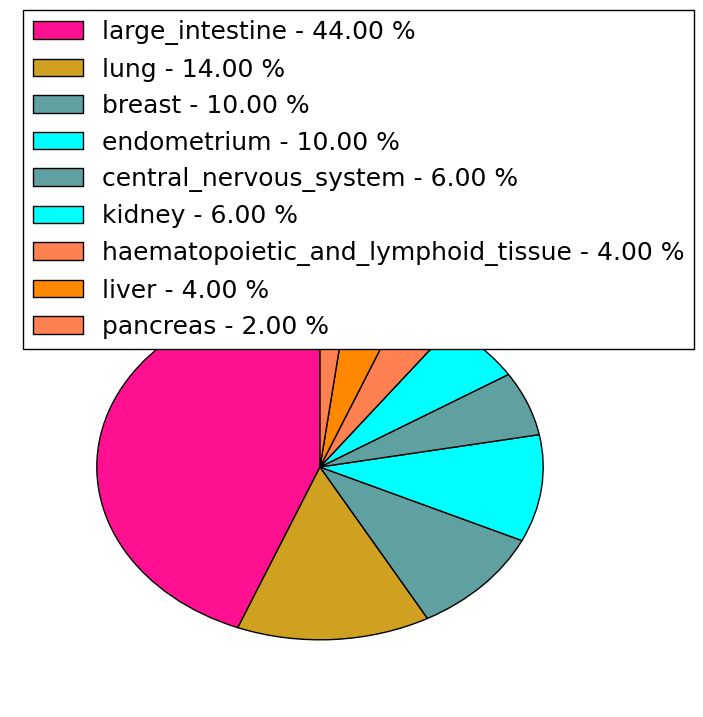 |
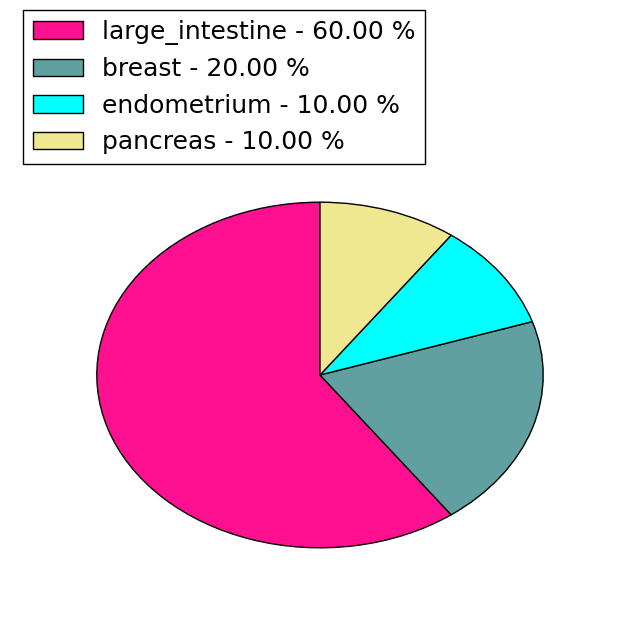
(# total SNVs=23) | (# total SNVs=10) |
 |  |
| Top |
| * When you move the cursor on each content, you can see more deailed mutation information on the Tooltip. Those are primary_site,primary_histology,mutation(aa),pubmedID. |
| GRCh37 position | Mutation(aa) | Unique sampleID count |
| chr22:41565529-41565529 | p.D1399Y | 12 |
| chr22:41572350-41572350 | p.R1627W | 8 |
| chr22:41566475-41566475 | p.H1451L | 5 |
| chr22:41564853-41564853 | p.C1385Y | 5 |
| chr22:41566531-41566531 | p.M1470fs*26 | 5 |
| chr22:41572357-41572357 | p.A1629V | 4 |
| chr22:41569719-41569719 | p.K1570N | 4 |
| chr22:41533773-41533773 | p.R580Q | 4 |
| chr22:41572810-41572810 | p.N1700fs*9 | 4 |
| chr22:41572266-41572266 | p.R1599C | 3 |
| Top |
|
 |
| Point Mutation/ Tissue ID | 1 | 2 | 3 | 4 | 5 | 6 | 7 | 8 | 9 | 10 | 11 | 12 | 13 | 14 | 15 | 16 | 17 | 18 | 19 | 20 |
| # sample | 15 | 5 | 1 | 58 | 5 | 19 | 8 | 3 | 4 | 9 | 1 | 16 | 17 | 17 | ||||||
| # mutation | 18 | 5 | 1 | 49 | 5 | 17 | 8 | 3 | 4 | 10 | 1 | 16 | 20 | 27 | ||||||
| nonsynonymous SNV | 16 | 4 | 1 | 35 | 3 | 16 | 6 | 2 | 1 | 8 | 1 | 12 | 16 | 22 | ||||||
| synonymous SNV | 2 | 1 | 14 | 2 | 1 | 2 | 1 | 3 | 2 | 4 | 4 | 5 |
| cf) Tissue ID; Tissue type (1; BLCA[Bladder Urothelial Carcinoma], 2; BRCA[Breast invasive carcinoma], 3; CESC[Cervical squamous cell carcinoma and endocervical adenocarcinoma], 4; COAD[Colon adenocarcinoma], 5; GBM[Glioblastoma multiforme], 6; Glioma Low Grade, 7; HNSC[Head and Neck squamous cell carcinoma], 8; KICH[Kidney Chromophobe], 9; KIRC[Kidney renal clear cell carcinoma], 10; KIRP[Kidney renal papillary cell carcinoma], 11; LAML[Acute Myeloid Leukemia], 12; LUAD[Lung adenocarcinoma], 13; LUSC[Lung squamous cell carcinoma], 14; OV[Ovarian serous cystadenocarcinoma ], 15; PAAD[Pancreatic adenocarcinoma], 16; PRAD[Prostate adenocarcinoma], 17; SKCM[Skin Cutaneous Melanoma], 18:STAD[Stomach adenocarcinoma], 19:THCA[Thyroid carcinoma], 20:UCEC[Uterine Corpus Endometrial Carcinoma]) |
| Top |
| * We represented just top 10 SNVs. When you move the cursor on each content, you can see more deailed mutation information on the Tooltip. Those are primary_site, primary_histology, mutation(aa), pubmedID. |
| Genomic Position | Mutation(aa) | Unique sampleID count |
| chr22:41565529 | p.D1399Y | 7 |
| chr22:41572350 | p.R1627W | 4 |
| chr22:41569717 | p.R580Q | 3 |
| chr22:41533773 | p.K1570E | 3 |
| chr22:41569719 | p.K1570K | 3 |
| chr22:41572266 | p.R1599S | 3 |
| chr22:41572357 | p.C1164Y | 3 |
| chr22:41548251 | p.A1629V | 3 |
| chr22:41548253 | p.E1013E | 3 |
| chr22:41553402 | p.E1014G | 3 |
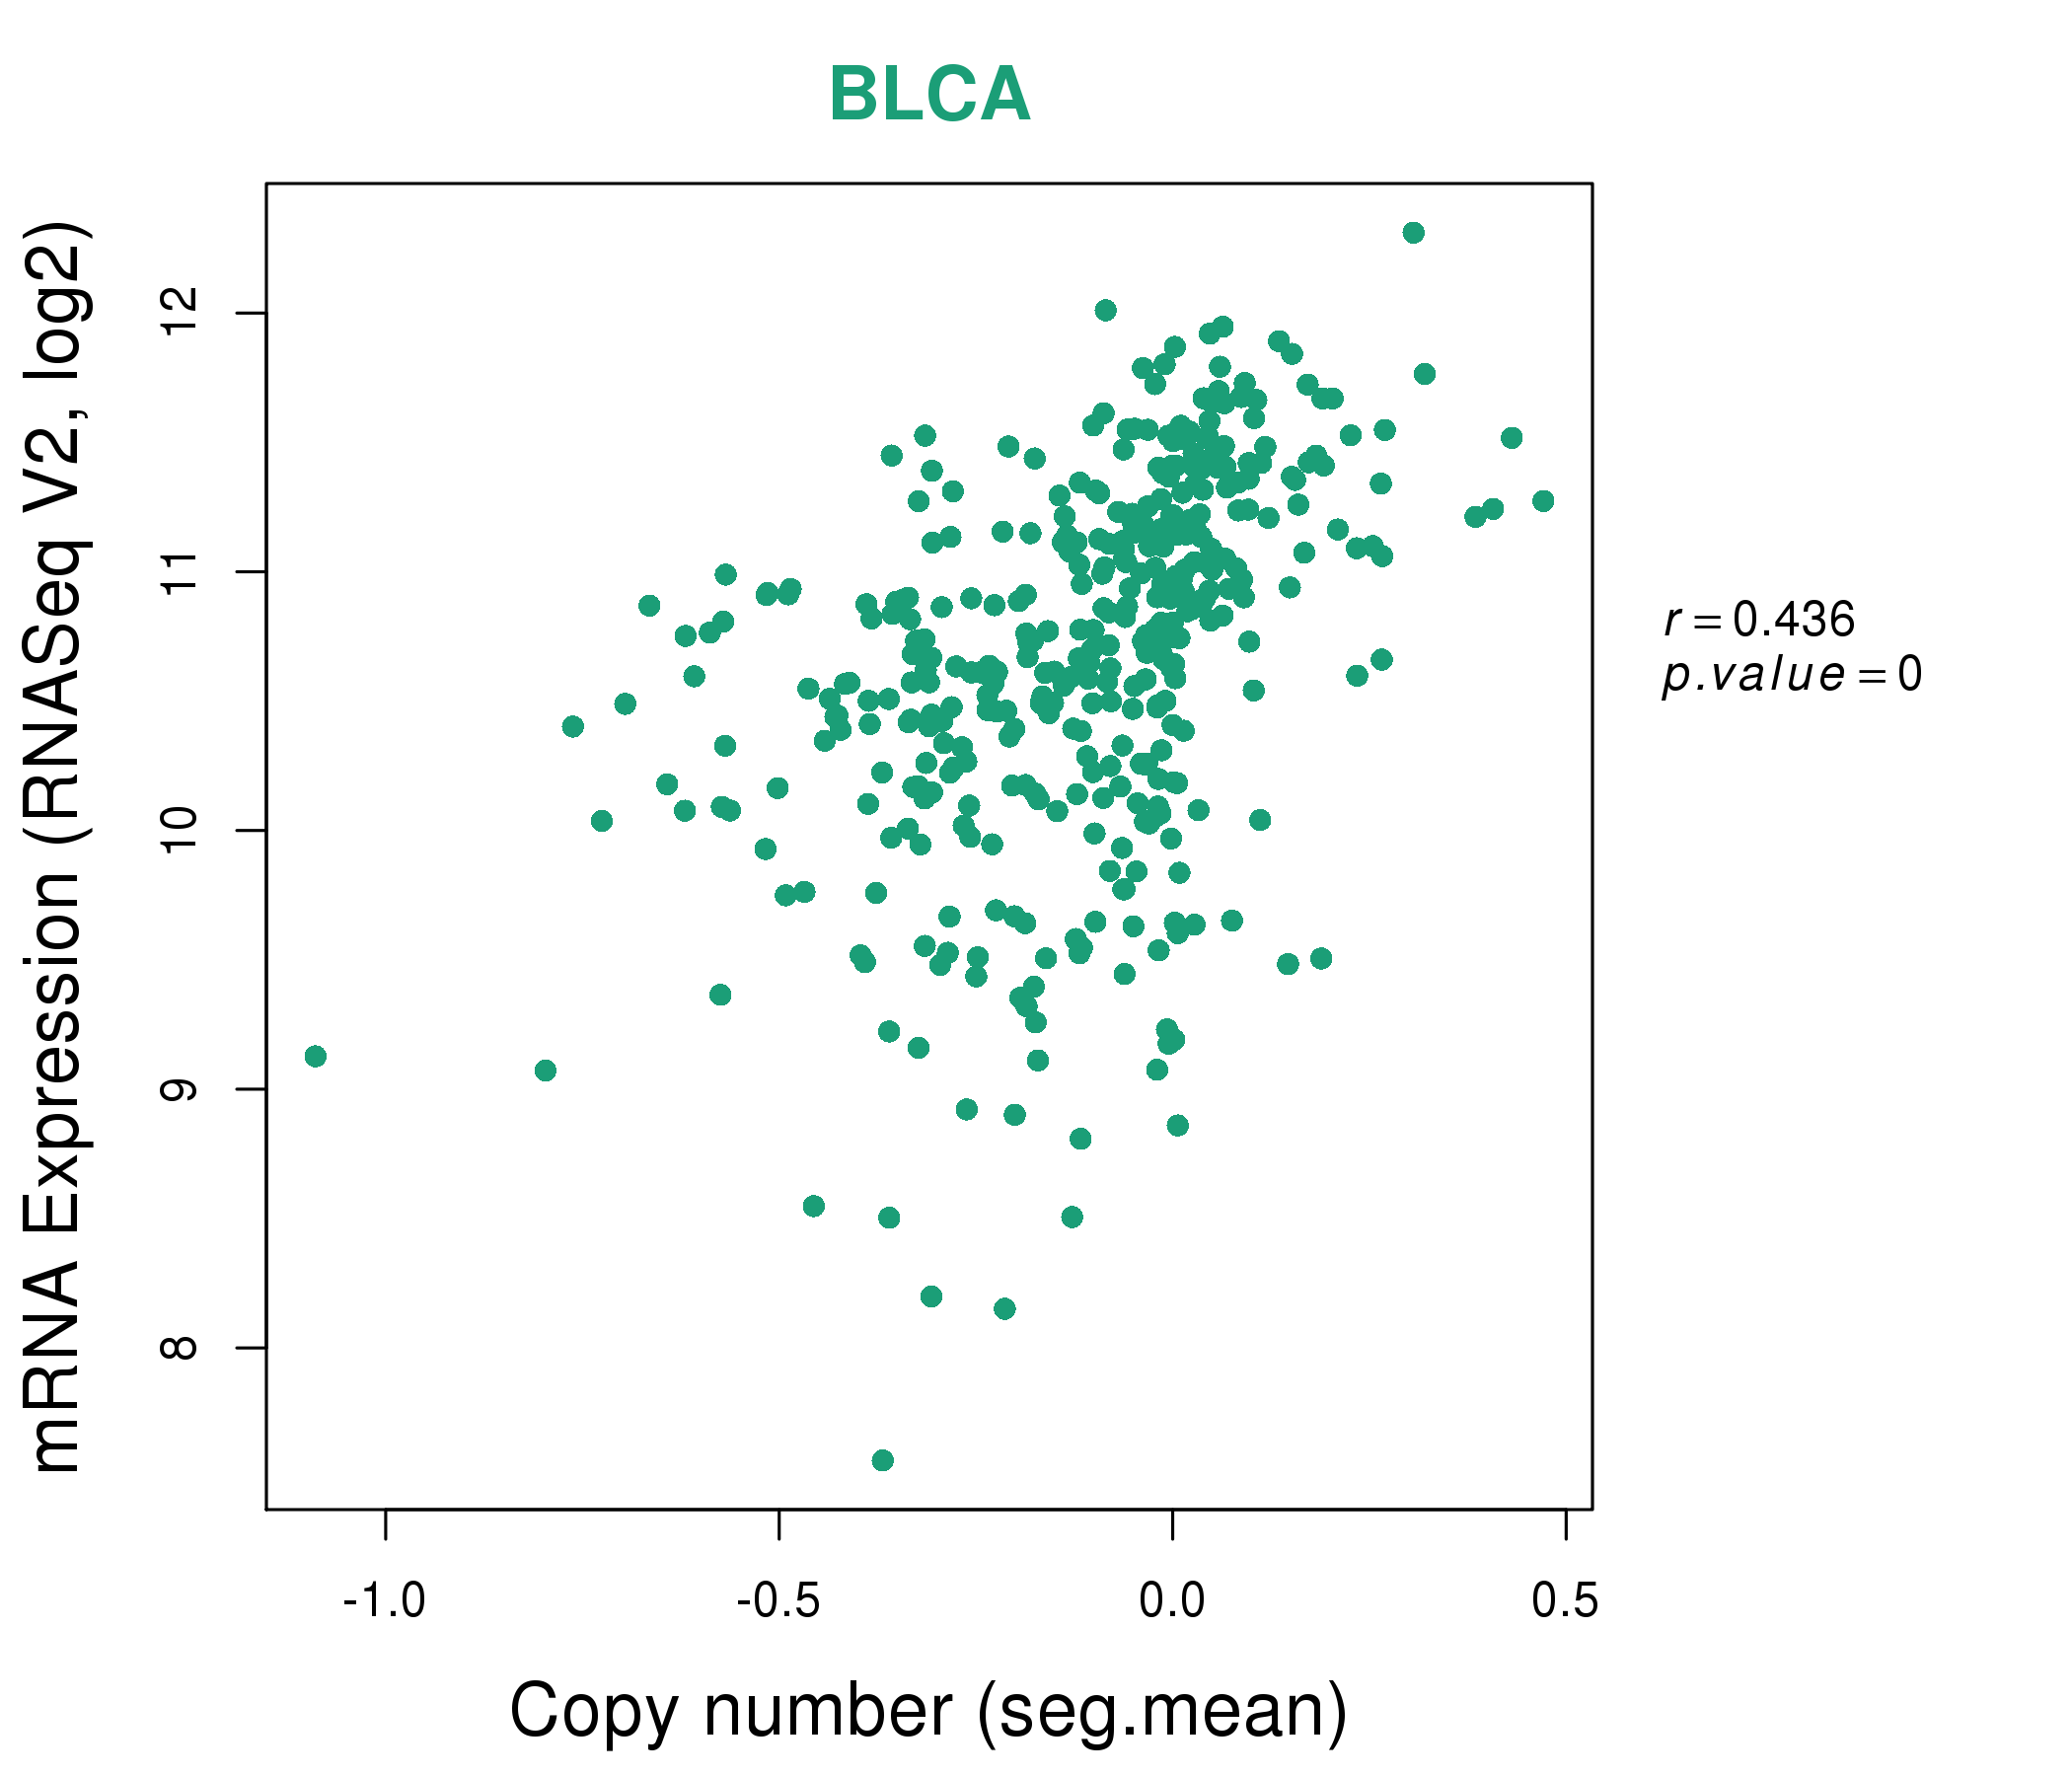
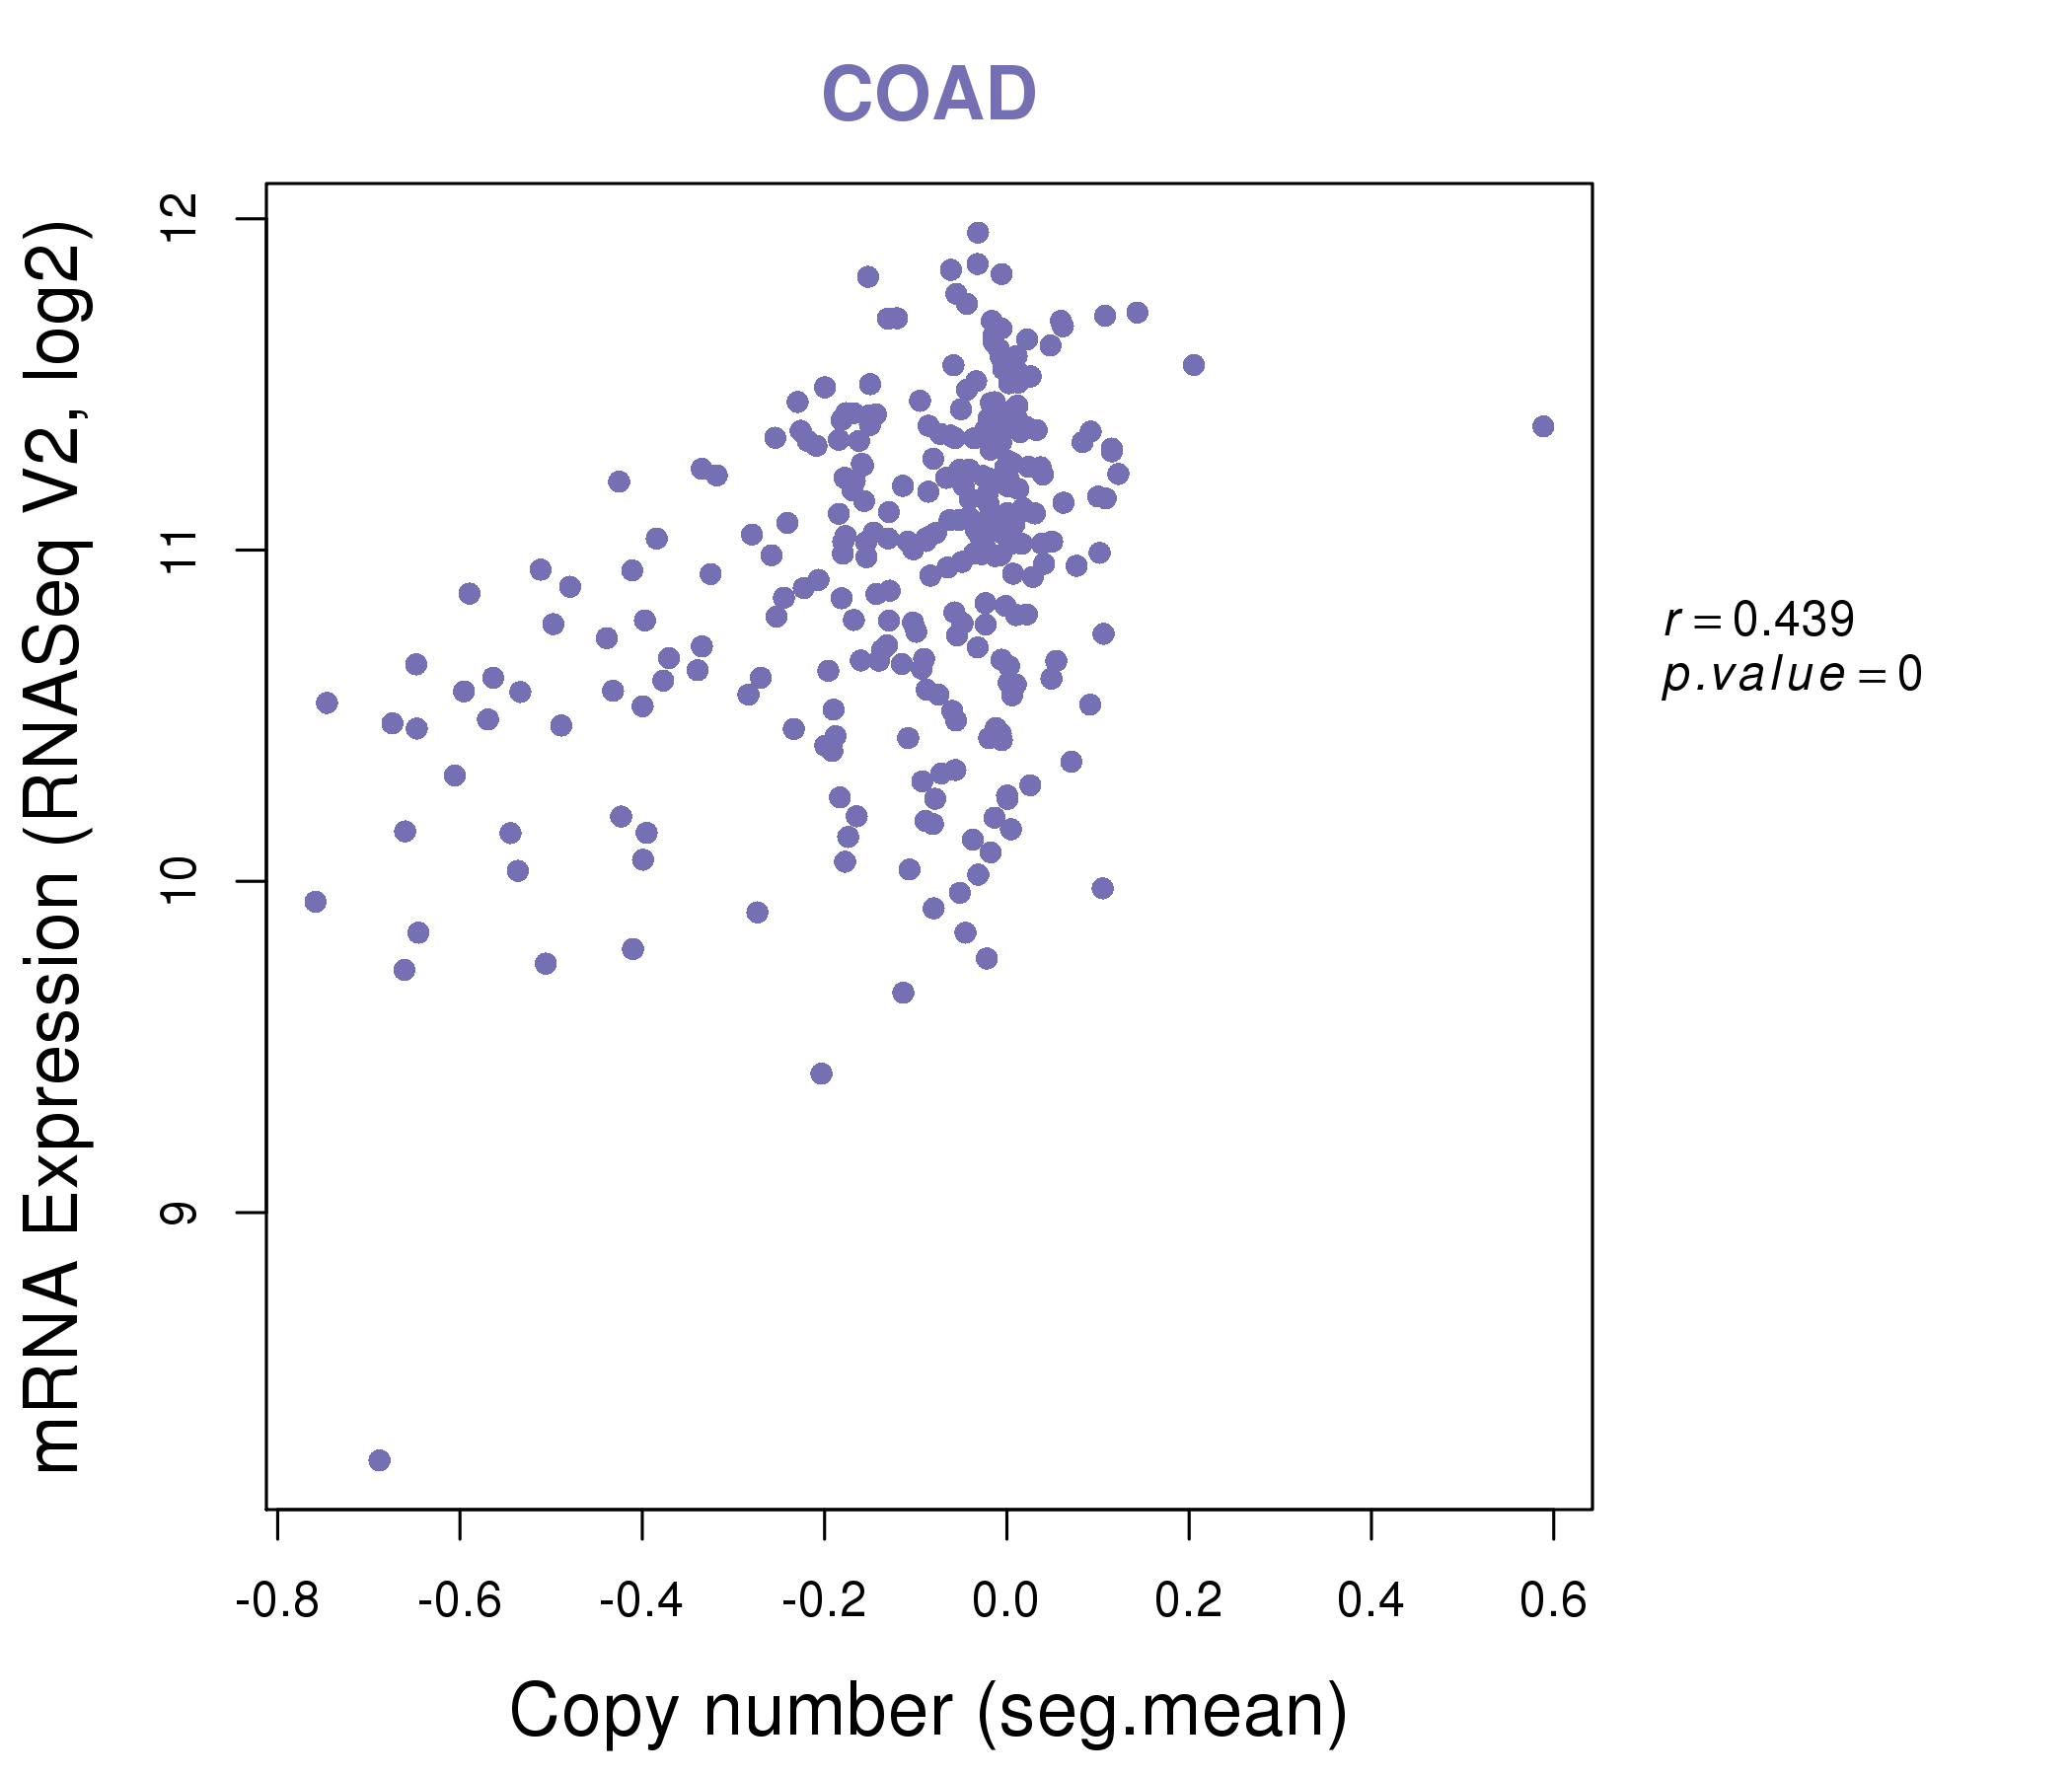
| * Copy number data were extracted from TCGA using R package TCGA-Assembler. The URLs of all public data files on TCGA DCC data server were gathered on Jan-05-2015. Function ProcessCNAData in TCGA-Assembler package was used to obtain gene-level copy number value which is calculated as the average copy number of the genomic region of a gene. |
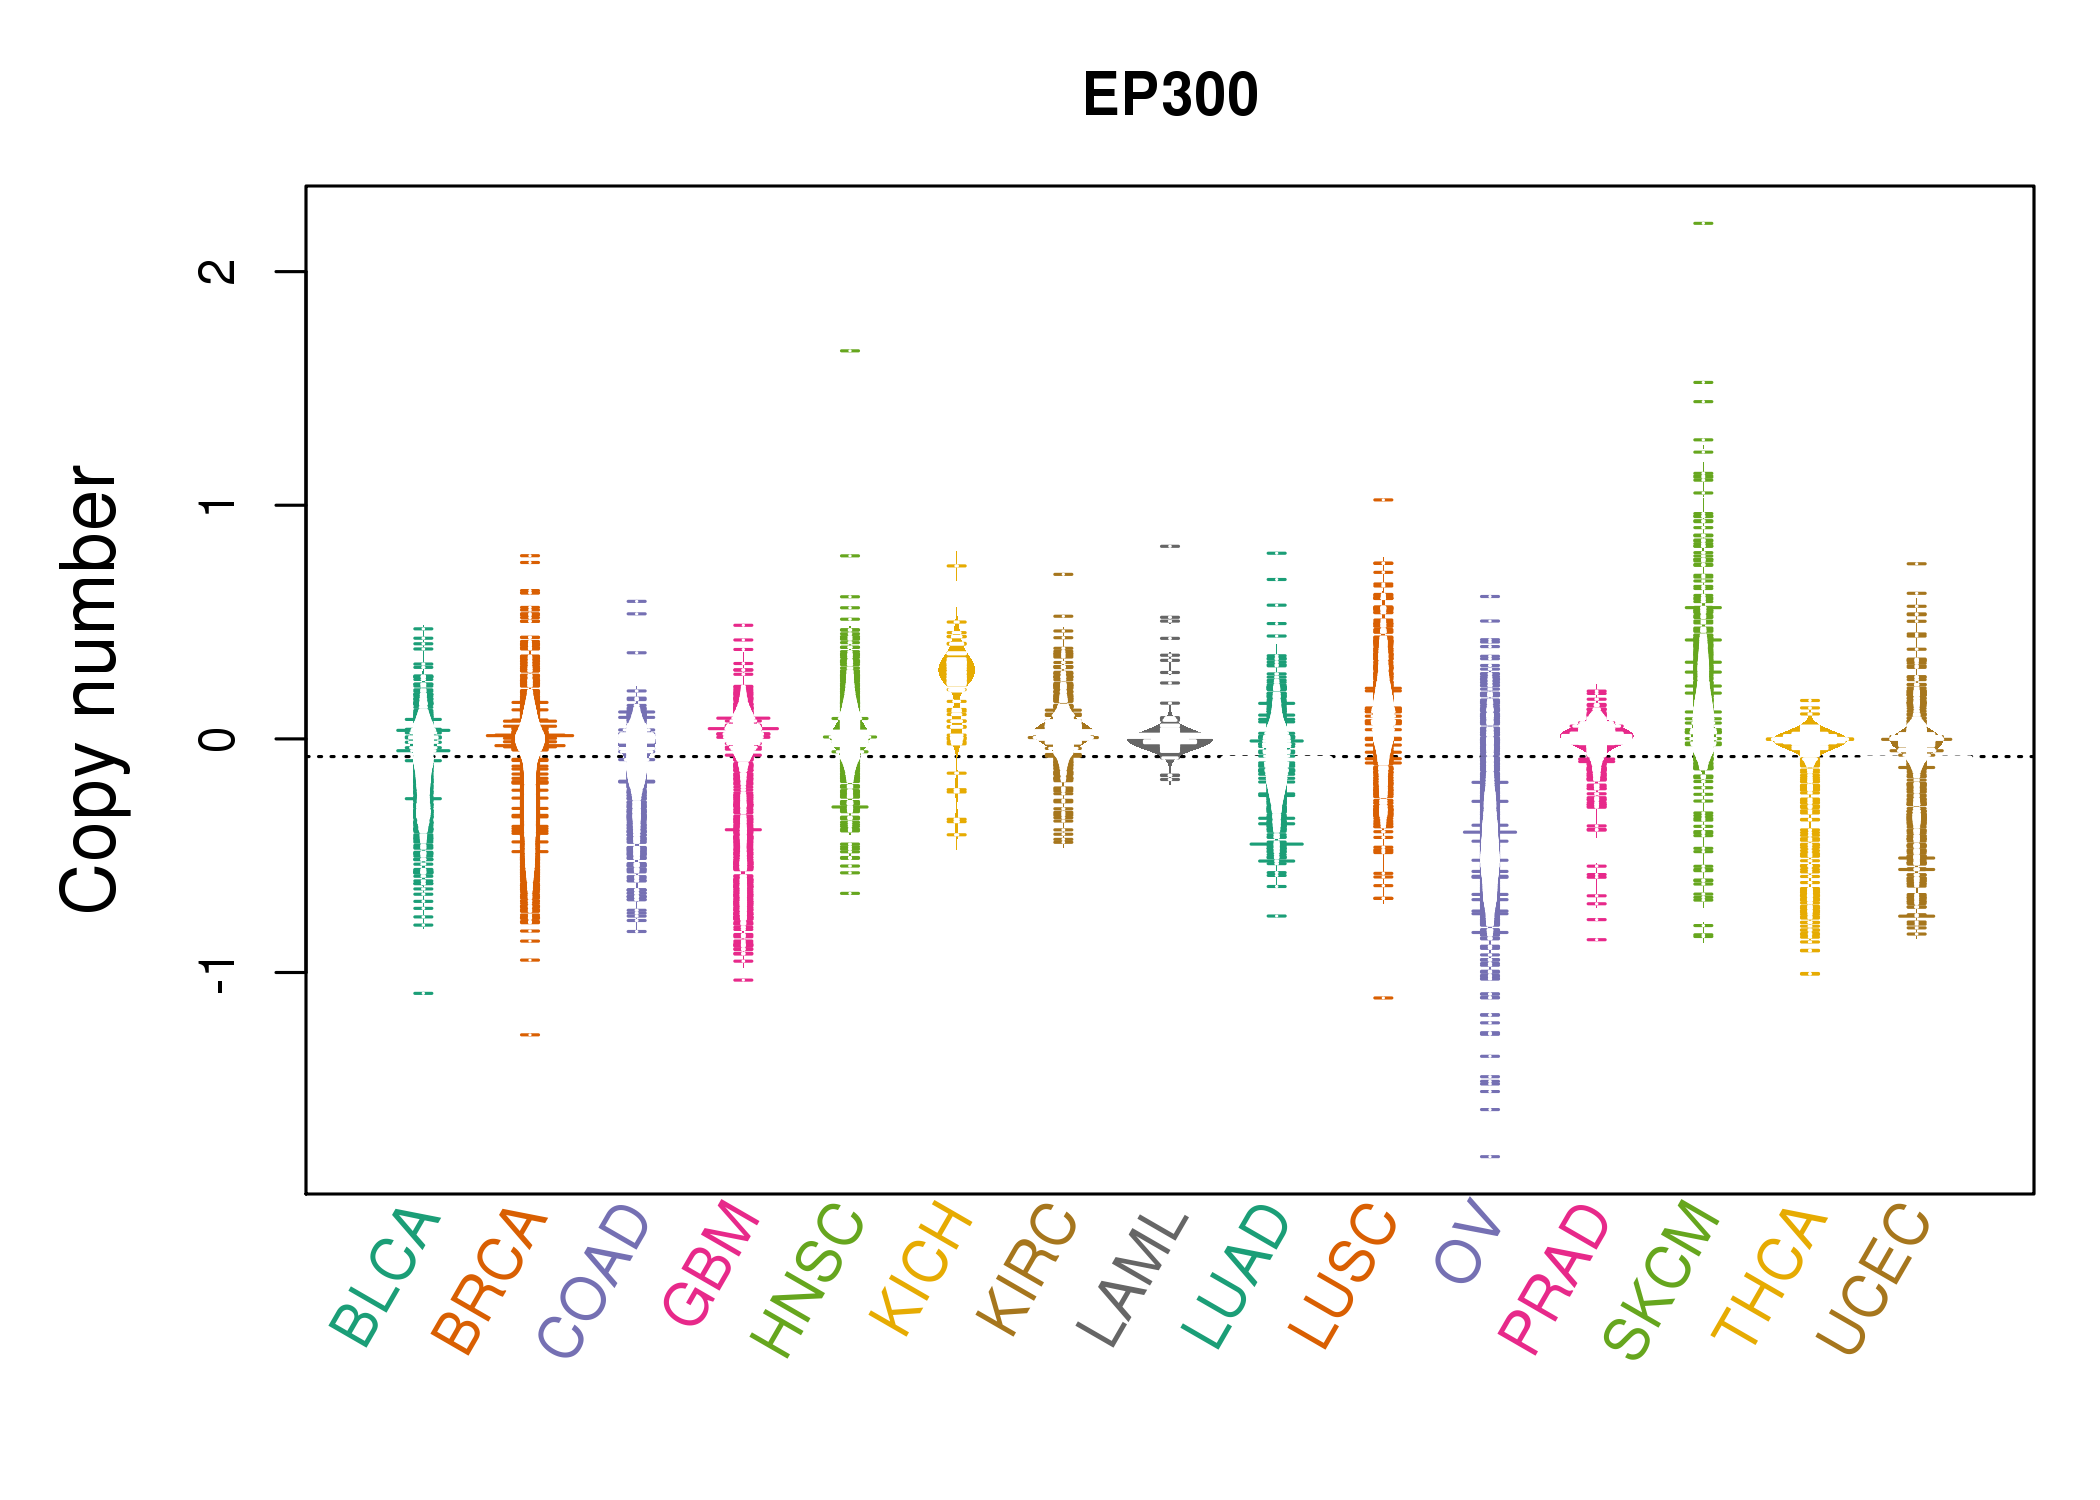 |
| cf) Tissue ID[Tissue type]: BLCA[Bladder Urothelial Carcinoma], BRCA[Breast invasive carcinoma], CESC[Cervical squamous cell carcinoma and endocervical adenocarcinoma], COAD[Colon adenocarcinoma], GBM[Glioblastoma multiforme], Glioma Low Grade, HNSC[Head and Neck squamous cell carcinoma], KICH[Kidney Chromophobe], KIRC[Kidney renal clear cell carcinoma], KIRP[Kidney renal papillary cell carcinoma], LAML[Acute Myeloid Leukemia], LUAD[Lung adenocarcinoma], LUSC[Lung squamous cell carcinoma], OV[Ovarian serous cystadenocarcinoma ], PAAD[Pancreatic adenocarcinoma], PRAD[Prostate adenocarcinoma], SKCM[Skin Cutaneous Melanoma], STAD[Stomach adenocarcinoma], THCA[Thyroid carcinoma], UCEC[Uterine Corpus Endometrial Carcinoma] |
| Top |
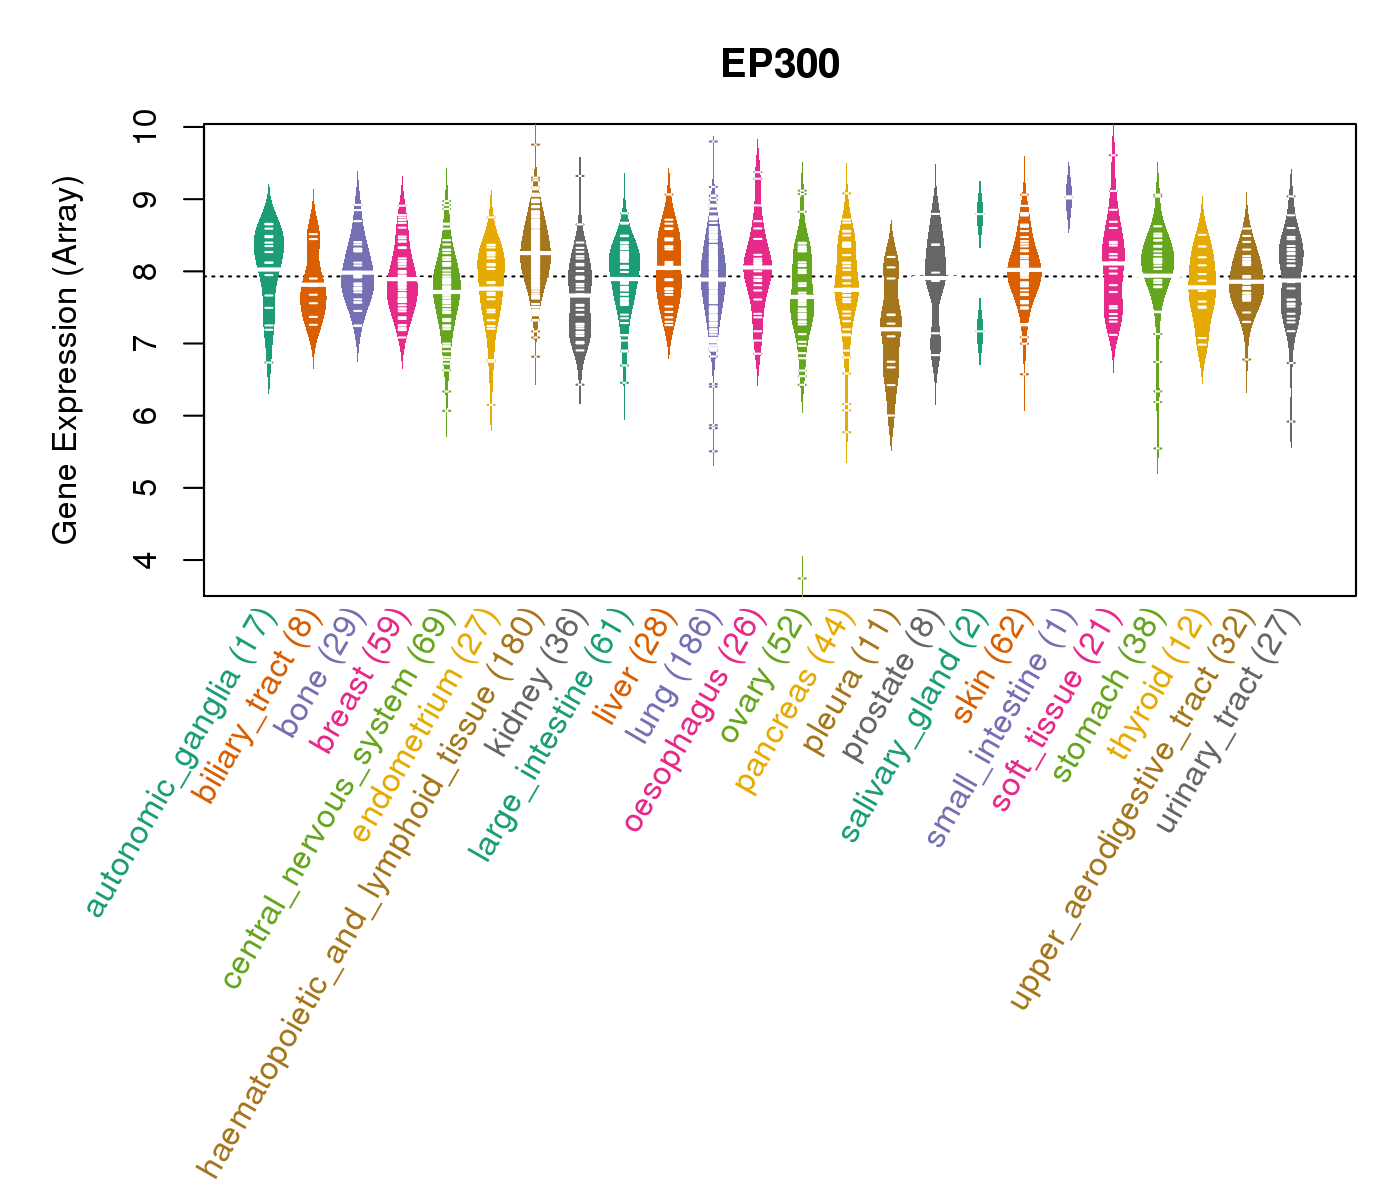
| Gene Expression for EP300 |
| * CCLE gene expression data were extracted from CCLE_Expression_Entrez_2012-10-18.res: Gene-centric RMA-normalized mRNA expression data. |
 |
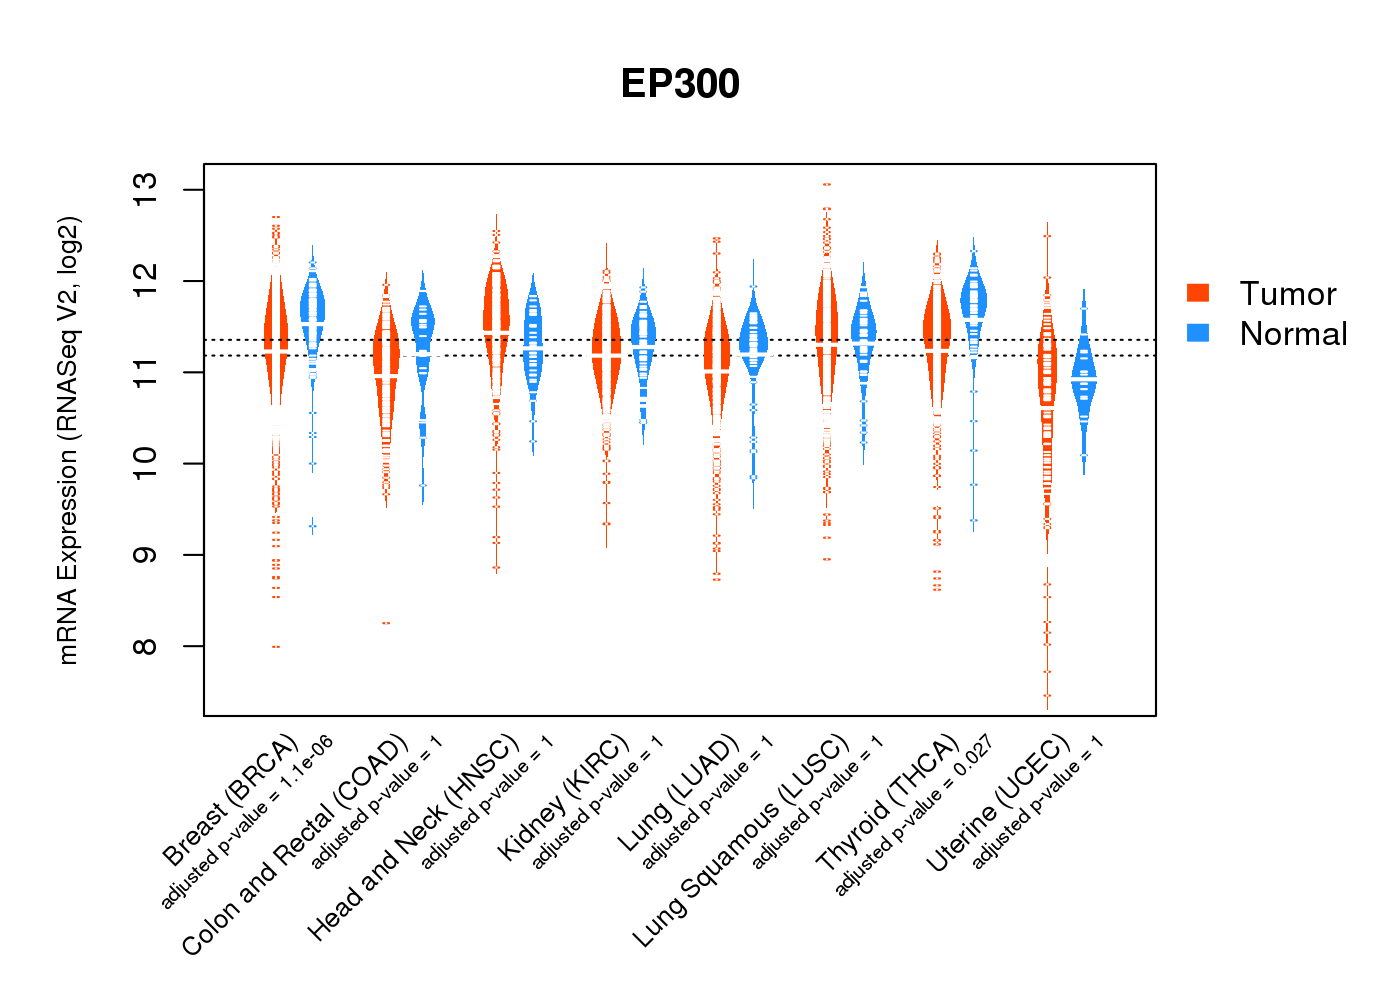
| * Normalized gene expression data of RNASeqV2 was extracted from TCGA using R package TCGA-Assembler. The URLs of all public data files on TCGA DCC data server were gathered at Jan-05-2015. Only eight cancer types have enough normal control samples for differential expression analysis. (t test, adjusted p<0.05 (using Benjamini-Hochberg FDR)) |
 |
| Top |
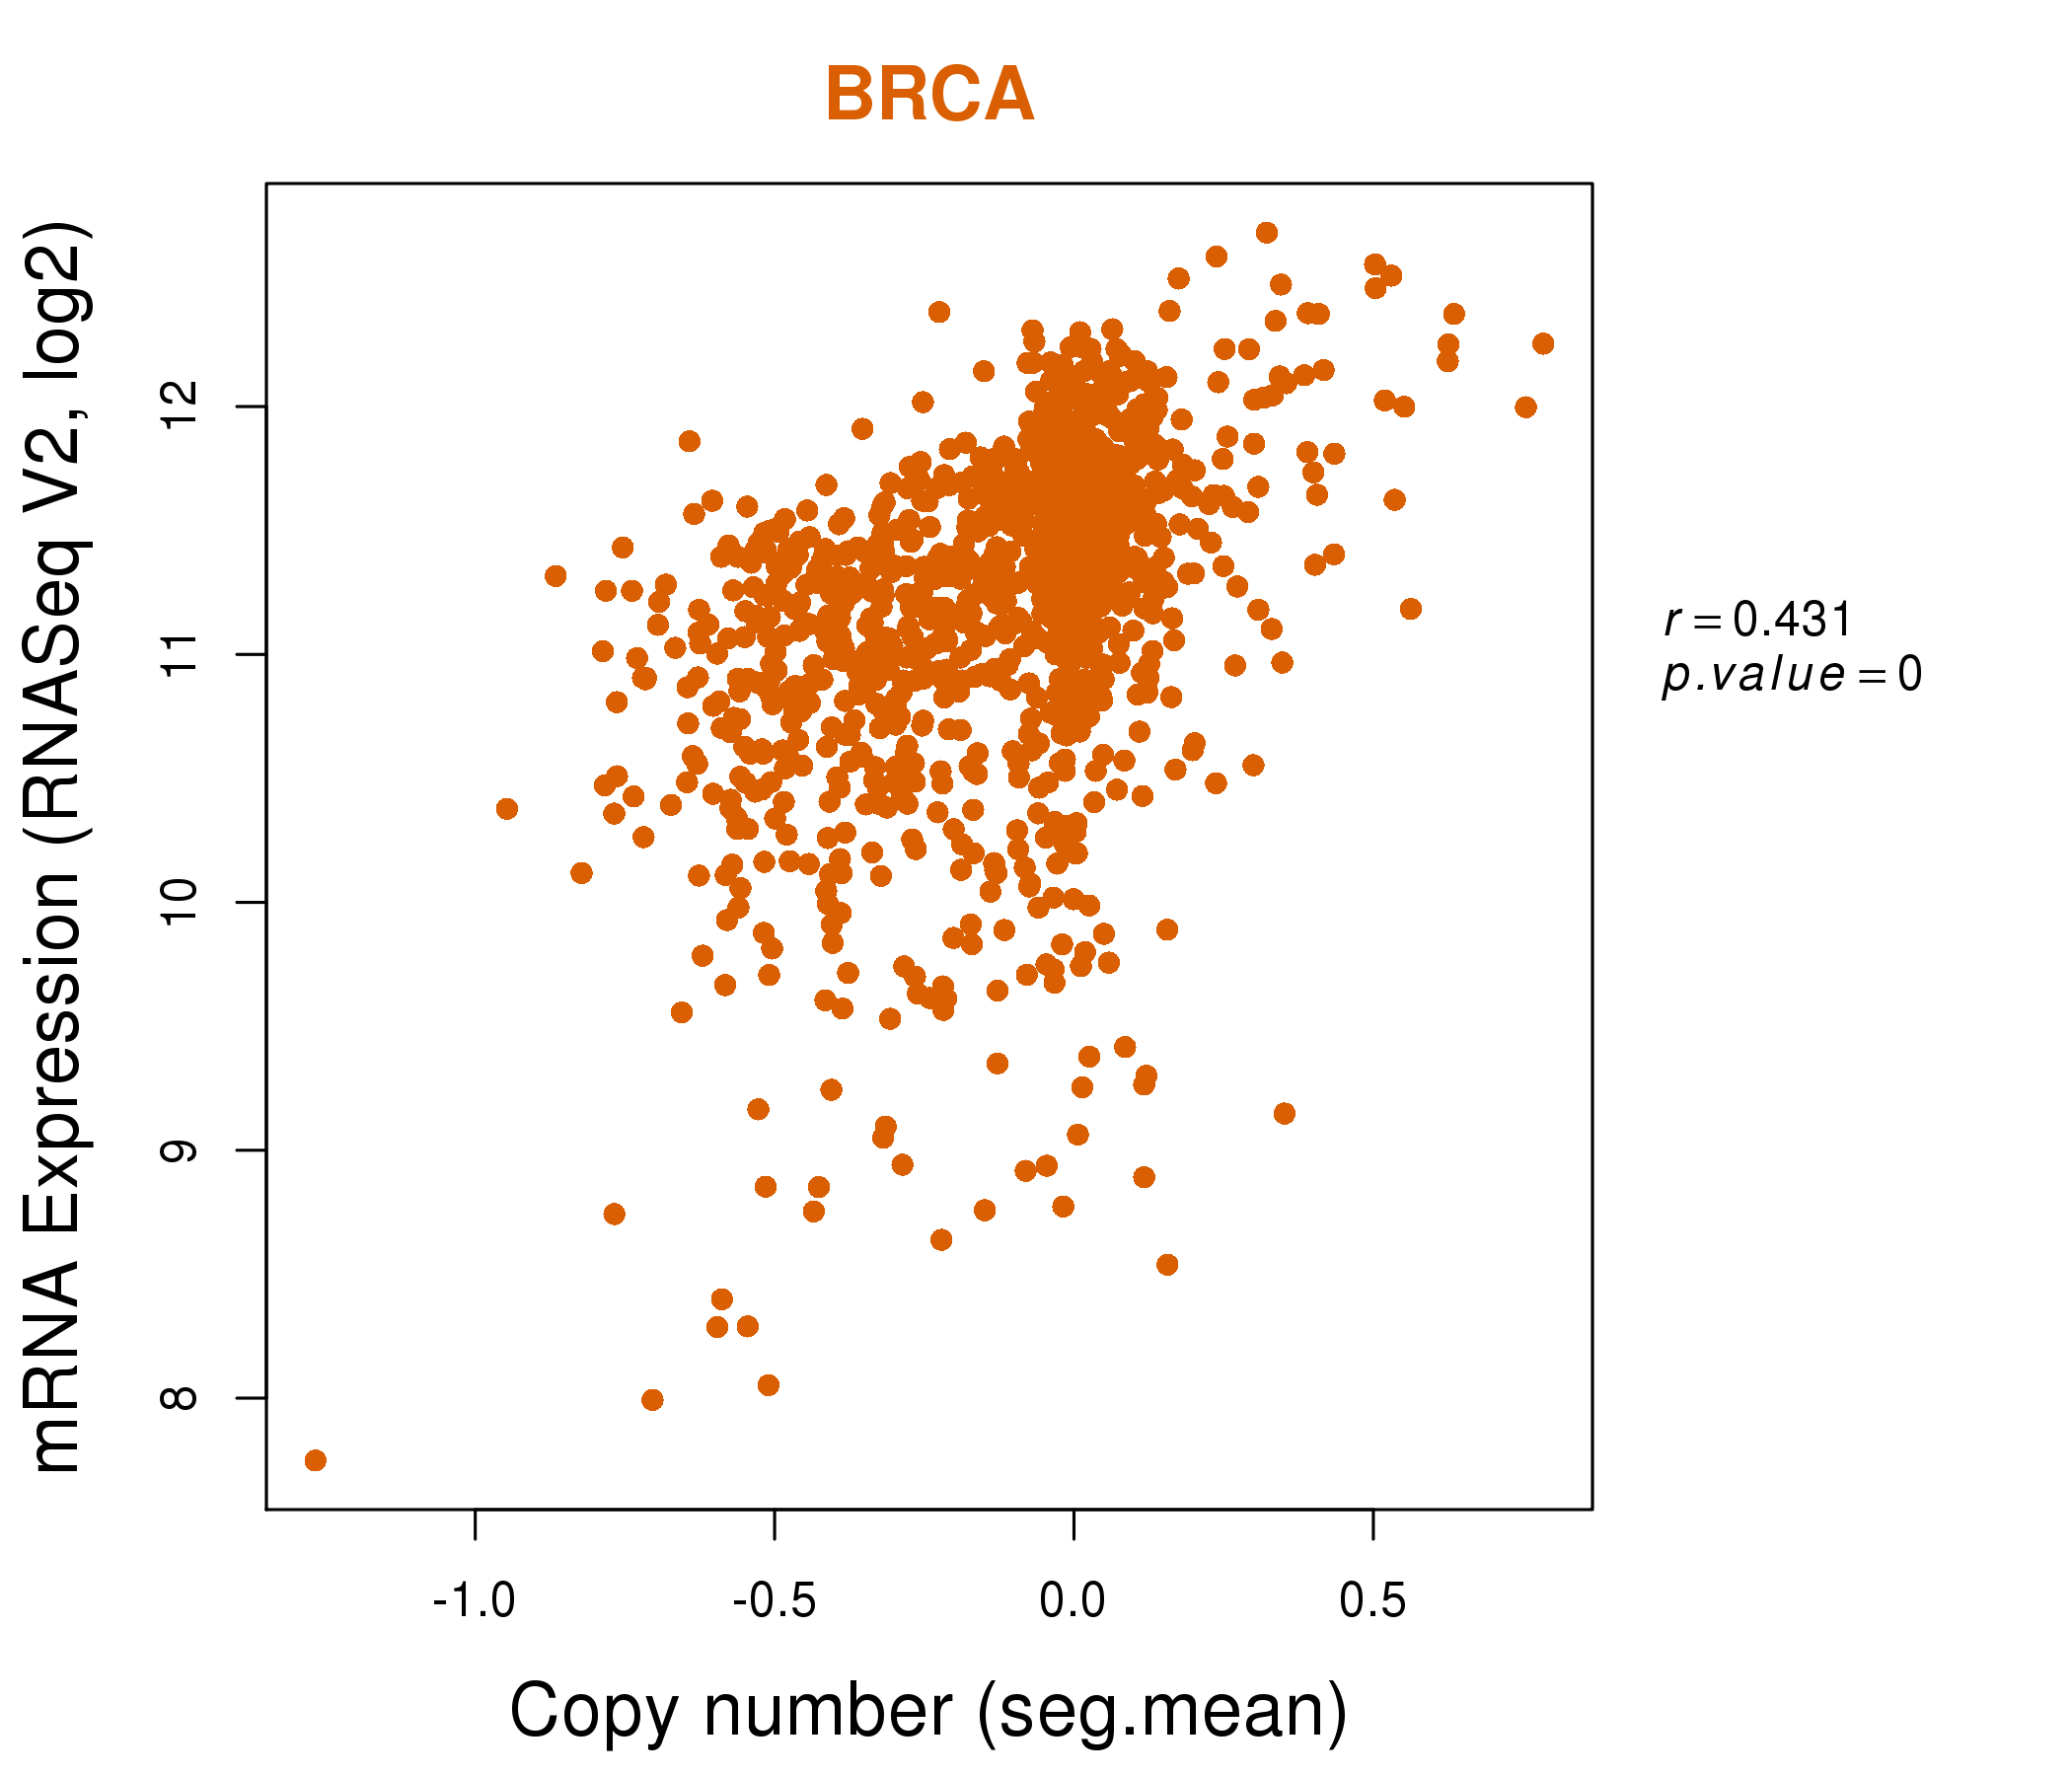
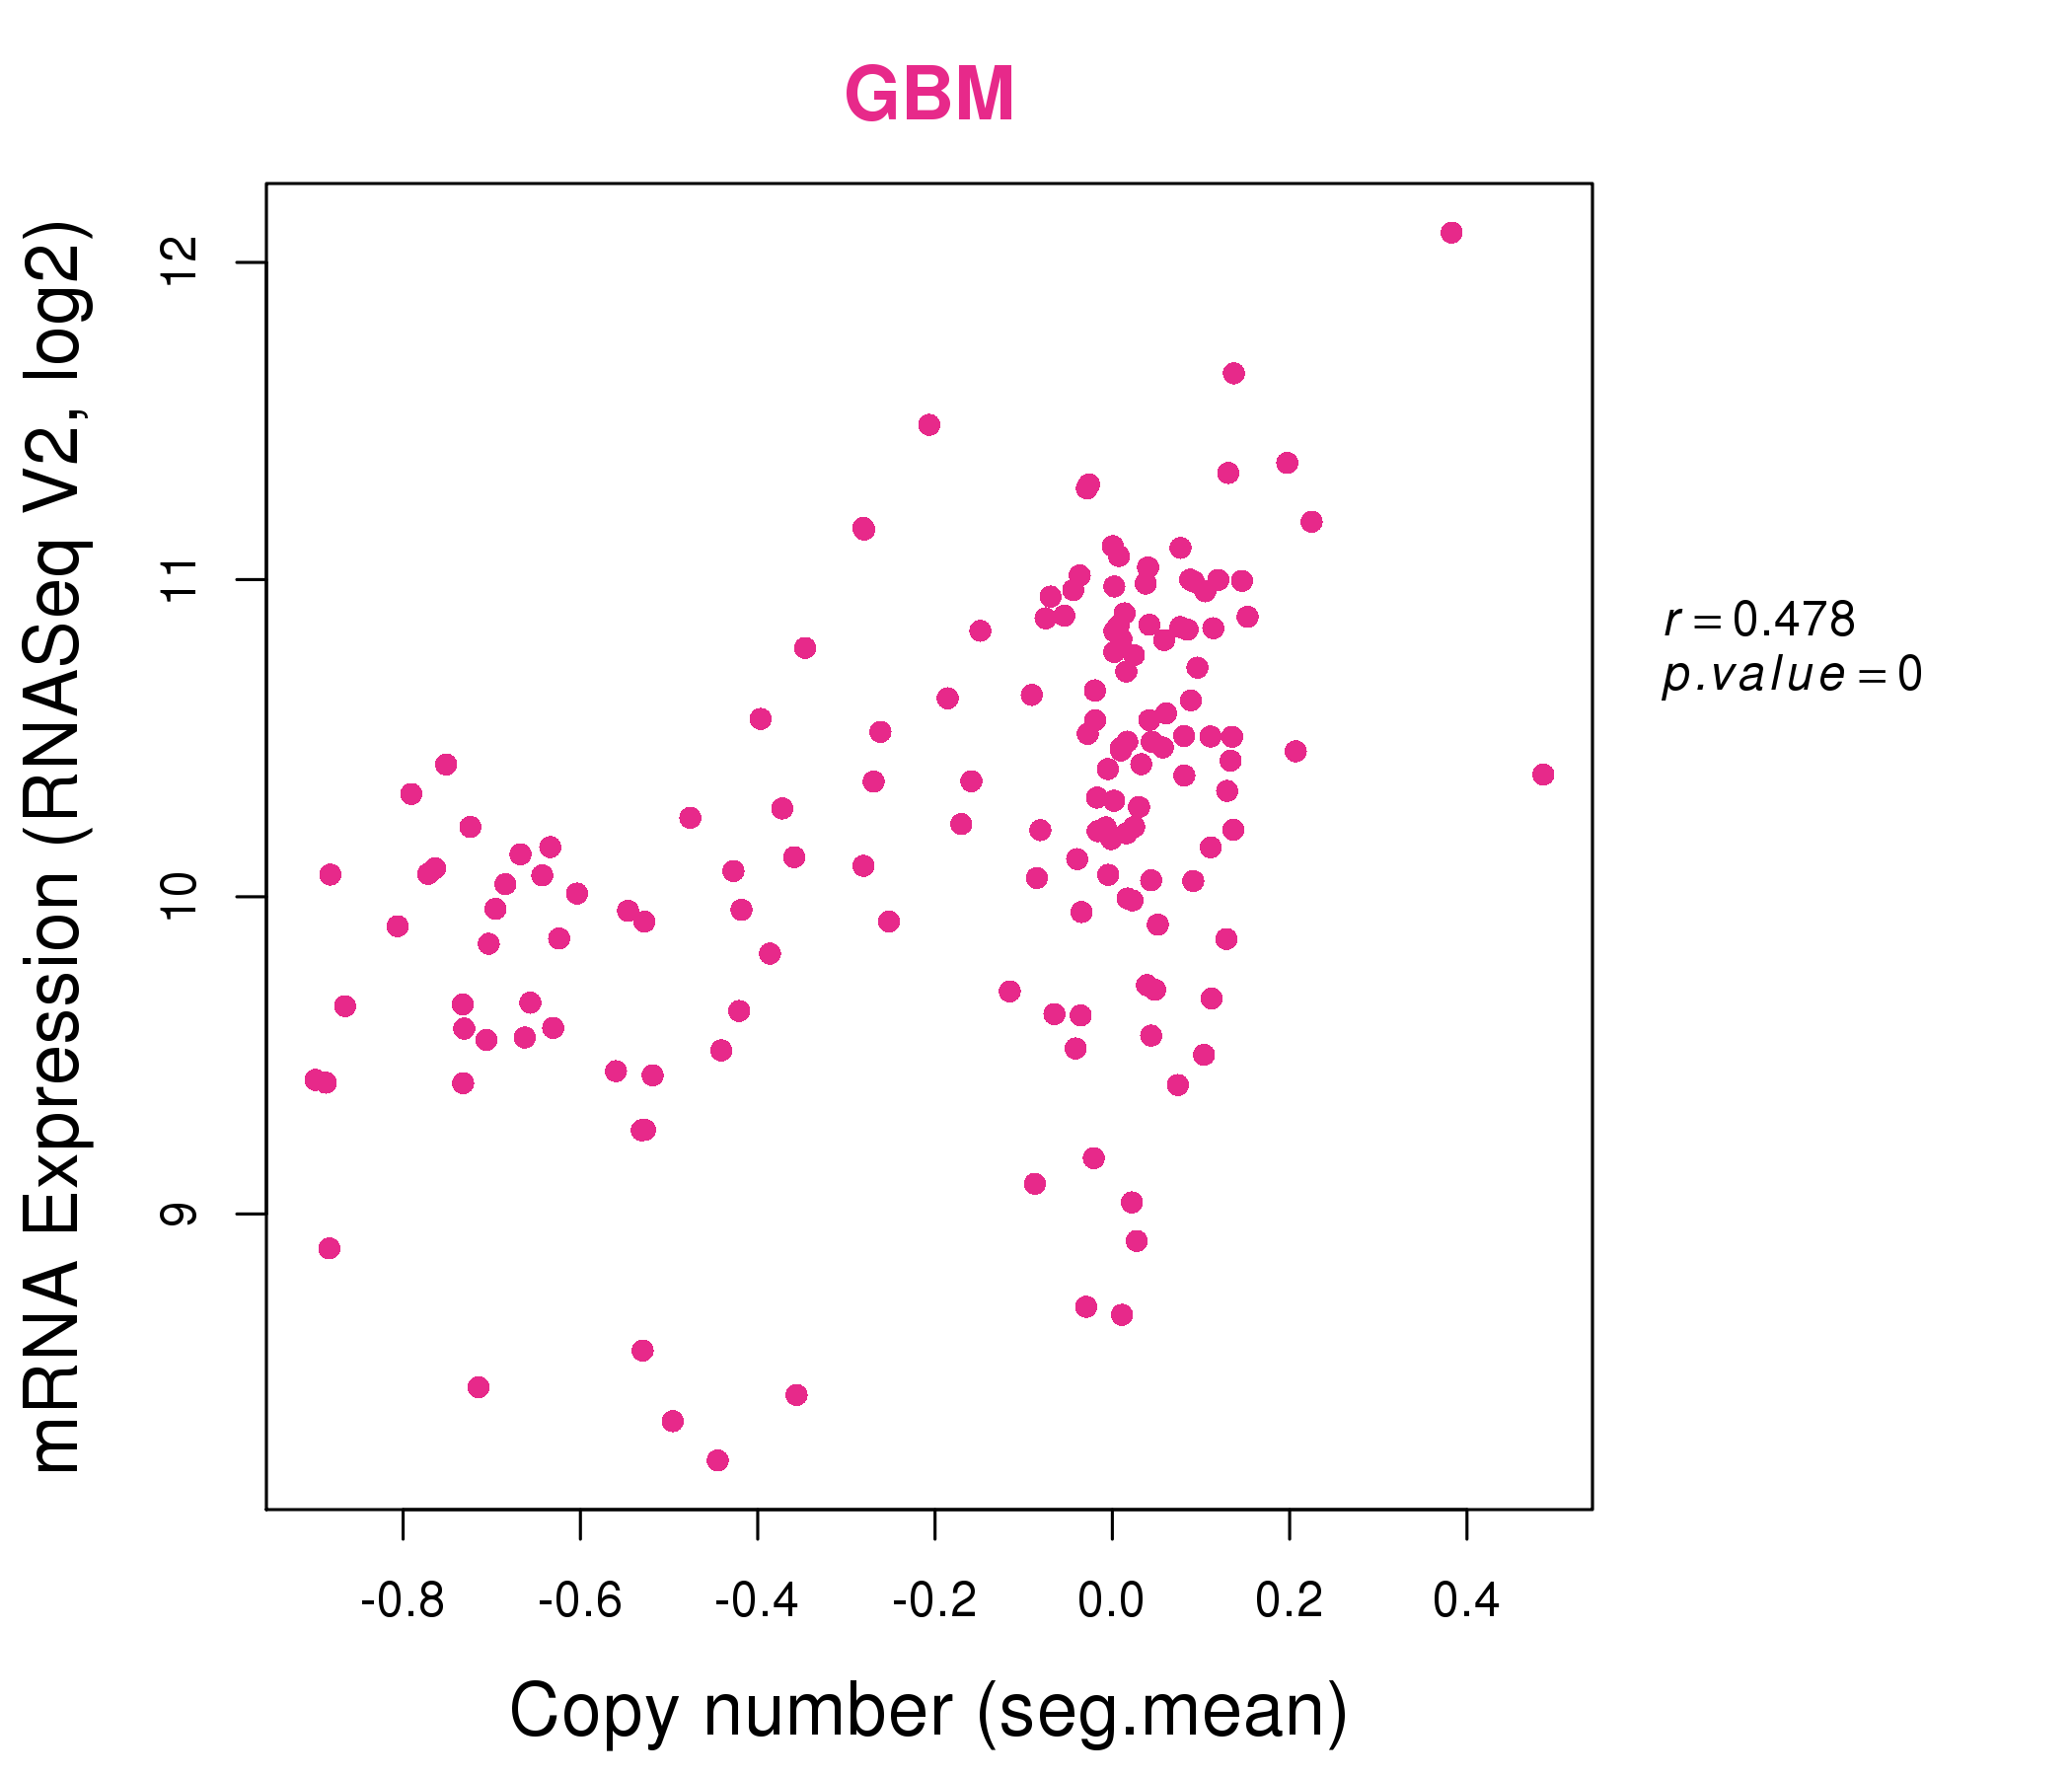
| * This plots show the correlation between CNV and gene expression. |
: Open all plots for all cancer types
 |
|
 |
|
| Top |
| Gene-Gene Network Information |
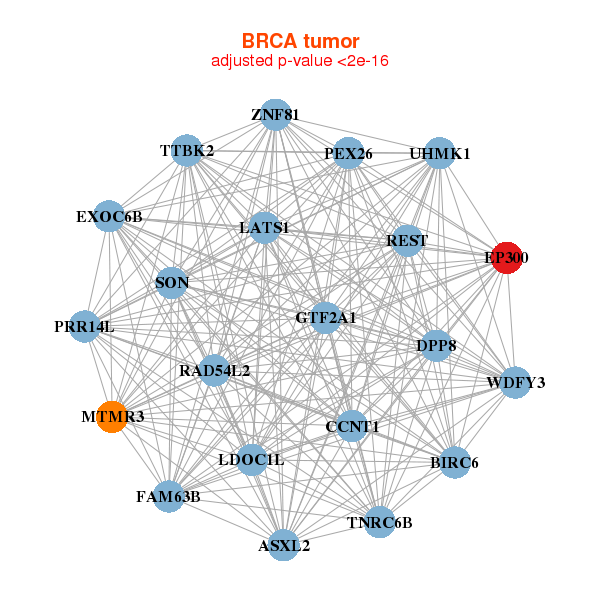
| * Co-Expression network figures were drawn using R package igraph. Only the top 20 genes with the highest correlations were shown. Red circle: input gene, orange circle: cell metabolism gene, sky circle: other gene |
: Open all plots for all cancer types
 |
| ||||
| ASXL2,BIRC6,PRR14L,CCNT1,DPP8,EP300,EXOC6B, FAM63B,GTF2A1,LATS1,LDOC1L,MTMR3,PEX26,RAD54L2, REST,SON,TNRC6B,TTBK2,UHMK1,WDFY3,ZNF81 | ASH1L,BIRC6,BOD1L1,BPTF,C11orf30,CCNT1,EP300, GTF2A1,EPG5,LATS1,LMTK2,KMT2C,KMT2A,MYO9A, KAT6A,NCOA2,REST,RSF1,SBNO1,SPEN,ZKSCAN8 | ||||
 |
| ||||
| ASXL2,PRR14L,SPECC1L,EP300,FAM168A,GTF2A1,HERC1, LATS1,LDOC1L,MED13L,KMT2B___KMT2D,MYO9A,NCOA2,PI4KA, REST,SOS1,SPEN,TAOK1,TTBK2,ZNF106,ZNF609 | ARID1A,ATXN1L,BOD1L1,BPTF,HECTD4,CHD8,CREBBP, DIDO1,EP300,EP400,GON4L,KDM2A,MED12,MED13L, KMT2C,KAT6A,SON,SPEN,SRCAP,TRRAP,VPS13D |
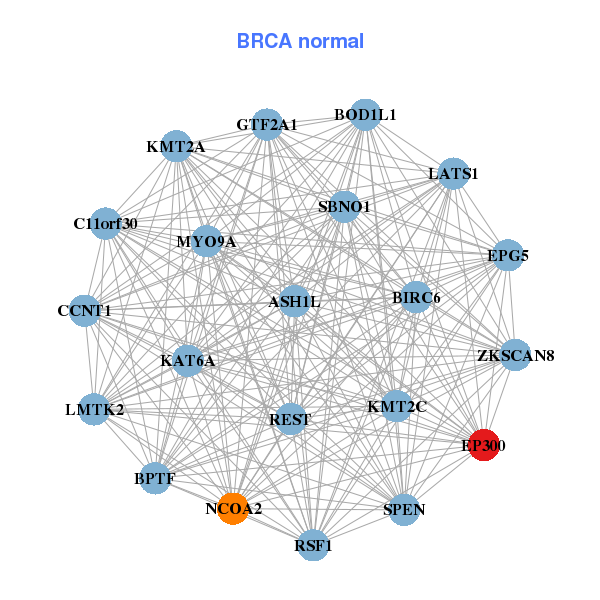
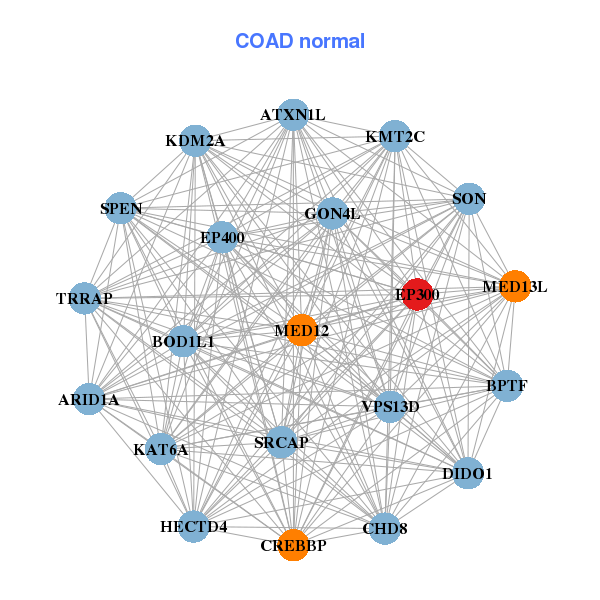
| * Co-Expression network figures were drawn using R package igraph. Only the top 20 genes with the highest correlations were shown. Red circle: input gene, orange circle: cell metabolism gene, sky circle: other gene |
: Open all plots for all cancer types
| Top |
: Open all interacting genes' information including KEGG pathway for all interacting genes from DAVID
| Top |
| Pharmacological Information for EP300 |
| DB Category | DB Name | DB's ID and Url link |
| Chemistry | BindingDB | Q09472; -. |
| Chemistry | ChEMBL | CHEMBL3784; -. |
| Chemistry | GuidetoPHARMACOLOGY | 2735; -. |
| Organism-specific databases | PharmGKB | PA27807; -. |
| Organism-specific databases | CTD | 2033; -. |
| * Gene Centered Interaction Network. |
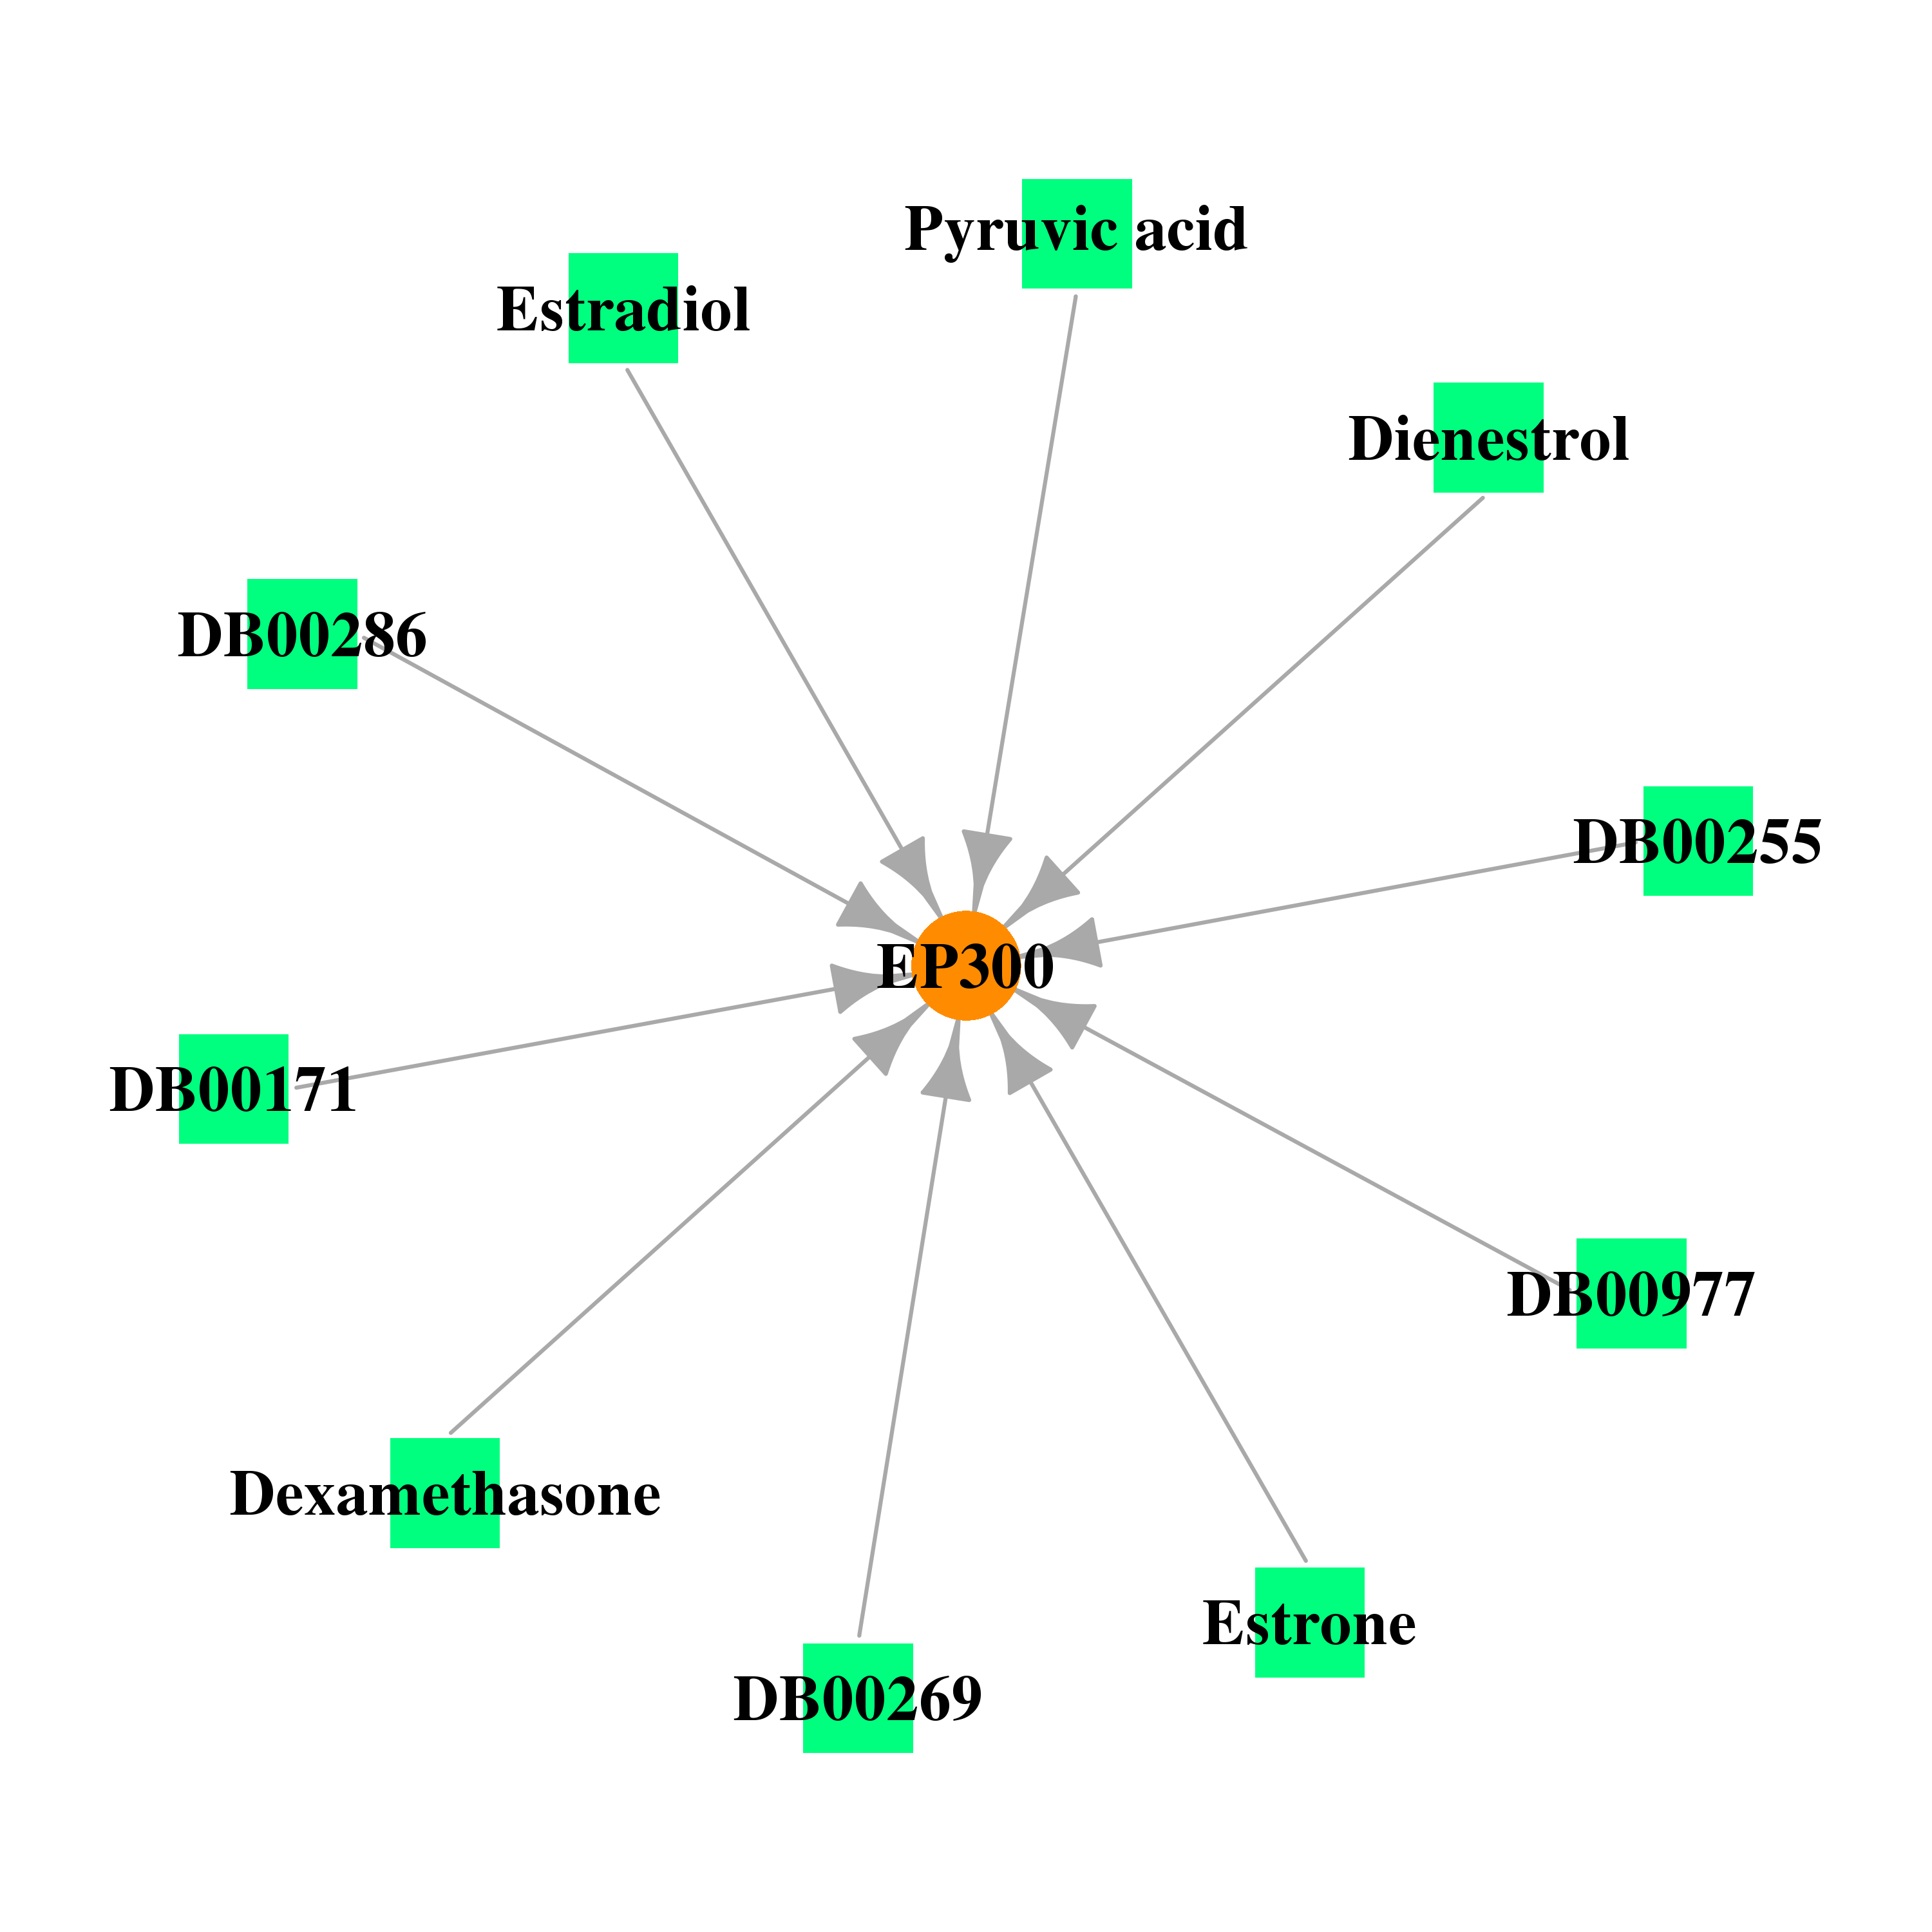 |
| * Drug Centered Interaction Network. |
| DrugBank ID | Target Name | Drug Groups | Generic Name | Drug Centered Network | Drug Structure |
| DB00171 | E1A binding protein p300 | approved; nutraceutical | Adenosine triphosphate |  |  |
| DB00119 | E1A binding protein p300 | approved; nutraceutical | Pyruvic acid | 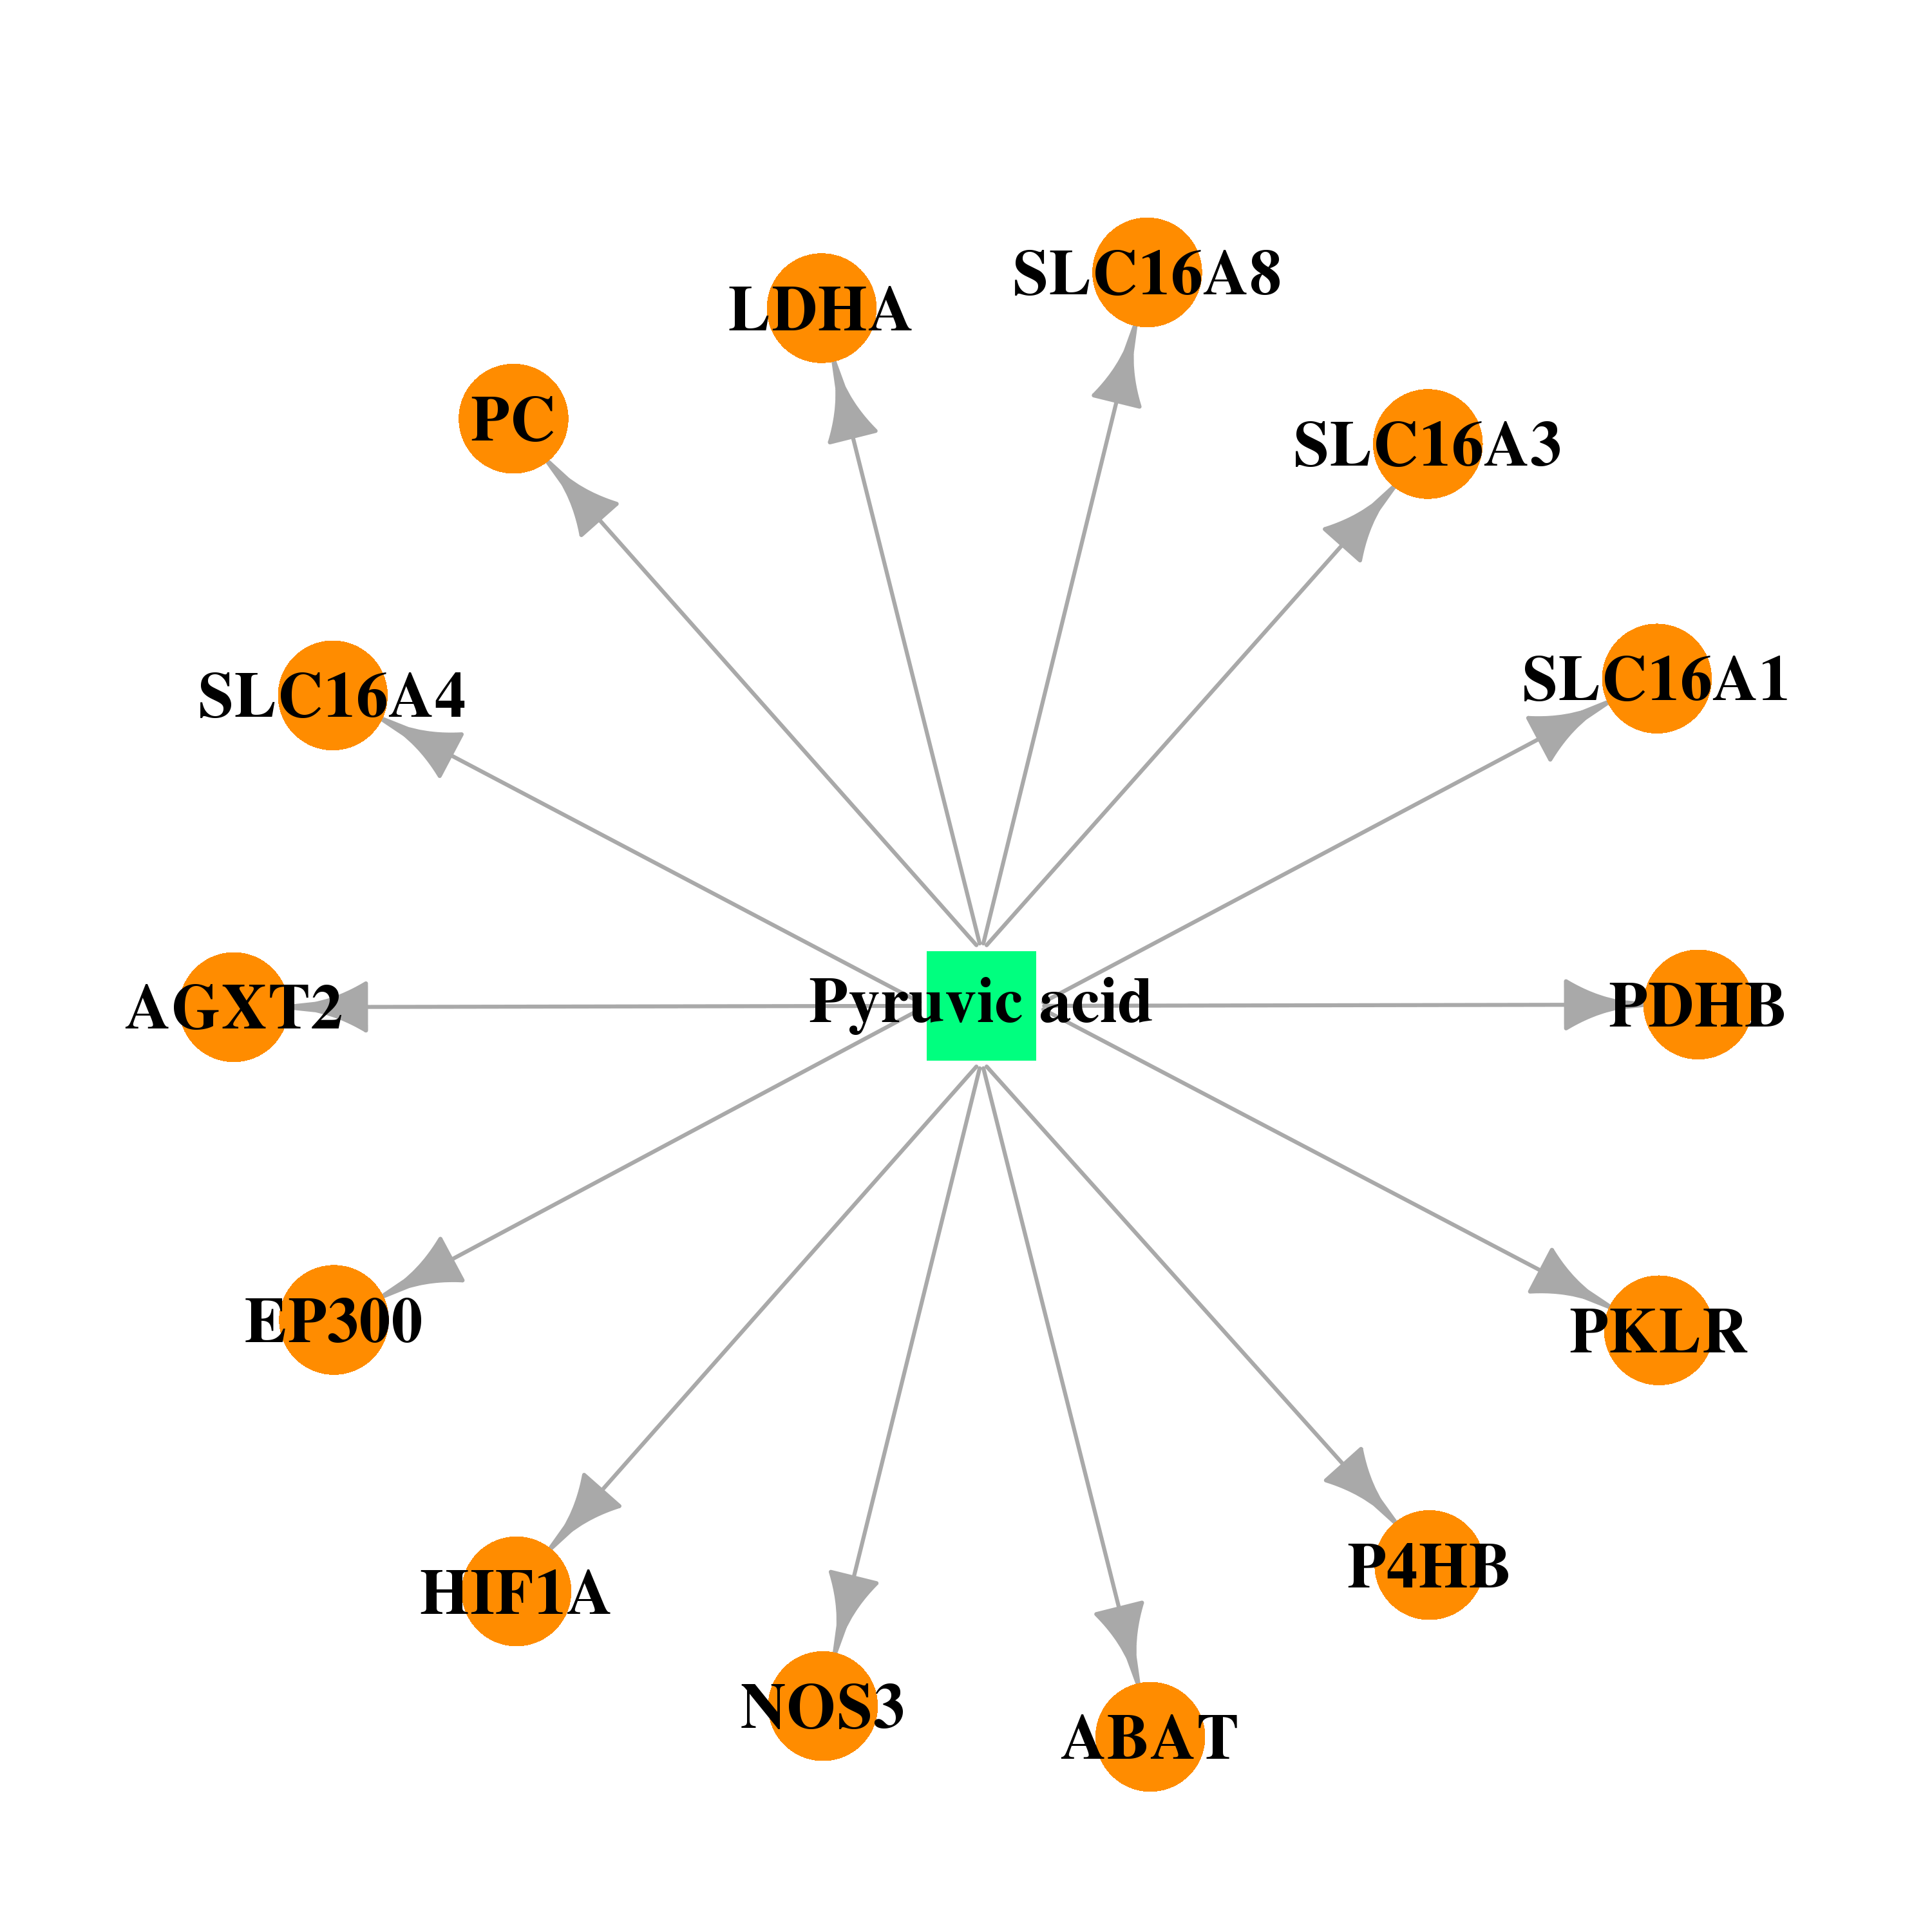 | 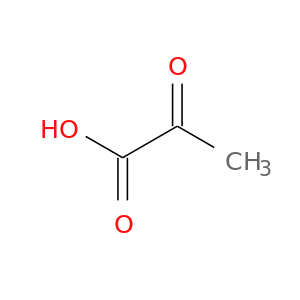 |
| DB01234 | E1A binding protein p300 | approved; investigational | Dexamethasone | 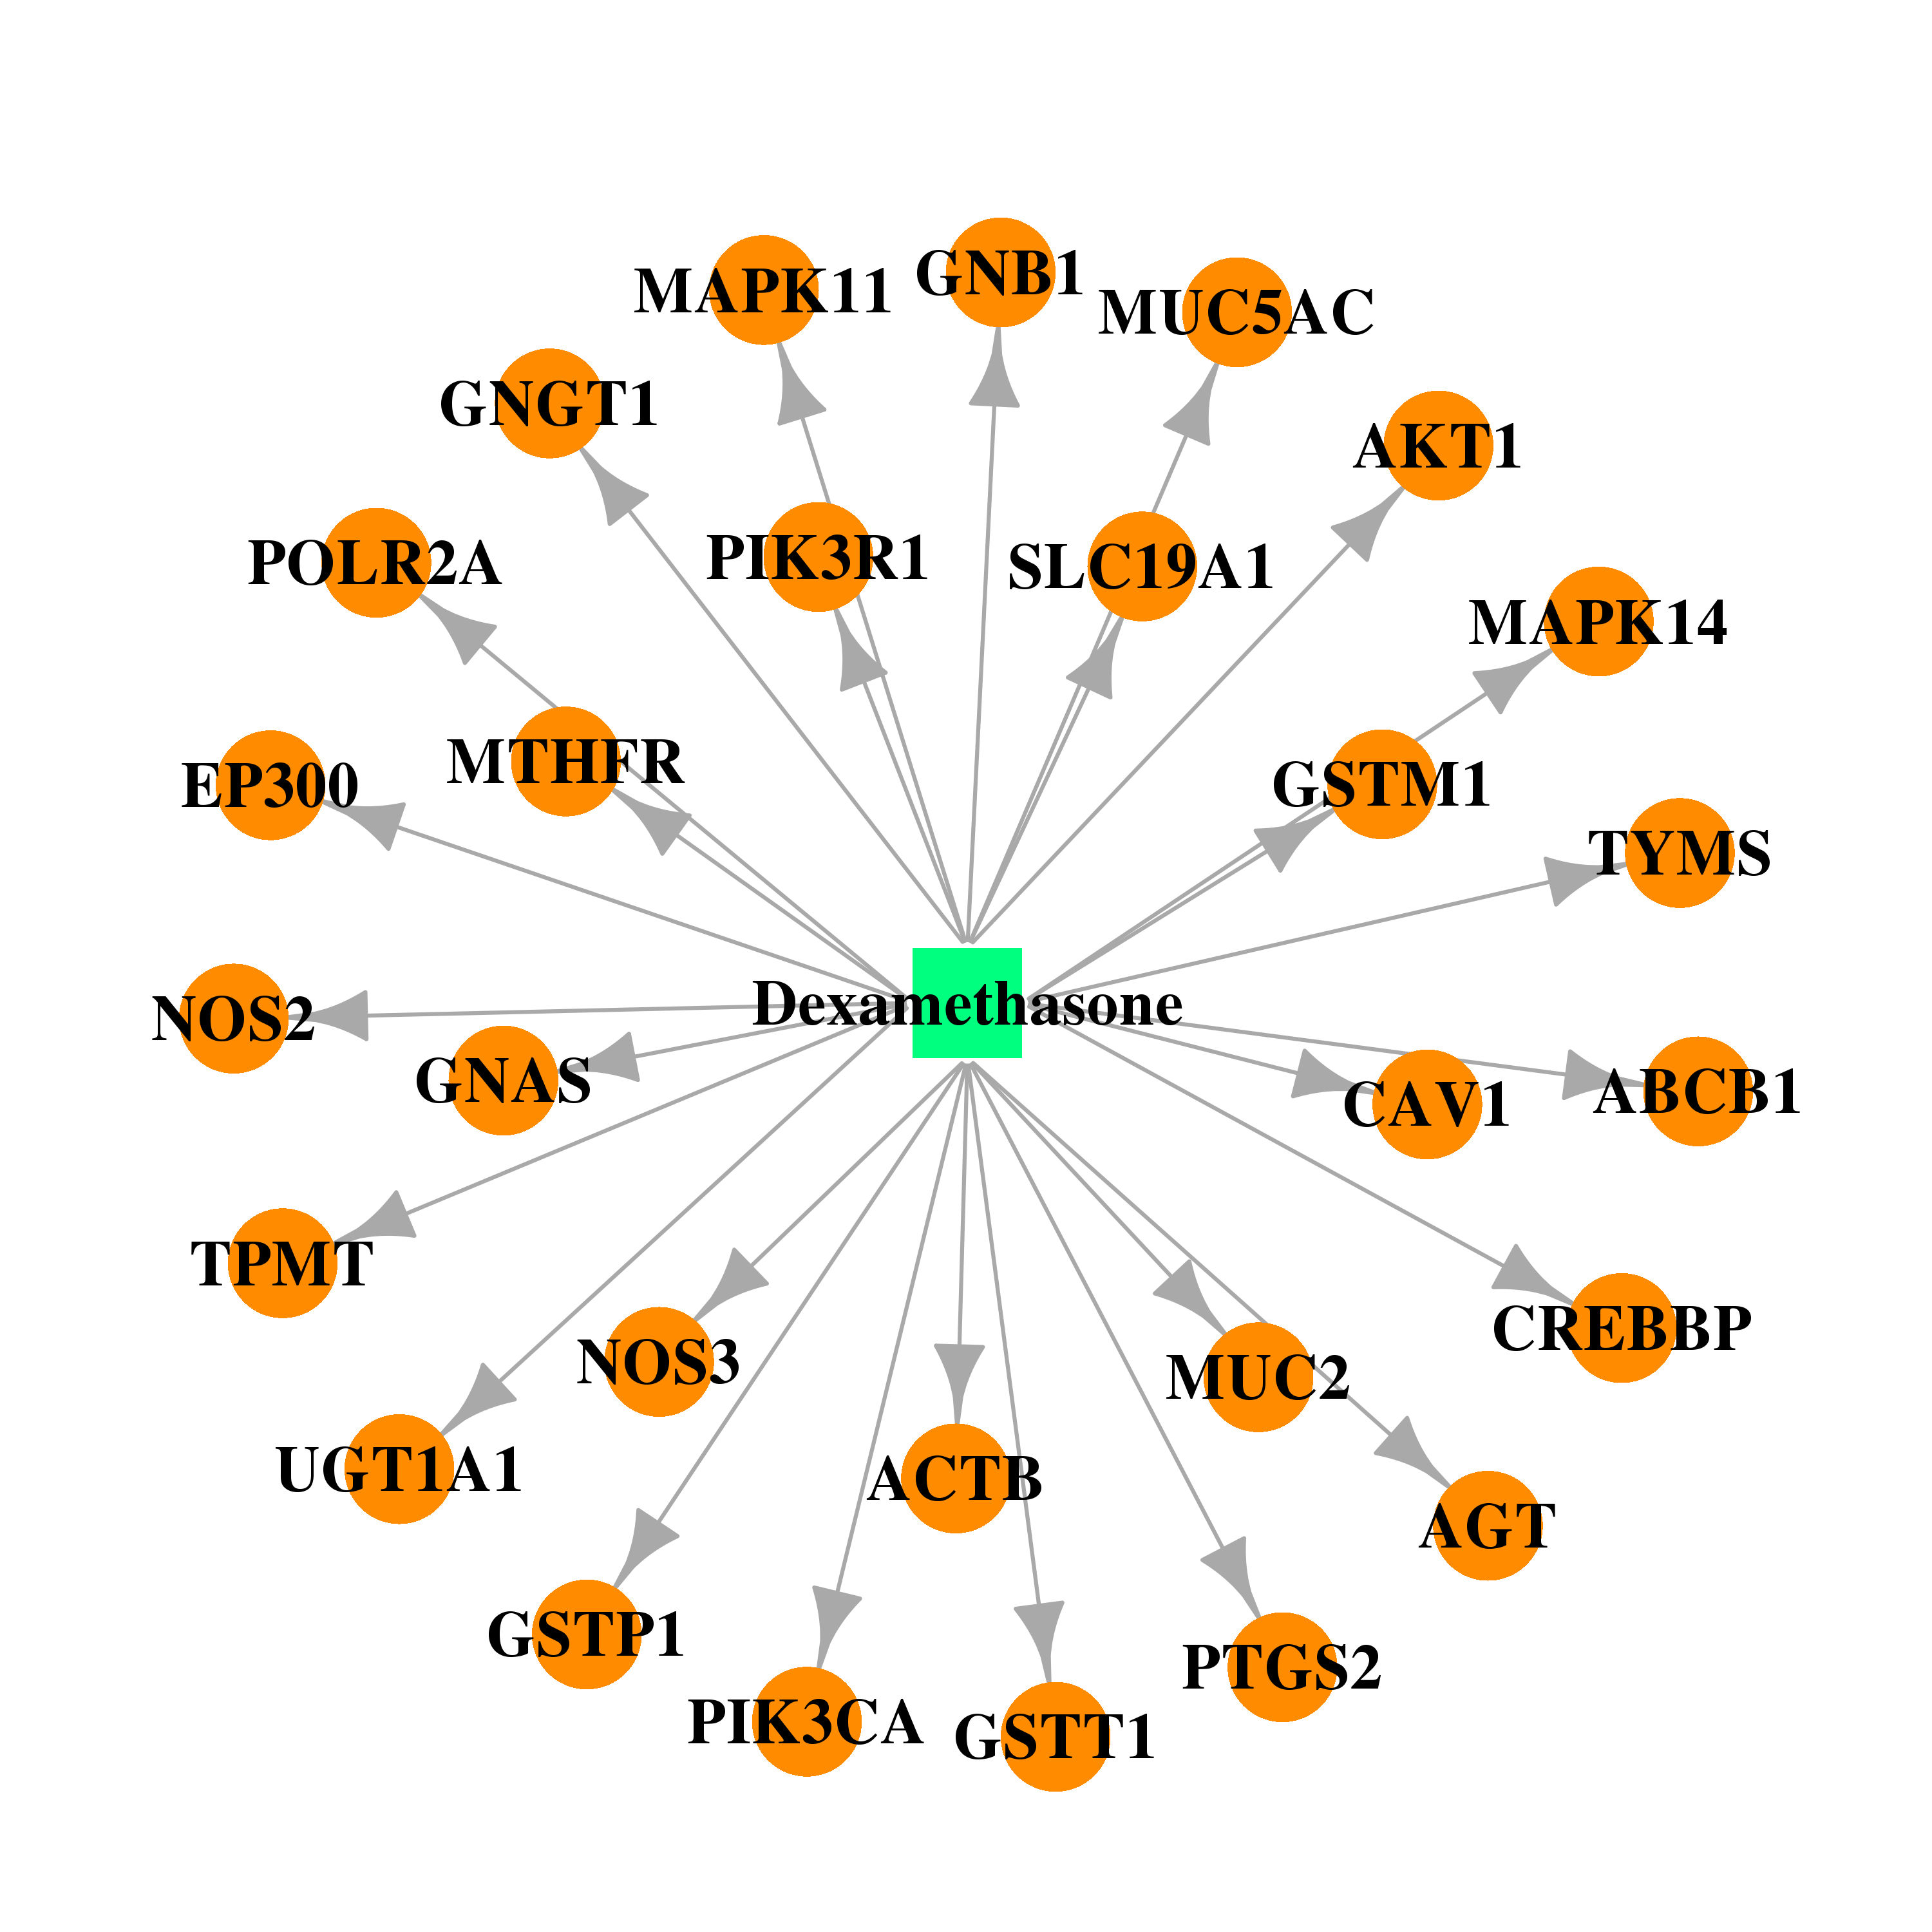 | 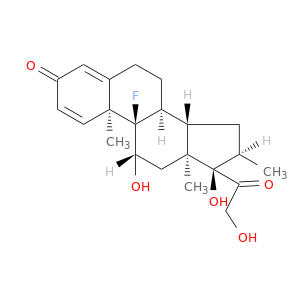 |
| DB00269 | E1A binding protein p300 | approved | Chlorotrianisene | 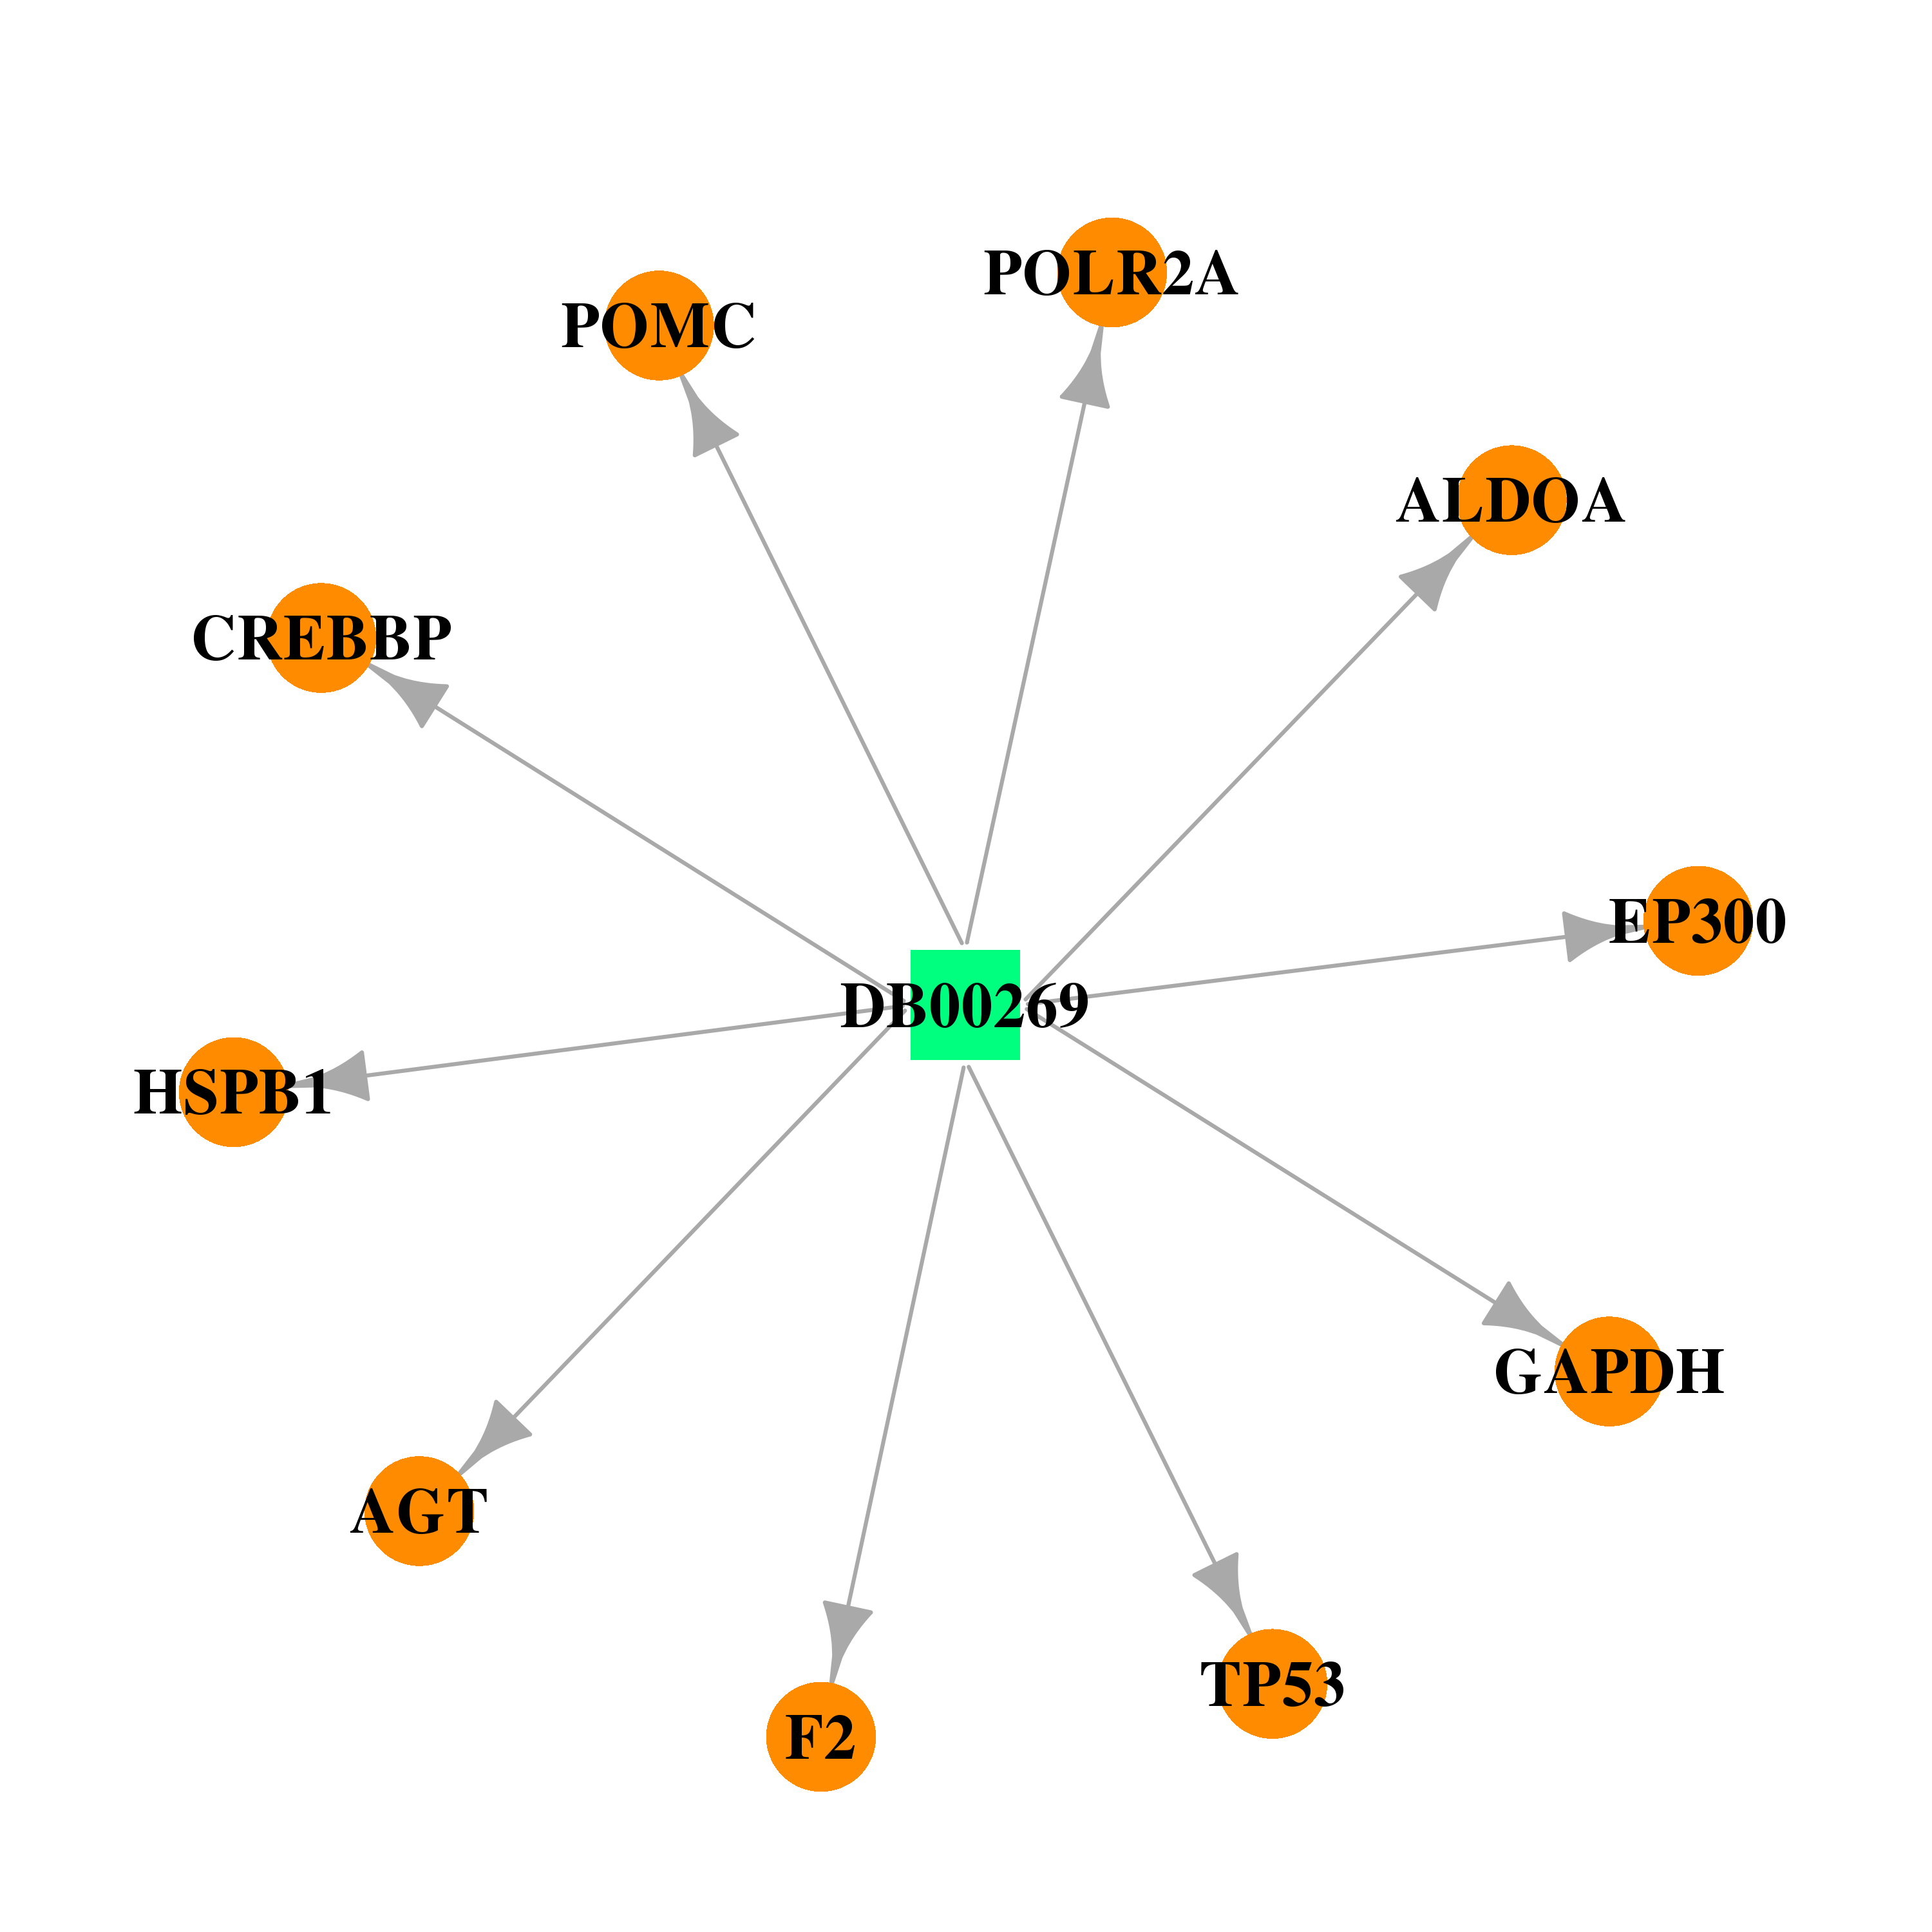 |  |
| DB00286 | E1A binding protein p300 | approved | Conjugated Estrogens | 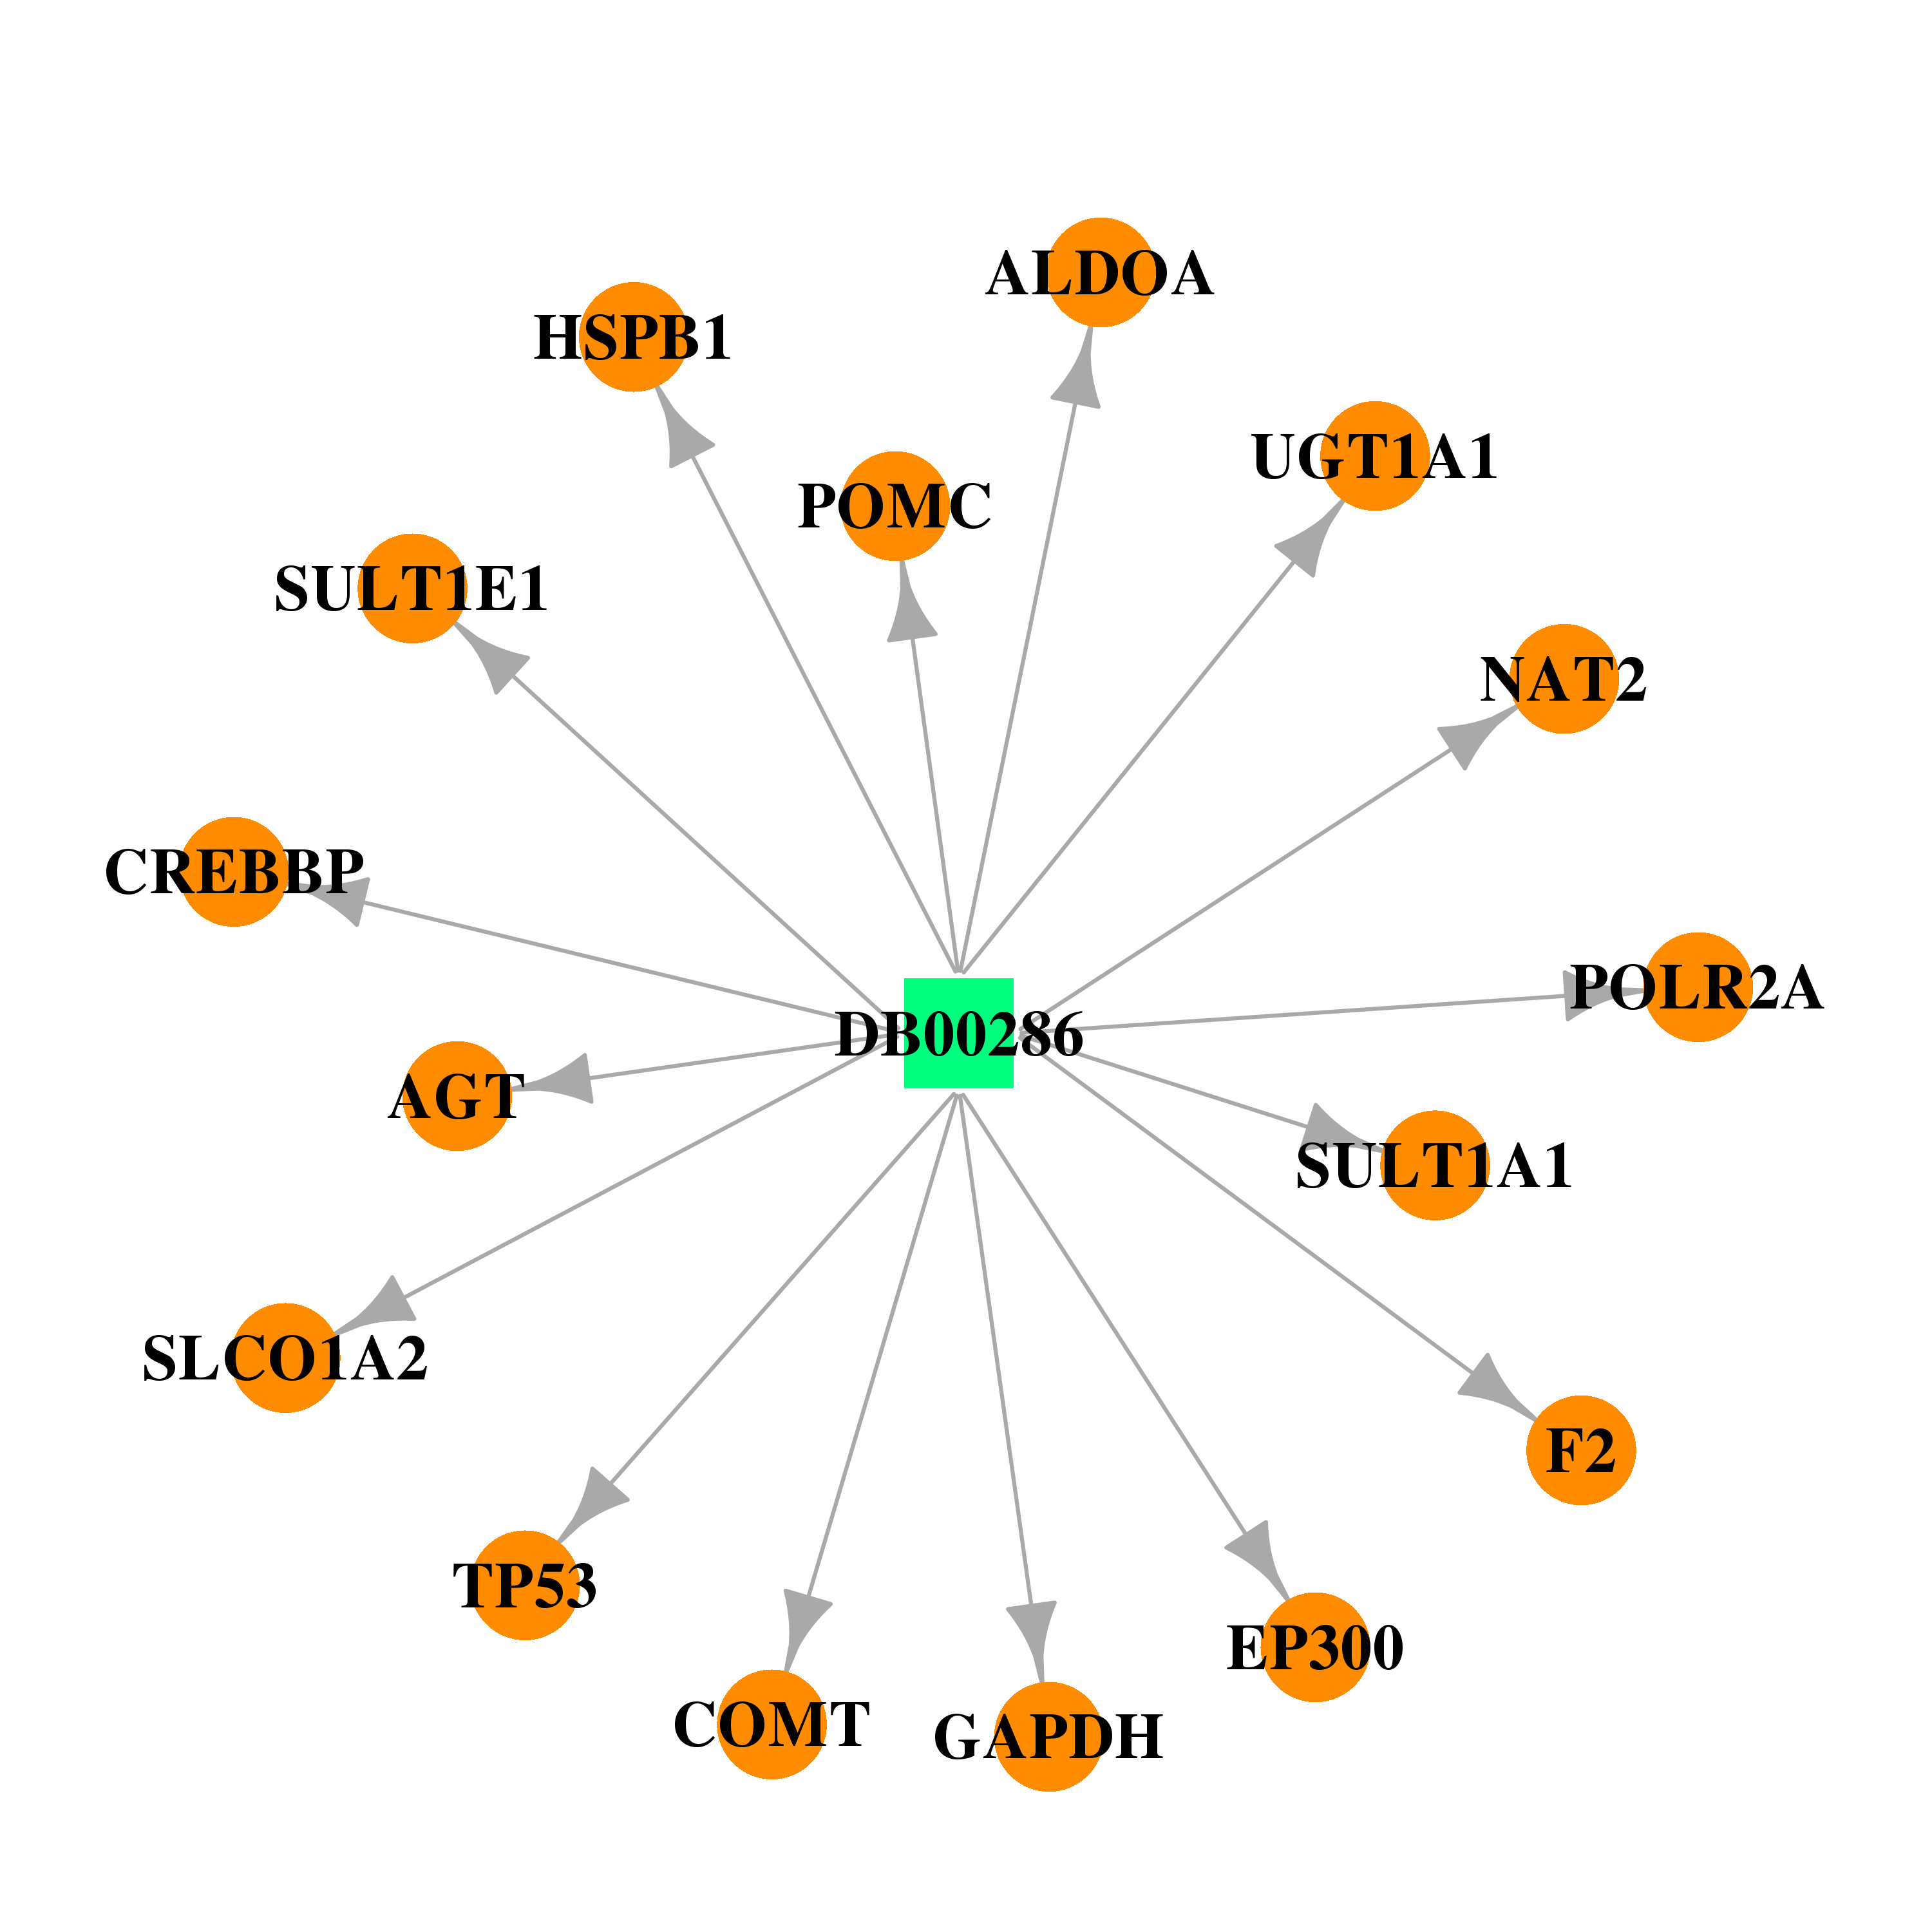 |  |
| DB00890 | E1A binding protein p300 | approved | Dienestrol | 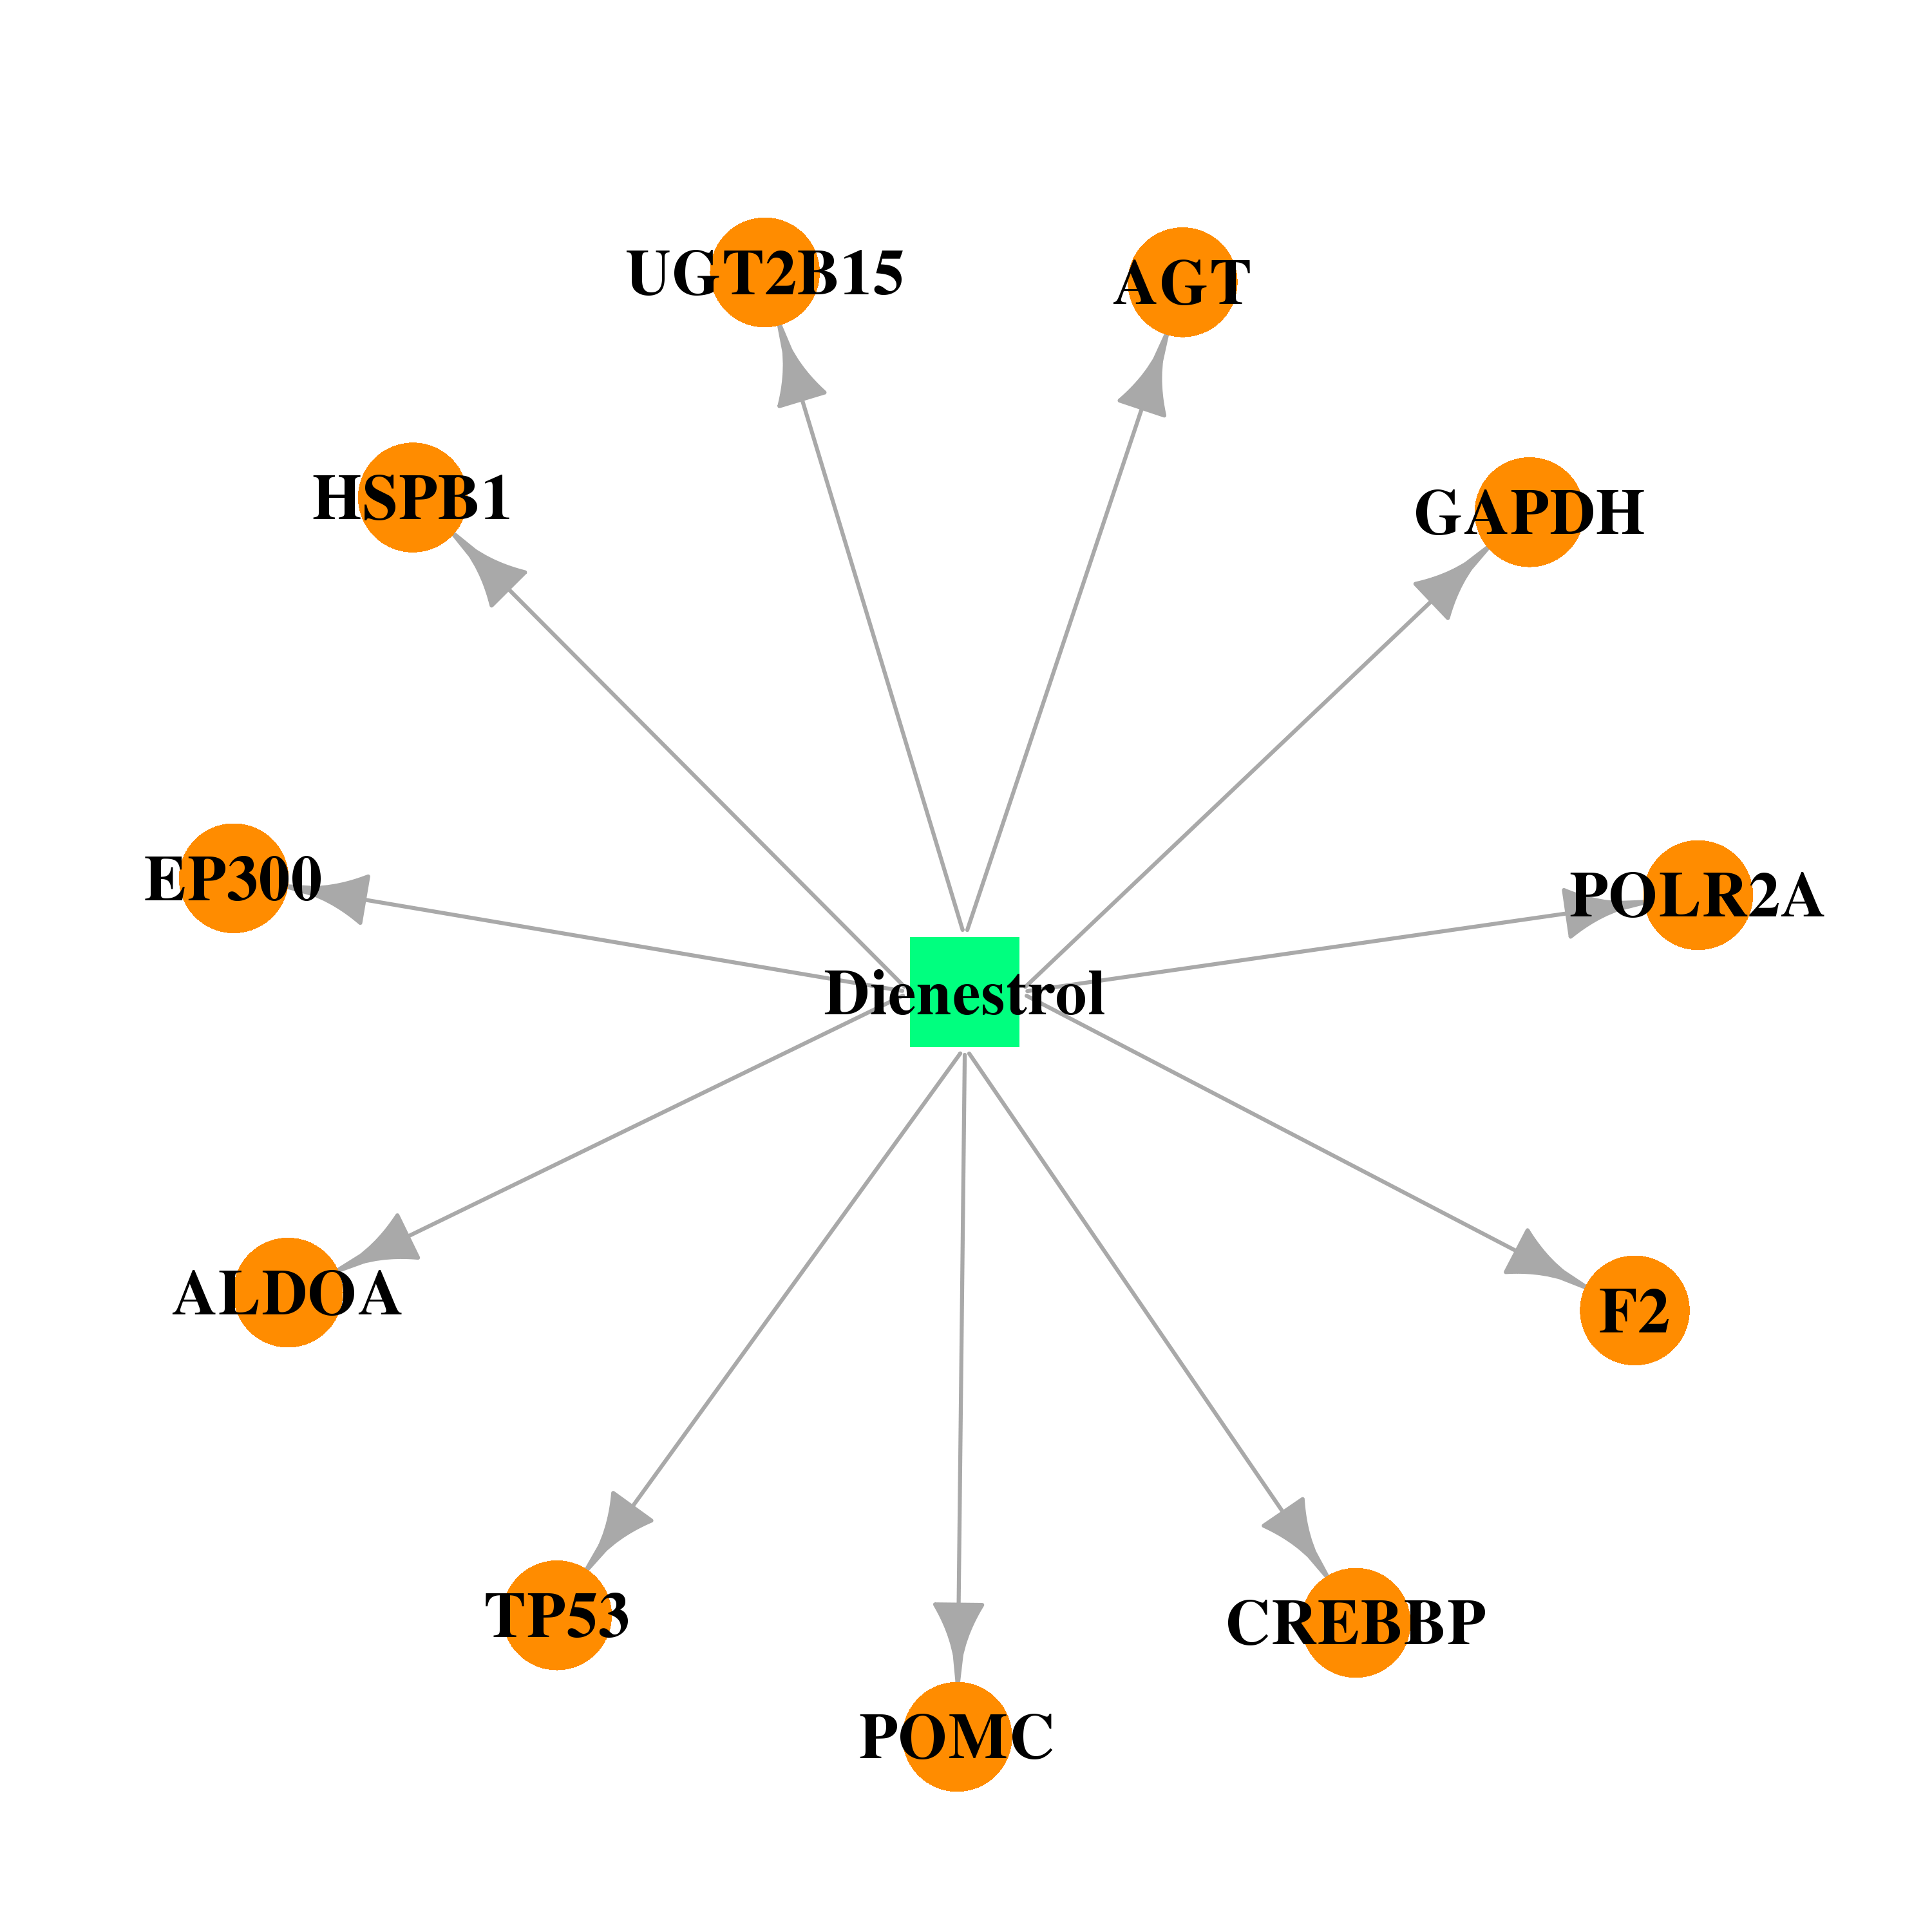 | 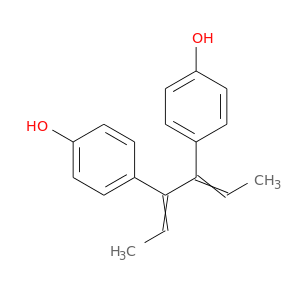 |
| DB00255 | E1A binding protein p300 | approved | Diethylstilbestrol |  |  |
| DB00783 | E1A binding protein p300 | approved; investigational | Estradiol | 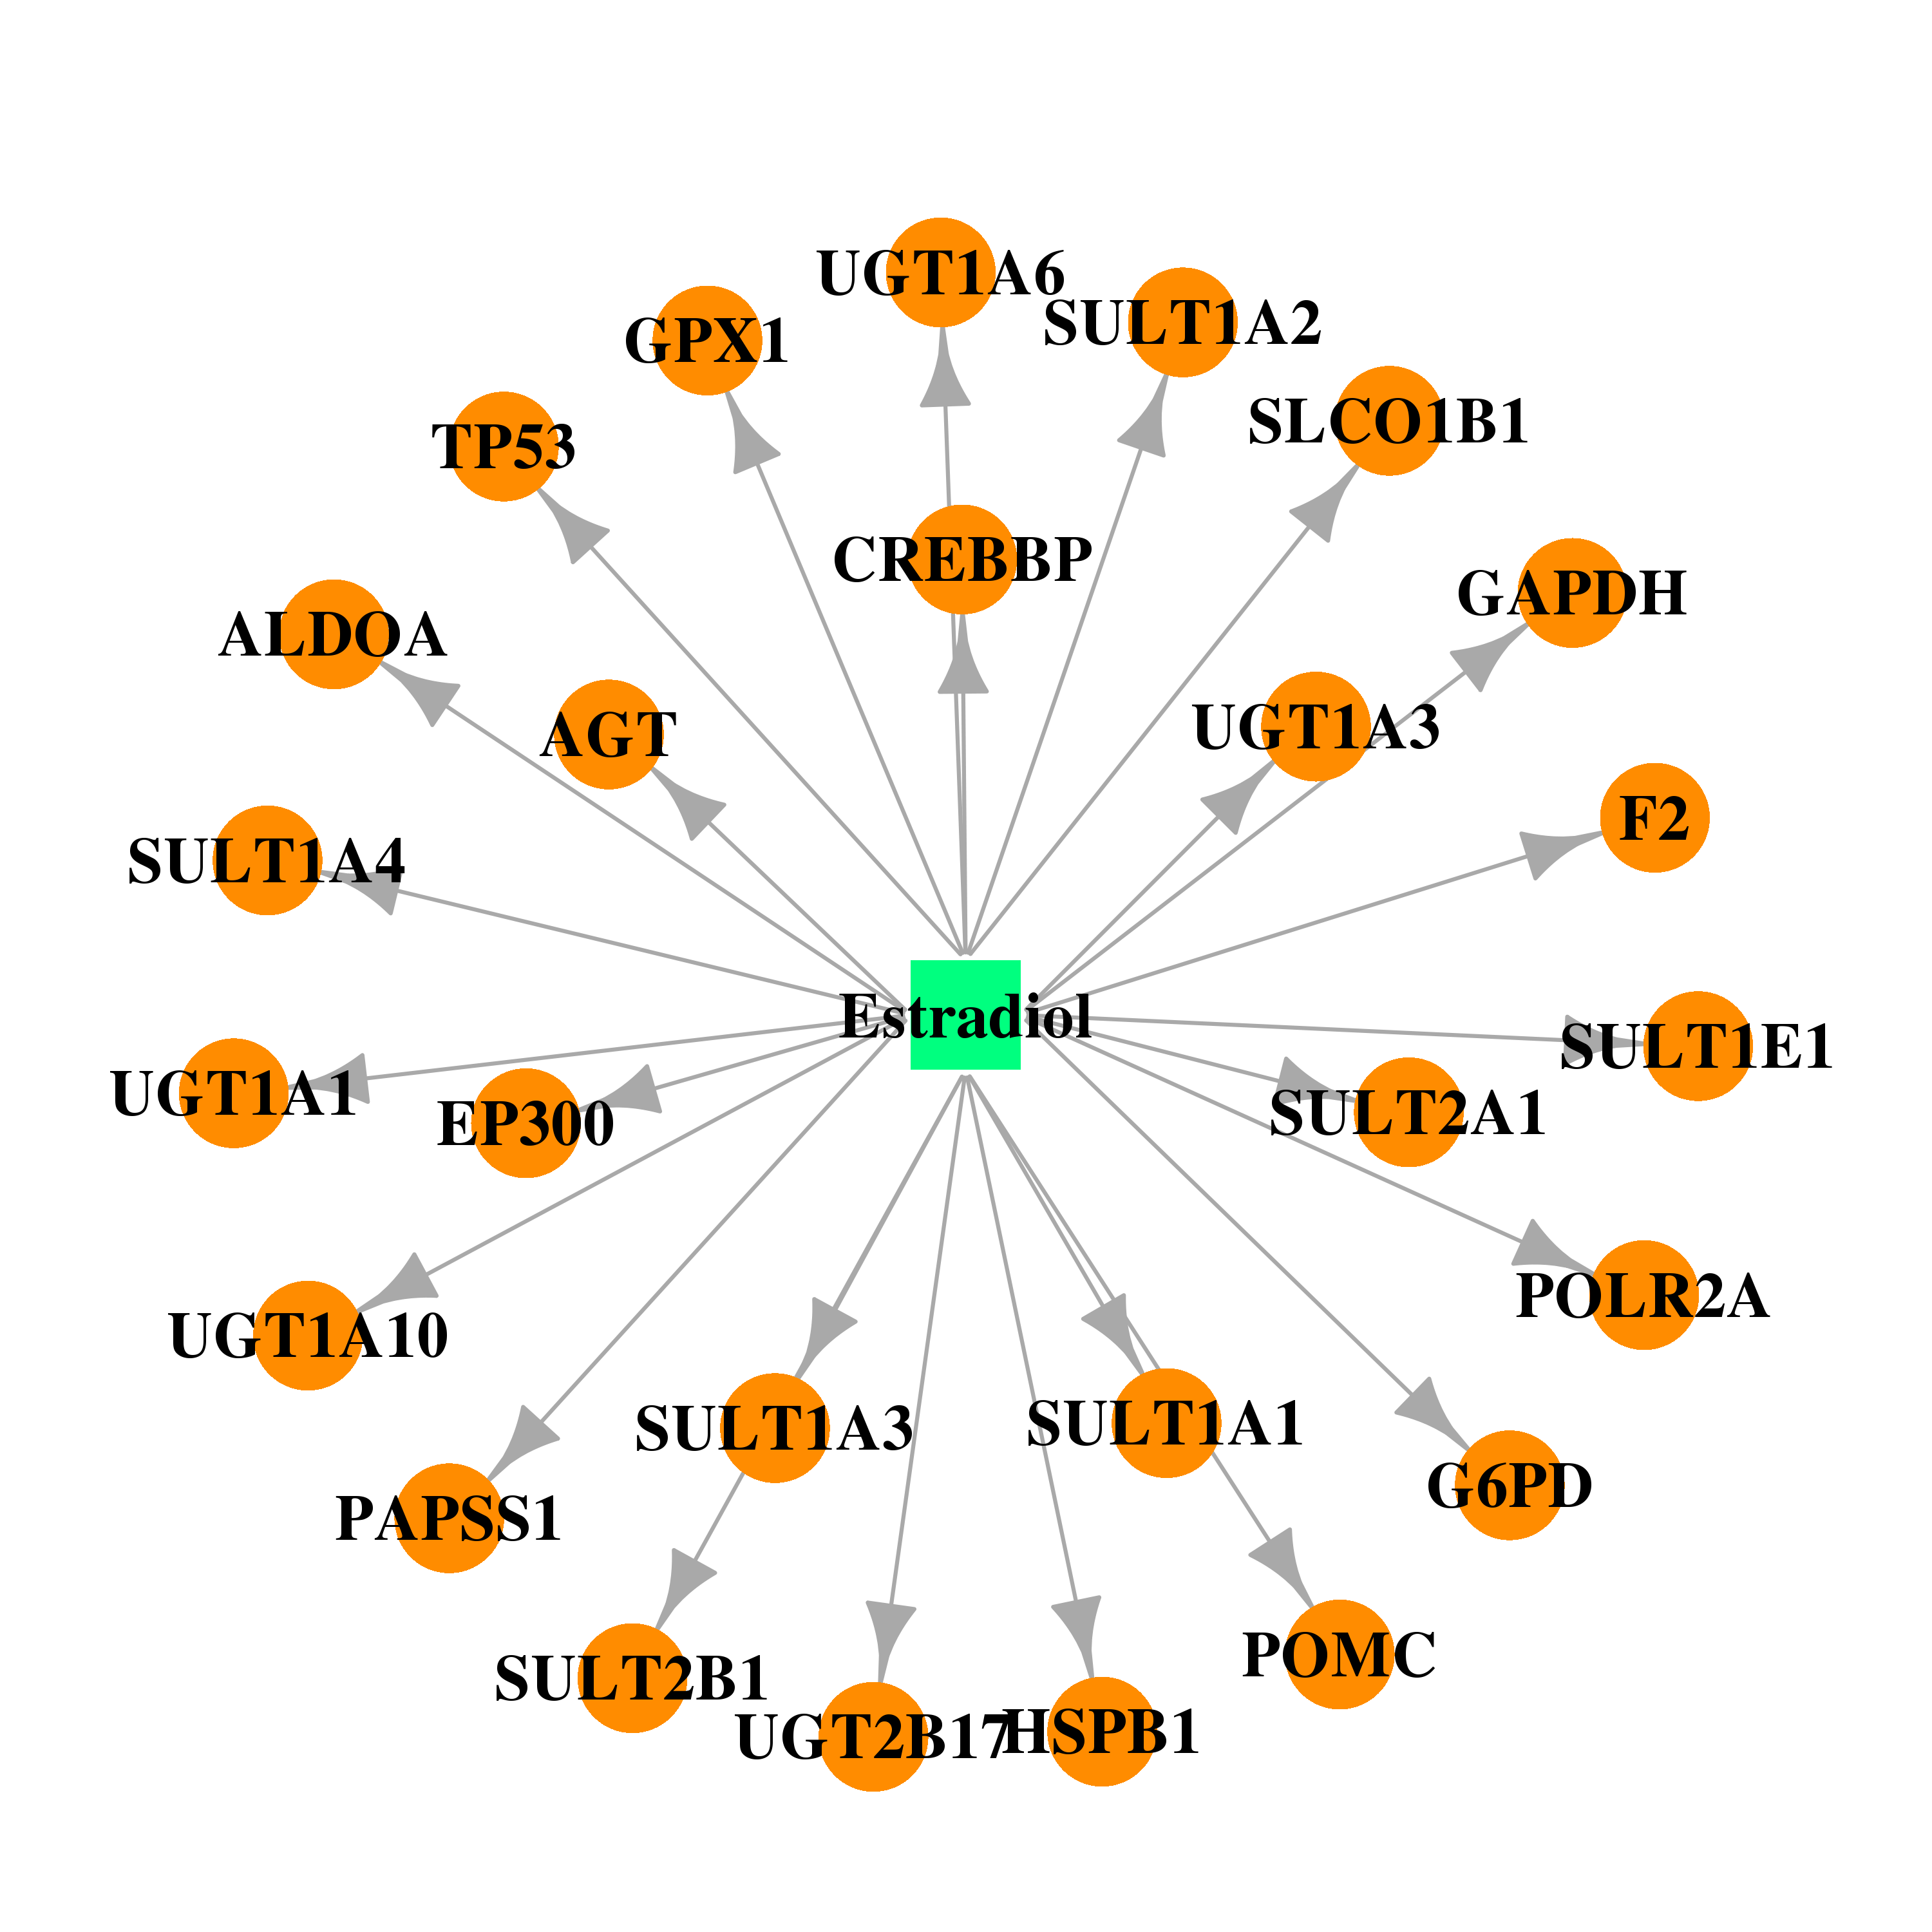 | 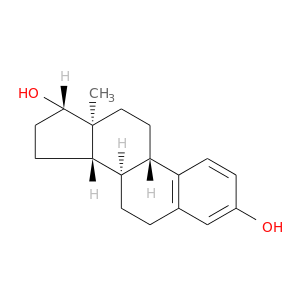 |
| DB00655 | E1A binding protein p300 | approved | Estrone | 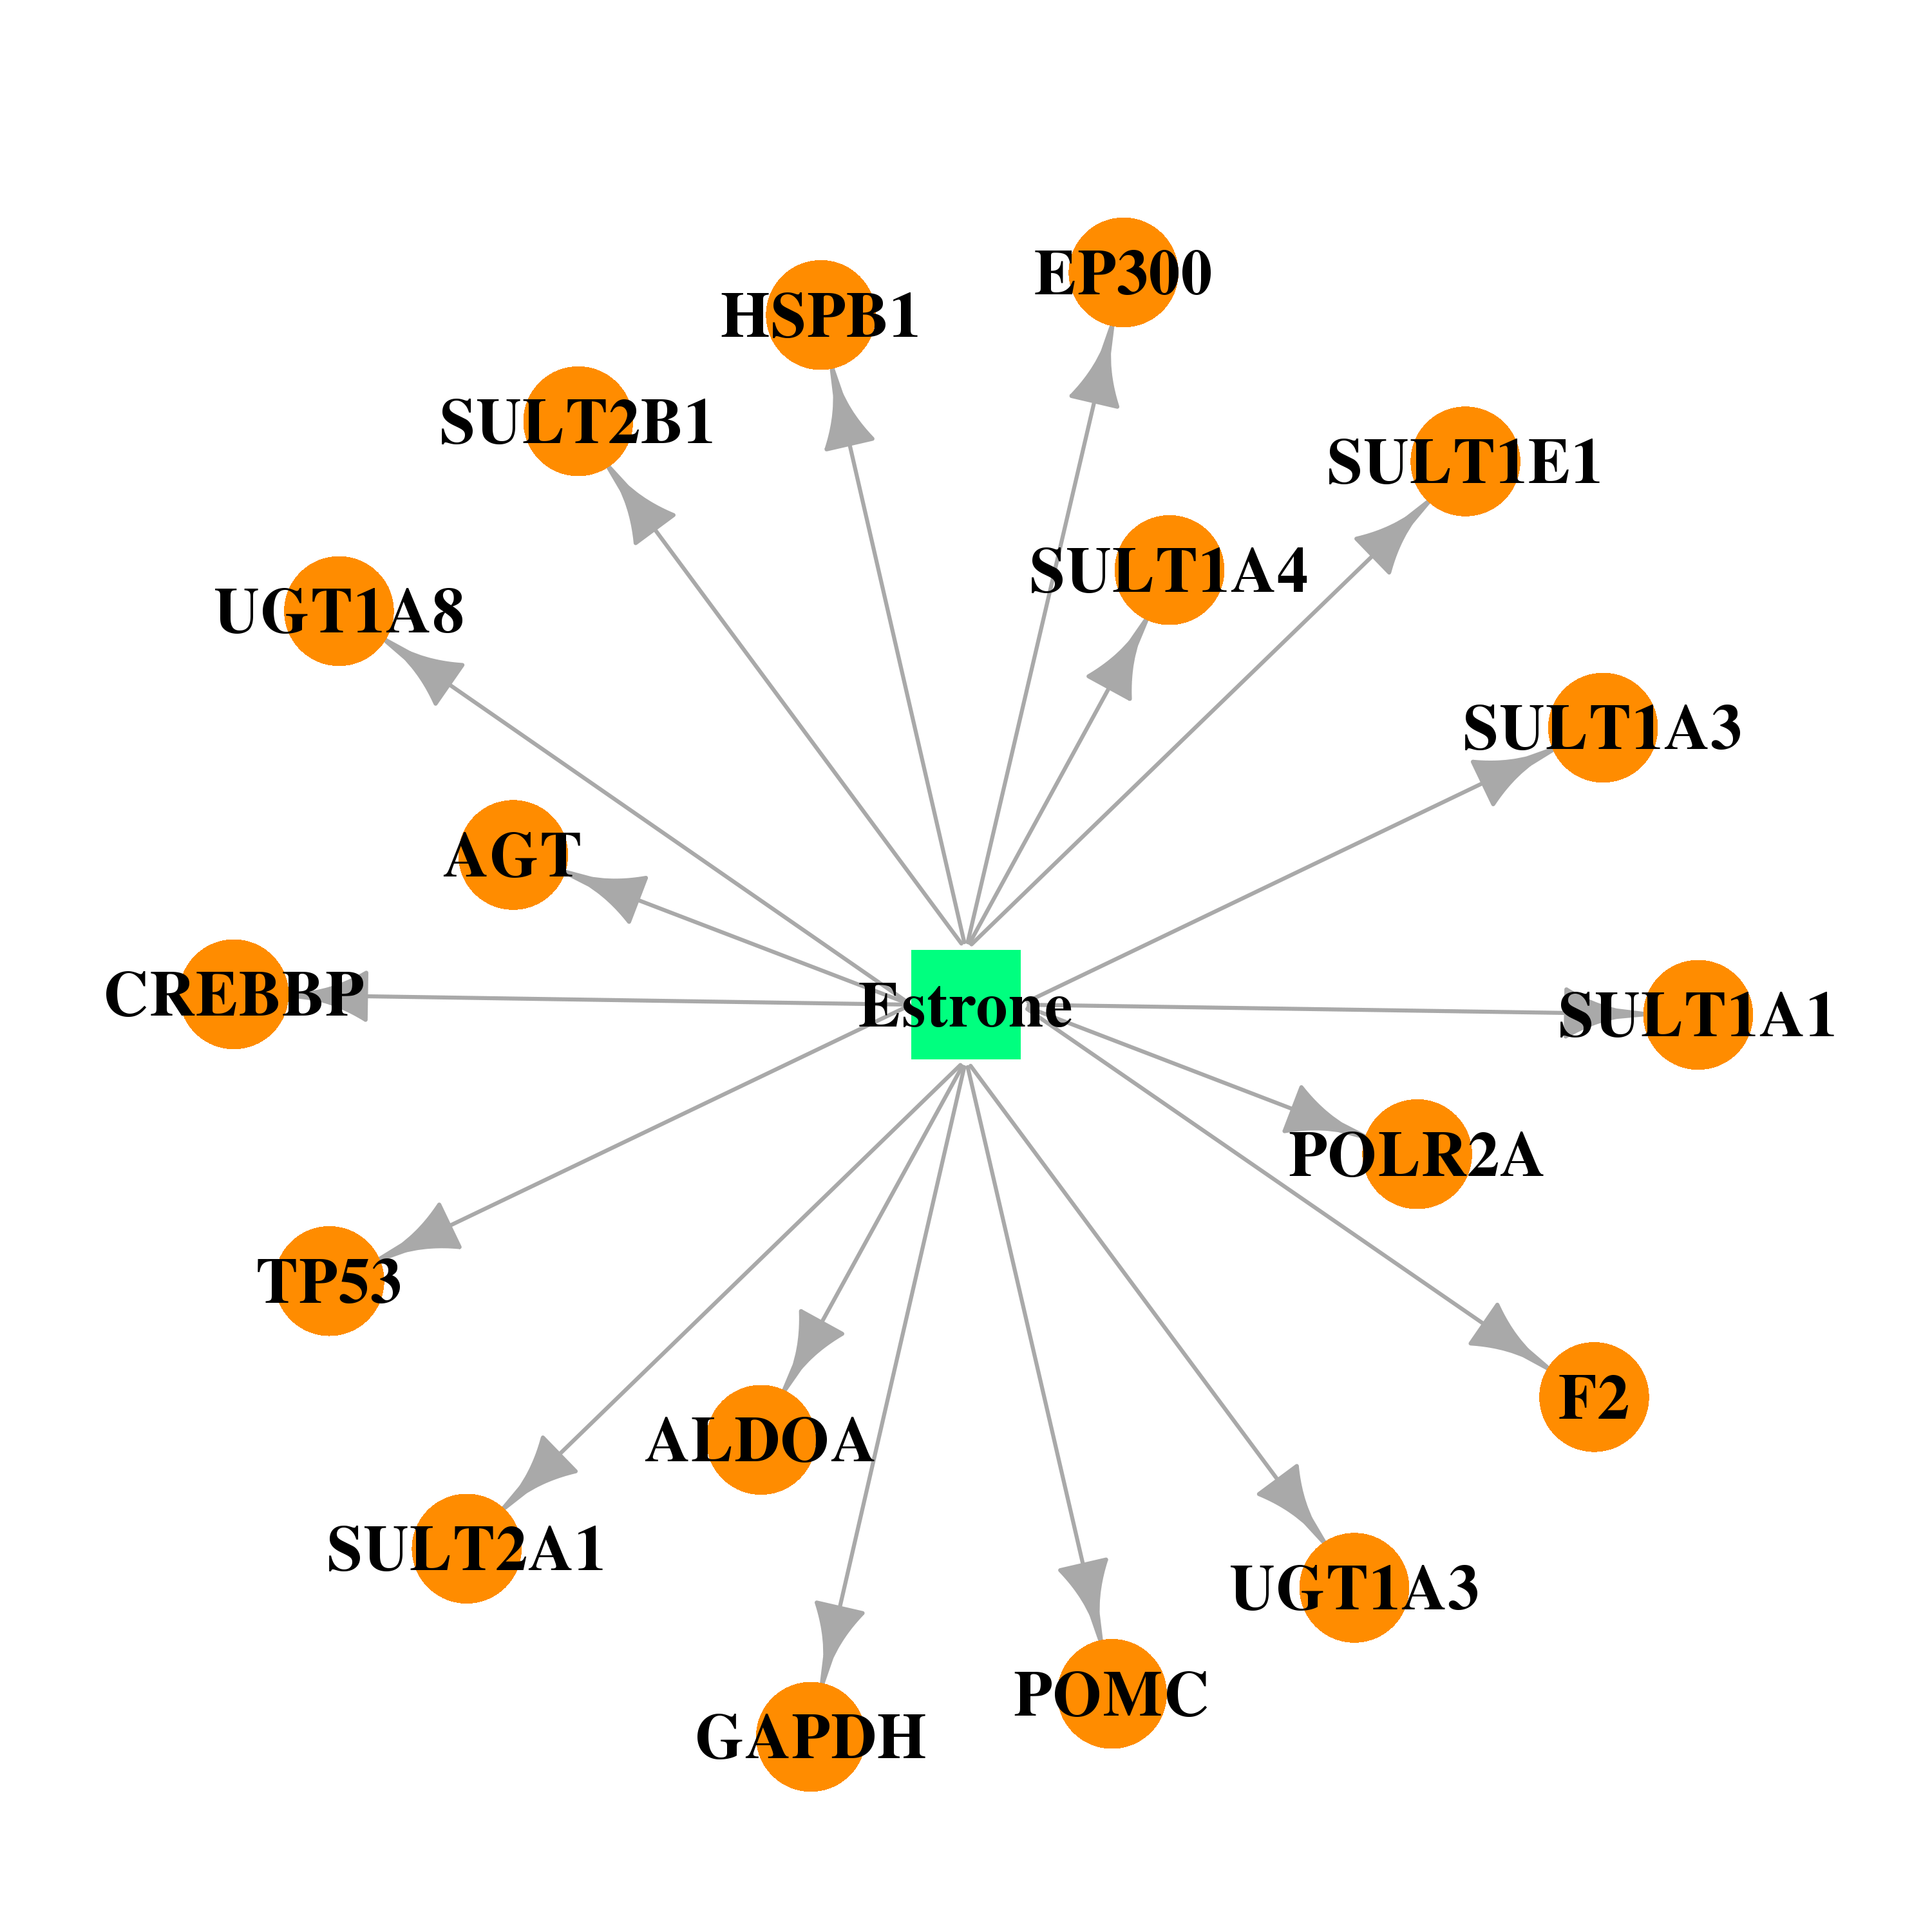 | 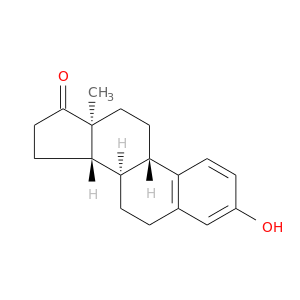 |
| DB00977 | E1A binding protein p300 | approved | Ethinyl Estradiol | 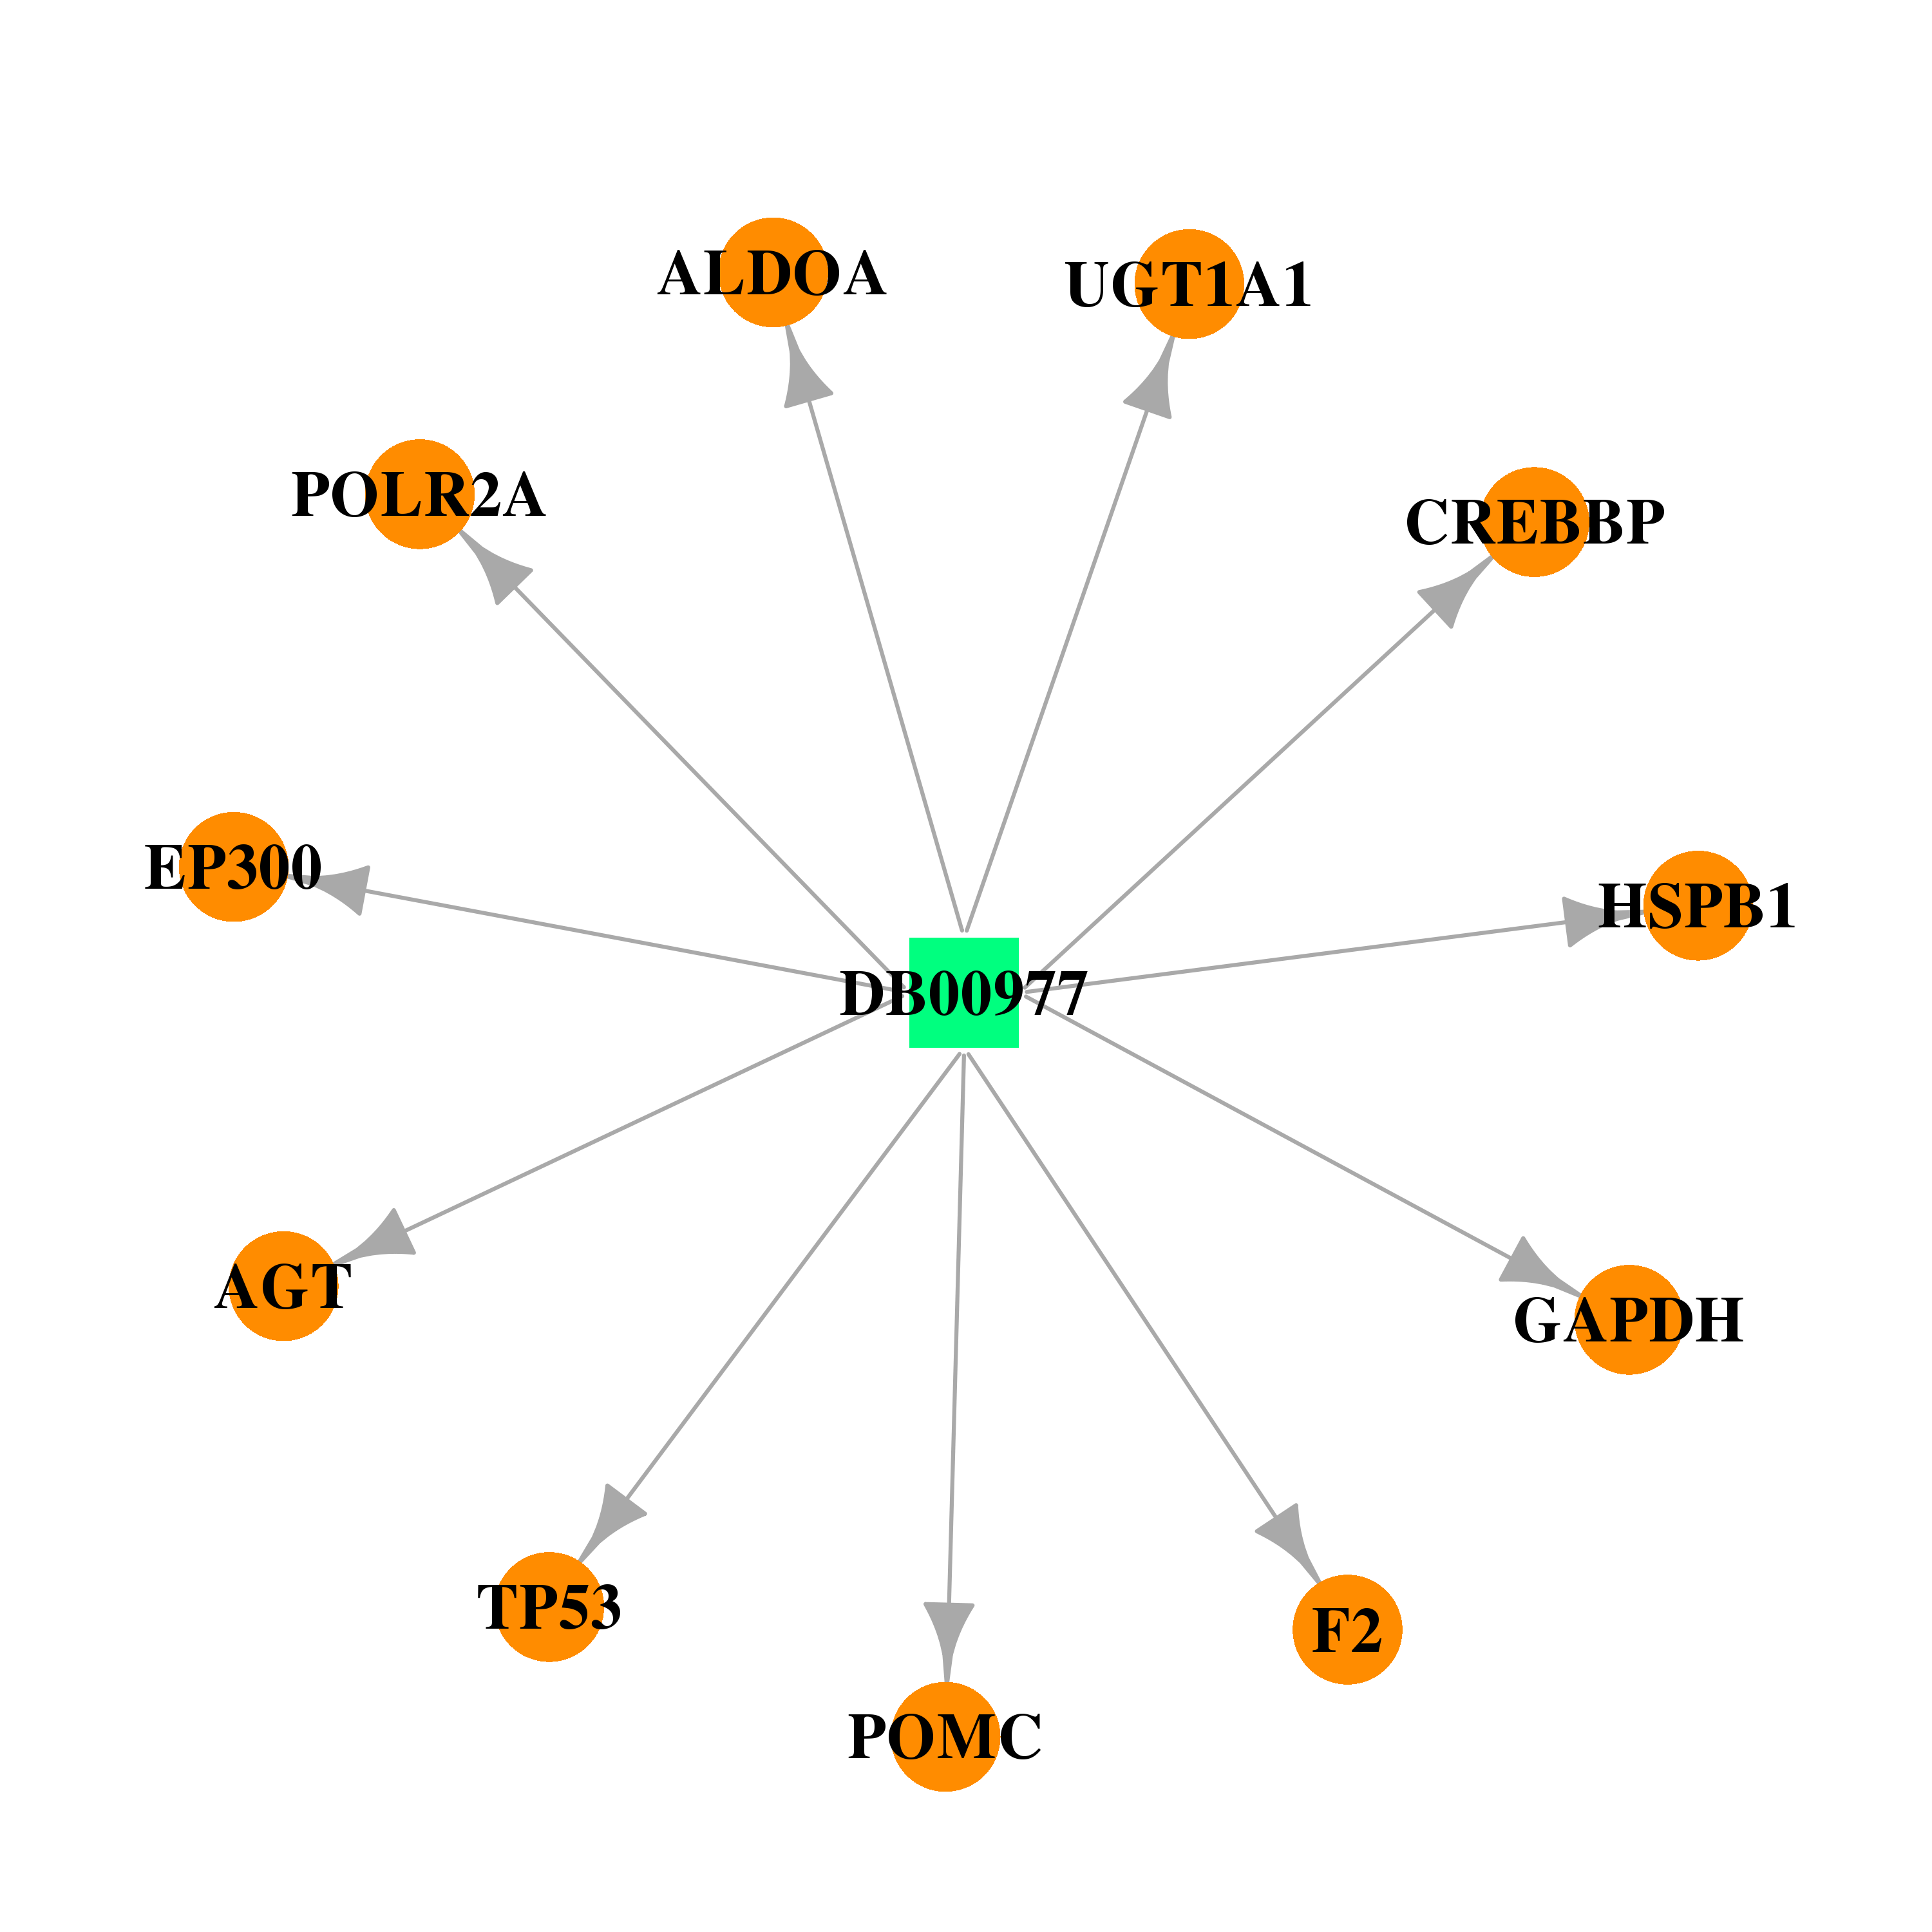 |  |
| Top |
| Cross referenced IDs for EP300 |
| * We obtained these cross-references from Uniprot database. It covers 150 different DBs, 18 categories. http://www.uniprot.org/help/cross_references_section |
: Open all cross reference information
|
Copyright © 2016-Present - The Univsersity of Texas Health Science Center at Houston @ |