|
|||||||||||||||||||||||||||||||||||||||||||||||||||||||||||||||||||||||||||||||||||||||||||||||||||||||||||||||||||||||||||||||||||||||||||||||||||||||||||||||||||||||||||||||||||||||||||||||||||||||||||||||||||||||||||||||||||||||||||||||||||||||||||||||||||||||||||||||||||||||||||||||||||||||||||||||||||||||||||||||||||||||||||||||||||||||||||||||||||||||||||||||||
| |
| Phenotypic Information (metabolism pathway, cancer, disease, phenome) |
| |
| |
| Gene-Gene Network Information: Co-Expression Network, Interacting Genes & KEGG |
| |
|


| Gene Summary for EPHX1 |
| Top |
| Phenotypic Information for EPHX1(metabolism pathway, cancer, disease, phenome) |
| Cancer | CGAP: EPHX1 |
| Familial Cancer Database: EPHX1 | |
| * This gene is included in those cancer gene databases. |
|
|
|
|
|
| . | |||||||||||||||||||||||||||||||||||||||||||||||||||||||||||||||||||||||||||||||||||||||||||||||||||||||||||||||||||||||||||||||||||||||||||||||||||||||||||||||||||||||||||||||||||||||||||||||||||||||||||||||||||||||||||||||||||||||||||||||||||||||||||||||||||||||||||||||||||||||||||||||||||||||||||||||||||||||||||||||||||||||||||||||||||||||||||||||||||||||||||
Oncogene 1 | Significant driver gene in | ||||||||||||||||||||||||||||||||||||||||||||||||||||||||||||||||||||||||||||||||||||||||||||||||||||||||||||||||||||||||||||||||||||||||||||||||||||||||||||||||||||||||||||||||||||||||||||||||||||||||||||||||||||||||||||||||||||||||||||||||||||||||||||||||||||||||||||||||||||||||||||||||||||||||||||||||||||||||||||||||||||||||||||||||||||||||||||||||||||||||||||||||
| cf) number; DB name 1 Oncogene; http://nar.oxfordjournals.org/content/35/suppl_1/D721.long, 2 Tumor Suppressor gene; https://bioinfo.uth.edu/TSGene/, 3 Cancer Gene Census; http://www.nature.com/nrc/journal/v4/n3/abs/nrc1299.html, 4 CancerGenes; http://nar.oxfordjournals.org/content/35/suppl_1/D721.long, 5 Network of Cancer Gene; http://ncg.kcl.ac.uk/index.php, 1Therapeutic Vulnerabilities in Cancer; http://cbio.mskcc.org/cancergenomics/statius/ |
| KEGG_METABOLISM_OF_XENOBIOTICS_BY_CYTOCHROME_P450 | |
| OMIM | |
| Orphanet | |
| Disease | KEGG Disease: EPHX1 |
| MedGen: EPHX1 (Human Medical Genetics with Condition) | |
| ClinVar: EPHX1 | |
| Phenotype | MGI: EPHX1 (International Mouse Phenotyping Consortium) |
| PhenomicDB: EPHX1 | |
| Mutations for EPHX1 |
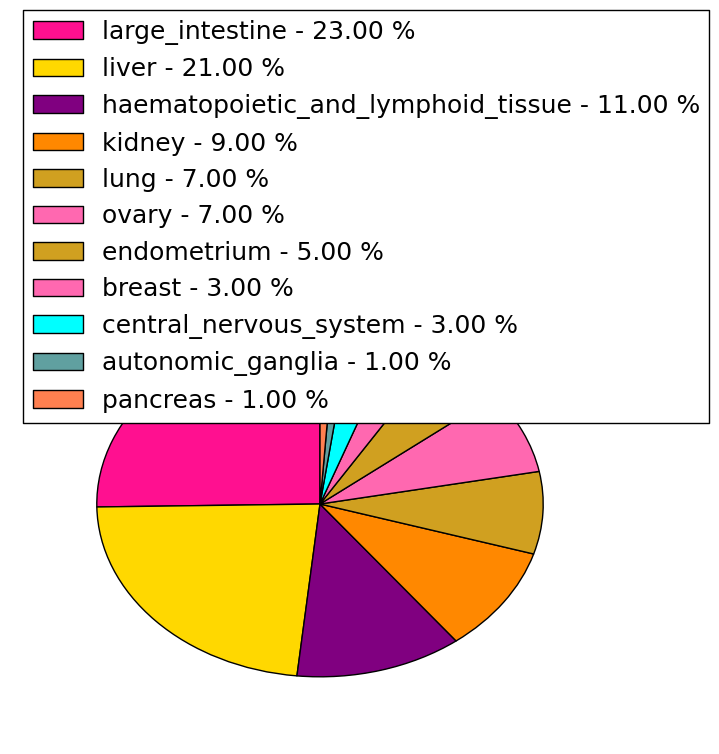
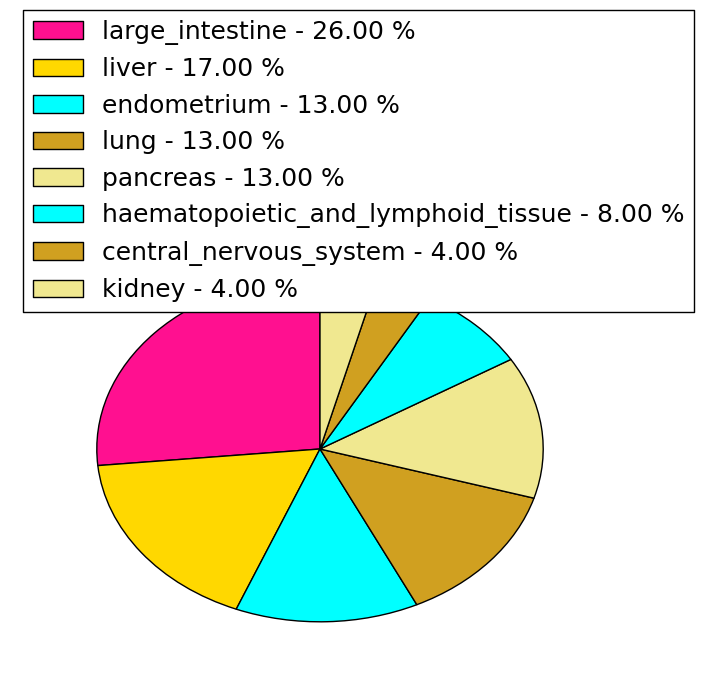
| * Under tables are showing count per each tissue to give us broad intuition about tissue specific mutation patterns.You can go to the detailed page for each mutation database's web site. |
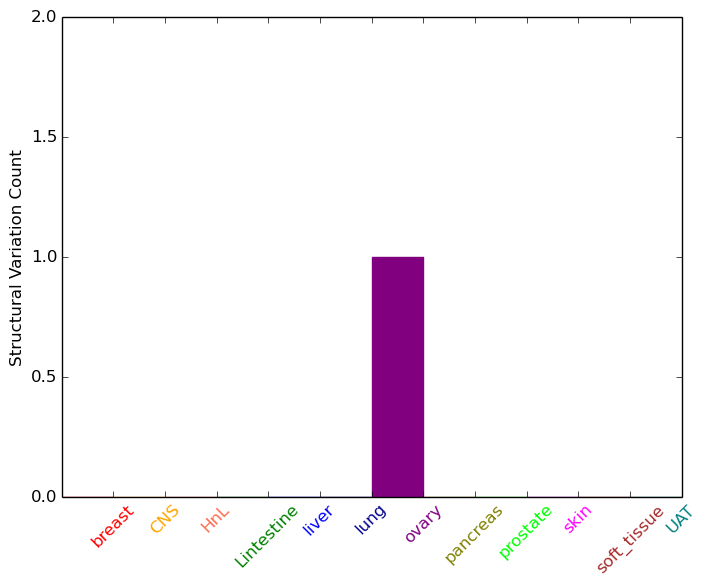
| - Statistics for Tissue and Mutation type | Top |
 |
| - For Inter-chromosomal Variations |
| There's no inter-chromosomal structural variation. |
| - For Intra-chromosomal Variations |
| * Intra-chromosomal variantions includes 'intrachromosomal amplicon to amplicon', 'intrachromosomal amplicon to non-amplified dna', 'intrachromosomal deletion', 'intrachromosomal fold-back inversion', 'intrachromosomal inversion', 'intrachromosomal tandem duplication', 'Intrachromosomal unknown type', 'intrachromosomal with inverted orientation', 'intrachromosomal with non-inverted orientation'. |
 |
| Sample | Symbol_a | Chr_a | Start_a | End_a | Symbol_b | Chr_b | Start_b | End_b |
| ovary | EPHX1 | chr1 | 226032830 | 226032850 | SRP9 | chr1 | 225978033 | 225978053 |
| cf) Tissue number; Tissue name (1;Breast, 2;Central_nervous_system, 3;Haematopoietic_and_lymphoid_tissue, 4;Large_intestine, 5;Liver, 6;Lung, 7;Ovary, 8;Pancreas, 9;Prostate, 10;Skin, 11;Soft_tissue, 12;Upper_aerodigestive_tract) |
| * From mRNA Sanger sequences, Chitars2.0 arranged chimeric transcripts. This table shows EPHX1 related fusion information. |
| ID | Head Gene | Tail Gene | Accession | Gene_a | qStart_a | qEnd_a | Chromosome_a | tStart_a | tEnd_a | Gene_a | qStart_a | qEnd_a | Chromosome_a | tStart_a | tEnd_a |
| AI636871 | C6orf47 | 8 | 344 | 6 | 2956910 | 2957246 | EPHX1 | 340 | 455 | 1 | 226026353 | 226026468 | |
| AW261826 | PHGDH | 19 | 400 | 1 | 120285616 | 120286838 | EPHX1 | 395 | 553 | 1 | 226016559 | 226019583 | |
| BE613010 | RPL11 | 14 | 96 | 1 | 24020323 | 24020406 | EPHX1 | 97 | 687 | 1 | 226027547 | 226033006 | |
| AI933022 | EPHX1 | 1 | 180 | 1 | 226033081 | 226033260 | JPH3 | 176 | 452 | 16 | 87731017 | 87731294 | |
| BF513447 | HNRNPH3 | 15 | 299 | 10 | 70101743 | 70102028 | EPHX1 | 299 | 349 | 1 | 226033214 | 226033264 | |
| Top |
| Mutation type/ Tissue ID | brca | cns | cerv | endome | haematopo | kidn | Lintest | liver | lung | ns | ovary | pancre | prost | skin | stoma | thyro | urina | |||
| Total # sample | 1 | 1 | ||||||||||||||||||
| GAIN (# sample) | 1 | 1 | ||||||||||||||||||
| LOSS (# sample) |
| cf) Tissue ID; Tissue type (1; Breast, 2; Central_nervous_system, 3; Cervix, 4; Endometrium, 5; Haematopoietic_and_lymphoid_tissue, 6; Kidney, 7; Large_intestine, 8; Liver, 9; Lung, 10; NS, 11; Ovary, 12; Pancreas, 13; Prostate, 14; Skin, 15; Stomach, 16; Thyroid, 17; Urinary_tract) |
| Top |
|
 |
| Top |
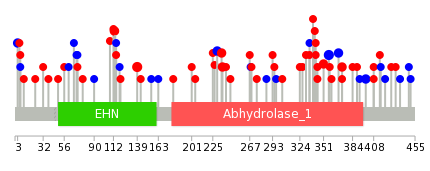
| Stat. for Non-Synonymous SNVs (# total SNVs=51) | (# total SNVs=23) |
 |  |
(# total SNVs=3) | (# total SNVs=2) |
 |  |
| Top |
| * When you move the cursor on each content, you can see more deailed mutation information on the Tooltip. Those are primary_site,primary_histology,mutation(aa),pubmedID. |
| GRCh37 position | Mutation(aa) | Unique sampleID count |
| chr1:226032229-226032229 | p.N357N | 3 |
| chr1:226026406-226026406 | p.H139R | 3 |
| chr1:226032877-226032877 | p.S399S | 2 |
| chr1:226032209-226032209 | p.L351M | 2 |
| chr1:226032903-226032903 | p.T408M | 2 |
| chr1:226032262-226032262 | p.I368I | 2 |
| chr1:226027015-226027015 | p.L230L | 2 |
| chr1:226027028-226027028 | p.M235L | 2 |
| chr1:226032273-226032273 | p.R372P | 2 |
| chr1:226027031-226027031 | p.A236T | 2 |
| Top |
|
 |
| Point Mutation/ Tissue ID | 1 | 2 | 3 | 4 | 5 | 6 | 7 | 8 | 9 | 10 | 11 | 12 | 13 | 14 | 15 | 16 | 17 | 18 | 19 | 20 |
| # sample | 1 | 9 | 2 | 2 | 1 | 5 | 5 | 1 | 3 | 7 | 4 | 4 | ||||||||
| # mutation | 1 | 9 | 2 | 2 | 1 | 5 | 5 | 1 | 3 | 7 | 4 | 5 | ||||||||
| nonsynonymous SNV | 1 | 7 | 1 | 1 | 1 | 4 | 4 | 3 | 2 | 3 | 2 | |||||||||
| synonymous SNV | 2 | 1 | 1 | 1 | 1 | 1 | 5 | 1 | 3 |
| cf) Tissue ID; Tissue type (1; BLCA[Bladder Urothelial Carcinoma], 2; BRCA[Breast invasive carcinoma], 3; CESC[Cervical squamous cell carcinoma and endocervical adenocarcinoma], 4; COAD[Colon adenocarcinoma], 5; GBM[Glioblastoma multiforme], 6; Glioma Low Grade, 7; HNSC[Head and Neck squamous cell carcinoma], 8; KICH[Kidney Chromophobe], 9; KIRC[Kidney renal clear cell carcinoma], 10; KIRP[Kidney renal papillary cell carcinoma], 11; LAML[Acute Myeloid Leukemia], 12; LUAD[Lung adenocarcinoma], 13; LUSC[Lung squamous cell carcinoma], 14; OV[Ovarian serous cystadenocarcinoma ], 15; PAAD[Pancreatic adenocarcinoma], 16; PRAD[Prostate adenocarcinoma], 17; SKCM[Skin Cutaneous Melanoma], 18:STAD[Stomach adenocarcinoma], 19:THCA[Thyroid carcinoma], 20:UCEC[Uterine Corpus Endometrial Carcinoma]) |
| Top |
| * We represented just top 10 SNVs. When you move the cursor on each content, you can see more deailed mutation information on the Tooltip. Those are primary_site, primary_histology, mutation(aa), pubmedID. |
| Genomic Position | Mutation(aa) | Unique sampleID count |
| chr1:226032903 | p.F268F,EPHX1 | 2 |
| chr1:226027611 | p.T408K,EPHX1 | 2 |
| chr1:226027691 | p.F70F,EPHX1 | 1 |
| chr1:226016576 | p.K286K,EPHX1 | 1 |
| chr1:226026966 | p.I421I,EPHX1 | 1 |
| chr1:226027718 | p.R71R,EPHX1 | 1 |
| chr1:226019497 | p.Y291H,EPHX1 | 1 |
| chr1:226032925 | p.R428H,EPHX1 | 1 |
| chr1:226027015 | p.H115H,EPHX1 | 1 |
| chr1:226030115 | p.L293P,EPHX1 | 1 |
| * Copy number data were extracted from TCGA using R package TCGA-Assembler. The URLs of all public data files on TCGA DCC data server were gathered on Jan-05-2015. Function ProcessCNAData in TCGA-Assembler package was used to obtain gene-level copy number value which is calculated as the average copy number of the genomic region of a gene. |
 |
| cf) Tissue ID[Tissue type]: BLCA[Bladder Urothelial Carcinoma], BRCA[Breast invasive carcinoma], CESC[Cervical squamous cell carcinoma and endocervical adenocarcinoma], COAD[Colon adenocarcinoma], GBM[Glioblastoma multiforme], Glioma Low Grade, HNSC[Head and Neck squamous cell carcinoma], KICH[Kidney Chromophobe], KIRC[Kidney renal clear cell carcinoma], KIRP[Kidney renal papillary cell carcinoma], LAML[Acute Myeloid Leukemia], LUAD[Lung adenocarcinoma], LUSC[Lung squamous cell carcinoma], OV[Ovarian serous cystadenocarcinoma ], PAAD[Pancreatic adenocarcinoma], PRAD[Prostate adenocarcinoma], SKCM[Skin Cutaneous Melanoma], STAD[Stomach adenocarcinoma], THCA[Thyroid carcinoma], UCEC[Uterine Corpus Endometrial Carcinoma] |
| Top |
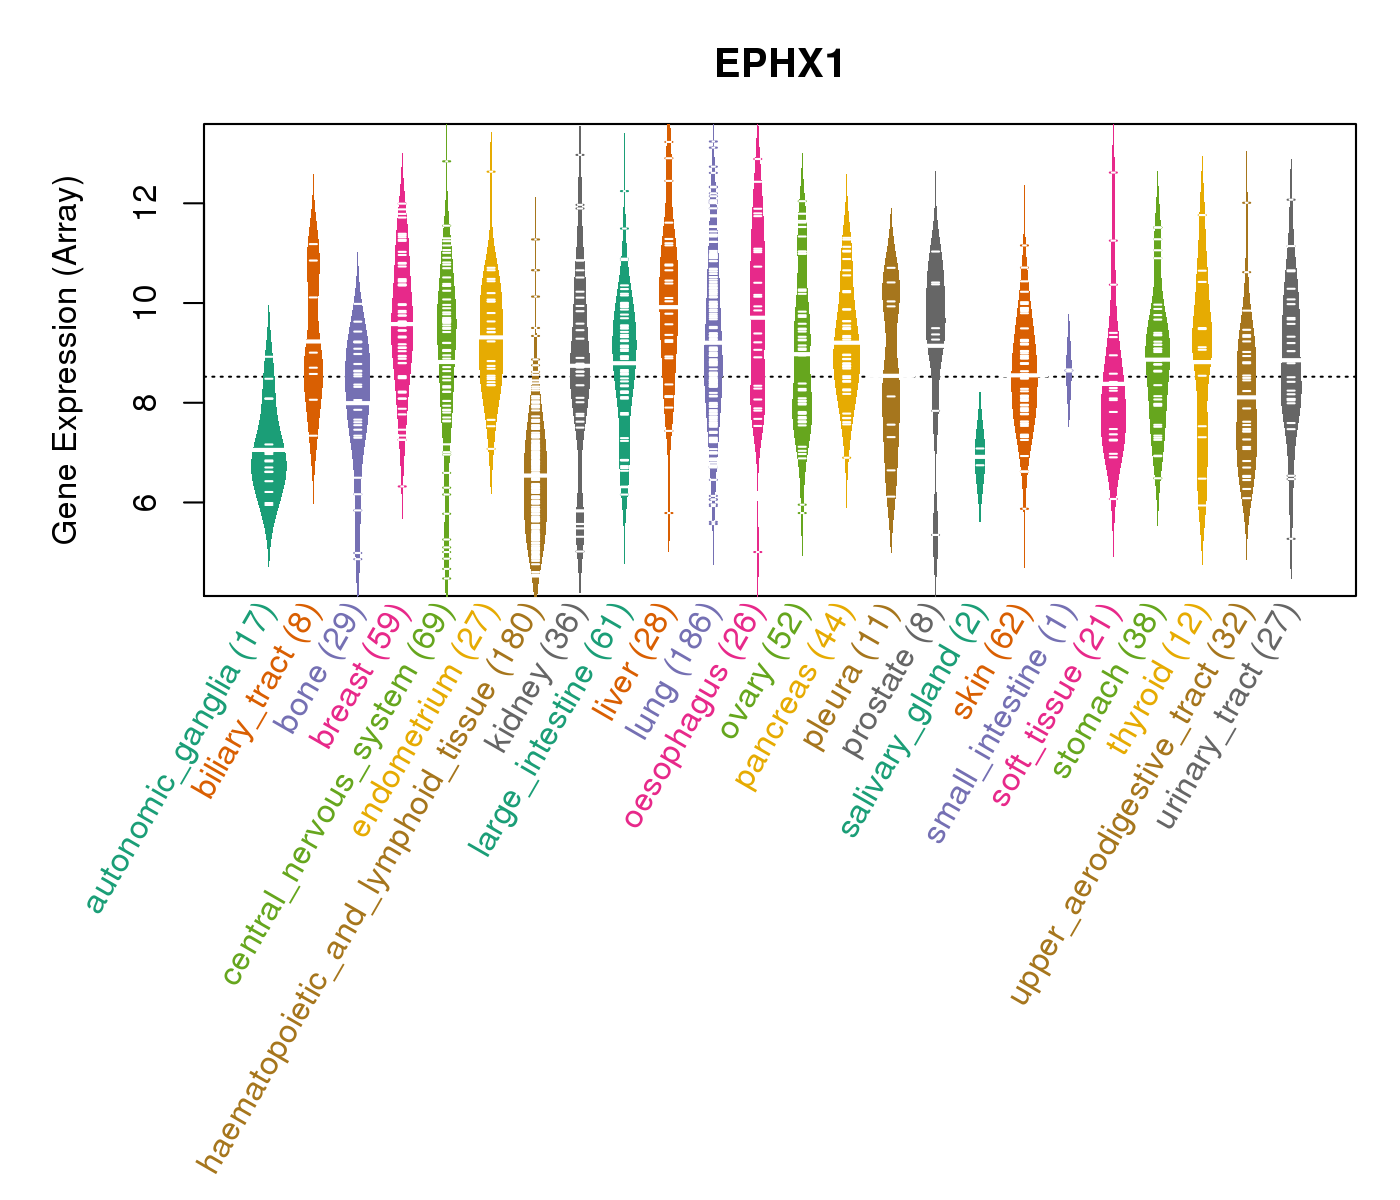
| Gene Expression for EPHX1 |
| * CCLE gene expression data were extracted from CCLE_Expression_Entrez_2012-10-18.res: Gene-centric RMA-normalized mRNA expression data. |
 |
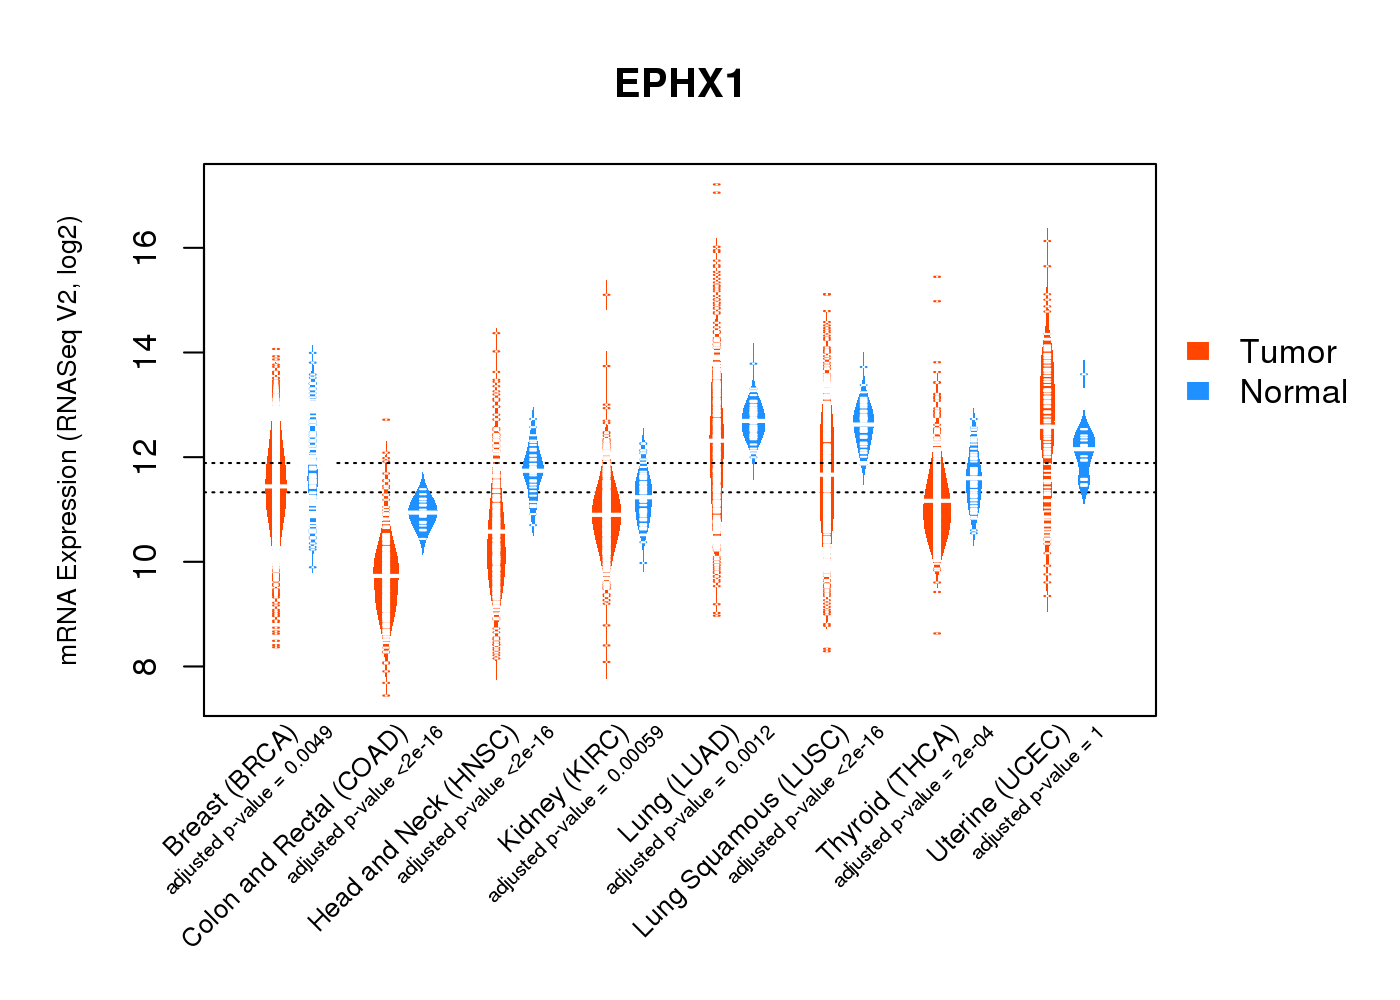
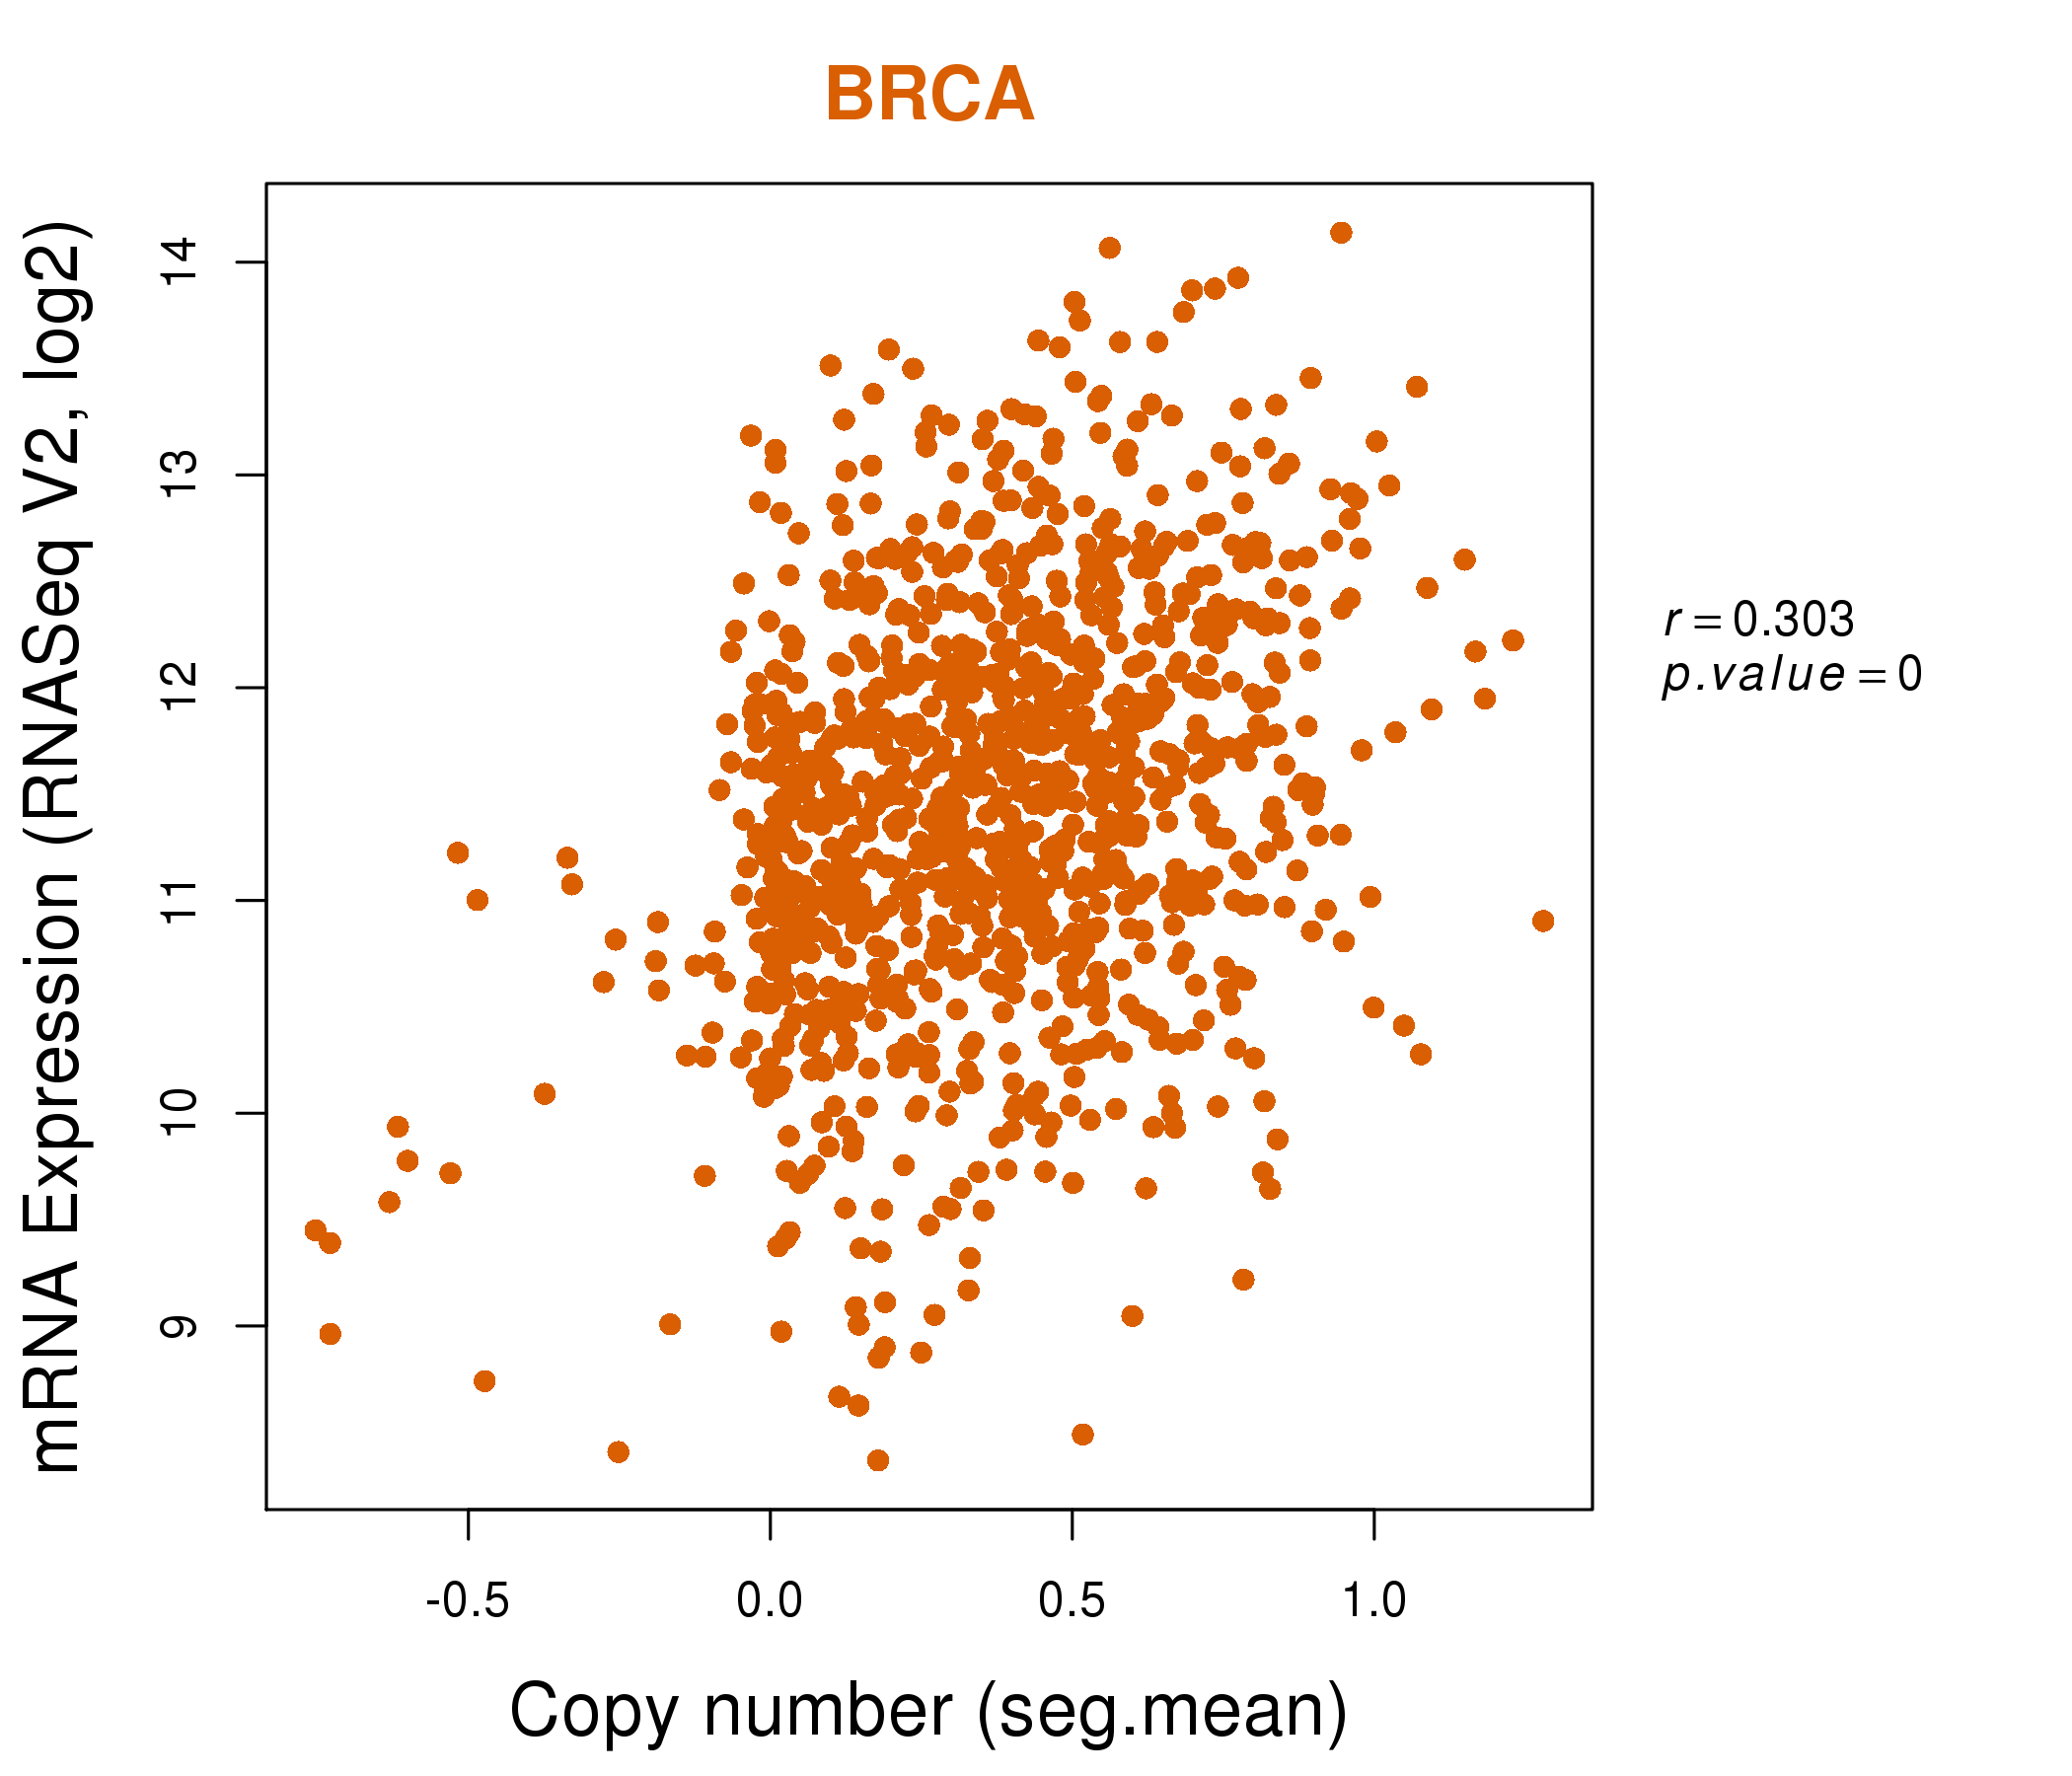
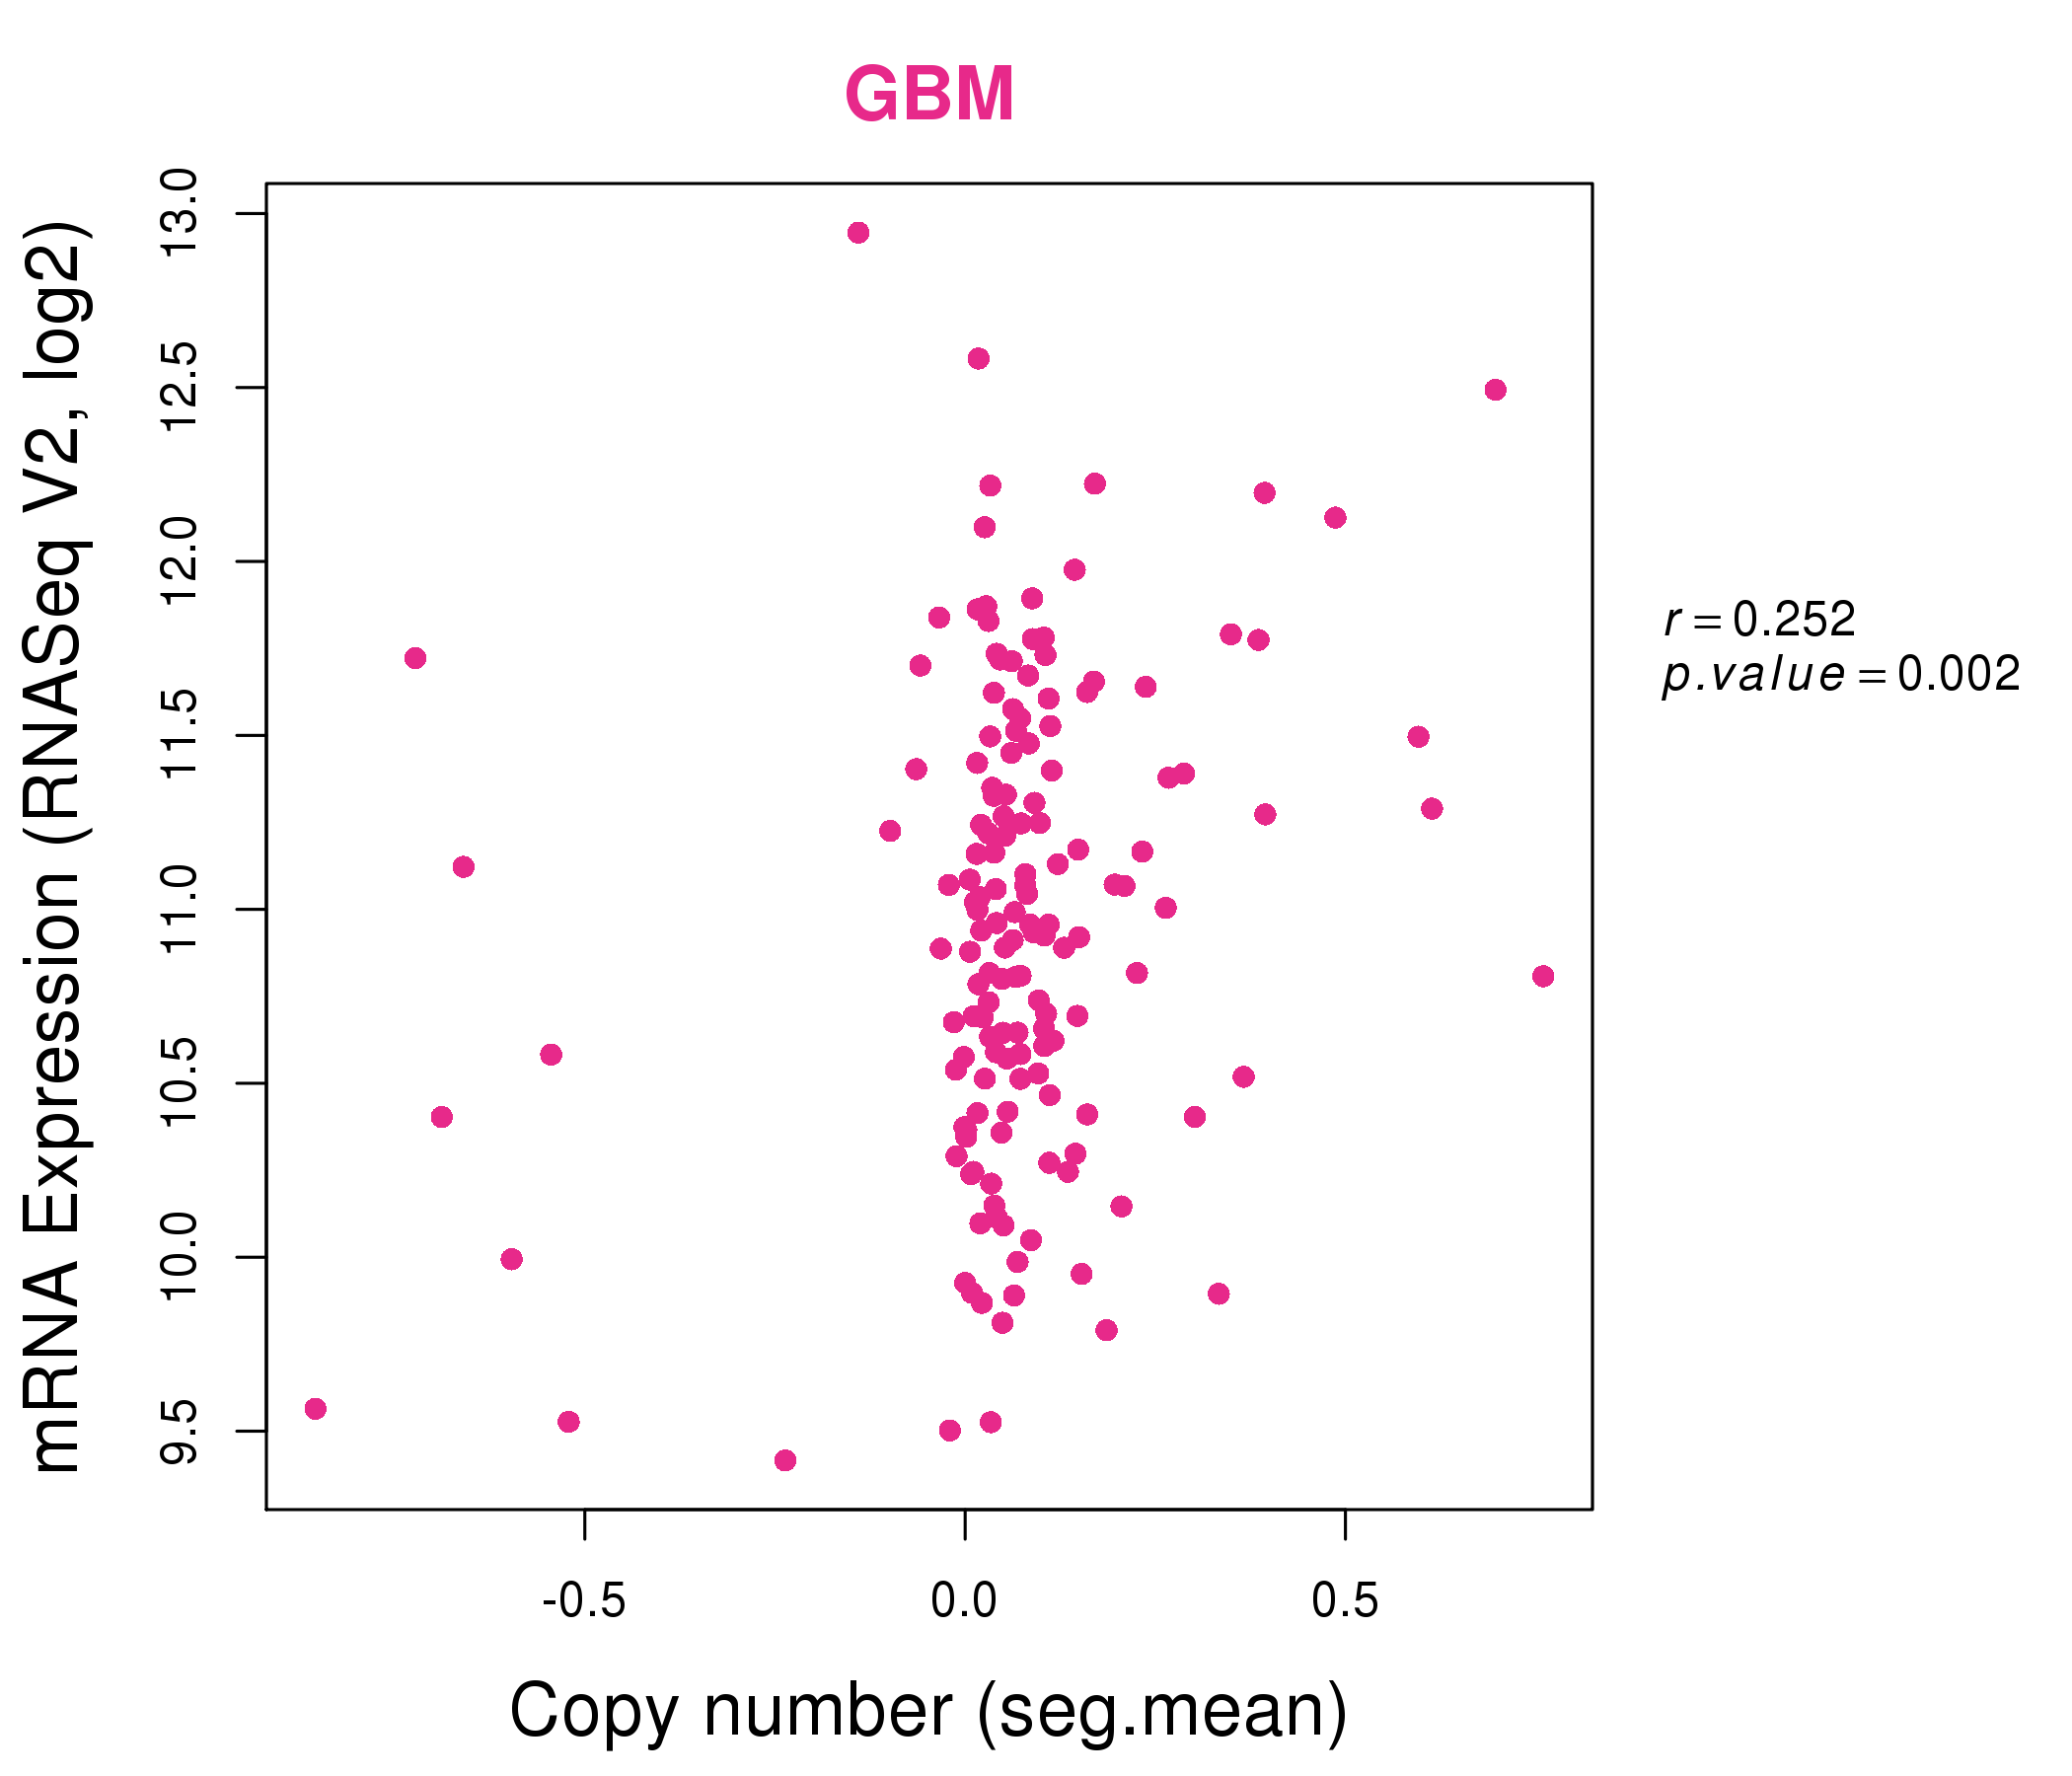
| * Normalized gene expression data of RNASeqV2 was extracted from TCGA using R package TCGA-Assembler. The URLs of all public data files on TCGA DCC data server were gathered at Jan-05-2015. Only eight cancer types have enough normal control samples for differential expression analysis. (t test, adjusted p<0.05 (using Benjamini-Hochberg FDR)) |
 |
| Top |
| * This plots show the correlation between CNV and gene expression. |
: Open all plots for all cancer types
 |
|
 |
|
| Top |
| Gene-Gene Network Information |
| * Co-Expression network figures were drawn using R package igraph. Only the top 20 genes with the highest correlations were shown. Red circle: input gene, orange circle: cell metabolism gene, sky circle: other gene |
: Open all plots for all cancer types
 |
| ||||
| ARF1,ARV1,CD63,EPHX1,LYPLAL1,MFSD5,MRPL55, NANS,NDUFB1,ORMDL2,PRR13,PYCR2,SLC50A1,RNF187, LAMTOR2,SELENBP1,SQSTM1,SRA1,SRP9,TMEM9,UQCRQ | AIFM2,AKR1C3,AOC3,BTD,CALB2,CPNE2,EHD2, EPHX1,FADS3,GPD1,ITGB1BP1,ITPK1,MCAM,MGLL, MRAS,RETSAT,SERPINF1,TFE3,TK2,VEGFB,VTI1B | ||||
 |
| ||||
| BMP7,CCDC115,CST7,CTNNA2,CYB5R1,DDIT4L,EPHX1, GLP1R,HOTAIR,HOXC12,HRNR,HSPA12A,KIAA0087,LOC92973, MME,NEURL3,OR13J1,PROM2,RGSL1,RPLP0P2,SMYD3 | ABHD4,ATPAF1,BTBD2,NATD1,CDIPT,DBNDD1,EEF2, EPHX1,FOXO4,GLTSCR2,HDAC11,HDAC5,KCNJ12,KIAA1107, MYLIP,PGBD3,RNF208,SORBS3,WDTC1,WIPI2,ZNF395 |
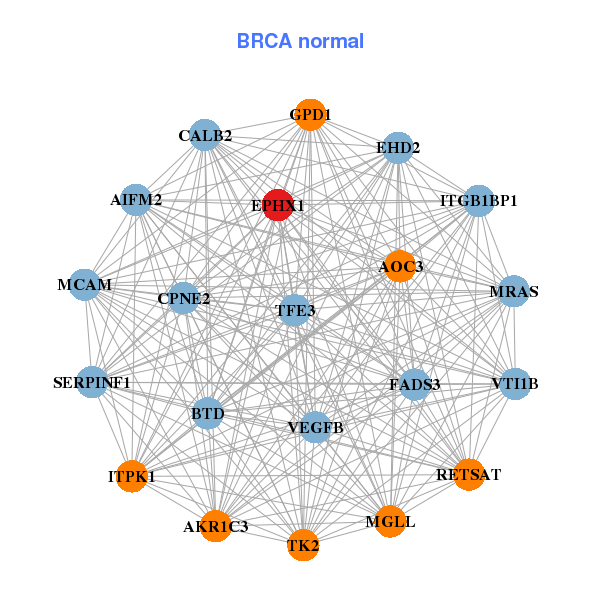

| * Co-Expression network figures were drawn using R package igraph. Only the top 20 genes with the highest correlations were shown. Red circle: input gene, orange circle: cell metabolism gene, sky circle: other gene |
: Open all plots for all cancer types
| Top |
: Open all interacting genes' information including KEGG pathway for all interacting genes from DAVID
| Top |
| Pharmacological Information for EPHX1 |
| DB Category | DB Name | DB's ID and Url link |
| * Gene Centered Interaction Network. |
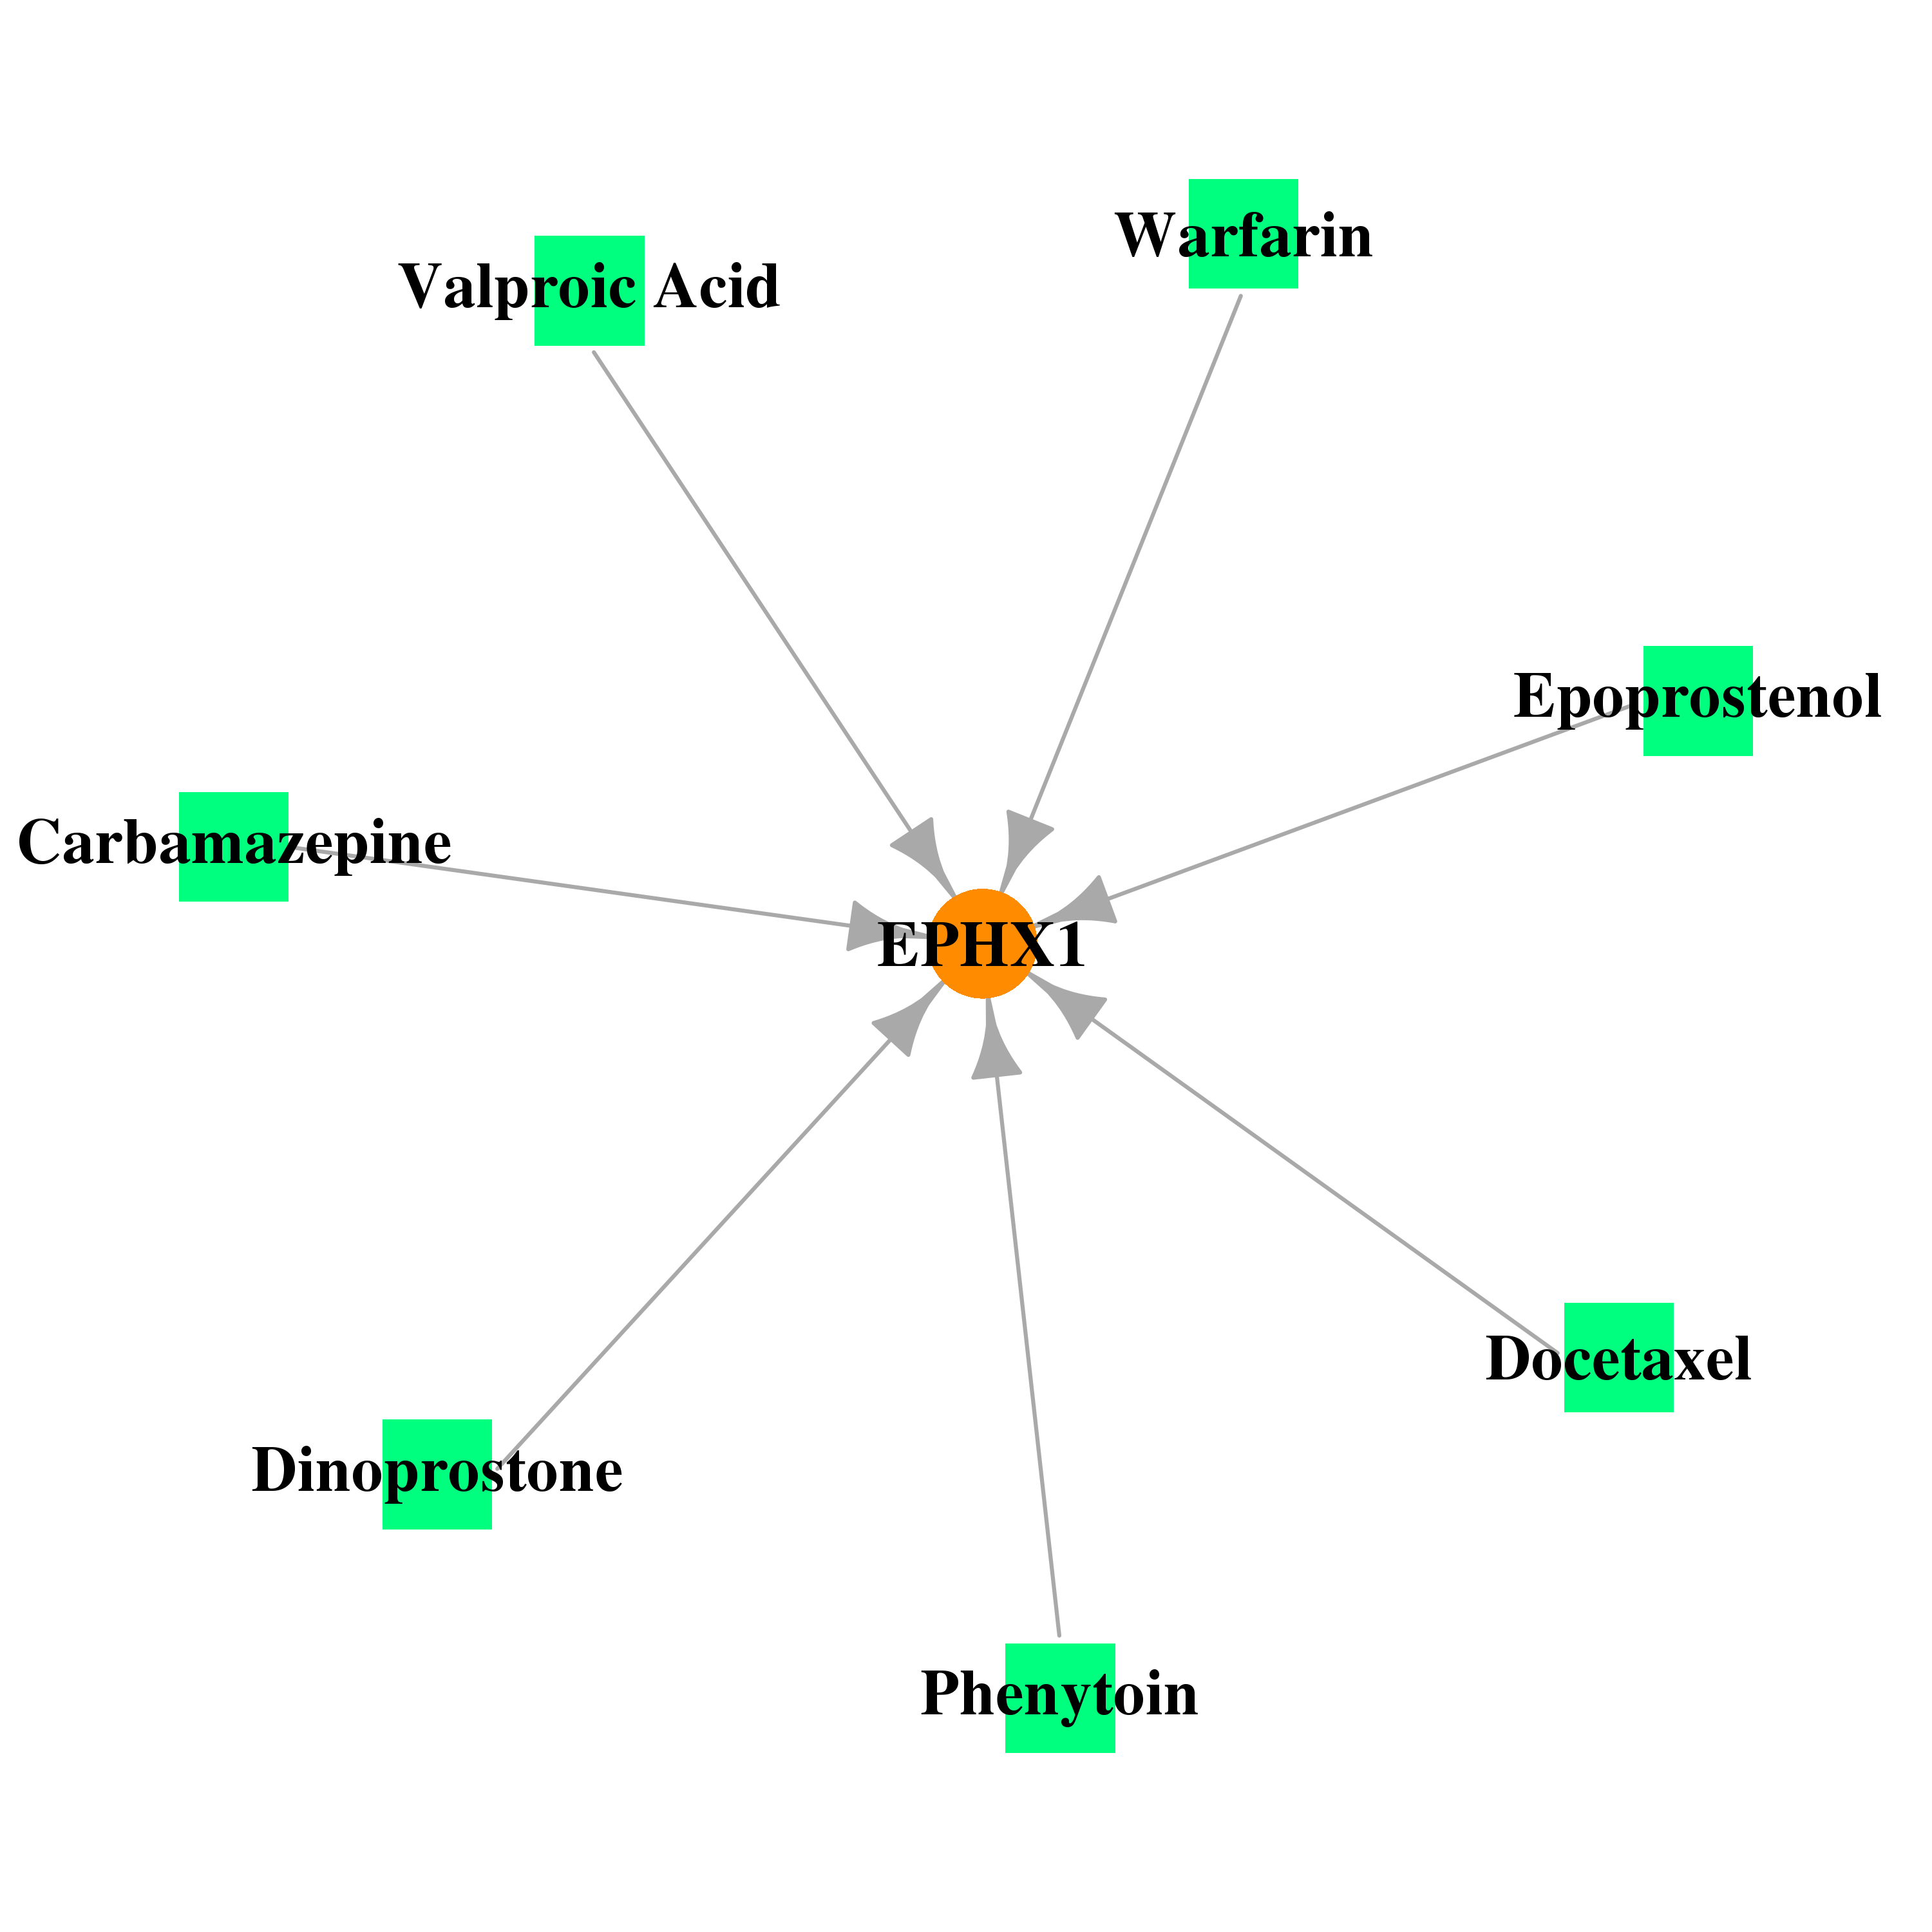 |
| * Drug Centered Interaction Network. |
| DrugBank ID | Target Name | Drug Groups | Generic Name | Drug Centered Network | Drug Structure |
| DB00252 | epoxide hydrolase 1, microsomal (xenobiotic) | approved | Phenytoin | 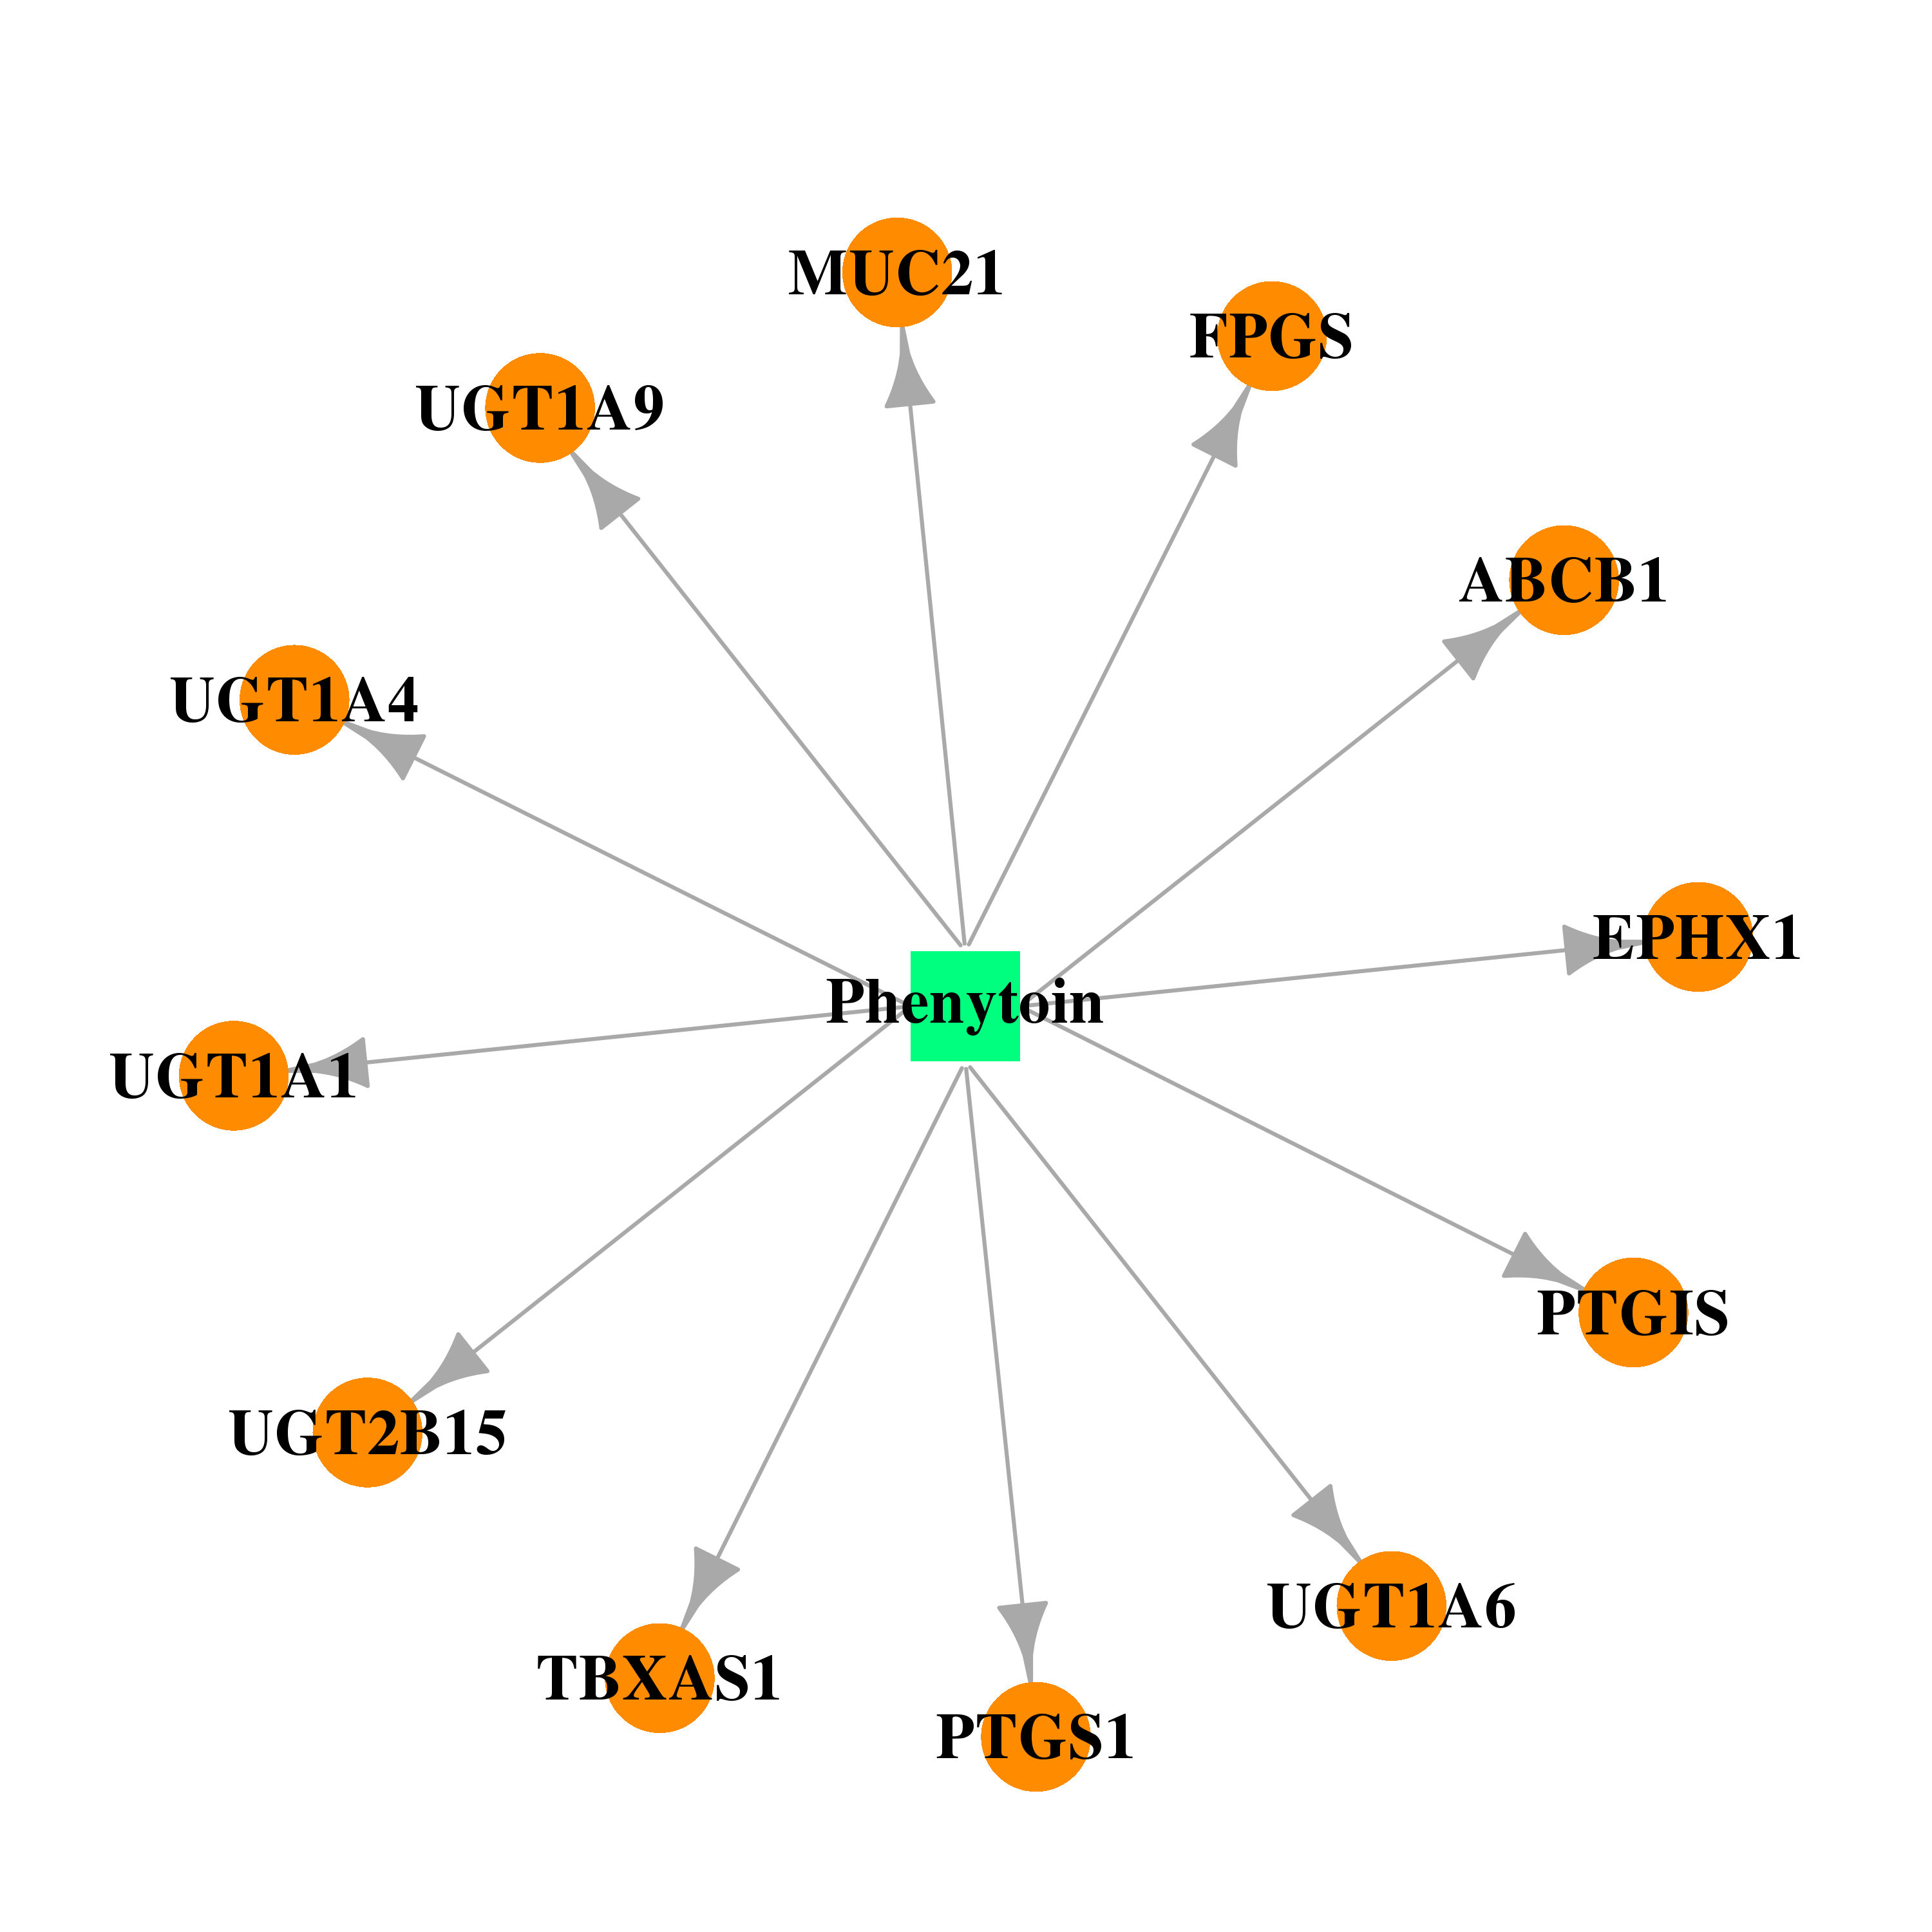 | 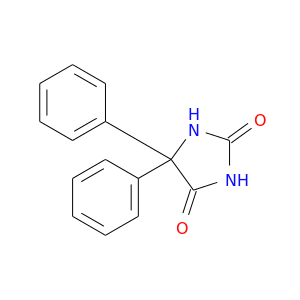 |
| DB01248 | epoxide hydrolase 1, microsomal (xenobiotic) | approved; investigational | Docetaxel | 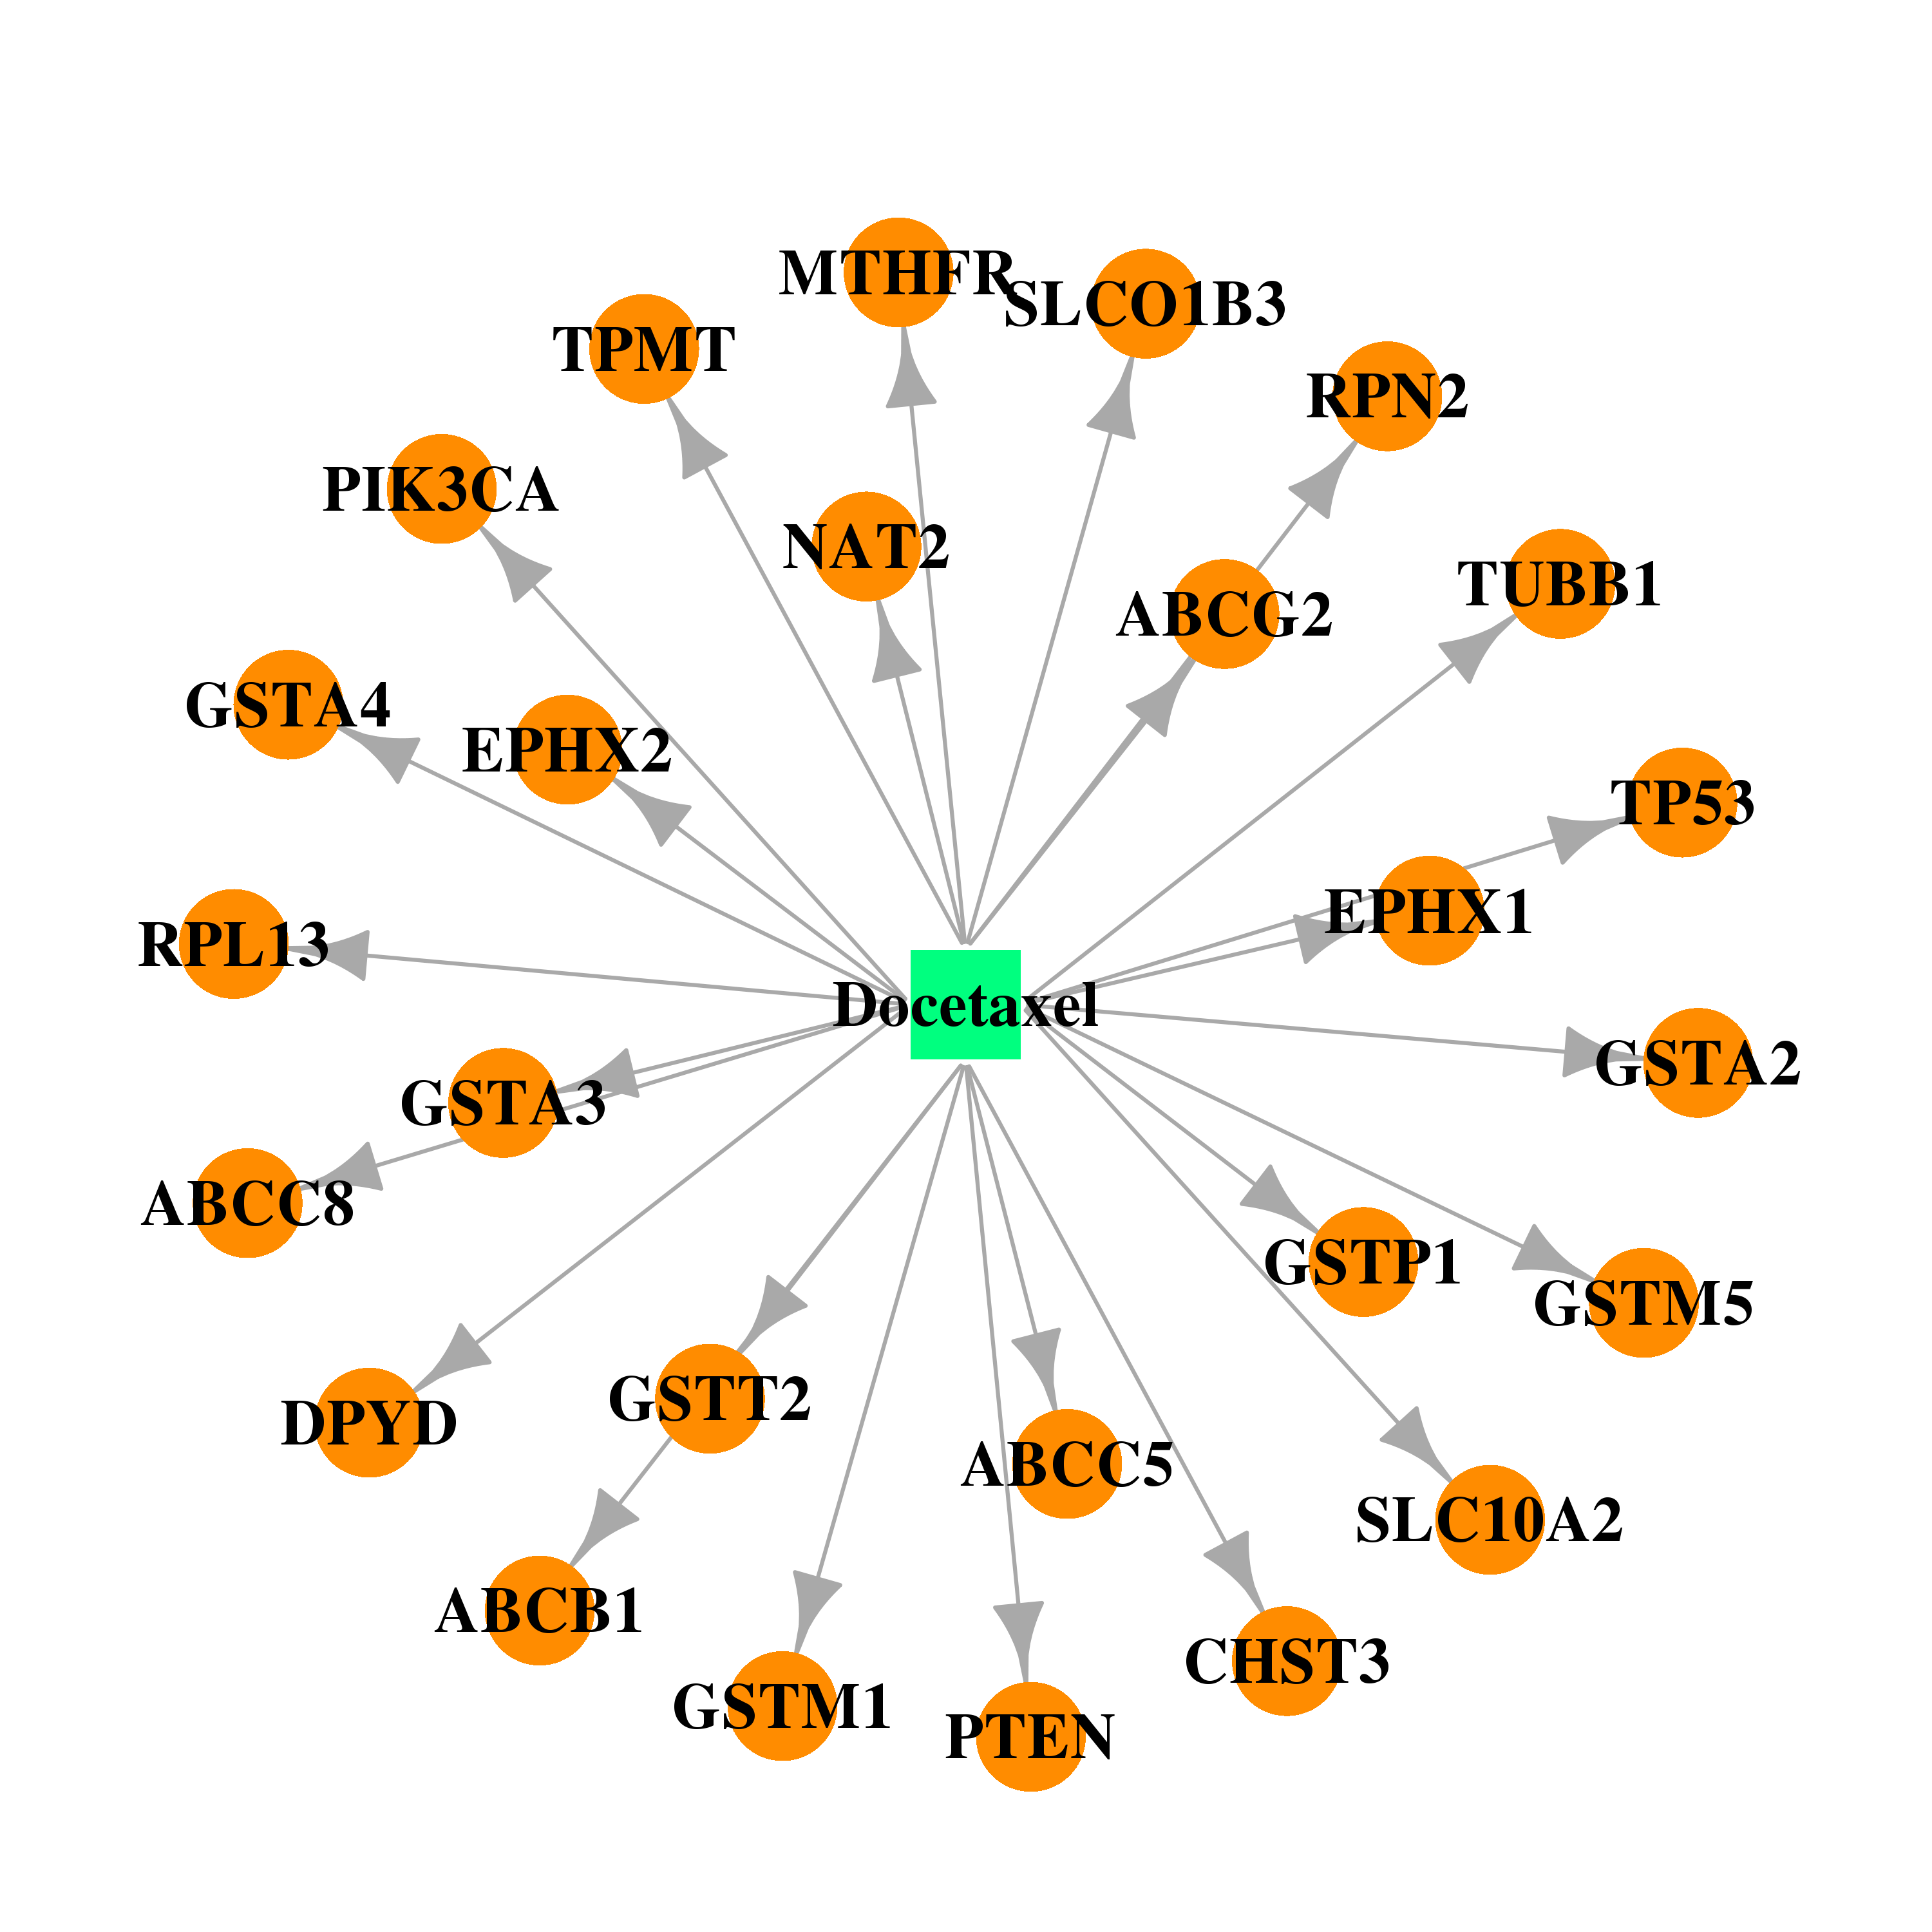 | 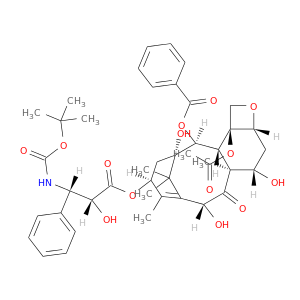 |
| DB00564 | epoxide hydrolase 1, microsomal (xenobiotic) | approved; investigational | Carbamazepine | 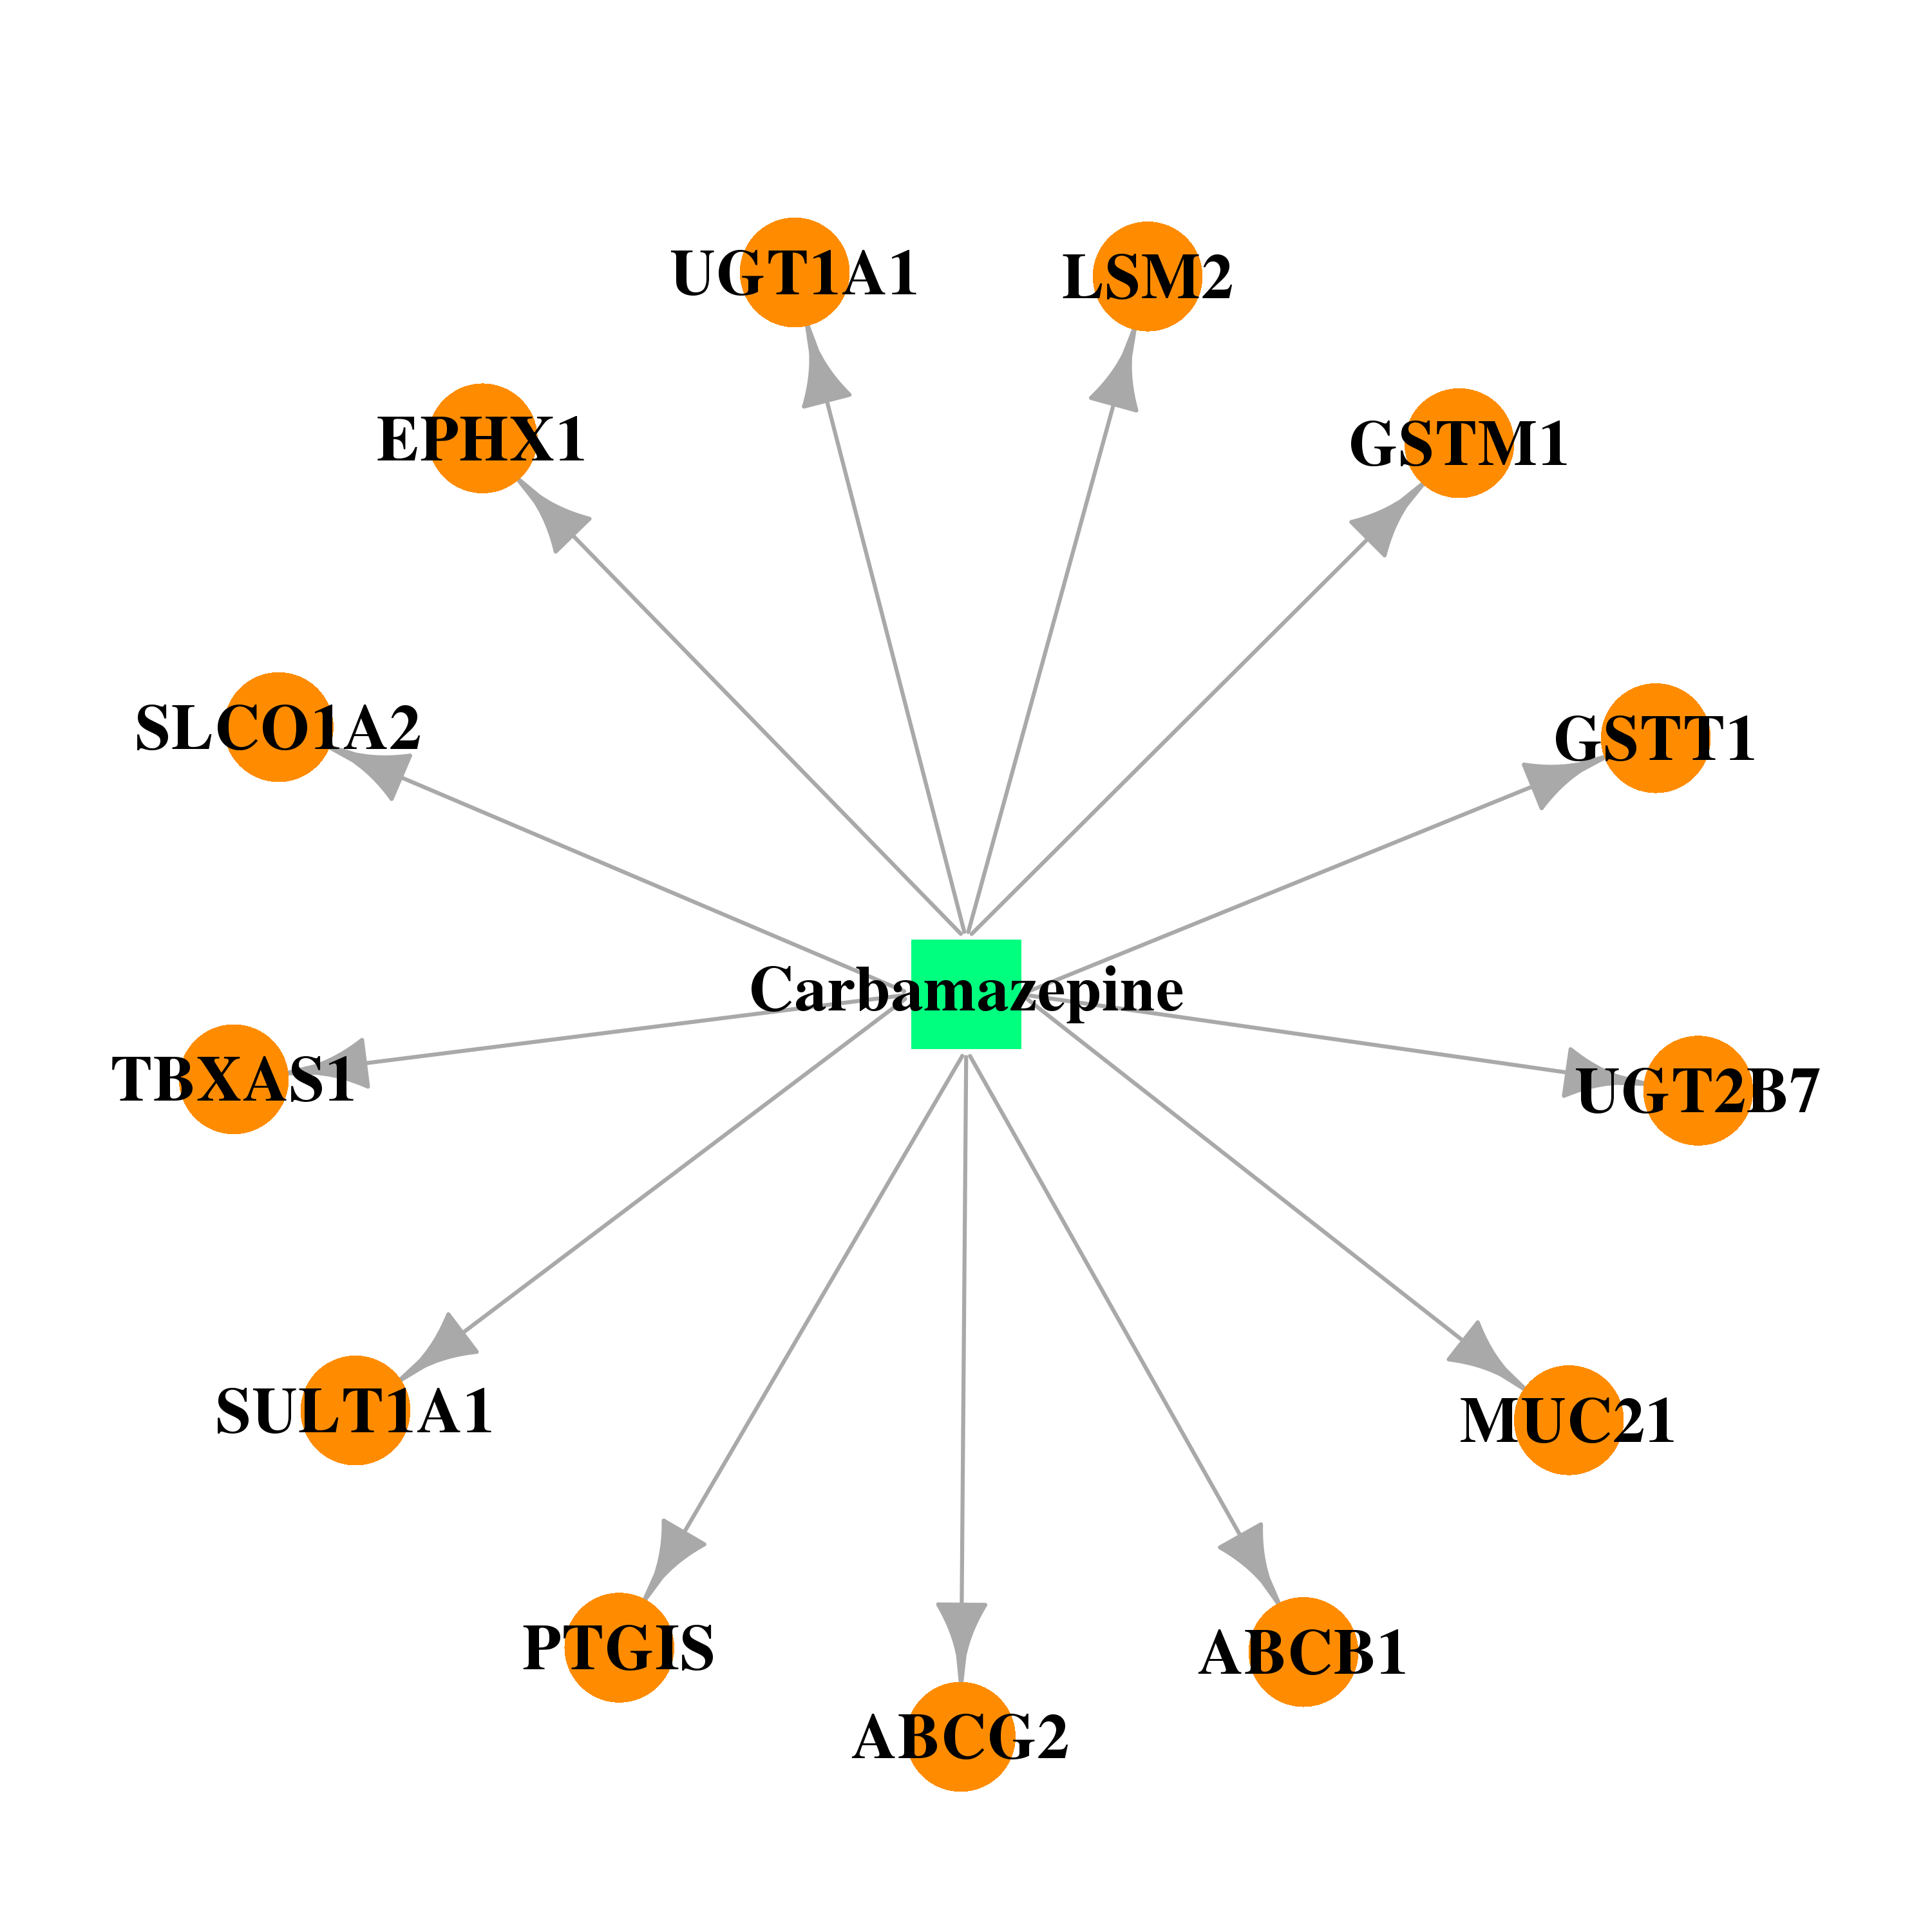 | 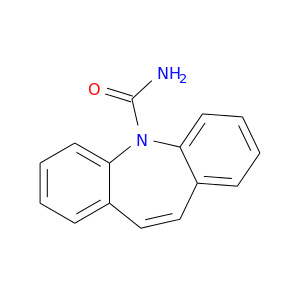 |
| DB00313 | epoxide hydrolase 1, microsomal (xenobiotic) | approved; investigational | Valproic Acid | 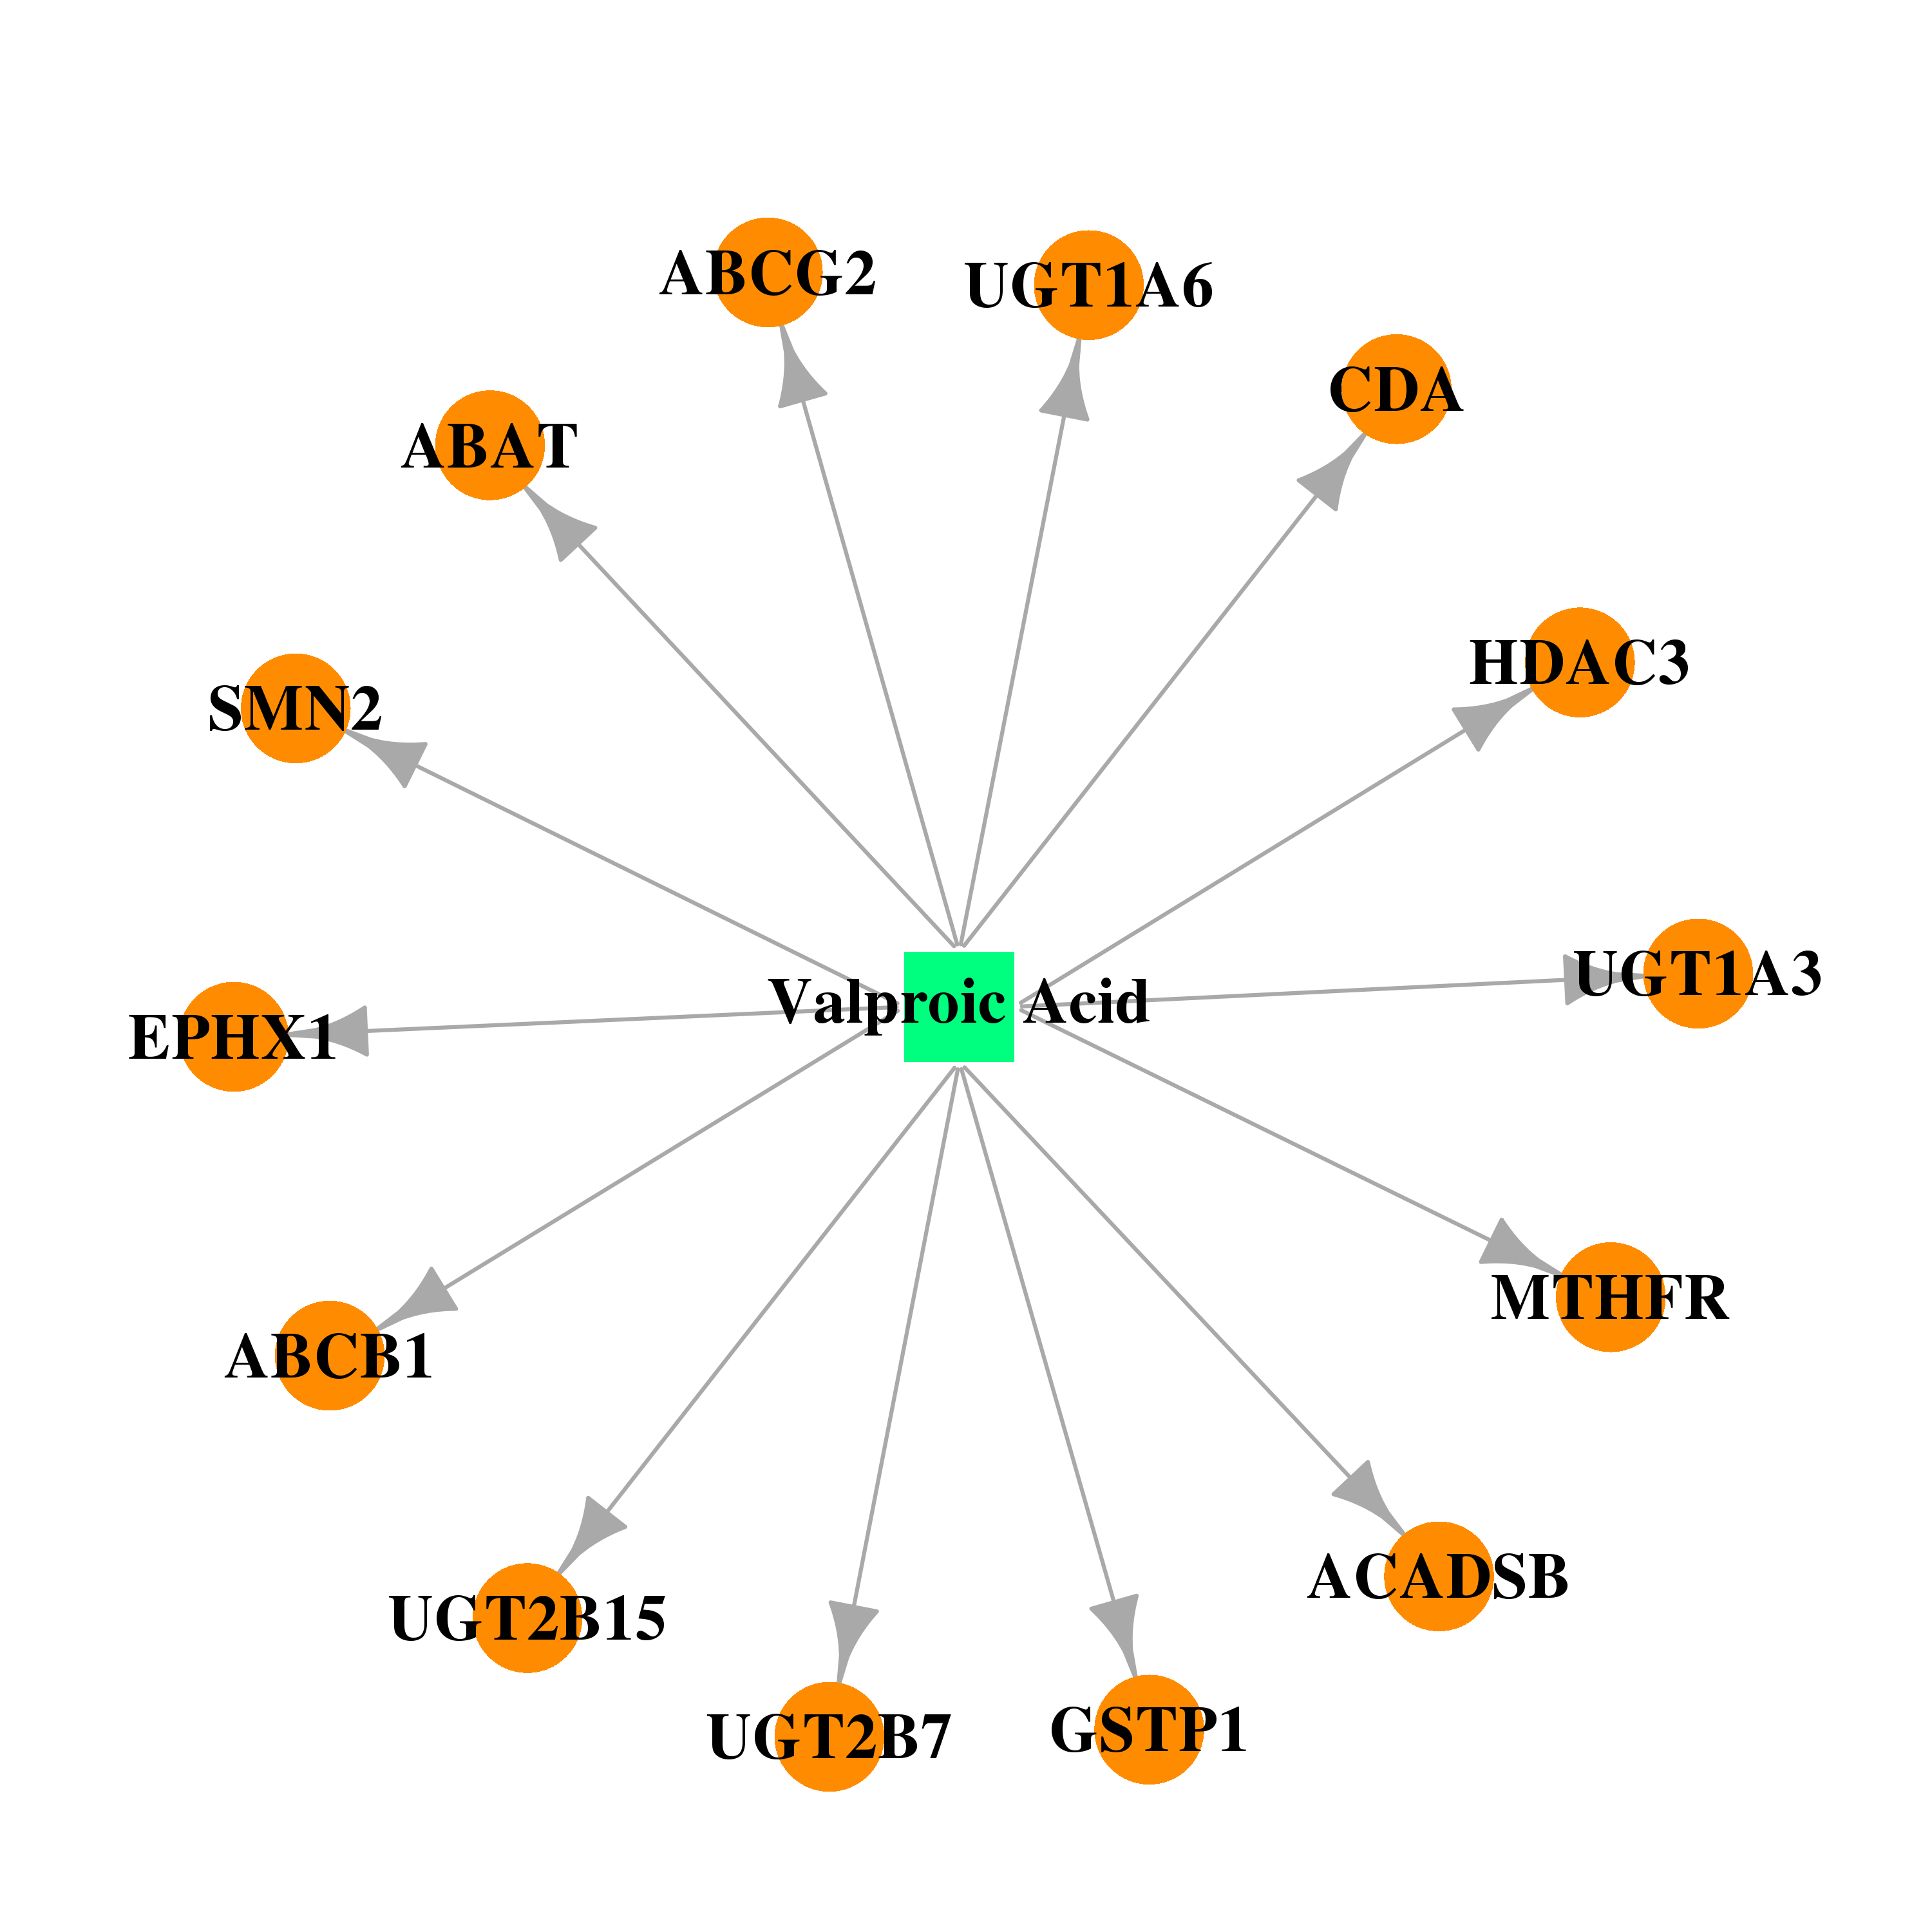 | 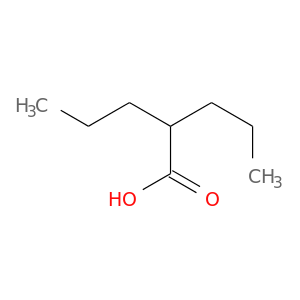 |
| DB00917 | epoxide hydrolase 1, microsomal (xenobiotic) | approved | Dinoprostone | 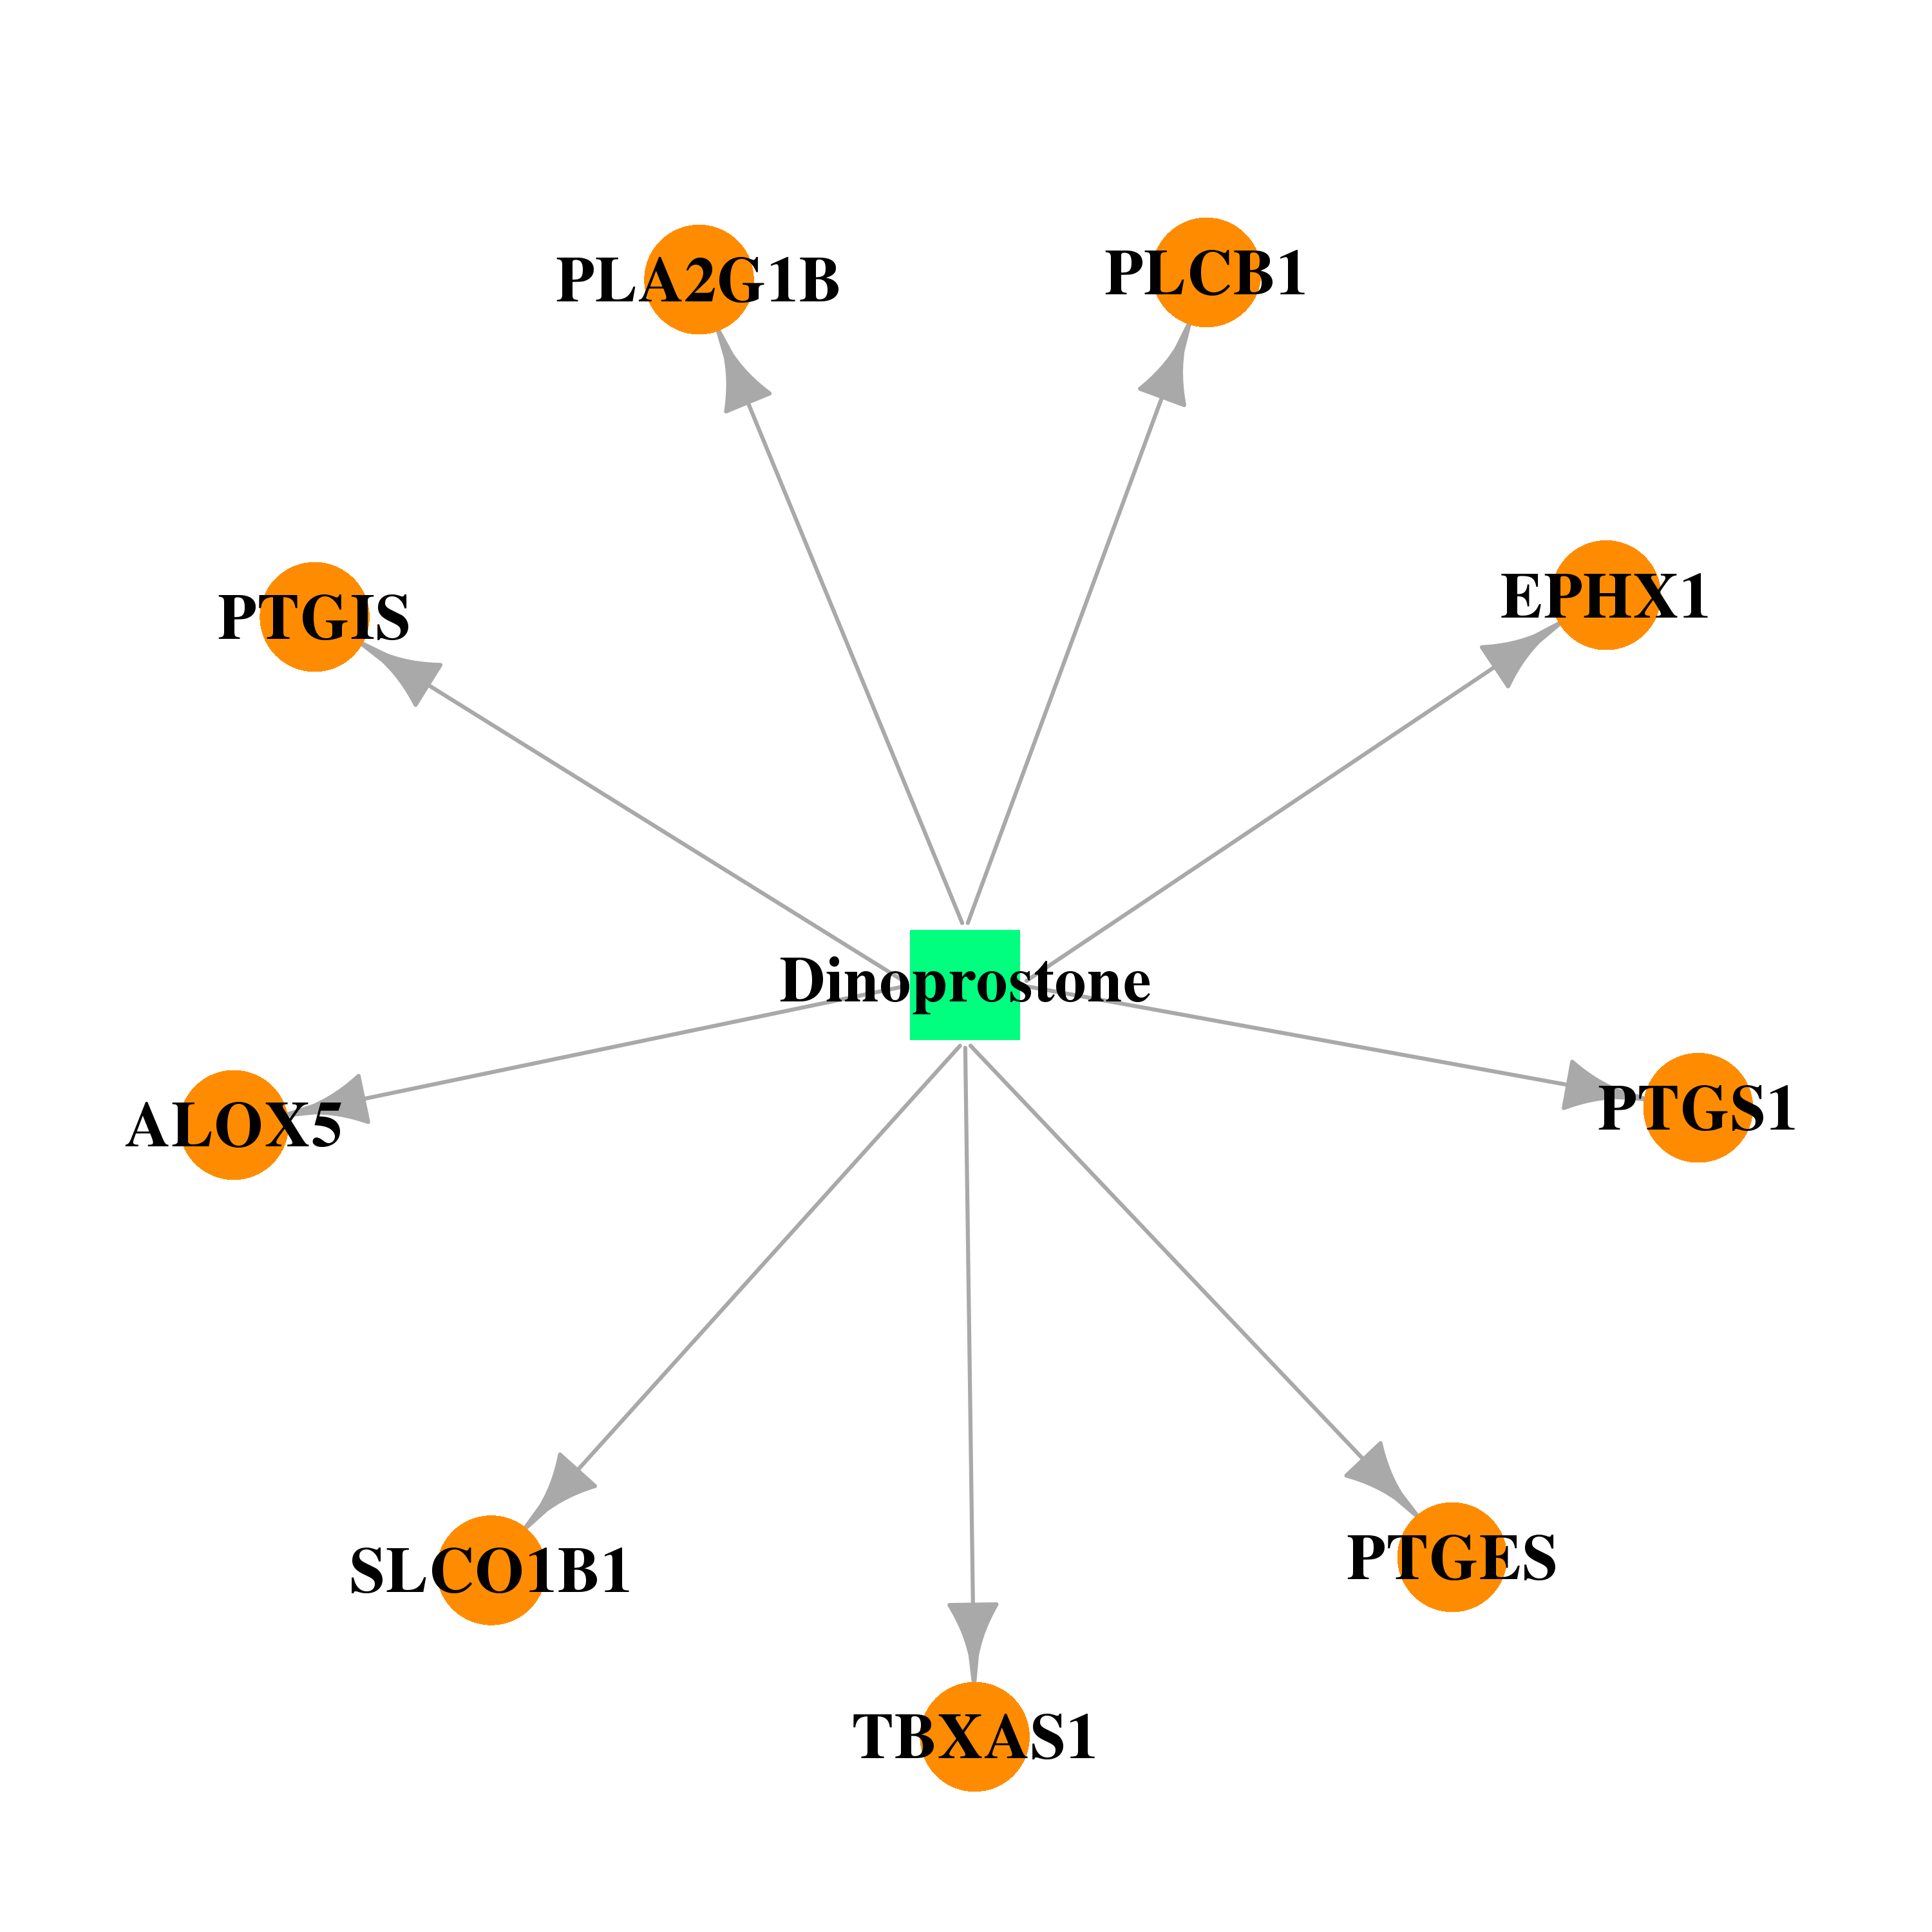 |  |
| DB01240 | epoxide hydrolase 1, microsomal (xenobiotic) | approved | Epoprostenol | 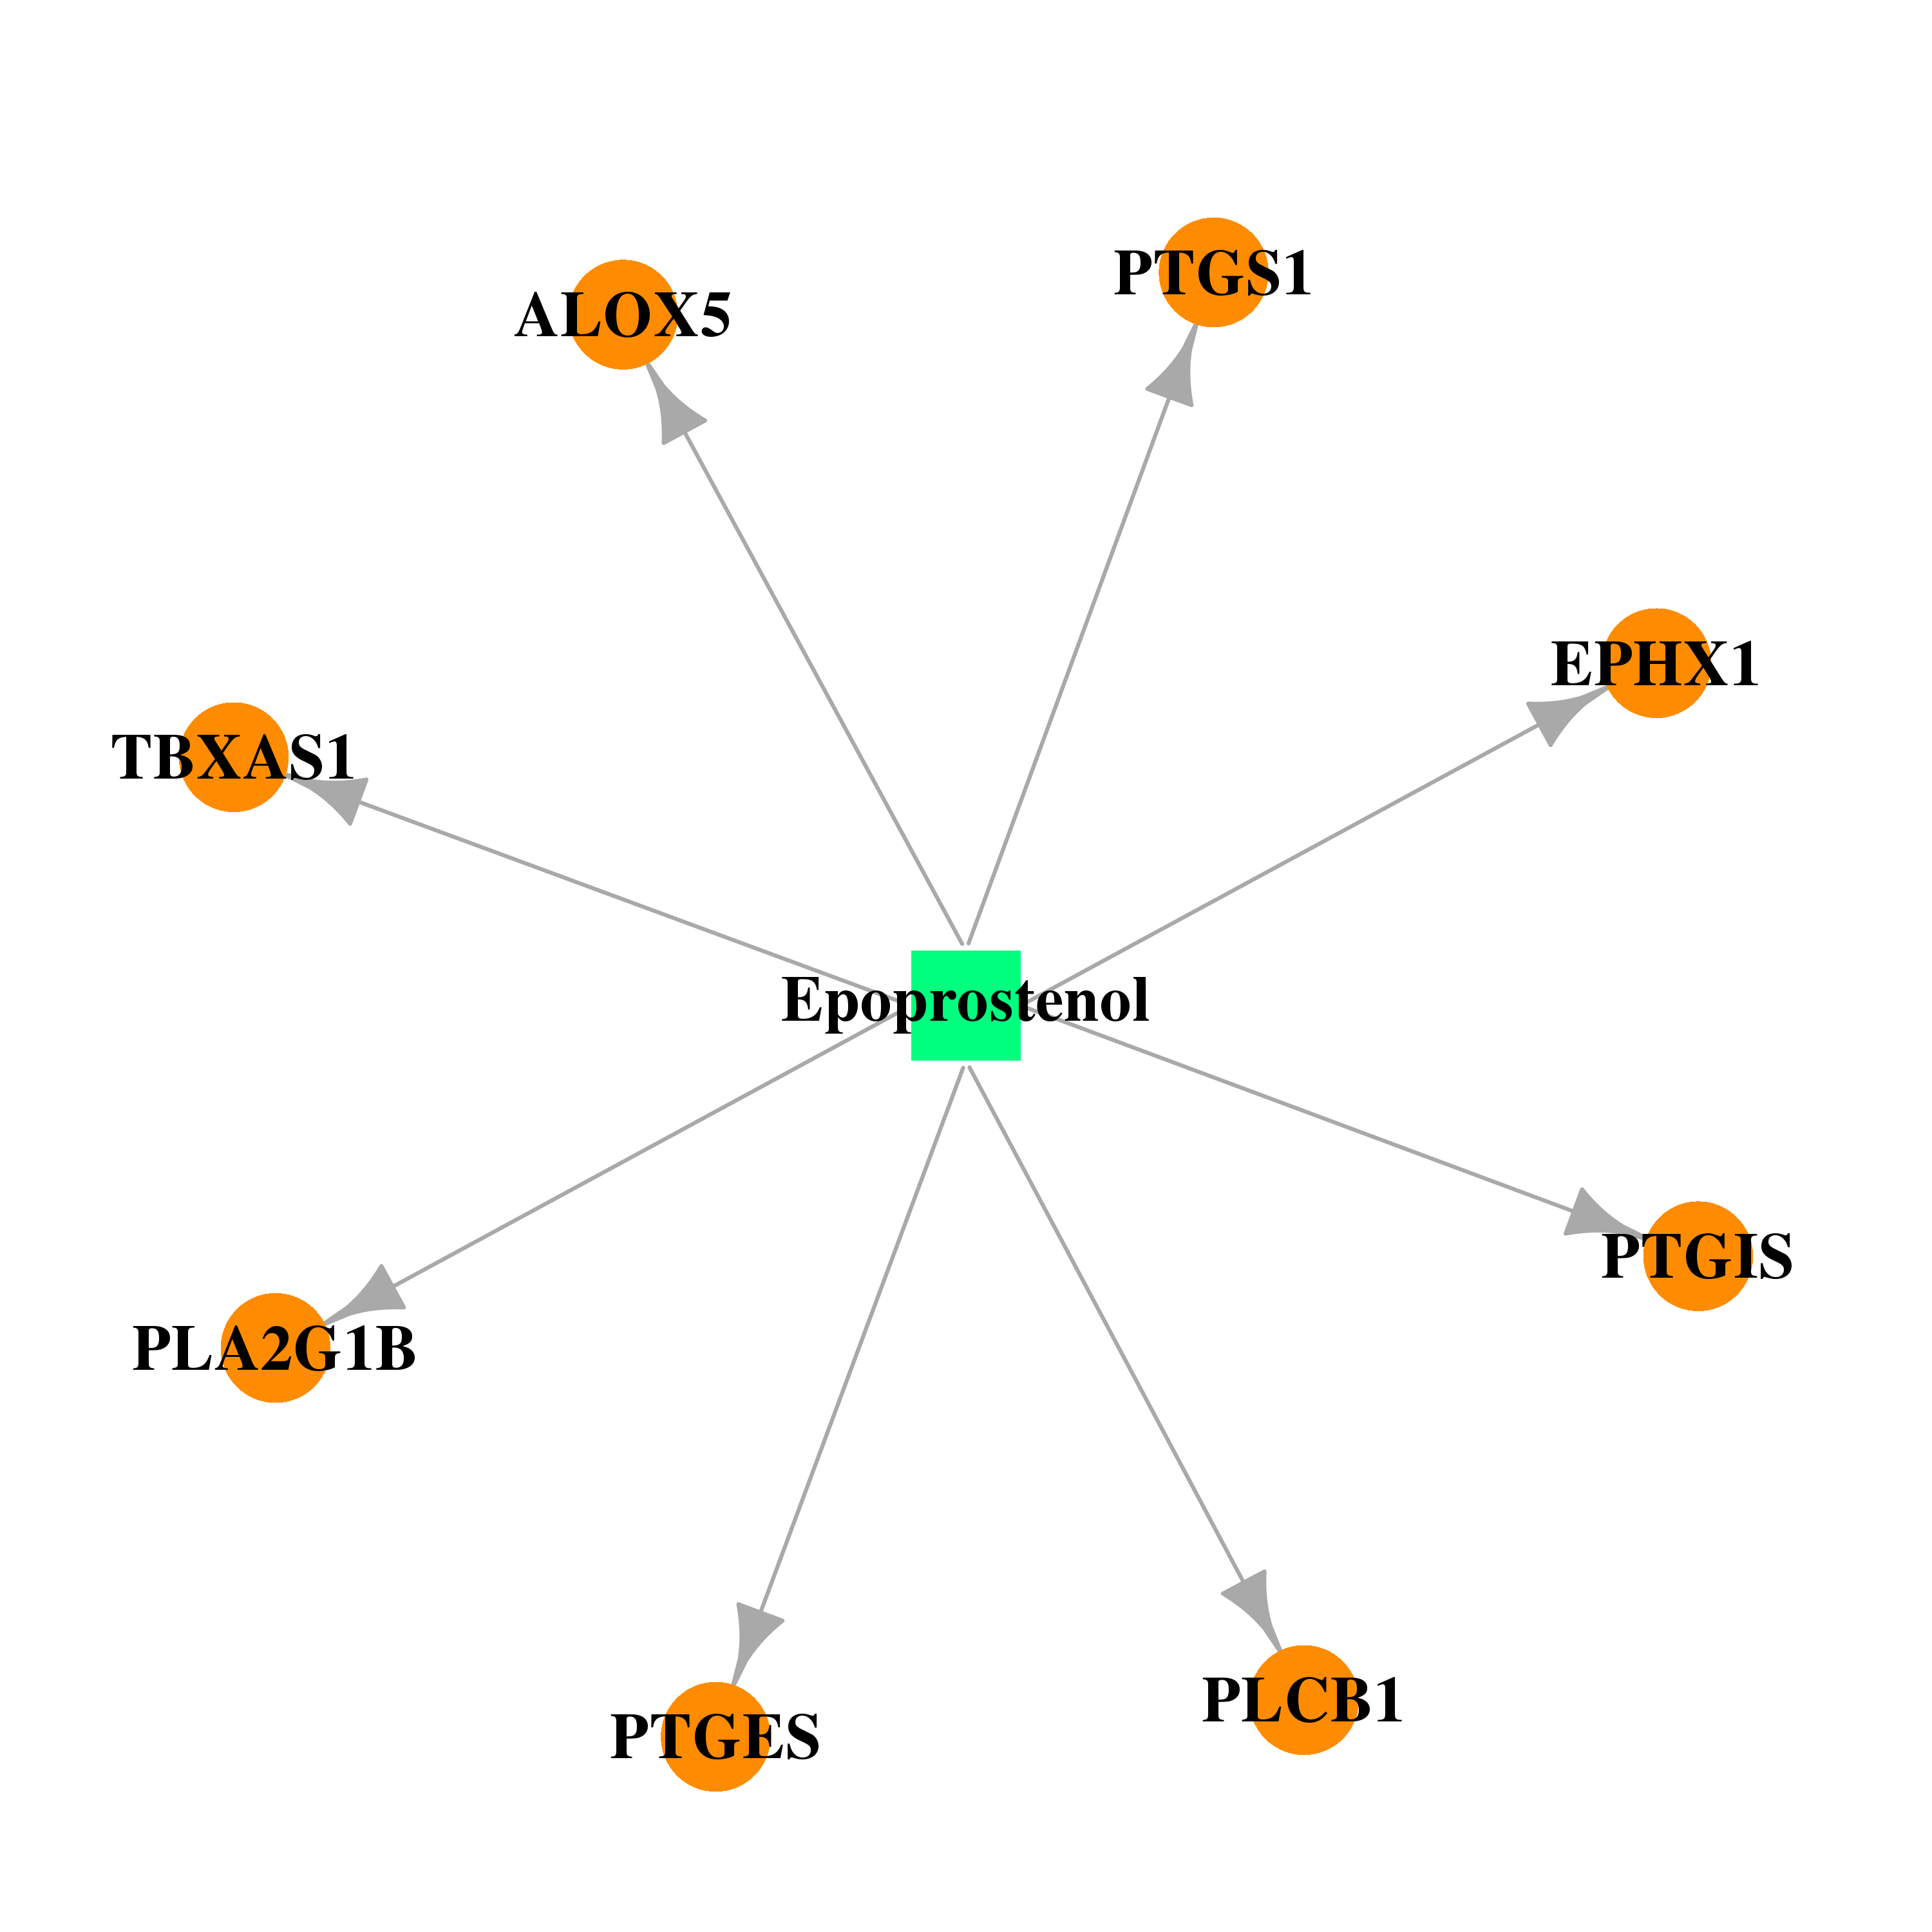 | 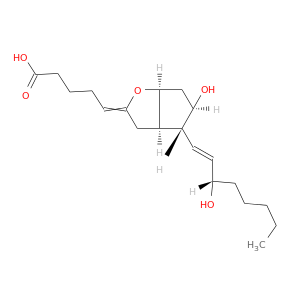 |
| DB00682 | epoxide hydrolase 1, microsomal (xenobiotic) | approved | Warfarin |  | 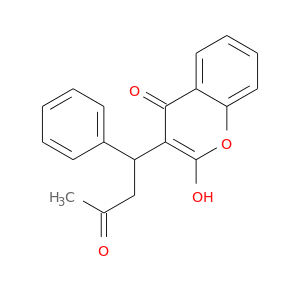 |
| Top |
| Cross referenced IDs for EPHX1 |
| * We obtained these cross-references from Uniprot database. It covers 150 different DBs, 18 categories. http://www.uniprot.org/help/cross_references_section |
: Open all cross reference information
|
Copyright © 2016-Present - The Univsersity of Texas Health Science Center at Houston @ |