|
||||||||||||||||||||
| |
| Phenotypic Information (metabolism pathway, cancer, disease, phenome) |
| |
| |
| Gene-Gene Network Information: Co-Expression Network, Interacting Genes & KEGG |
| |
|


| Gene Summary for ALAD |
| Top |
| Phenotypic Information for ALAD(metabolism pathway, cancer, disease, phenome) |
| Cancer | CGAP: ALAD |
| Familial Cancer Database: ALAD | |
| * This gene is included in those cancer gene databases. |
|
|
|
|
|
| . | ||||||||||||||
Oncogene 1 | Significant driver gene in | |||||||||||||||||||
| cf) number; DB name 1 Oncogene; http://nar.oxfordjournals.org/content/35/suppl_1/D721.long, 2 Tumor Suppressor gene; https://bioinfo.uth.edu/TSGene/, 3 Cancer Gene Census; http://www.nature.com/nrc/journal/v4/n3/abs/nrc1299.html, 4 CancerGenes; http://nar.oxfordjournals.org/content/35/suppl_1/D721.long, 5 Network of Cancer Gene; http://ncg.kcl.ac.uk/index.php, 1Therapeutic Vulnerabilities in Cancer; http://cbio.mskcc.org/cancergenomics/statius/ |
| KEGG_PORPHYRIN_AND_CHLOROPHYLL_METABOLISM REACTOME_METABOLISM_OF_PORPHYRINS | |
| OMIM | |
| Orphanet | |
| Disease | KEGG Disease: ALAD |
| MedGen: ALAD (Human Medical Genetics with Condition) | |
| ClinVar: ALAD | |
| Phenotype | MGI: ALAD (International Mouse Phenotyping Consortium) |
| PhenomicDB: ALAD | |
| Mutations for ALAD |
| * Under tables are showing count per each tissue to give us broad intuition about tissue specific mutation patterns.You can go to the detailed page for each mutation database's web site. |
| There's no structural variation information in COSMIC data for this gene. |
| * From mRNA Sanger sequences, Chitars2.0 arranged chimeric transcripts. This table shows ALAD related fusion information. |
| ID | Head Gene | Tail Gene | Accession | Gene_a | qStart_a | qEnd_a | Chromosome_a | tStart_a | tEnd_a | Gene_a | qStart_a | qEnd_a | Chromosome_a | tStart_a | tEnd_a |
| BC009172 | ALAD | 1 | 251 | 9 | 116155725 | 116163552 | ESRP2 | 237 | 2321 | 16 | 68263305 | 68266732 | |
| BE563268 | ALAD | 1 | 232 | 9 | 116155725 | 116163533 | ESRP2 | 218 | 740 | 16 | 68265707 | 68266732 | |
| Top |
| There's no copy number variation information in COSMIC data for this gene. |
| Top |
|
 |
| Top |
| Stat. for Non-Synonymous SNVs (# total SNVs=15) | (# total SNVs=12) |
 |  |
(# total SNVs=0) | (# total SNVs=0) |
| Top |
| * When you move the cursor on each content, you can see more deailed mutation information on the Tooltip. Those are primary_site,primary_histology,mutation(aa),pubmedID. |
| GRCh37 position | Mutation(aa) | Unique sampleID count |
| chr9:116151291-116151291 | p.A328A | 4 |
| chr9:116153891-116153891 | p.K88N | 2 |
| chr9:116153900-116153900 | p.Y85Y | 2 |
| chr9:116151917-116151917 | p.L255L | 2 |
| chr9:116153104-116153104 | p.C153Y | 2 |
| chr9:116151918-116151918 | p.Q254H | 2 |
| chr9:116152053-116152053 | p.R238Q | 2 |
| chr9:116151266-116151266 | p.R337S | 2 |
| chr9:116152082-116152082 | p.K228K | 2 |
| chr9:116151366-116151366 | p.A303A | 2 |
| Top |
|
 |
| Point Mutation/ Tissue ID | 1 | 2 | 3 | 4 | 5 | 6 | 7 | 8 | 9 | 10 | 11 | 12 | 13 | 14 | 15 | 16 | 17 | 18 | 19 | 20 |
| # sample | 1 | 2 | 3 | 1 | 1 | 3 | 6 | 8 | 3 | |||||||||||
| # mutation | 1 | 2 | 3 | 1 | 1 | 3 | 6 | 8 | 3 | |||||||||||
| nonsynonymous SNV | 1 | 2 | 2 | 4 | 5 | 3 | ||||||||||||||
| synonymous SNV | 1 | 1 | 1 | 1 | 1 | 1 | 2 | 3 |
| cf) Tissue ID; Tissue type (1; BLCA[Bladder Urothelial Carcinoma], 2; BRCA[Breast invasive carcinoma], 3; CESC[Cervical squamous cell carcinoma and endocervical adenocarcinoma], 4; COAD[Colon adenocarcinoma], 5; GBM[Glioblastoma multiforme], 6; Glioma Low Grade, 7; HNSC[Head and Neck squamous cell carcinoma], 8; KICH[Kidney Chromophobe], 9; KIRC[Kidney renal clear cell carcinoma], 10; KIRP[Kidney renal papillary cell carcinoma], 11; LAML[Acute Myeloid Leukemia], 12; LUAD[Lung adenocarcinoma], 13; LUSC[Lung squamous cell carcinoma], 14; OV[Ovarian serous cystadenocarcinoma ], 15; PAAD[Pancreatic adenocarcinoma], 16; PRAD[Prostate adenocarcinoma], 17; SKCM[Skin Cutaneous Melanoma], 18:STAD[Stomach adenocarcinoma], 19:THCA[Thyroid carcinoma], 20:UCEC[Uterine Corpus Endometrial Carcinoma]) |
| Top |
| * We represented just top 10 SNVs. When you move the cursor on each content, you can see more deailed mutation information on the Tooltip. Those are primary_site, primary_histology, mutation(aa), pubmedID. |
| Genomic Position | Mutation(aa) | Unique sampleID count |
| chr9:116151291 | p.A299A | 3 |
| chr9:116150638 | p.A312D | 2 |
| chr9:116153860 | p.P125S | 1 |
| chr9:116152094 | p.I105I | 1 |
| chr9:116154422 | p.Q322H | 1 |
| chr9:116152734 | p.R90L | 1 |
| chr9:116154442 | p.P321P | 1 |
| chr9:116152751 | p.E89G | 1 |
| chr9:116155727 | p.E70K | 1 |
| chr9:116150607 | p.R308S | 1 |
| * Copy number data were extracted from TCGA using R package TCGA-Assembler. The URLs of all public data files on TCGA DCC data server were gathered on Jan-05-2015. Function ProcessCNAData in TCGA-Assembler package was used to obtain gene-level copy number value which is calculated as the average copy number of the genomic region of a gene. |
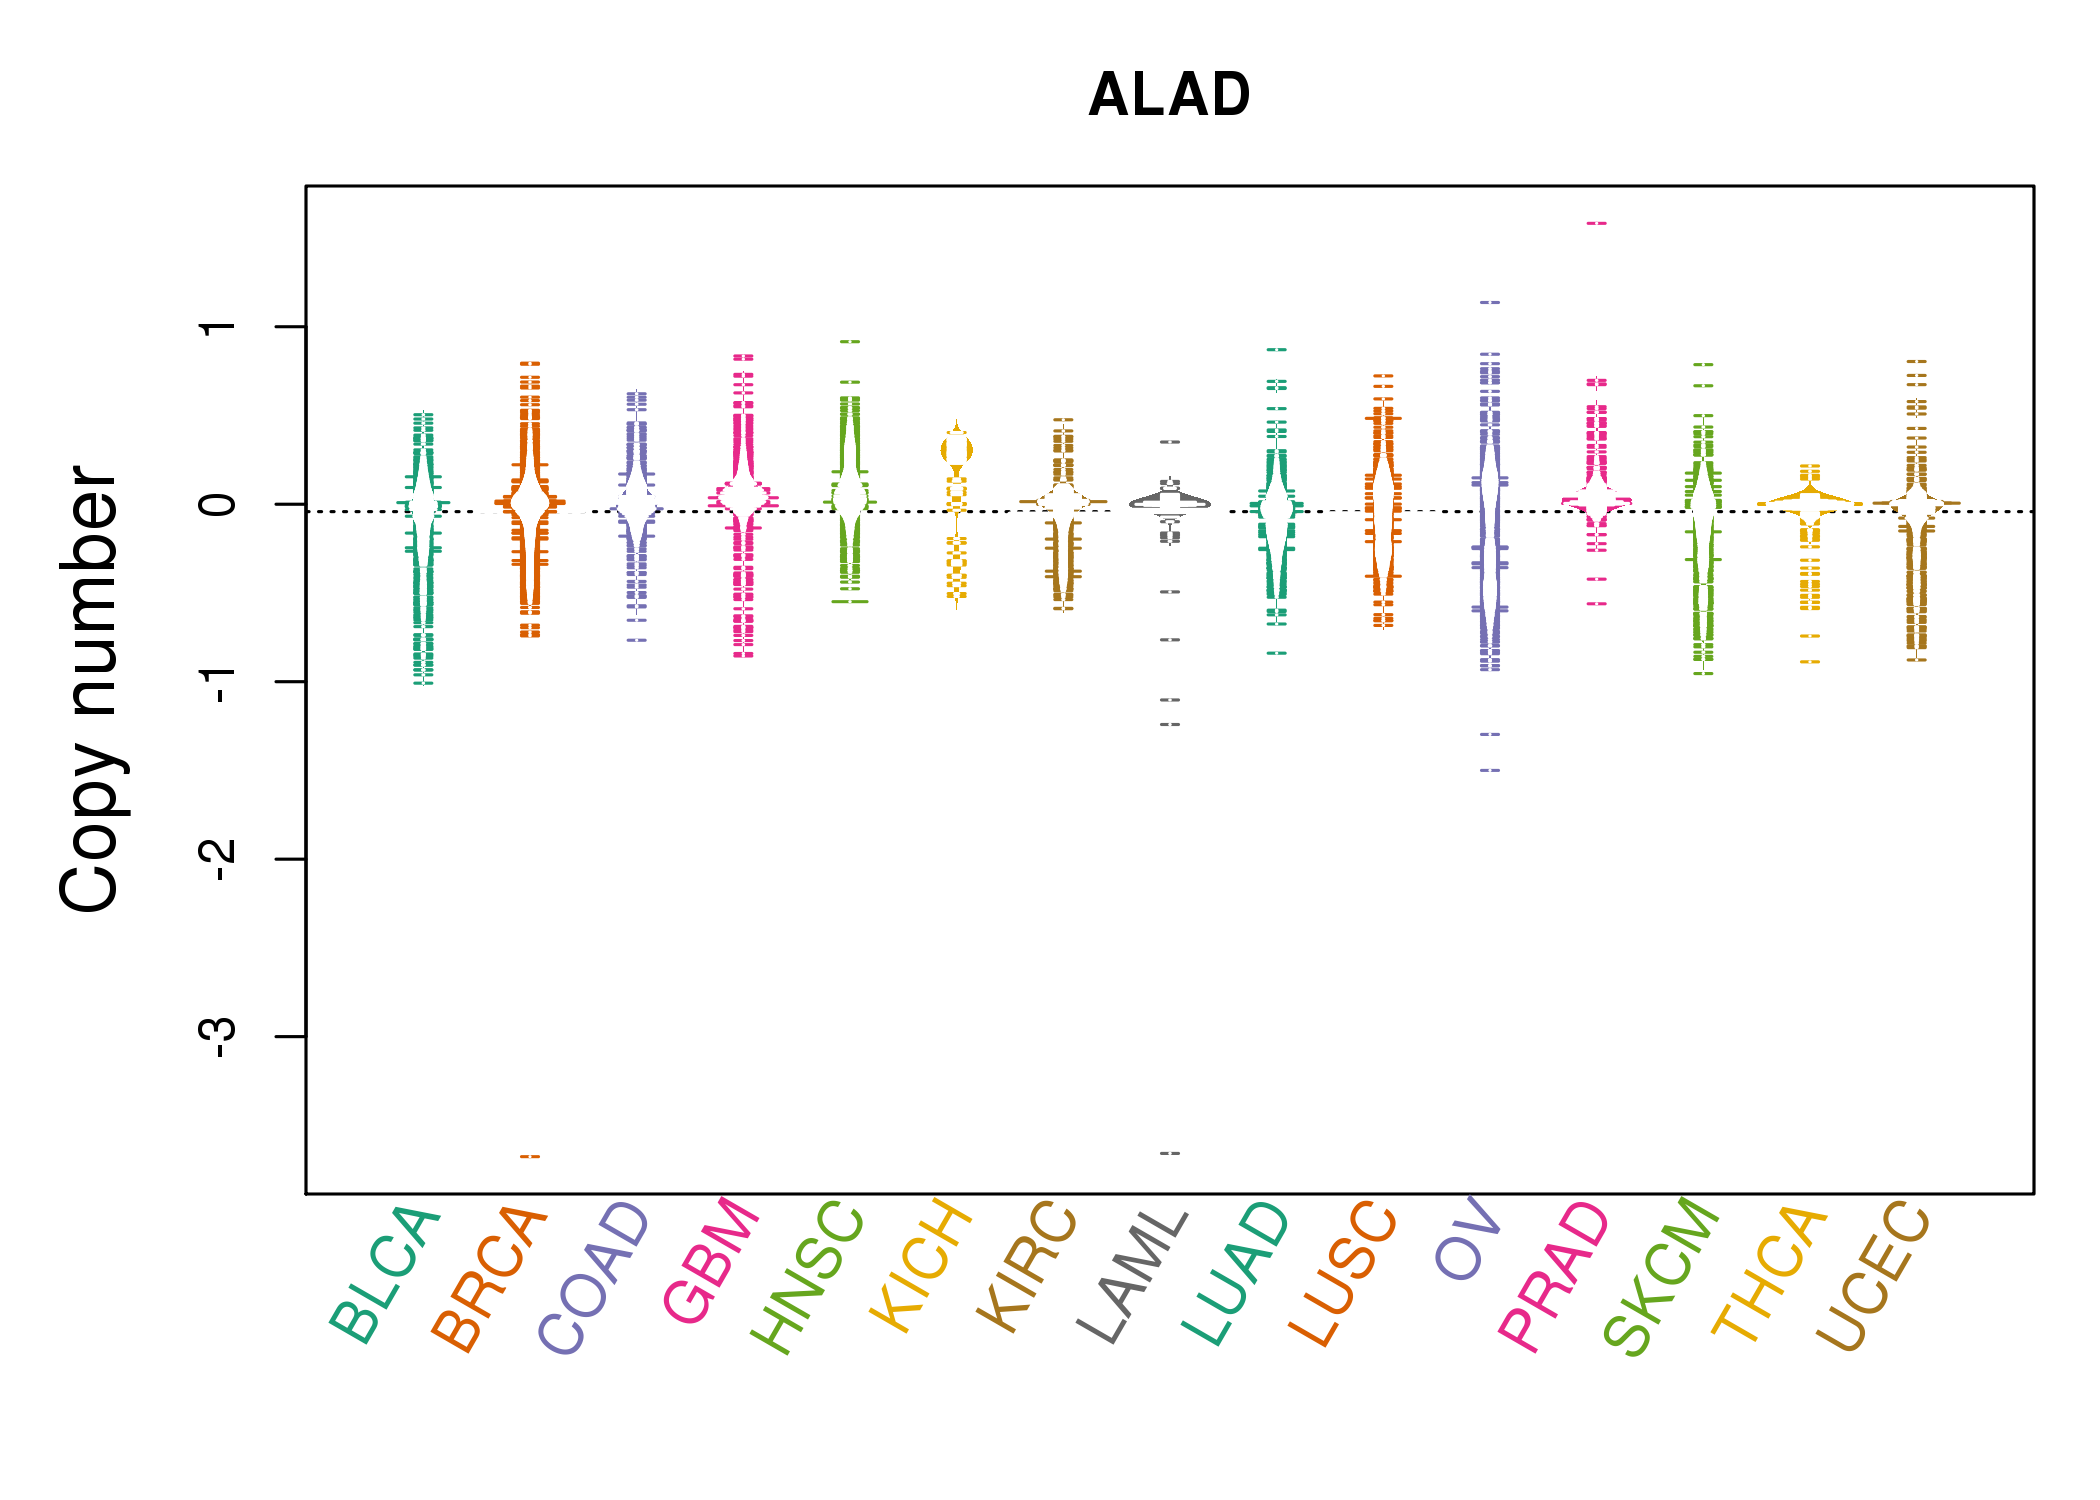 |
| cf) Tissue ID[Tissue type]: BLCA[Bladder Urothelial Carcinoma], BRCA[Breast invasive carcinoma], CESC[Cervical squamous cell carcinoma and endocervical adenocarcinoma], COAD[Colon adenocarcinoma], GBM[Glioblastoma multiforme], Glioma Low Grade, HNSC[Head and Neck squamous cell carcinoma], KICH[Kidney Chromophobe], KIRC[Kidney renal clear cell carcinoma], KIRP[Kidney renal papillary cell carcinoma], LAML[Acute Myeloid Leukemia], LUAD[Lung adenocarcinoma], LUSC[Lung squamous cell carcinoma], OV[Ovarian serous cystadenocarcinoma ], PAAD[Pancreatic adenocarcinoma], PRAD[Prostate adenocarcinoma], SKCM[Skin Cutaneous Melanoma], STAD[Stomach adenocarcinoma], THCA[Thyroid carcinoma], UCEC[Uterine Corpus Endometrial Carcinoma] |
| Top |
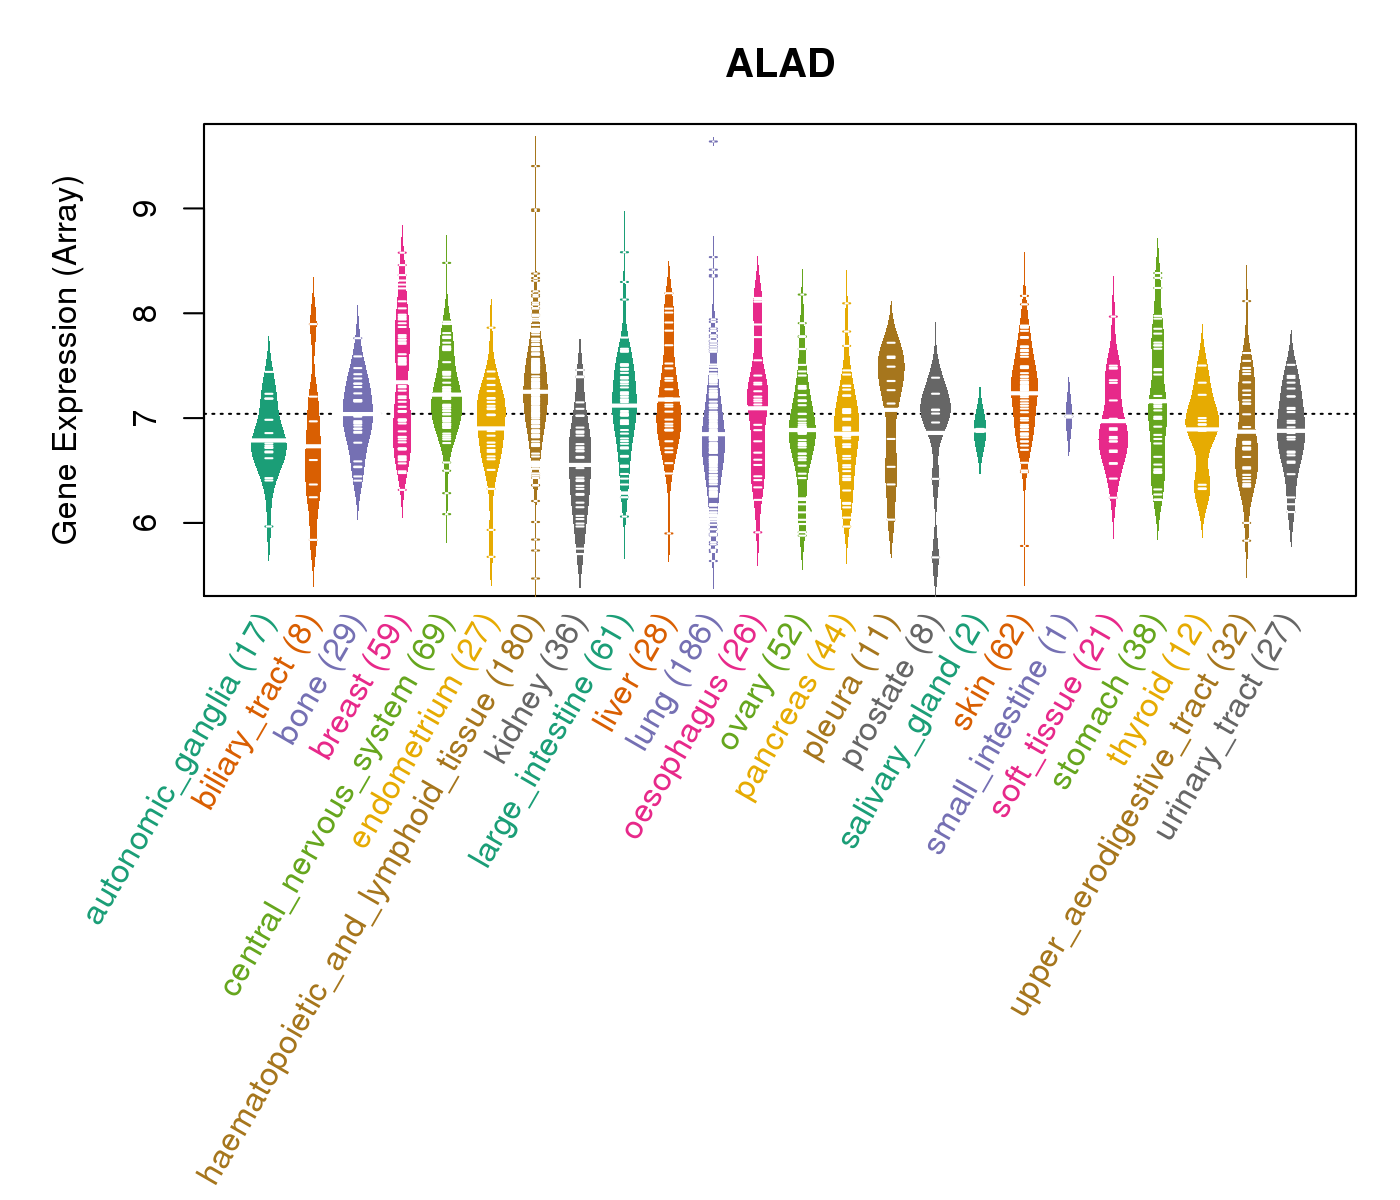
| Gene Expression for ALAD |
| * CCLE gene expression data were extracted from CCLE_Expression_Entrez_2012-10-18.res: Gene-centric RMA-normalized mRNA expression data. |
 |
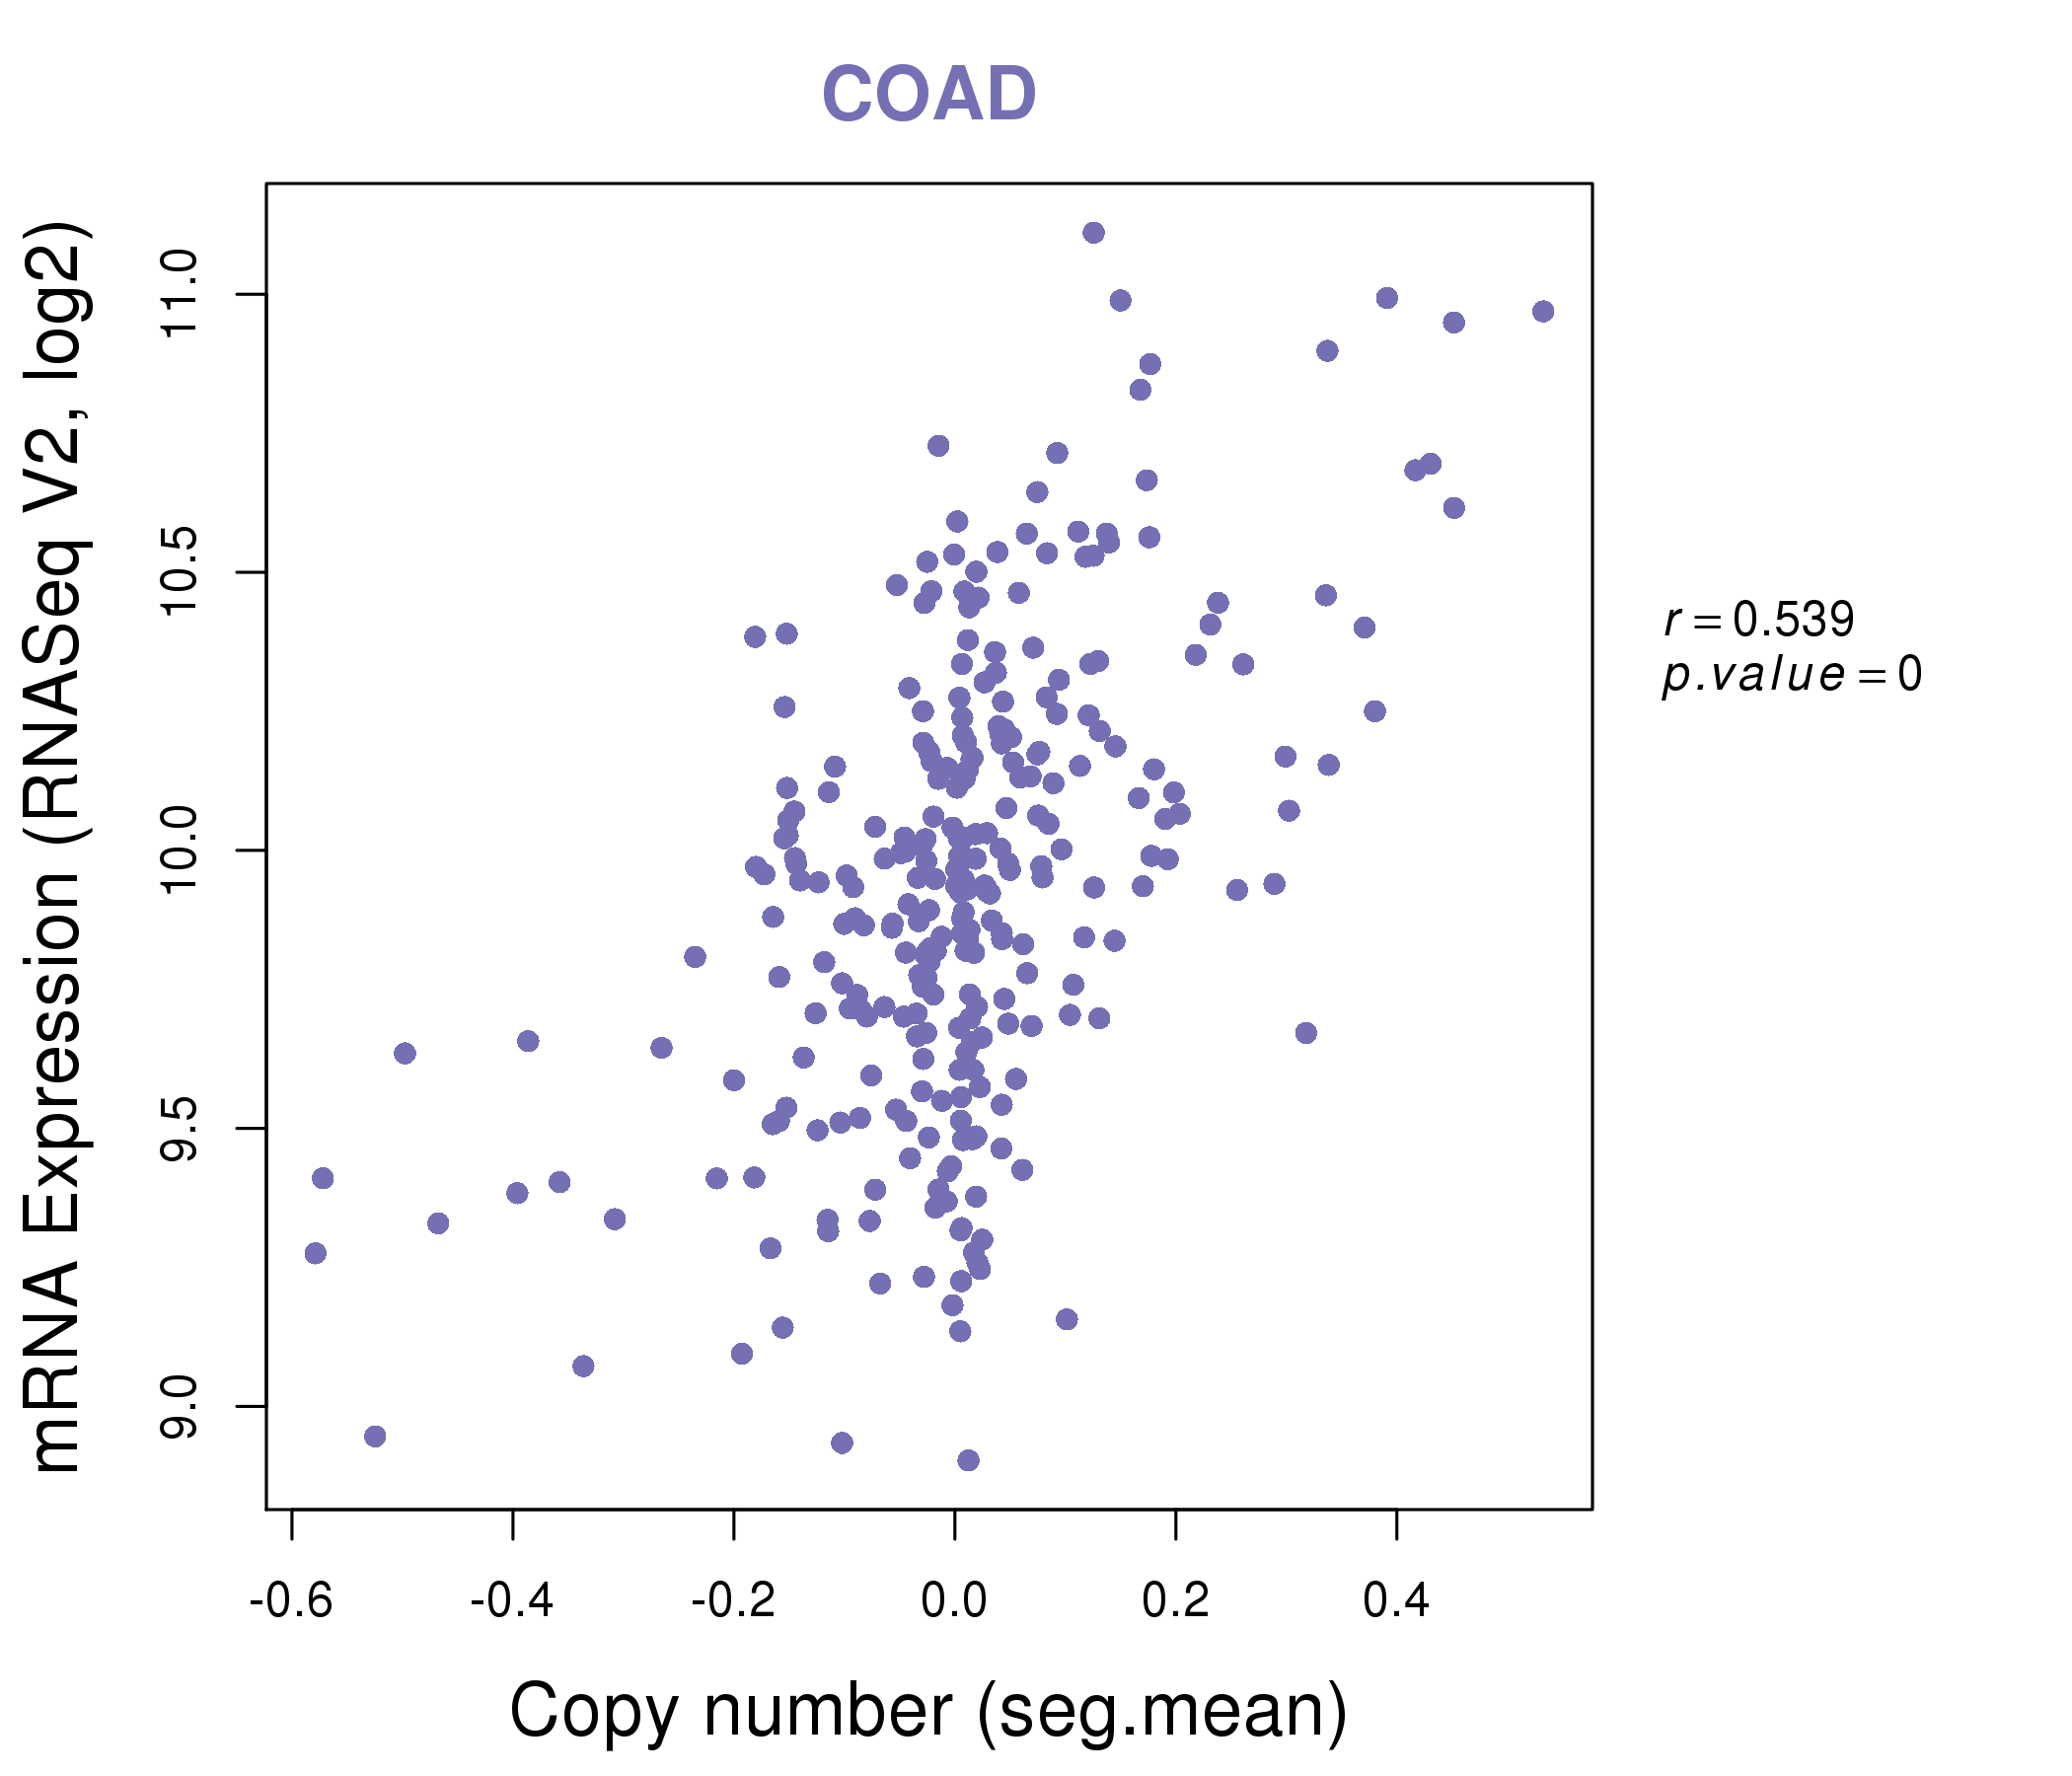
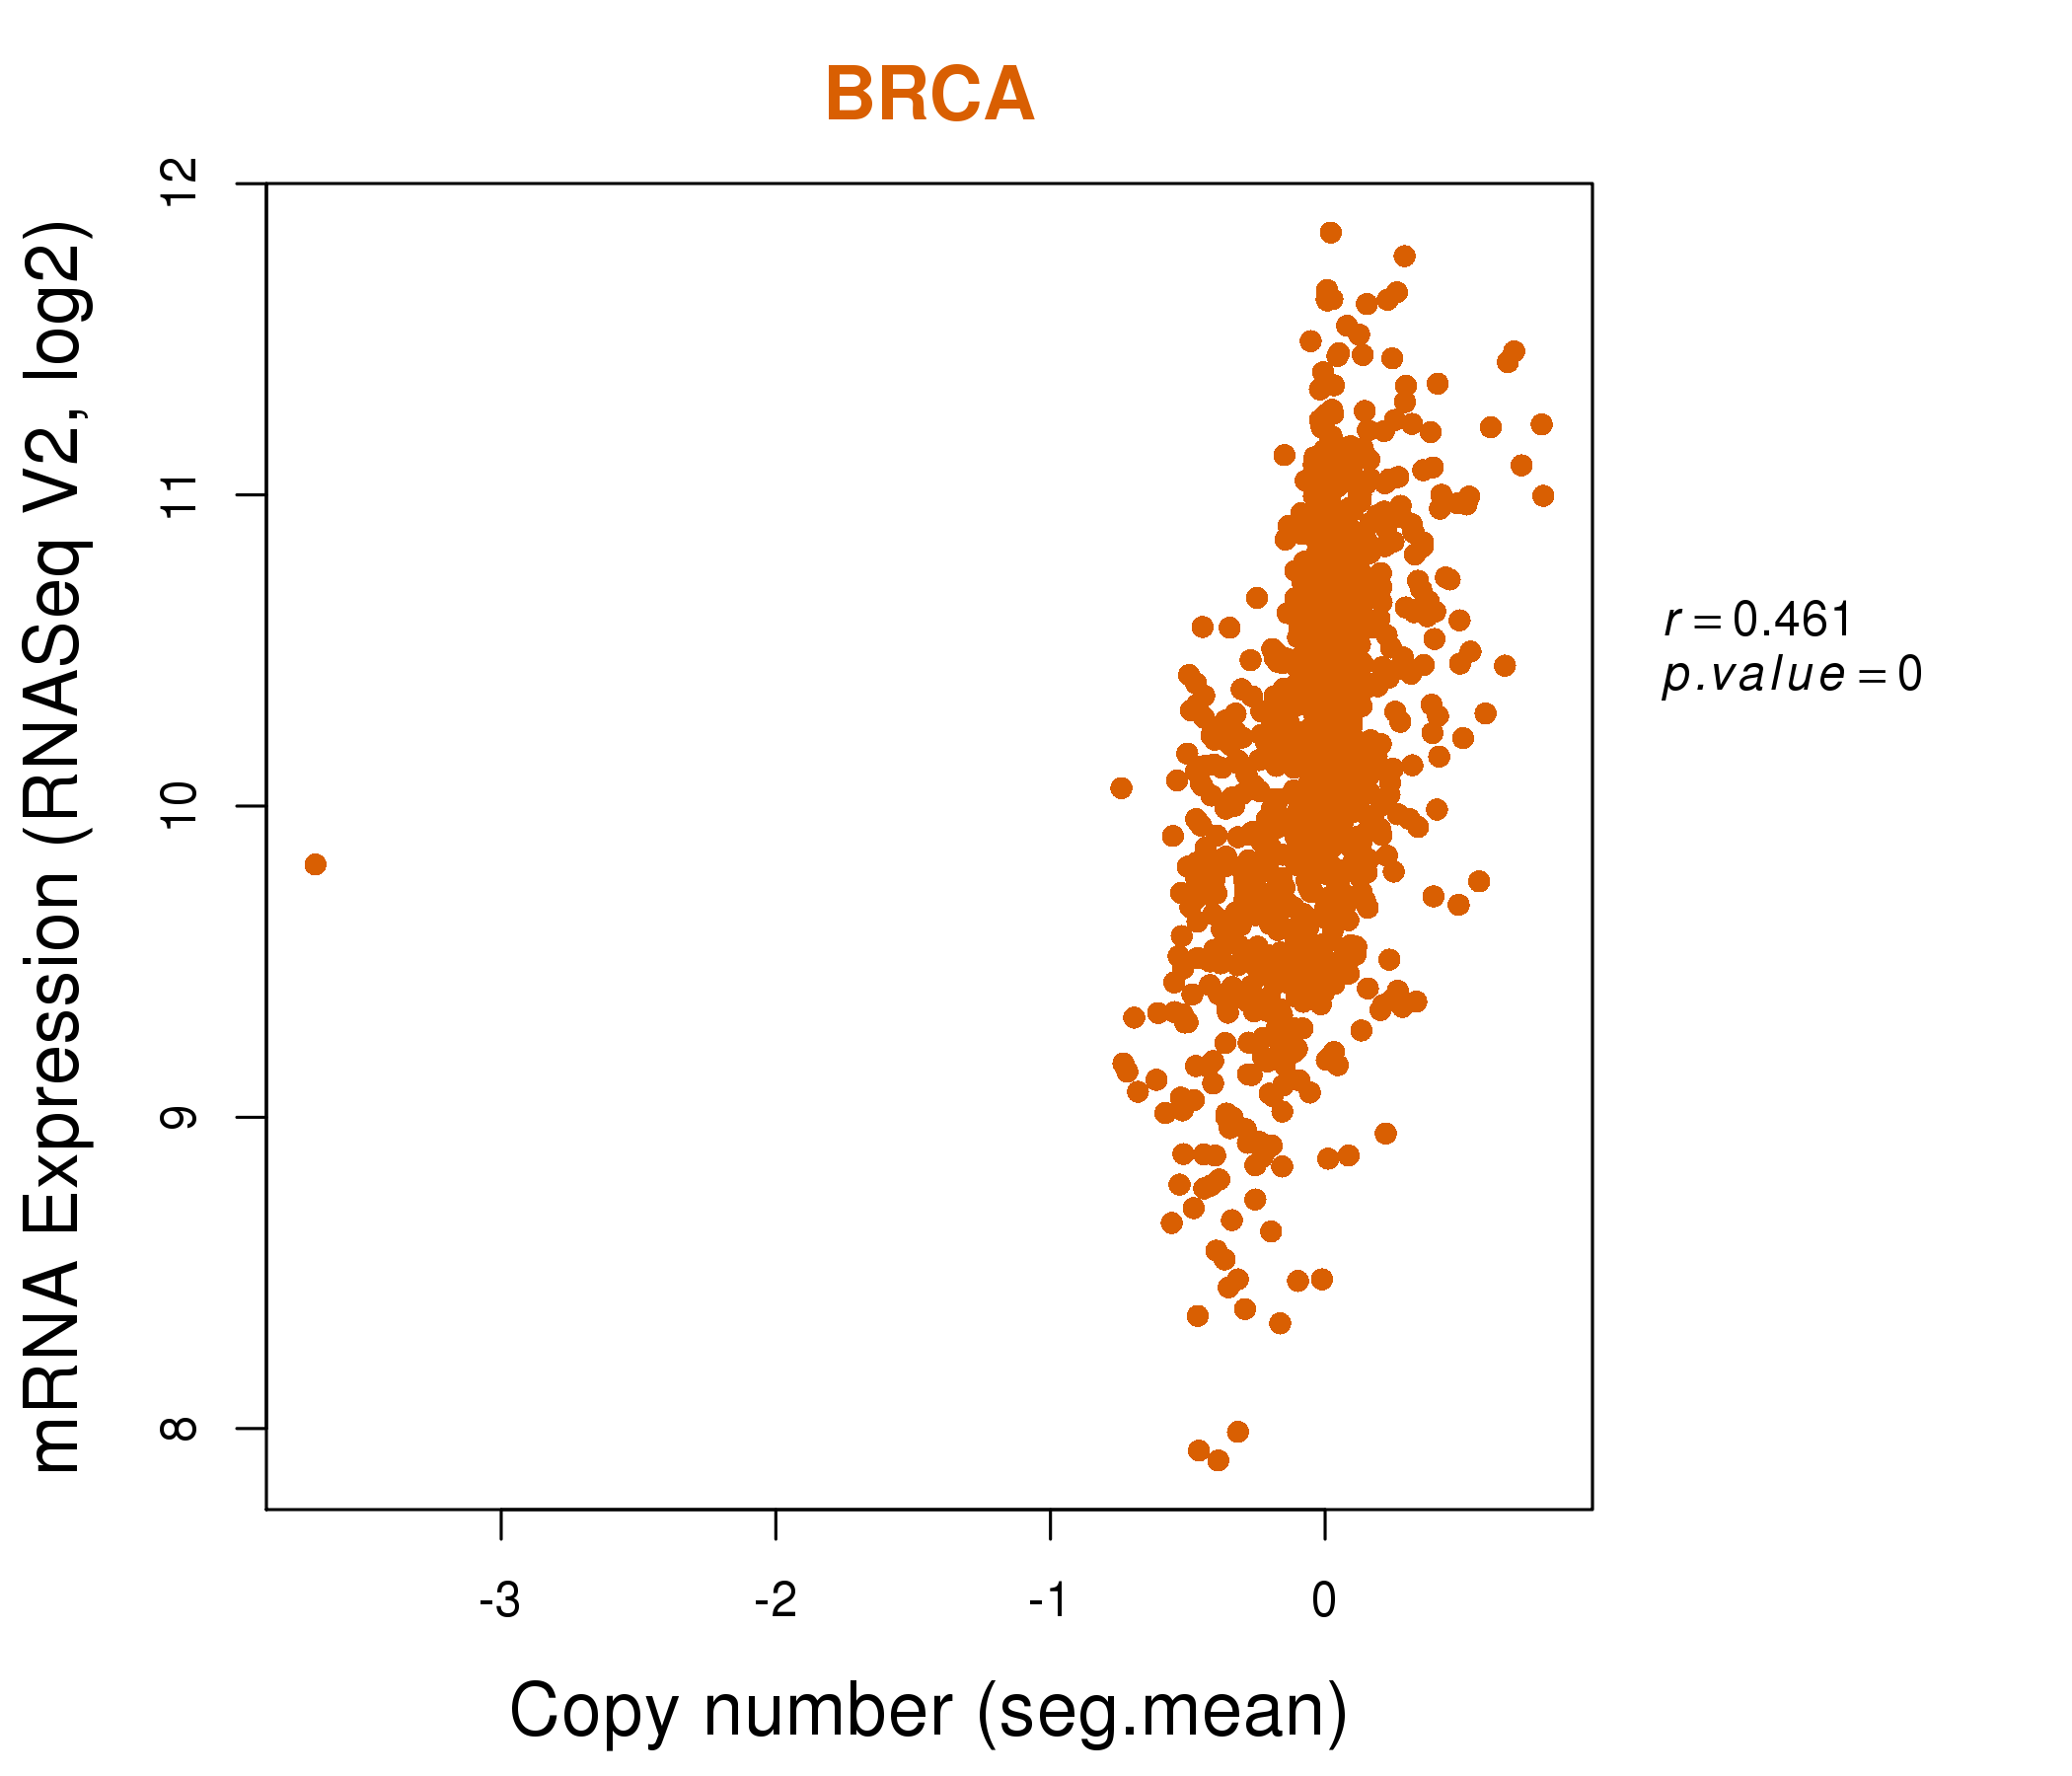
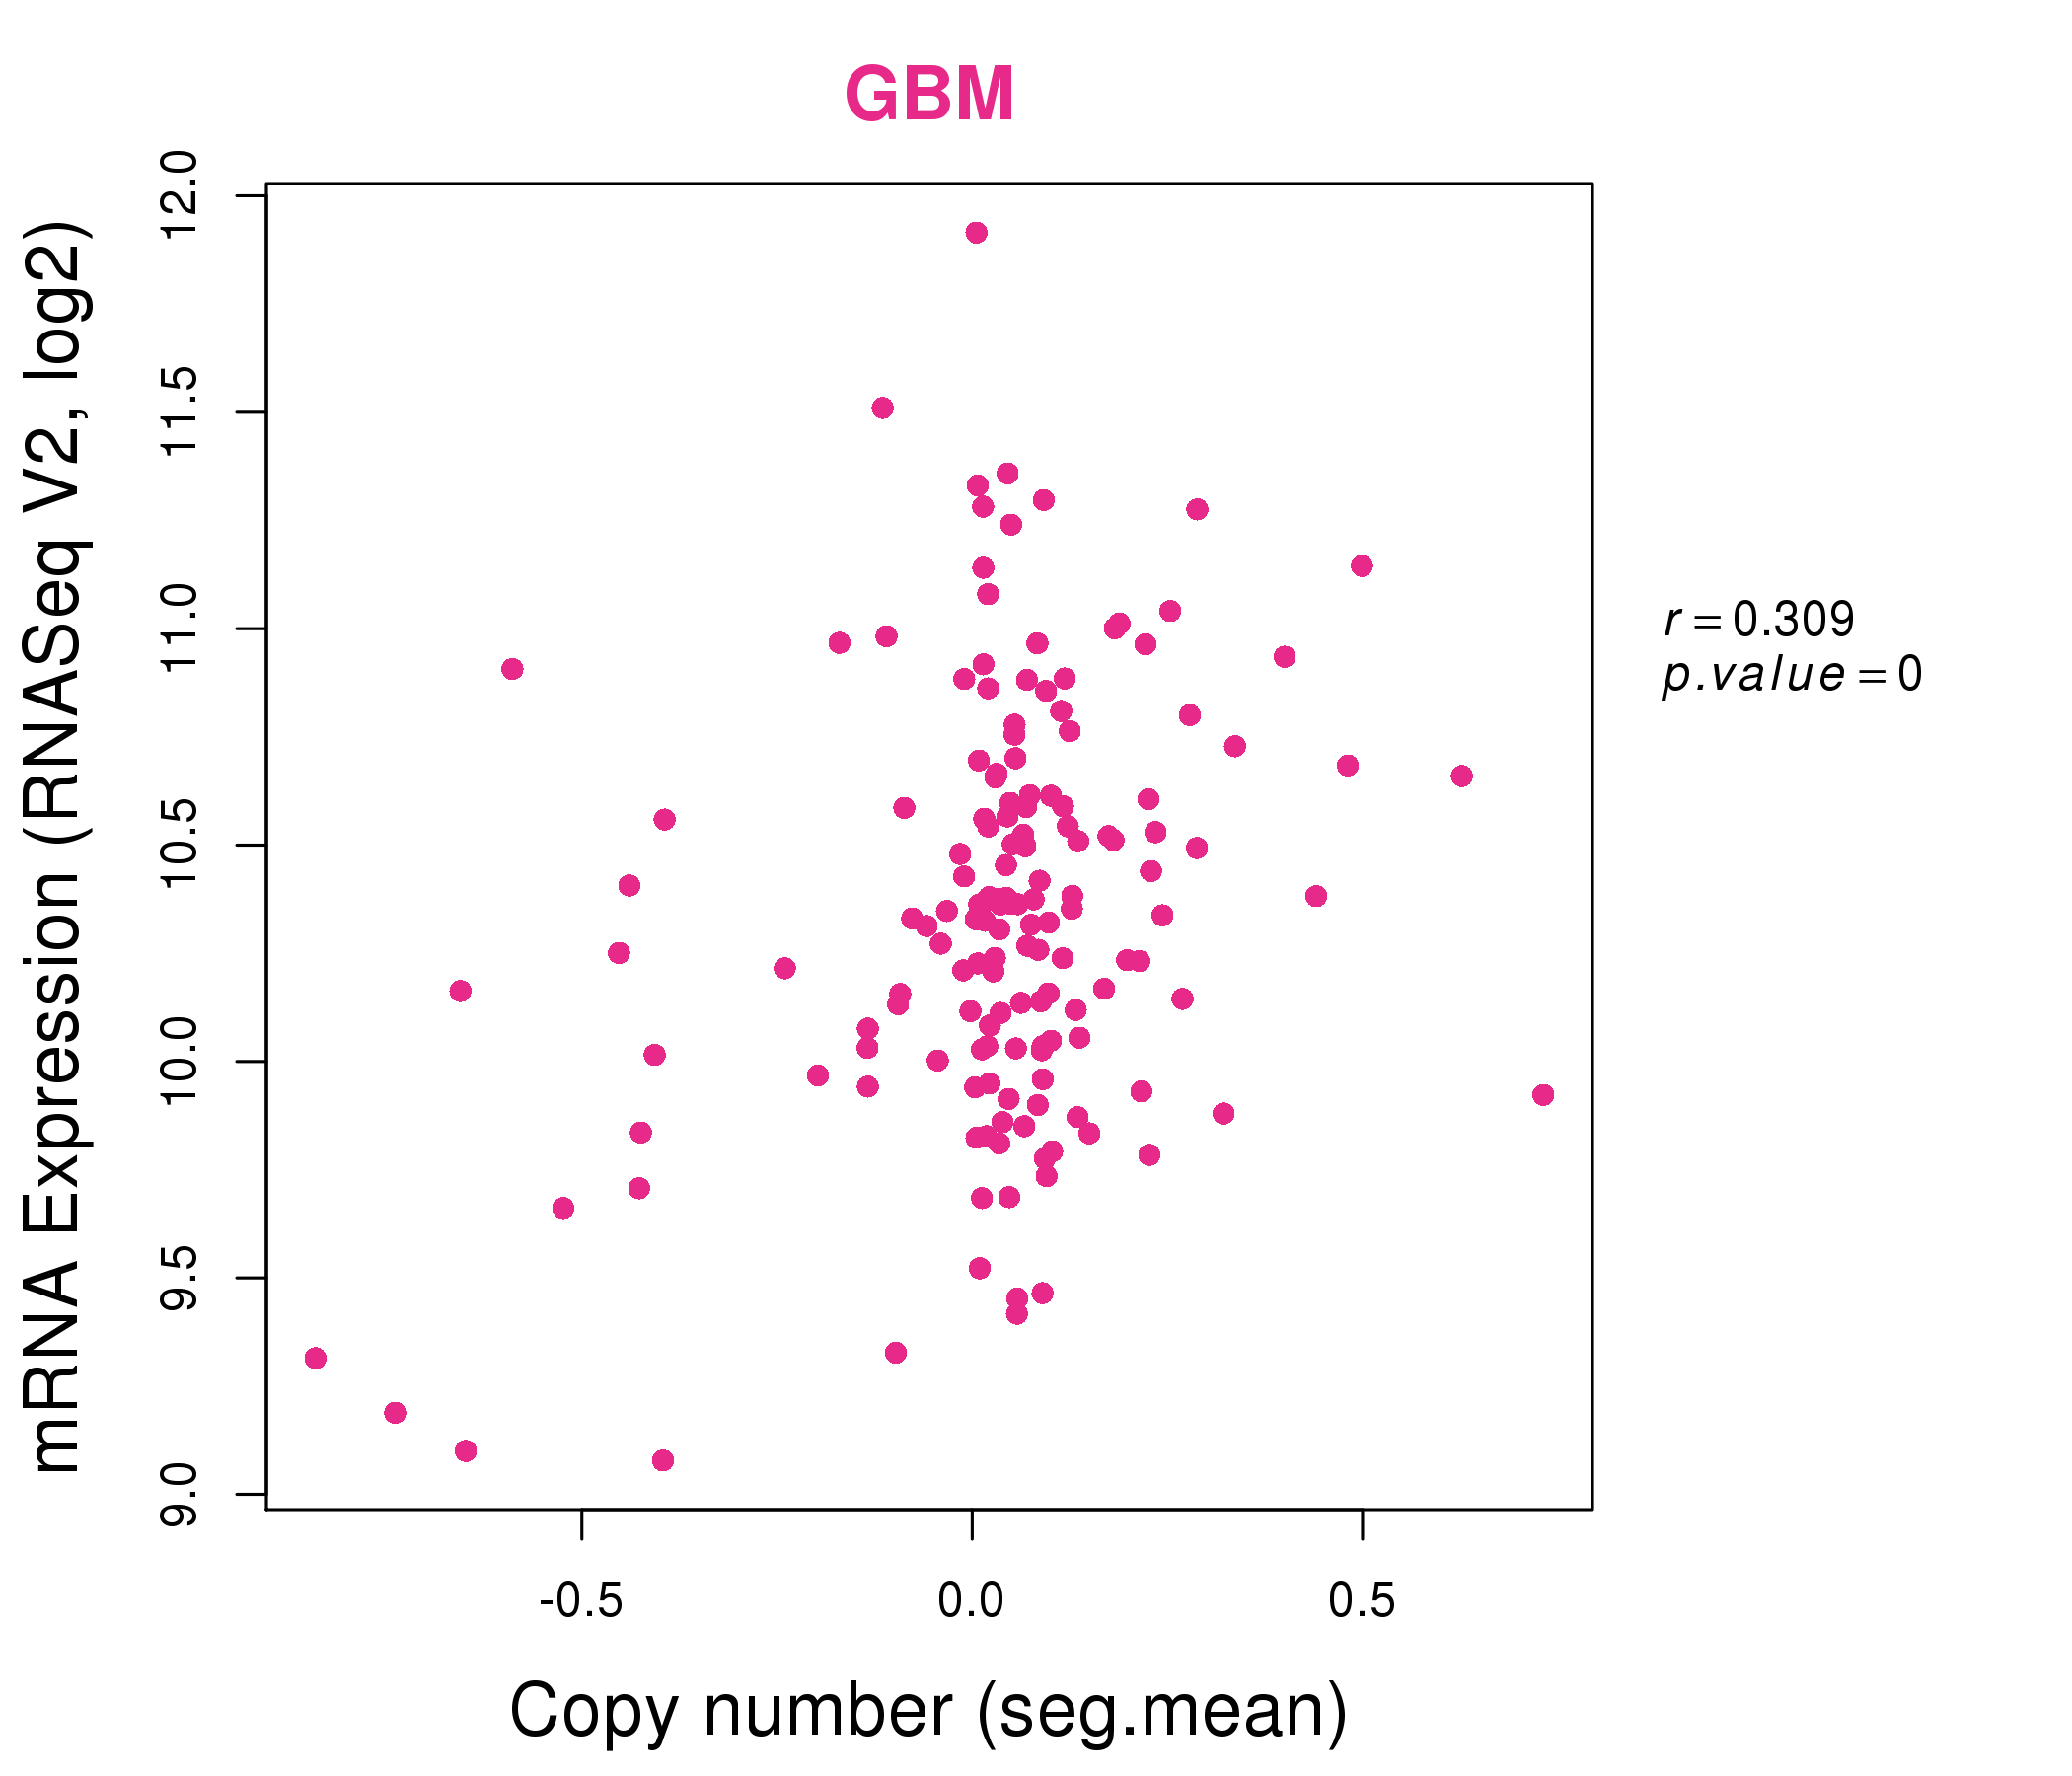
| * Normalized gene expression data of RNASeqV2 was extracted from TCGA using R package TCGA-Assembler. The URLs of all public data files on TCGA DCC data server were gathered at Jan-05-2015. Only eight cancer types have enough normal control samples for differential expression analysis. (t test, adjusted p<0.05 (using Benjamini-Hochberg FDR)) |
 |
| Top |
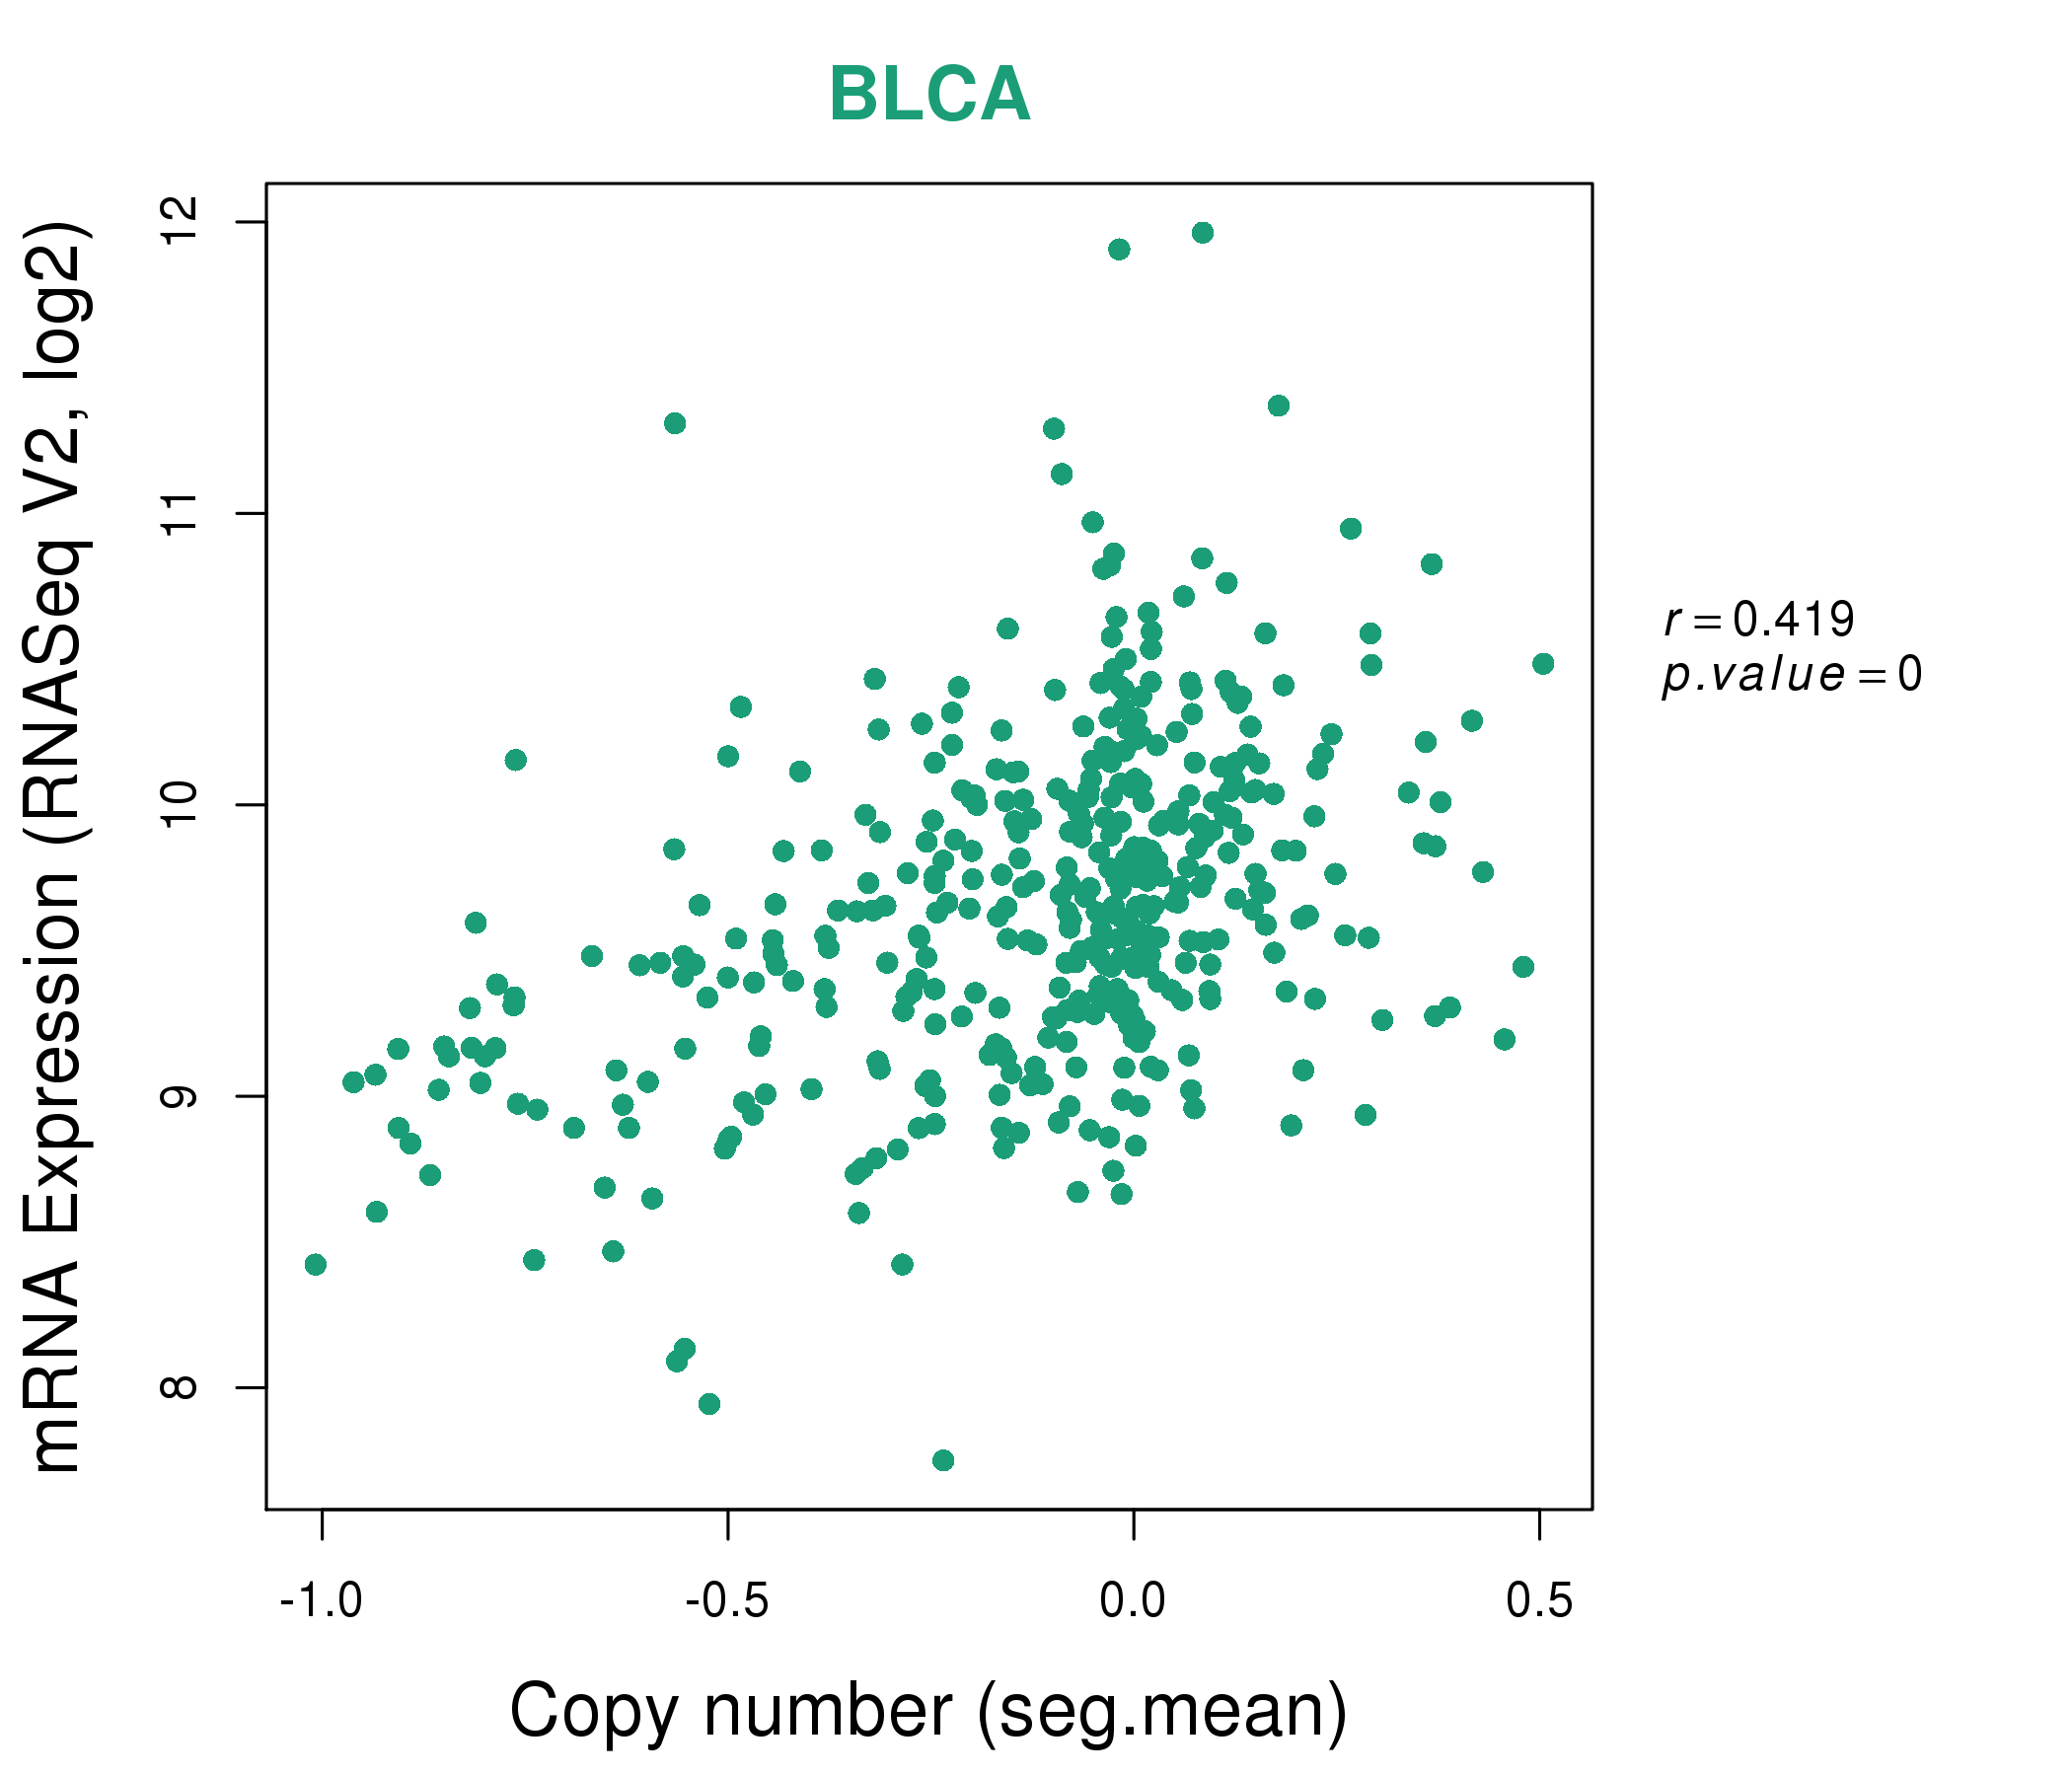
| * This plots show the correlation between CNV and gene expression. |
: Open all plots for all cancer types
 |
|
 |
|
| Top |
| Gene-Gene Network Information |
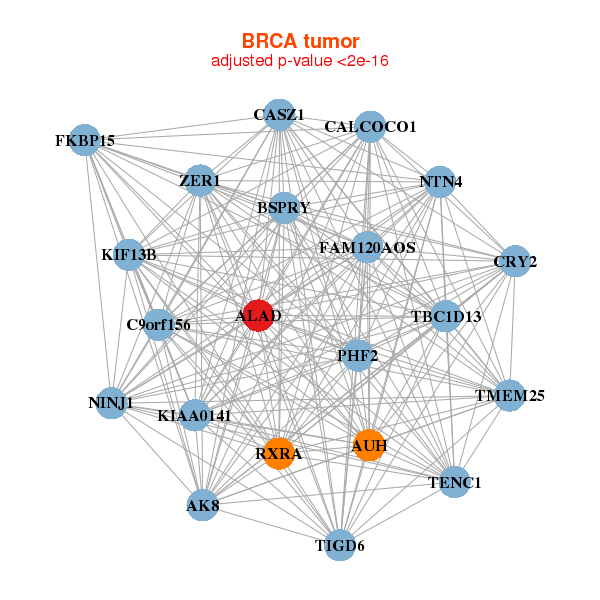
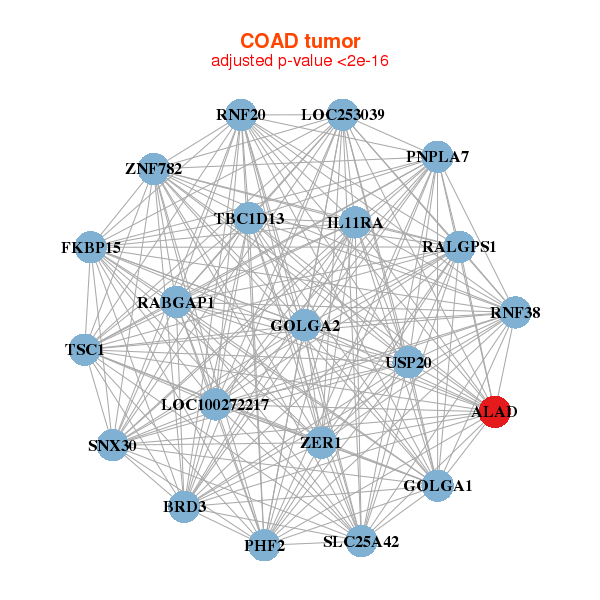
| * Co-Expression network figures were drawn using R package igraph. Only the top 20 genes with the highest correlations were shown. Red circle: input gene, orange circle: cell metabolism gene, sky circle: other gene |
: Open all plots for all cancer types
 |
| ||||
| ALAD,AUH,BSPRY,C9orf156,AK8,CALCOCO1,CASZ1, CRY2,FAM120AOS,FKBP15,KIAA0141,KIF13B,NINJ1,NTN4, PHF2,RXRA,TBC1D13,TENC1,TIGD6,TMEM25,ZER1 | ALAD,BCL2L2,BHMT2,DHDDS,EPB41L1,GCOM1,GLYAT, GPD1,ITPK1,KANK1,CTIF,LEP,MCAM,MYO1C, PLIN4,PYGL,RETSAT,TBC1D9B,TFE3,TNIP1,TNS1 | ||||
 |
| ||||
| ALAD,BRD3,FKBP15,GOLGA1,GOLGA2,IL11RA,LOC100272217, LOC253039,PHF2,PNPLA7,RABGAP1,RALGPS1,RNF20,RNF38, SLC25A42,SNX30,TBC1D13,TSC1,USP20,ZER1,ZNF782 | ALAD,ATG9A,CTDSP1,EIF4EBP2,FAM63A,ARHGAP35,H1F0, HECA,IQSEC2,LOC283267,LOC90110,NAIF1,NBR1,P4HA2, PINK1,SLC25A23,TADA2B,TLE3,ZFYVE1,ZNF768,ZNF821 |
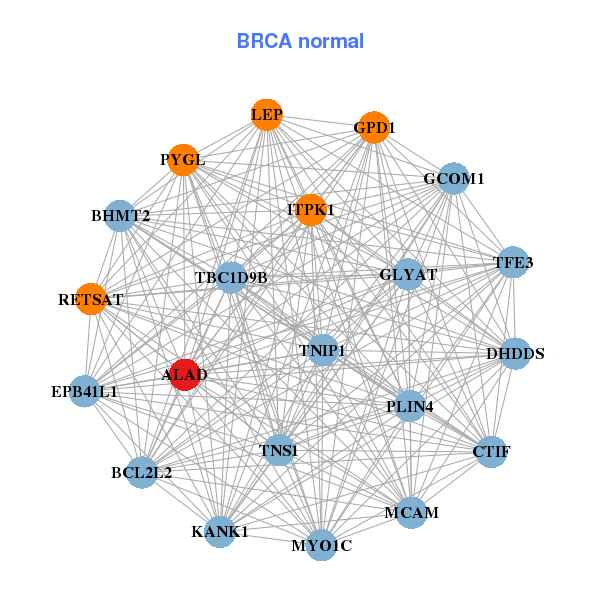
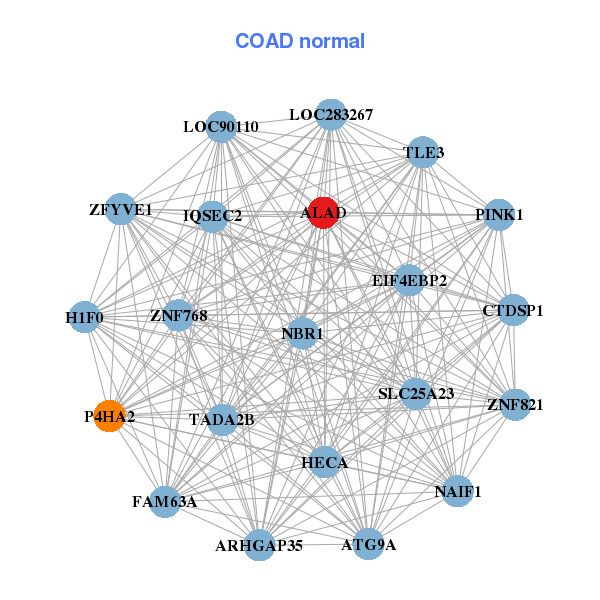
| * Co-Expression network figures were drawn using R package igraph. Only the top 20 genes with the highest correlations were shown. Red circle: input gene, orange circle: cell metabolism gene, sky circle: other gene |
: Open all plots for all cancer types
| Top |
: Open all interacting genes' information including KEGG pathway for all interacting genes from DAVID
| Top |
| Pharmacological Information for ALAD |
| DB Category | DB Name | DB's ID and Url link |
| * Gene Centered Interaction Network. |
 |
| * Drug Centered Interaction Network. |
| DrugBank ID | Target Name | Drug Groups | Generic Name | Drug Centered Network | Drug Structure |
| DB00855 | aminolevulinate dehydratase | approved | Aminolevulinic acid | 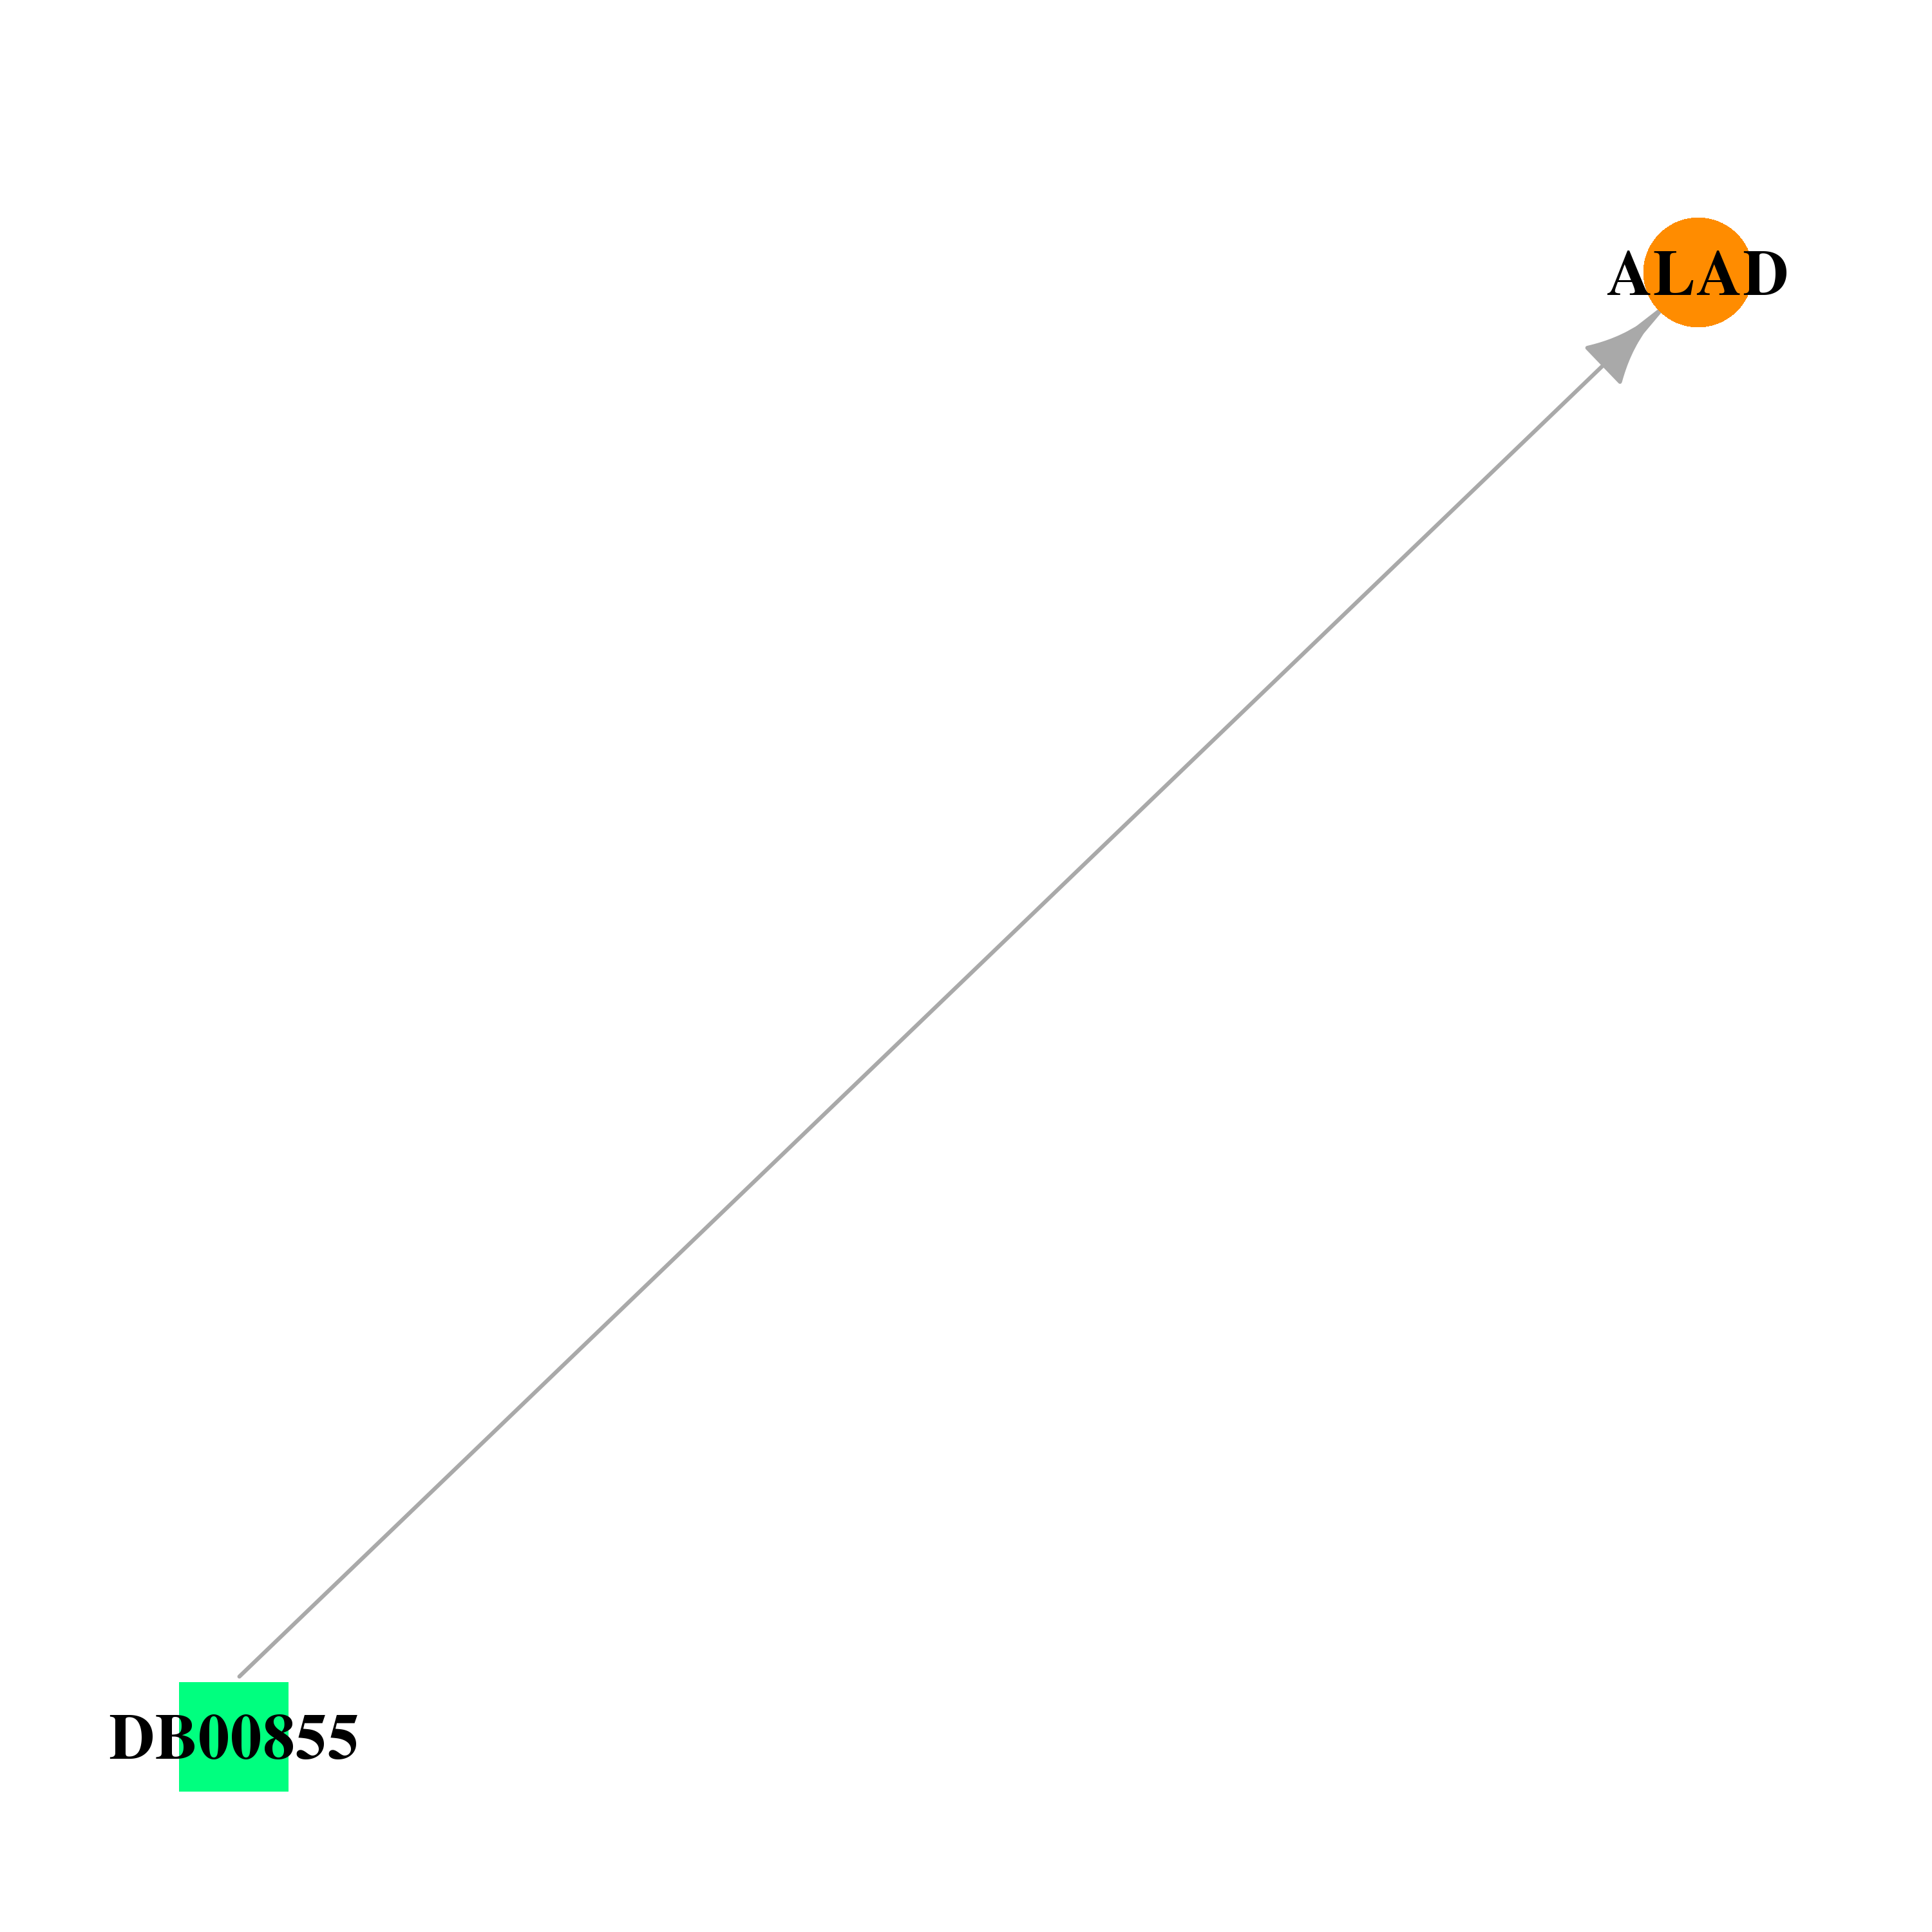 |  |
| DB02068 | aminolevulinate dehydratase | experimental | Delta-Amino Valeric Acid | 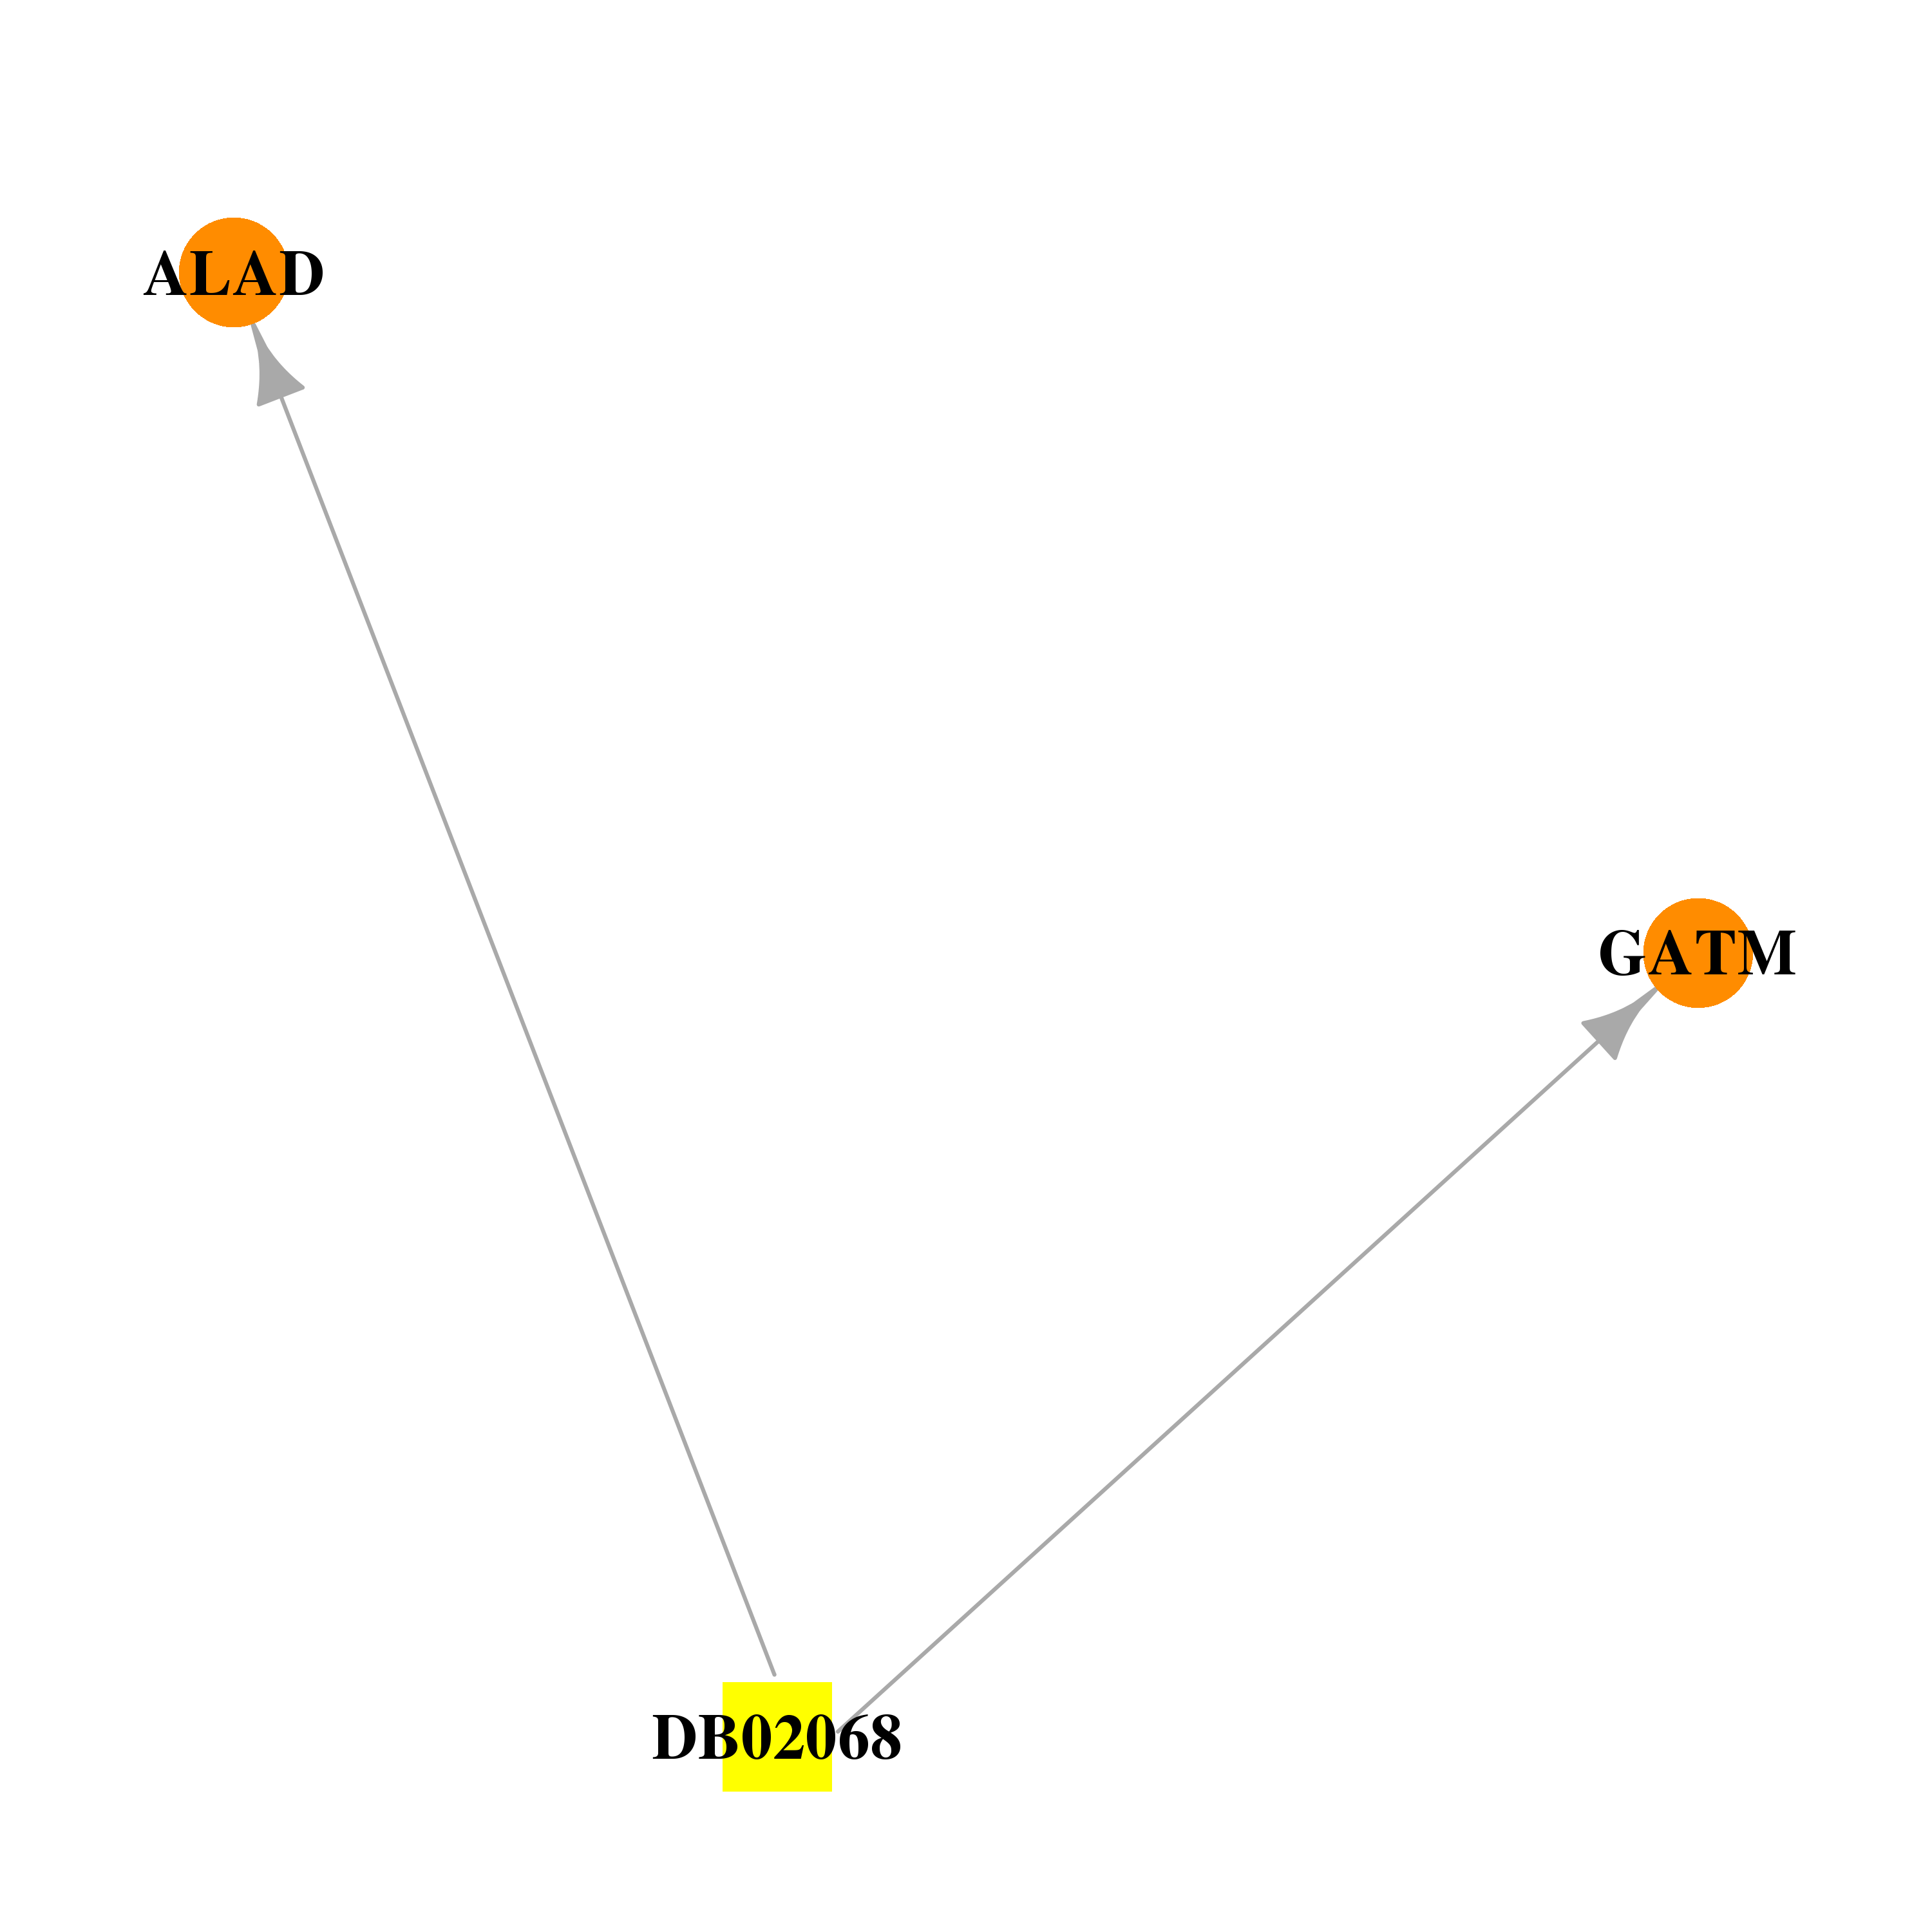 |  |
| DB02239 | aminolevulinate dehydratase | experimental | Laevulinic Acid |  |  |
| DB02260 | aminolevulinate dehydratase | experimental | 4-Oxosebacic Acid |  |  |
| DB02272 | aminolevulinate dehydratase | experimental | Porphobilinogen | 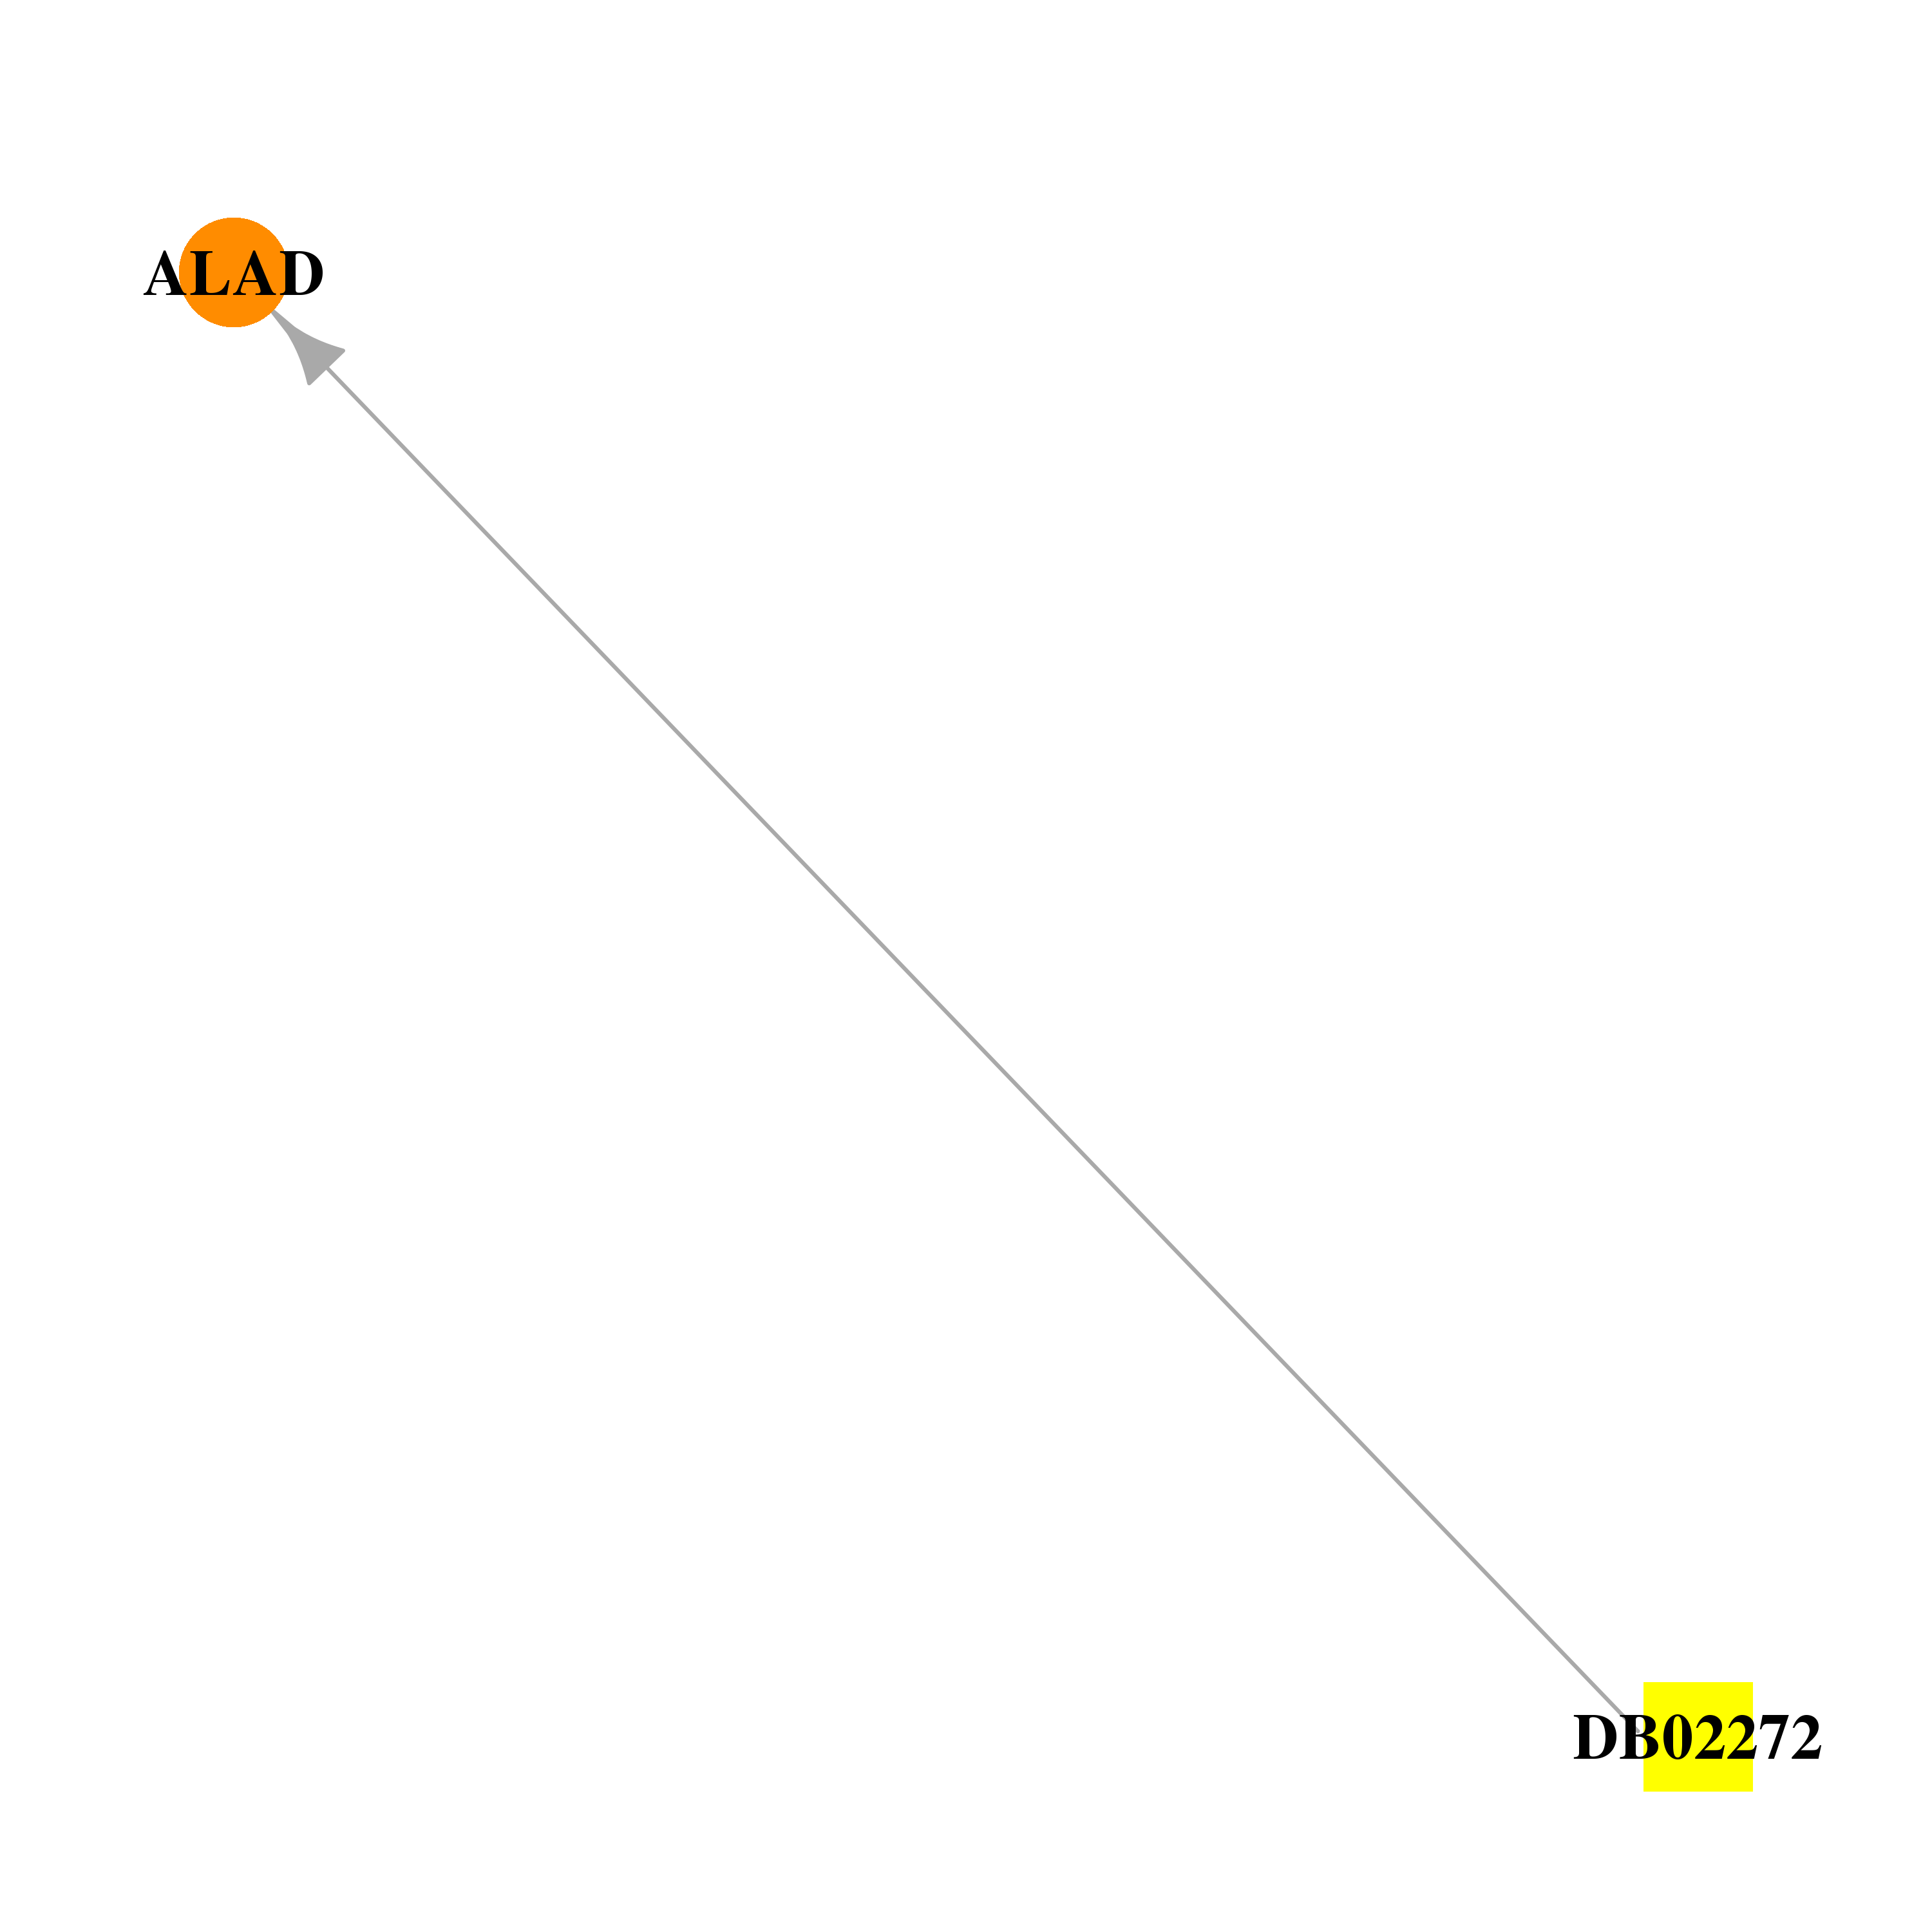 | 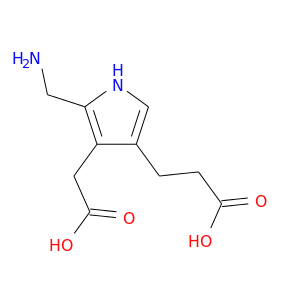 |
| DB02878 | aminolevulinate dehydratase | experimental | 3-(2-Aminoethyl)-4-(Aminomethyl)Heptanedioic Acid | 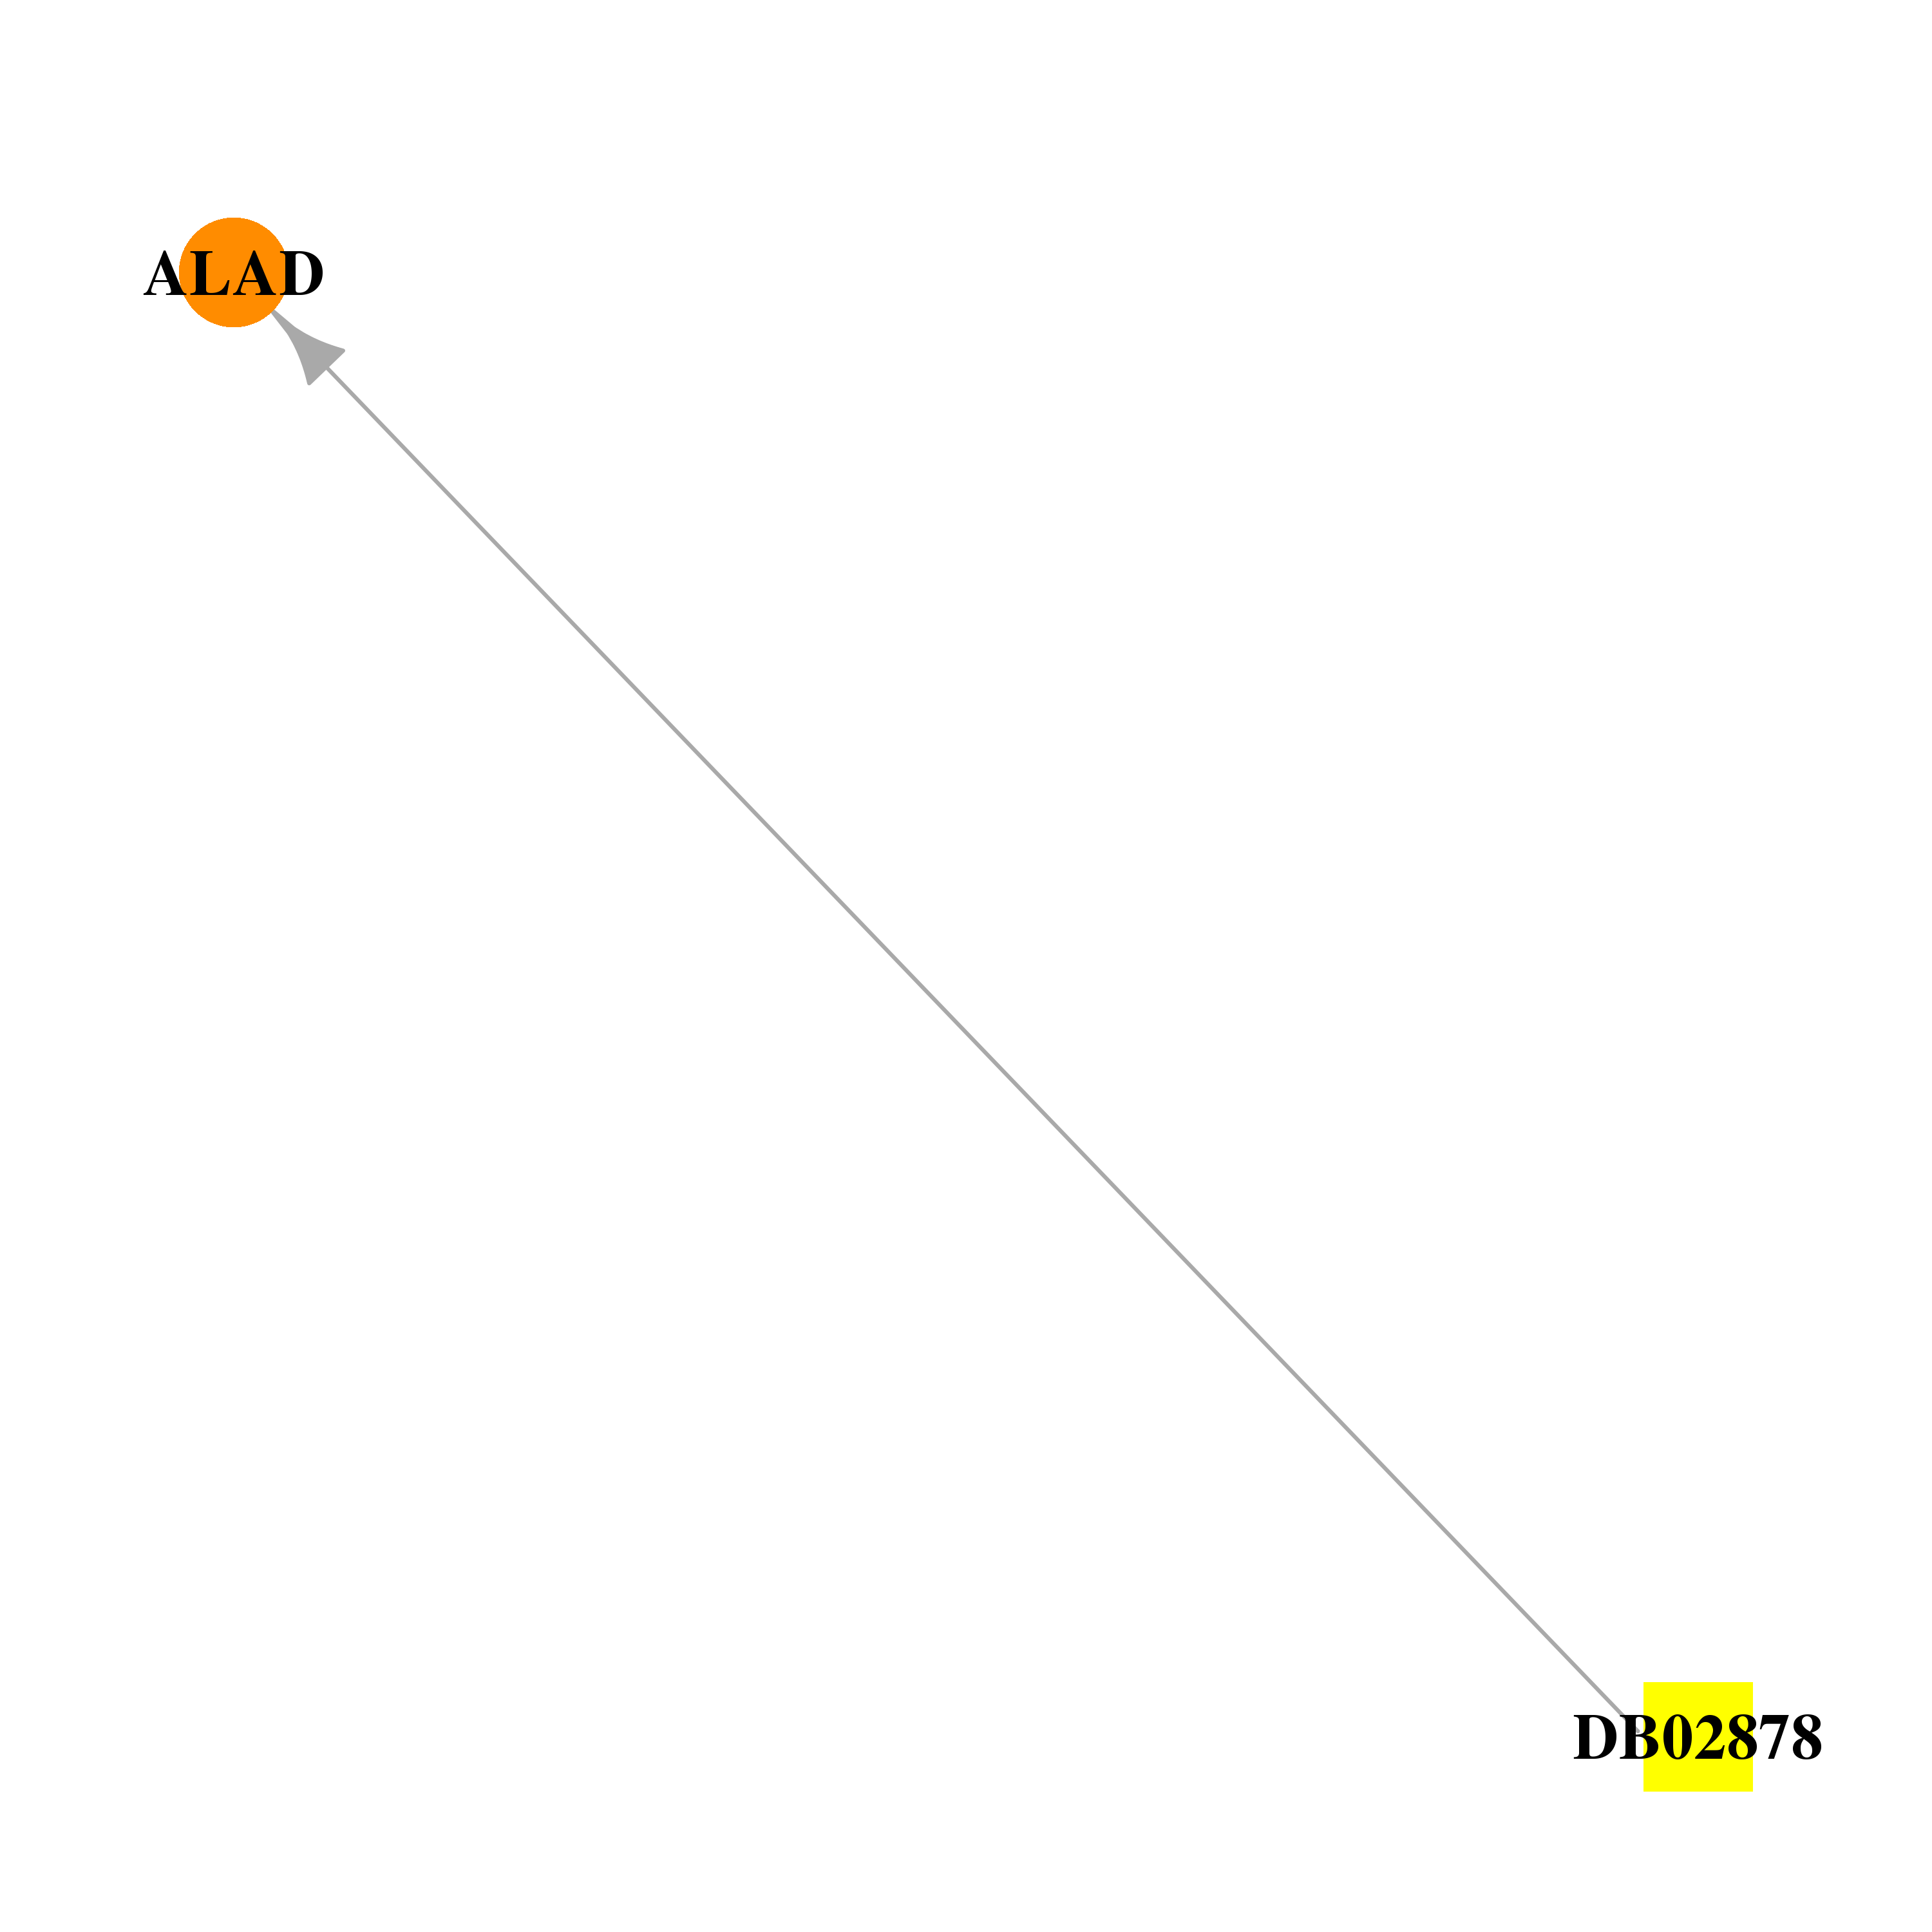 |  |
| DB04560 | aminolevulinate dehydratase | experimental | 4,7-Dioxosebacic Acid | 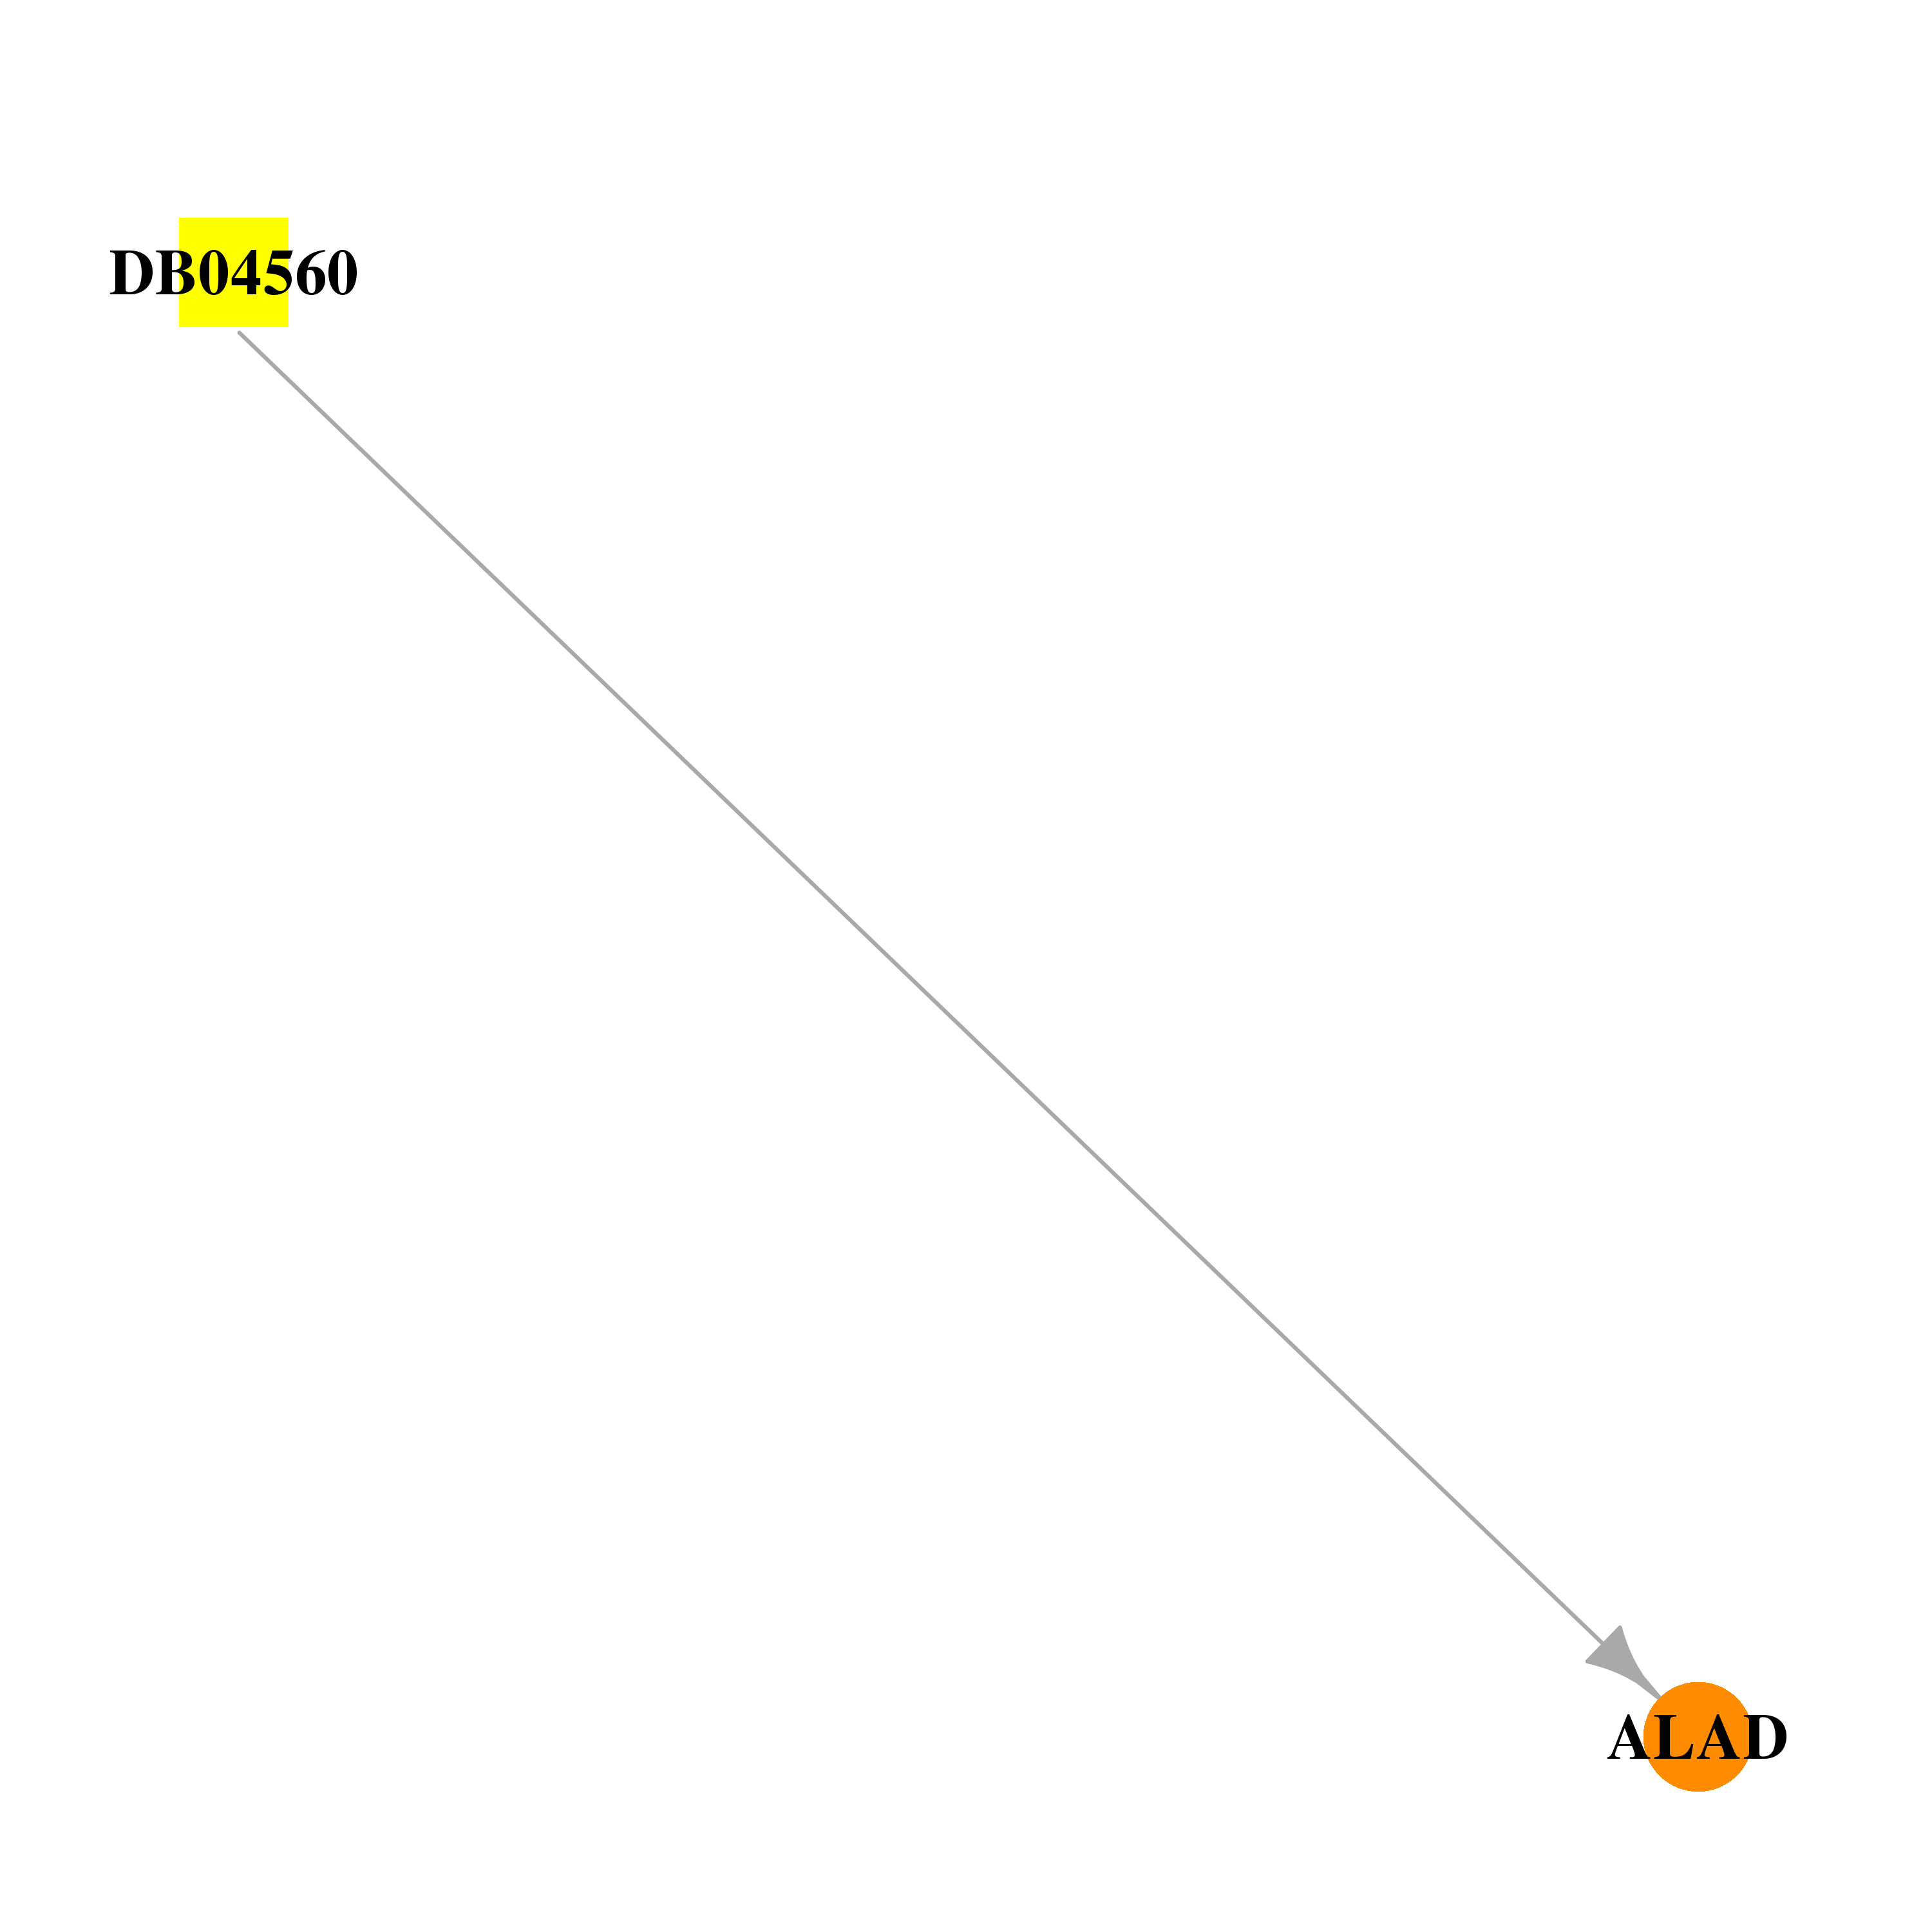 | 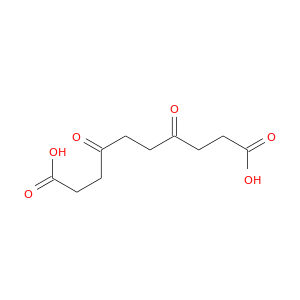 |
| DB04781 | aminolevulinate dehydratase | experimental | 5-hydroxyvaleric acid |  |  |
| DB01942 | aminolevulinate dehydratase | experimental | Formic Acid |  | 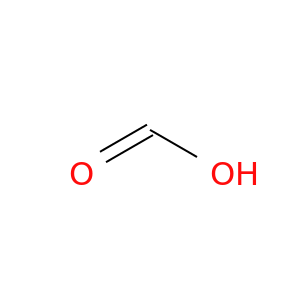 |
| DB02828 | aminolevulinate dehydratase | experimental | 5-Fluorolevulinic Acid | 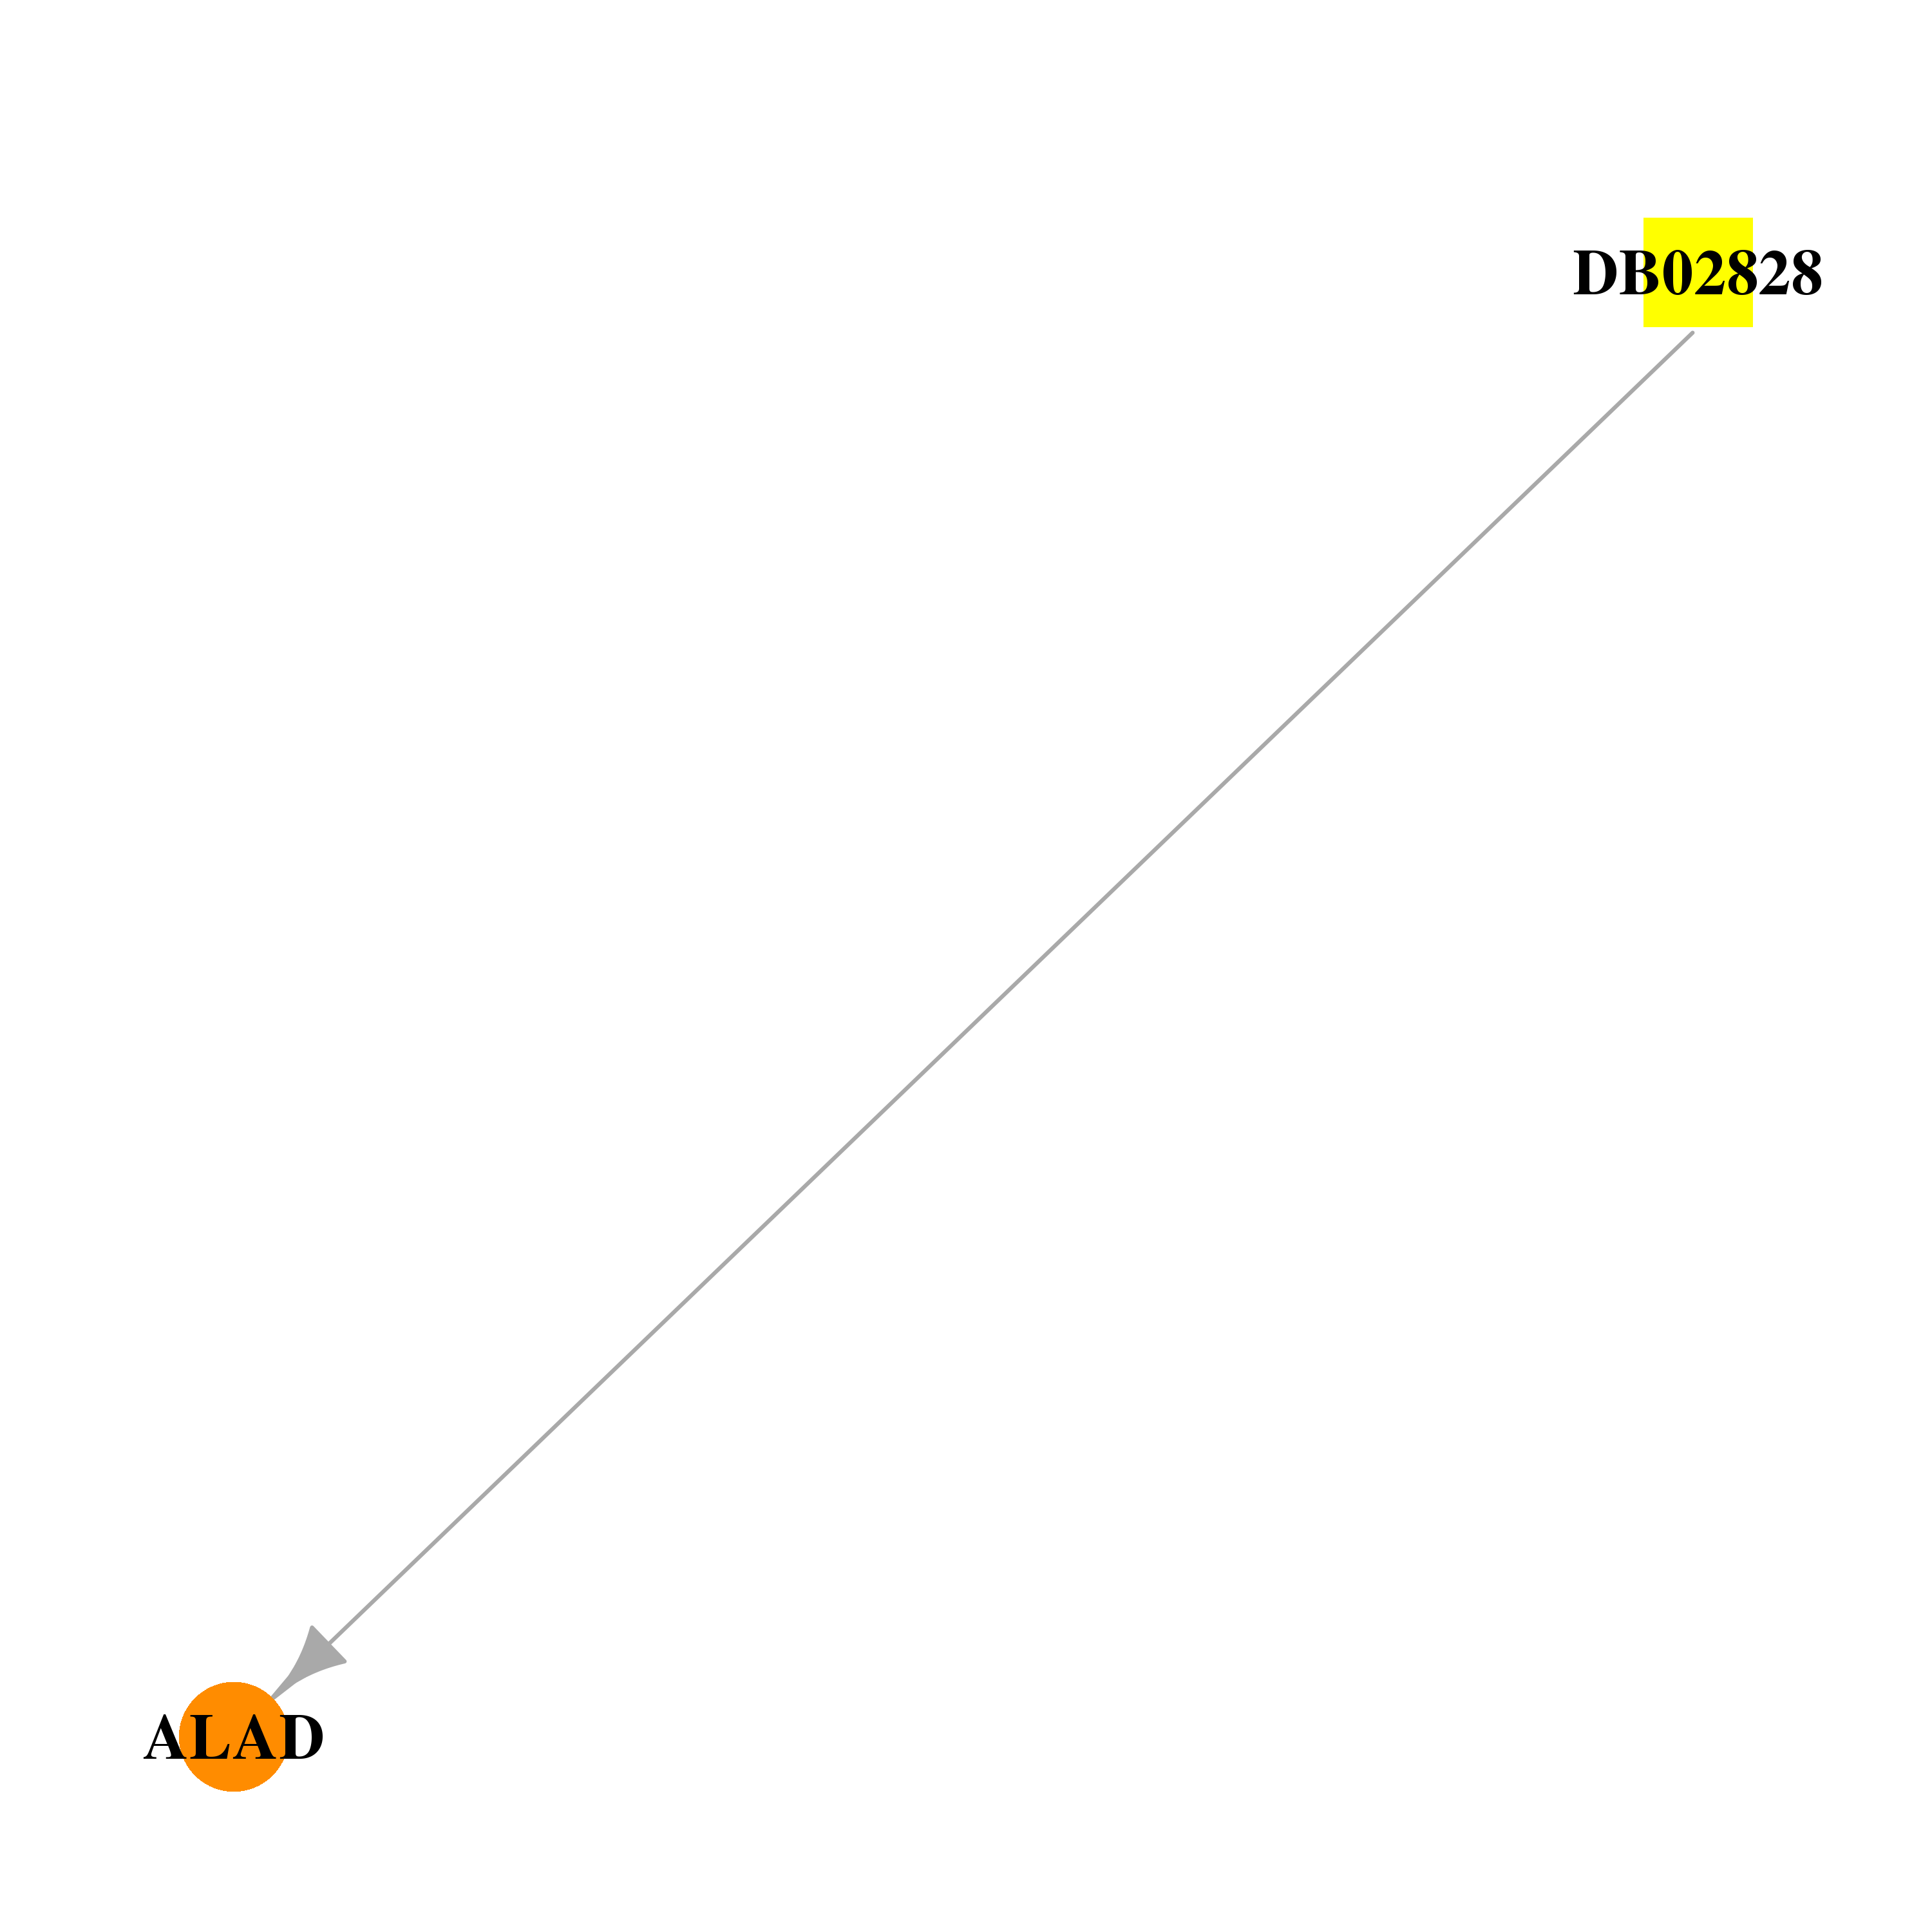 | 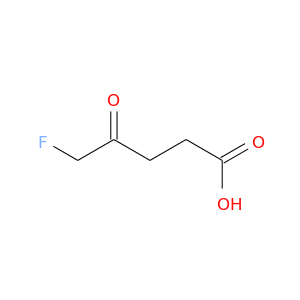 |
| DB04530 | aminolevulinate dehydratase | experimental | S,S-(2-Hydroxyethyl)Thiocysteine | 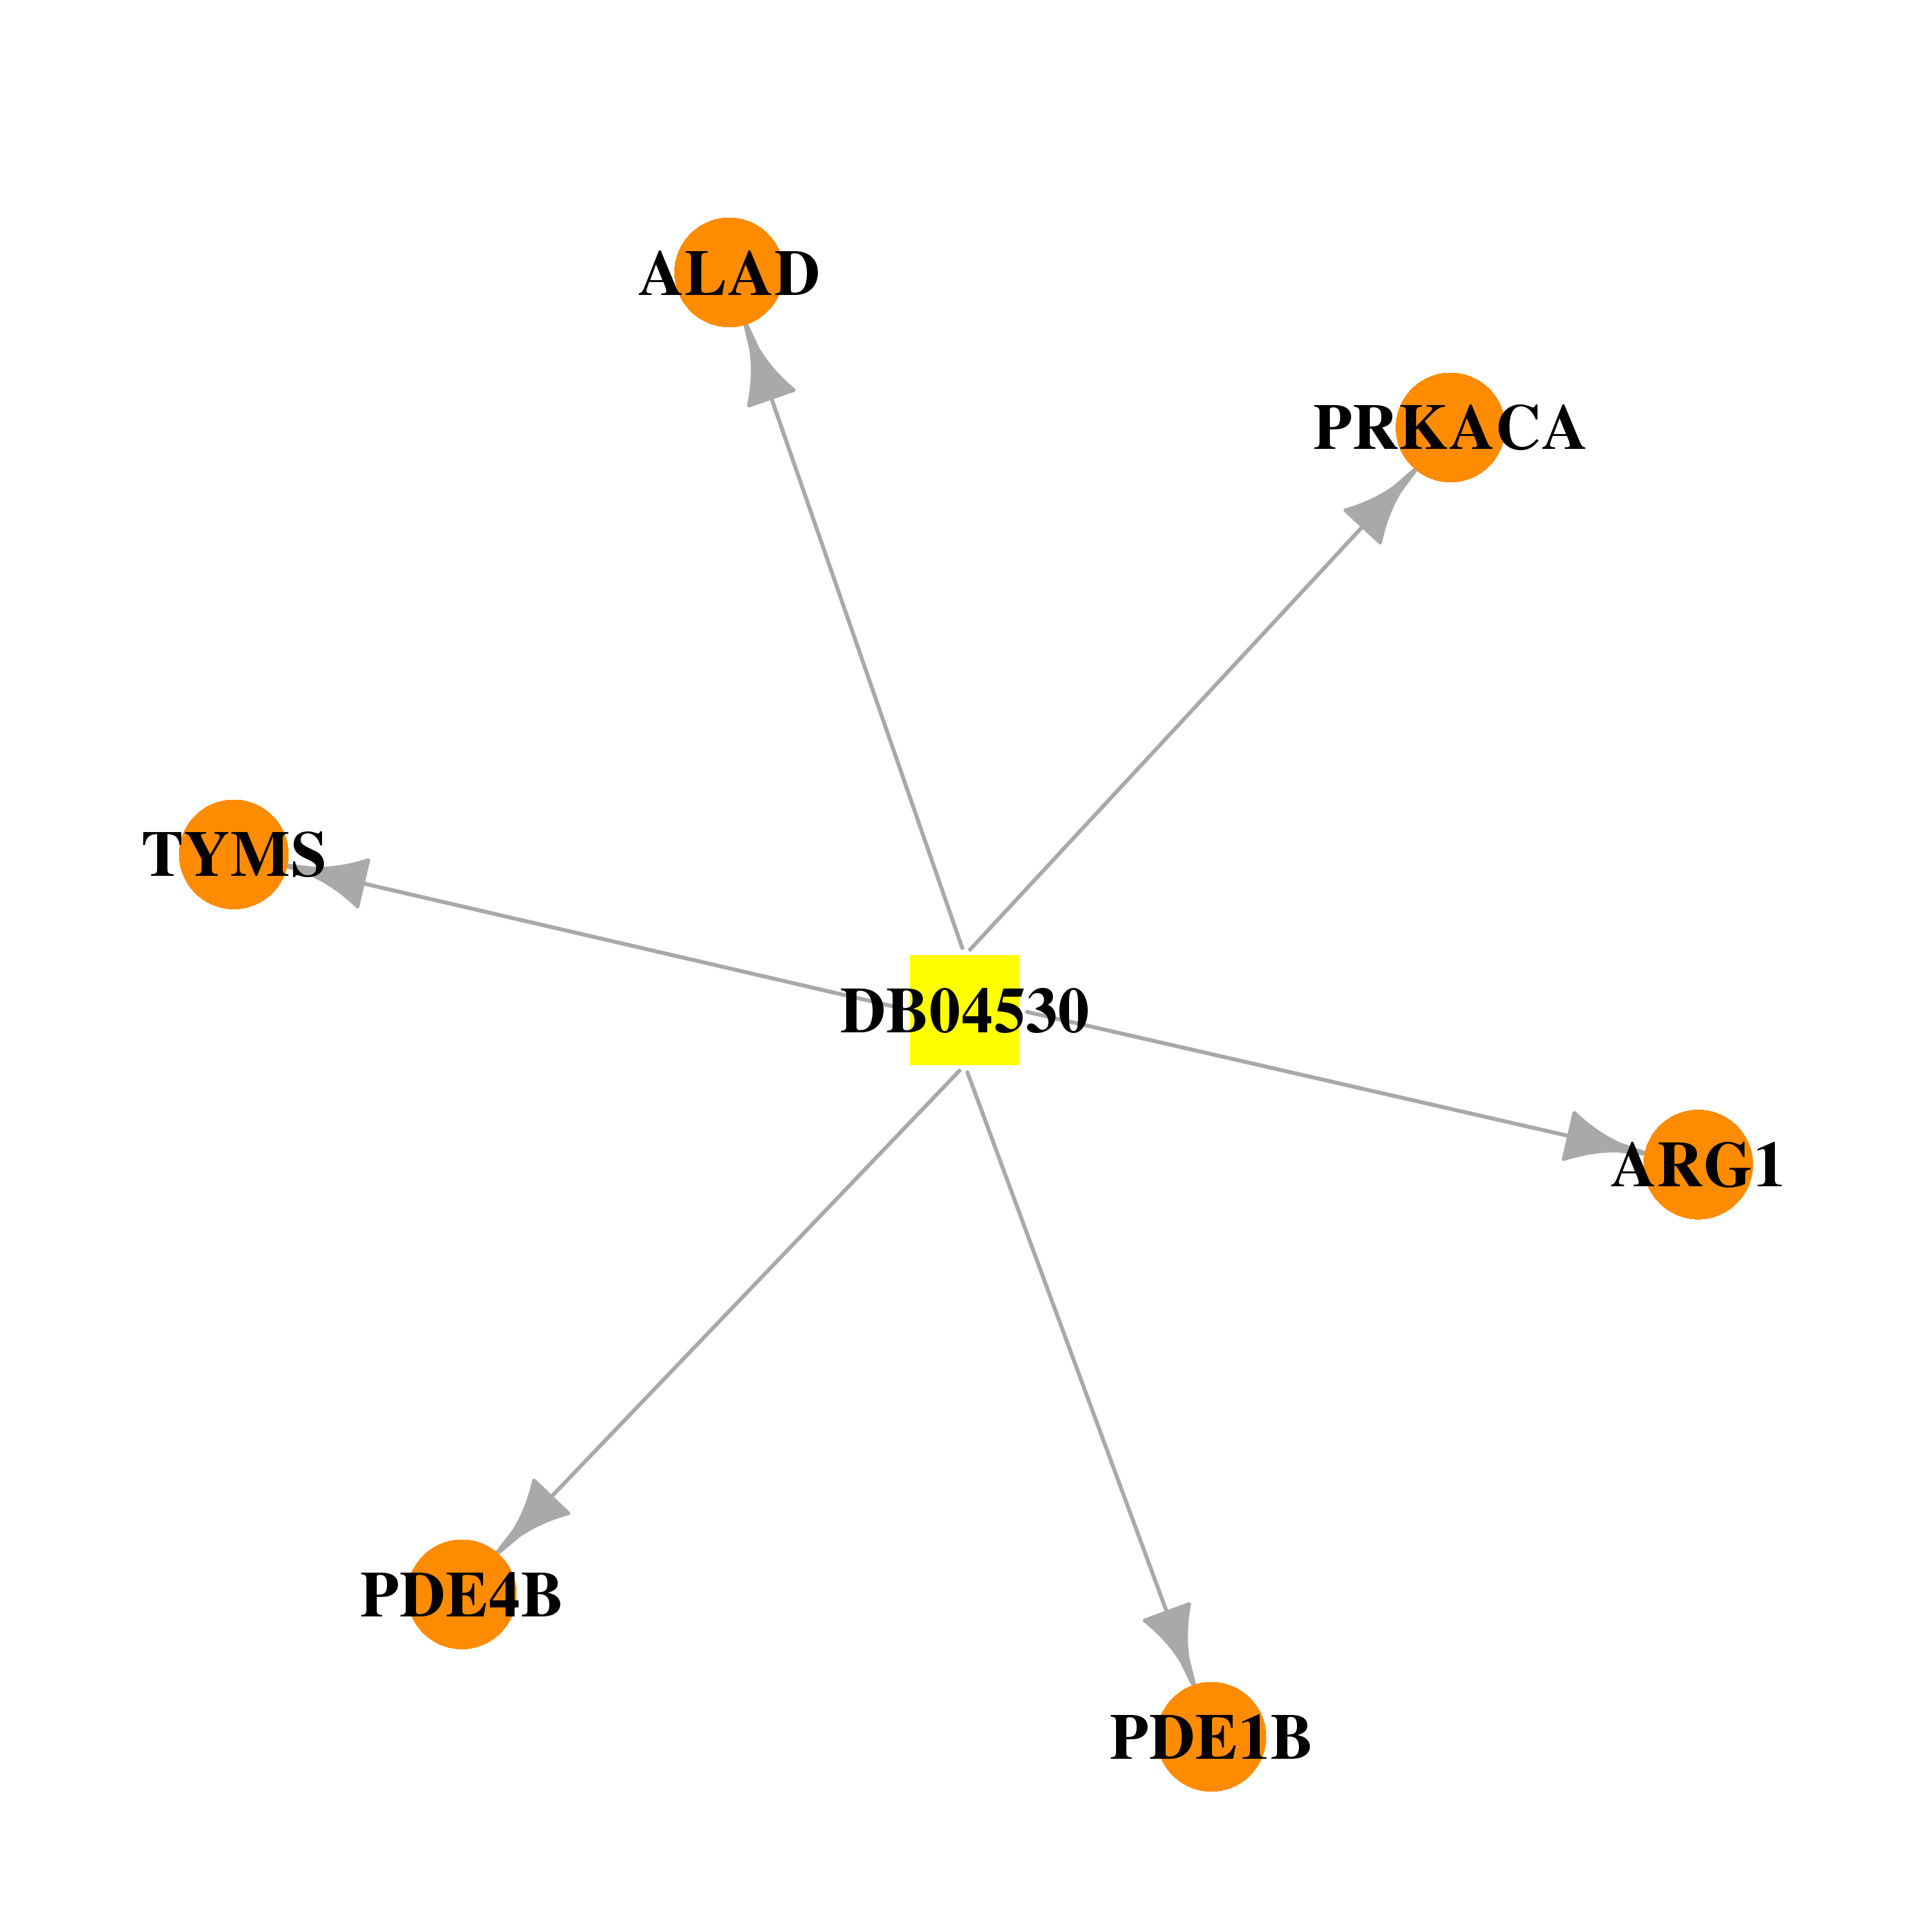 | 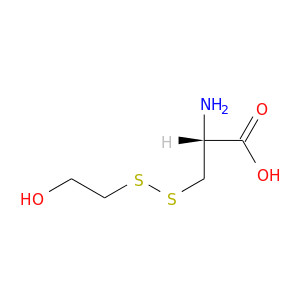 |
| DB00145 | aminolevulinate dehydratase | approved; nutraceutical | Glycine |  |  |
| Top |
| Cross referenced IDs for ALAD |
| * We obtained these cross-references from Uniprot database. It covers 150 different DBs, 18 categories. http://www.uniprot.org/help/cross_references_section |
: Open all cross reference information
|
Copyright © 2016-Present - The Univsersity of Texas Health Science Center at Houston @ |