|
|||||||||||||||||||||||||||||||||||||||||||||||||||||||||||||||||||||||||||||||||||||||||||||||||||||||||||||||||||||||||||||||||||||||||||||||||||||||||||||||||||||||||||||||||||||||||||||||||||||||||||||||||||||||||||||||||||||||||||||||||||||||||||||||||||||||||||||||||||||||||||||||||||||||||||||||||||||||||||||||||||||||||||||||||||
| |
| Phenotypic Information (metabolism pathway, cancer, disease, phenome) |
| |
| |
| Gene-Gene Network Information: Co-Expression Network, Interacting Genes & KEGG |
| |
|


| Gene Summary for ALAS1 |
| Basic gene info. | Gene symbol | ALAS1 |
| Gene name | 5'-aminolevulinate synthase 1 | |
| Synonyms | ALAS|ALAS3|ALASH|MIG4 | |
| Cytomap | UCSC genome browser: 3p21.1 | |
| Genomic location | chr3 :52232098-52248343 | |
| Type of gene | protein-coding | |
| RefGenes | NM_000688.5, NM_199166.2, | |
| Ensembl id | ENSG00000023330 | |
| Description | 5-aminolevulinate synthase, nonspecific, mitochondrial5-aminolevulinic acid synthase 1ALAS-Haminolevulinate, delta-, synthase 1delta-ALA synthase 1delta-aminolevulinate synthase 1migration-inducing protein 4 | |
| Modification date | 20141207 | |
| dbXrefs | MIM : 125290 | |
| HGNC : HGNC | ||
| Ensembl : ENSG00000023330 | ||
| HPRD : 00505 | ||
| Vega : OTTHUMG00000158108 | ||
| Protein | UniProt: go to UniProt's Cross Reference DB Table | |
| Expression | CleanEX: HS_ALAS1 | |
| BioGPS: 211 | ||
| Gene Expression Atlas: ENSG00000023330 | ||
| The Human Protein Atlas: ENSG00000023330 | ||
| Pathway | NCI Pathway Interaction Database: ALAS1 | |
| KEGG: ALAS1 | ||
| REACTOME: ALAS1 | ||
| ConsensusPathDB | ||
| Pathway Commons: ALAS1 | ||
| Metabolism | MetaCyc: ALAS1 | |
| HUMANCyc: ALAS1 | ||
| Regulation | Ensembl's Regulation: ENSG00000023330 | |
| miRBase: chr3 :52,232,098-52,248,343 | ||
| TargetScan: NM_000688 | ||
| cisRED: ENSG00000023330 | ||
| Context | iHOP: ALAS1 | |
| cancer metabolism search in PubMed: ALAS1 | ||
| UCL Cancer Institute: ALAS1 | ||
| Assigned class in ccmGDB | C | |
| Top |
| Phenotypic Information for ALAS1(metabolism pathway, cancer, disease, phenome) |
| Cancer | CGAP: ALAS1 |
| Familial Cancer Database: ALAS1 | |
| * This gene is included in those cancer gene databases. |
|
|
|
|
|
|
| |||||||||||||||||||||||||||||||||||||||||||||||||||||||||||||||||||||||||||||||||||||||||||||||||||||||||||||||||||||||||||||||||||||||||||||||||||||||||||||||||||||||||||||||||||||||||||||||||||||||||||||||||||||||||||||||||||||||||||||||||||||||||||||||||||||||||||||||||||||||||||||||||||||||||||||||||||||||||||||||||||||||||||||
Oncogene 1 | Significant driver gene in | ||||||||||||||||||||||||||||||||||||||||||||||||||||||||||||||||||||||||||||||||||||||||||||||||||||||||||||||||||||||||||||||||||||||||||||||||||||||||||||||||||||||||||||||||||||||||||||||||||||||||||||||||||||||||||||||||||||||||||||||||||||||||||||||||||||||||||||||||||||||||||||||||||||||||||||||||||||||||||||||||||||||||||||||||||
| cf) number; DB name 1 Oncogene; http://nar.oxfordjournals.org/content/35/suppl_1/D721.long, 2 Tumor Suppressor gene; https://bioinfo.uth.edu/TSGene/, 3 Cancer Gene Census; http://www.nature.com/nrc/journal/v4/n3/abs/nrc1299.html, 4 CancerGenes; http://nar.oxfordjournals.org/content/35/suppl_1/D721.long, 5 Network of Cancer Gene; http://ncg.kcl.ac.uk/index.php, 1Therapeutic Vulnerabilities in Cancer; http://cbio.mskcc.org/cancergenomics/statius/ |
| KEGG_GLYCINE_SERINE_AND_THREONINE_METABOLISM KEGG_PORPHYRIN_AND_CHLOROPHYLL_METABOLISM REACTOME_METABOLISM_OF_LIPIDS_AND_LIPOPROTEINS REACTOME_METABOLISM_OF_PORPHYRINS | |
| OMIM | |
| Orphanet | |
| Disease | KEGG Disease: ALAS1 |
| MedGen: ALAS1 (Human Medical Genetics with Condition) | |
| ClinVar: ALAS1 | |
| Phenotype | MGI: ALAS1 (International Mouse Phenotyping Consortium) |
| PhenomicDB: ALAS1 | |
| Mutations for ALAS1 |
| * Under tables are showing count per each tissue to give us broad intuition about tissue specific mutation patterns.You can go to the detailed page for each mutation database's web site. |
| There's no structural variation information in COSMIC data for this gene. |
| * From mRNA Sanger sequences, Chitars2.0 arranged chimeric transcripts. This table shows ALAS1 related fusion information. |
| ID | Head Gene | Tail Gene | Accession | Gene_a | qStart_a | qEnd_a | Chromosome_a | tStart_a | tEnd_a | Gene_a | qStart_a | qEnd_a | Chromosome_a | tStart_a | tEnd_a |
| CN258752 | ALAS1 | 1 | 253 | 3 | 52248062 | 52248537 | ALAS1 | 250 | 370 | 3 | 52245549 | 52246375 | |
| BE826074 | SRGN | 4 | 314 | 10 | 70855065 | 70855374 | ALAS1 | 302 | 394 | 3 | 52248225 | 52248326 | |
| Top |
| Mutation type/ Tissue ID | brca | cns | cerv | endome | haematopo | kidn | Lintest | liver | lung | ns | ovary | pancre | prost | skin | stoma | thyro | urina | |||
| Total # sample | 1 | |||||||||||||||||||
| GAIN (# sample) | 1 | |||||||||||||||||||
| LOSS (# sample) |
| cf) Tissue ID; Tissue type (1; Breast, 2; Central_nervous_system, 3; Cervix, 4; Endometrium, 5; Haematopoietic_and_lymphoid_tissue, 6; Kidney, 7; Large_intestine, 8; Liver, 9; Lung, 10; NS, 11; Ovary, 12; Pancreas, 13; Prostate, 14; Skin, 15; Stomach, 16; Thyroid, 17; Urinary_tract) |
| Top |
|
 |
| Top |
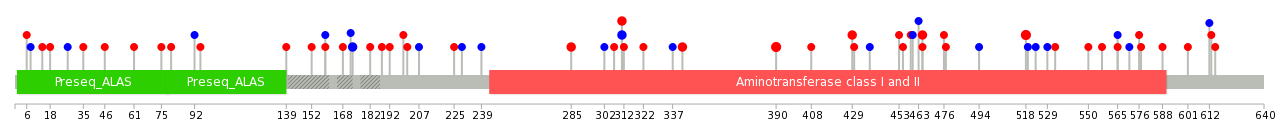
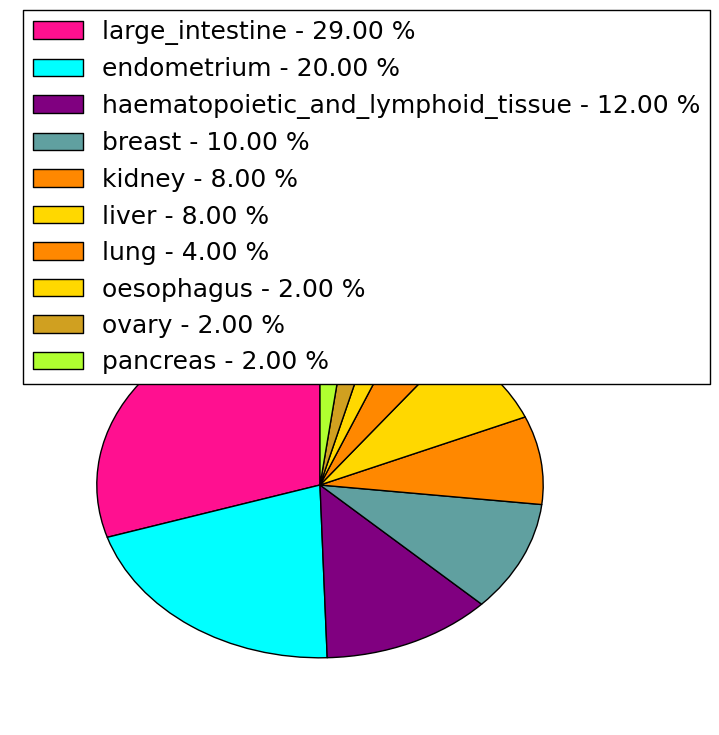
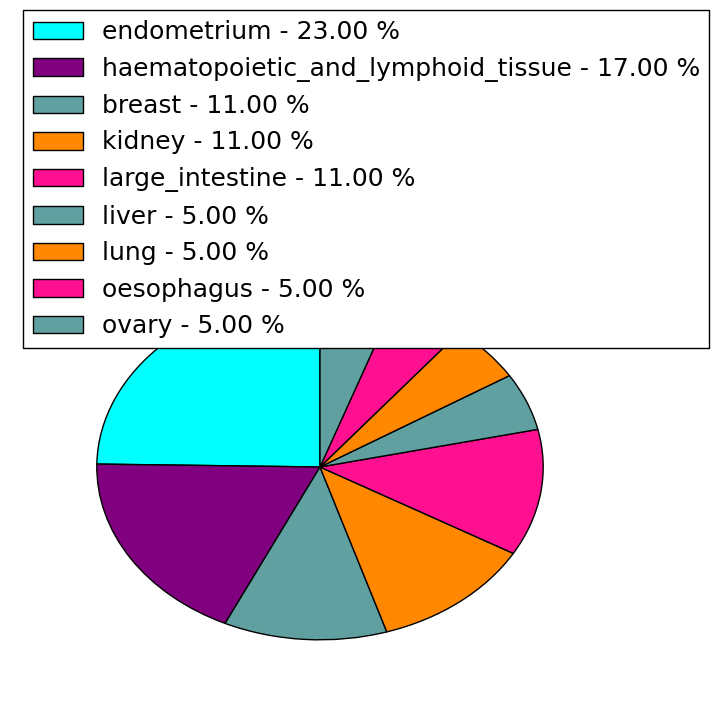
| Stat. for Non-Synonymous SNVs (# total SNVs=48) | (# total SNVs=17) |
 |  |
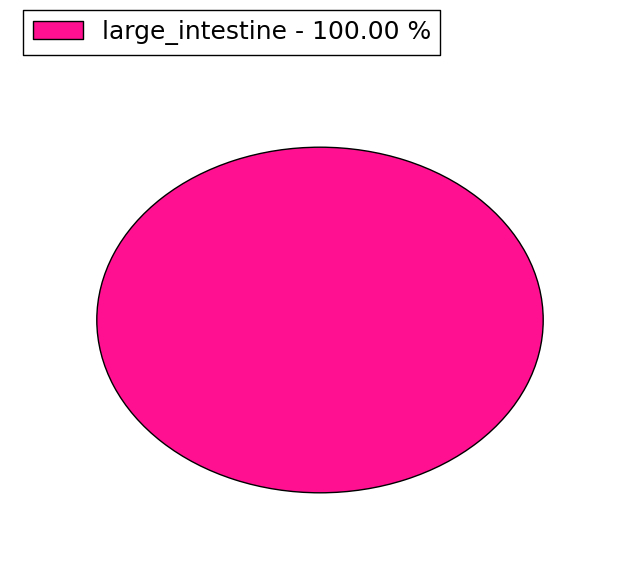
(# total SNVs=1) | (# total SNVs=2) |
 |  |
| Top |
| * When you move the cursor on each content, you can see more deailed mutation information on the Tooltip. Those are primary_site,primary_histology,mutation(aa),pubmedID. |
| GRCh37 position | Mutation(aa) | Unique sampleID count |
| chr3:52245521-52245521 | p.A518G | 3 |
| chr3:52242102-52242102 | p.A390V | 3 |
| chr3:52239985-52239985 | p.S311P | 2 |
| chr3:52238038-52238038 | p.? | 2 |
| chr3:52239987-52239987 | p.S311S | 2 |
| chr3:52233380-52233381 | p.P43fs*24 | 2 |
| chr3:52240628-52240628 | p.M342I | 2 |
| chr3:52237970-52237970 | p.I173I | 2 |
| chr3:52239907-52239907 | p.G285R | 2 |
| chr3:52245362-52245362 | p.R465Q | 2 |
| Top |
|
 |
| Point Mutation/ Tissue ID | 1 | 2 | 3 | 4 | 5 | 6 | 7 | 8 | 9 | 10 | 11 | 12 | 13 | 14 | 15 | 16 | 17 | 18 | 19 | 20 |
| # sample | 3 | 1 | 9 | 1 | 1 | 5 | 1 | 1 | 2 | 2 | 7 | 1 | 12 | |||||||
| # mutation | 3 | 1 | 8 | 1 | 1 | 4 | 1 | 1 | 2 | 2 | 7 | 1 | 13 | |||||||
| nonsynonymous SNV | 3 | 7 | 1 | 3 | 1 | 1 | 1 | 1 | 3 | 9 | ||||||||||
| synonymous SNV | 1 | 1 | 1 | 1 | 1 | 1 | 4 | 1 | 4 |
| cf) Tissue ID; Tissue type (1; BLCA[Bladder Urothelial Carcinoma], 2; BRCA[Breast invasive carcinoma], 3; CESC[Cervical squamous cell carcinoma and endocervical adenocarcinoma], 4; COAD[Colon adenocarcinoma], 5; GBM[Glioblastoma multiforme], 6; Glioma Low Grade, 7; HNSC[Head and Neck squamous cell carcinoma], 8; KICH[Kidney Chromophobe], 9; KIRC[Kidney renal clear cell carcinoma], 10; KIRP[Kidney renal papillary cell carcinoma], 11; LAML[Acute Myeloid Leukemia], 12; LUAD[Lung adenocarcinoma], 13; LUSC[Lung squamous cell carcinoma], 14; OV[Ovarian serous cystadenocarcinoma ], 15; PAAD[Pancreatic adenocarcinoma], 16; PRAD[Prostate adenocarcinoma], 17; SKCM[Skin Cutaneous Melanoma], 18:STAD[Stomach adenocarcinoma], 19:THCA[Thyroid carcinoma], 20:UCEC[Uterine Corpus Endometrial Carcinoma]) |
| Top |
| * We represented just top 10 SNVs. When you move the cursor on each content, you can see more deailed mutation information on the Tooltip. Those are primary_site, primary_histology, mutation(aa), pubmedID. |
| Genomic Position | Mutation(aa) | Unique sampleID count |
| chr3:52242102 | p.A390V,ALAS1 | 3 |
| chr3:52242218 | p.S311P,ALAS1 | 2 |
| chr3:52239907 | p.S311S,ALAS1 | 2 |
| chr3:52239985 | p.R429W,ALAS1 | 2 |
| chr3:52245362 | p.D159Y,ALAS1 | 2 |
| chr3:52237926 | p.K168N,ALAS1 | 2 |
| chr3:52239987 | p.R465Q,ALAS1 | 2 |
| chr3:52237955 | p.G285R,ALAS1 | 2 |
| chr3:52233336 | p.T61N,ALAS1 | 1 |
| chr3:52245566 | p.A557V,ALAS1 | 1 |
| * Copy number data were extracted from TCGA using R package TCGA-Assembler. The URLs of all public data files on TCGA DCC data server were gathered on Jan-05-2015. Function ProcessCNAData in TCGA-Assembler package was used to obtain gene-level copy number value which is calculated as the average copy number of the genomic region of a gene. |
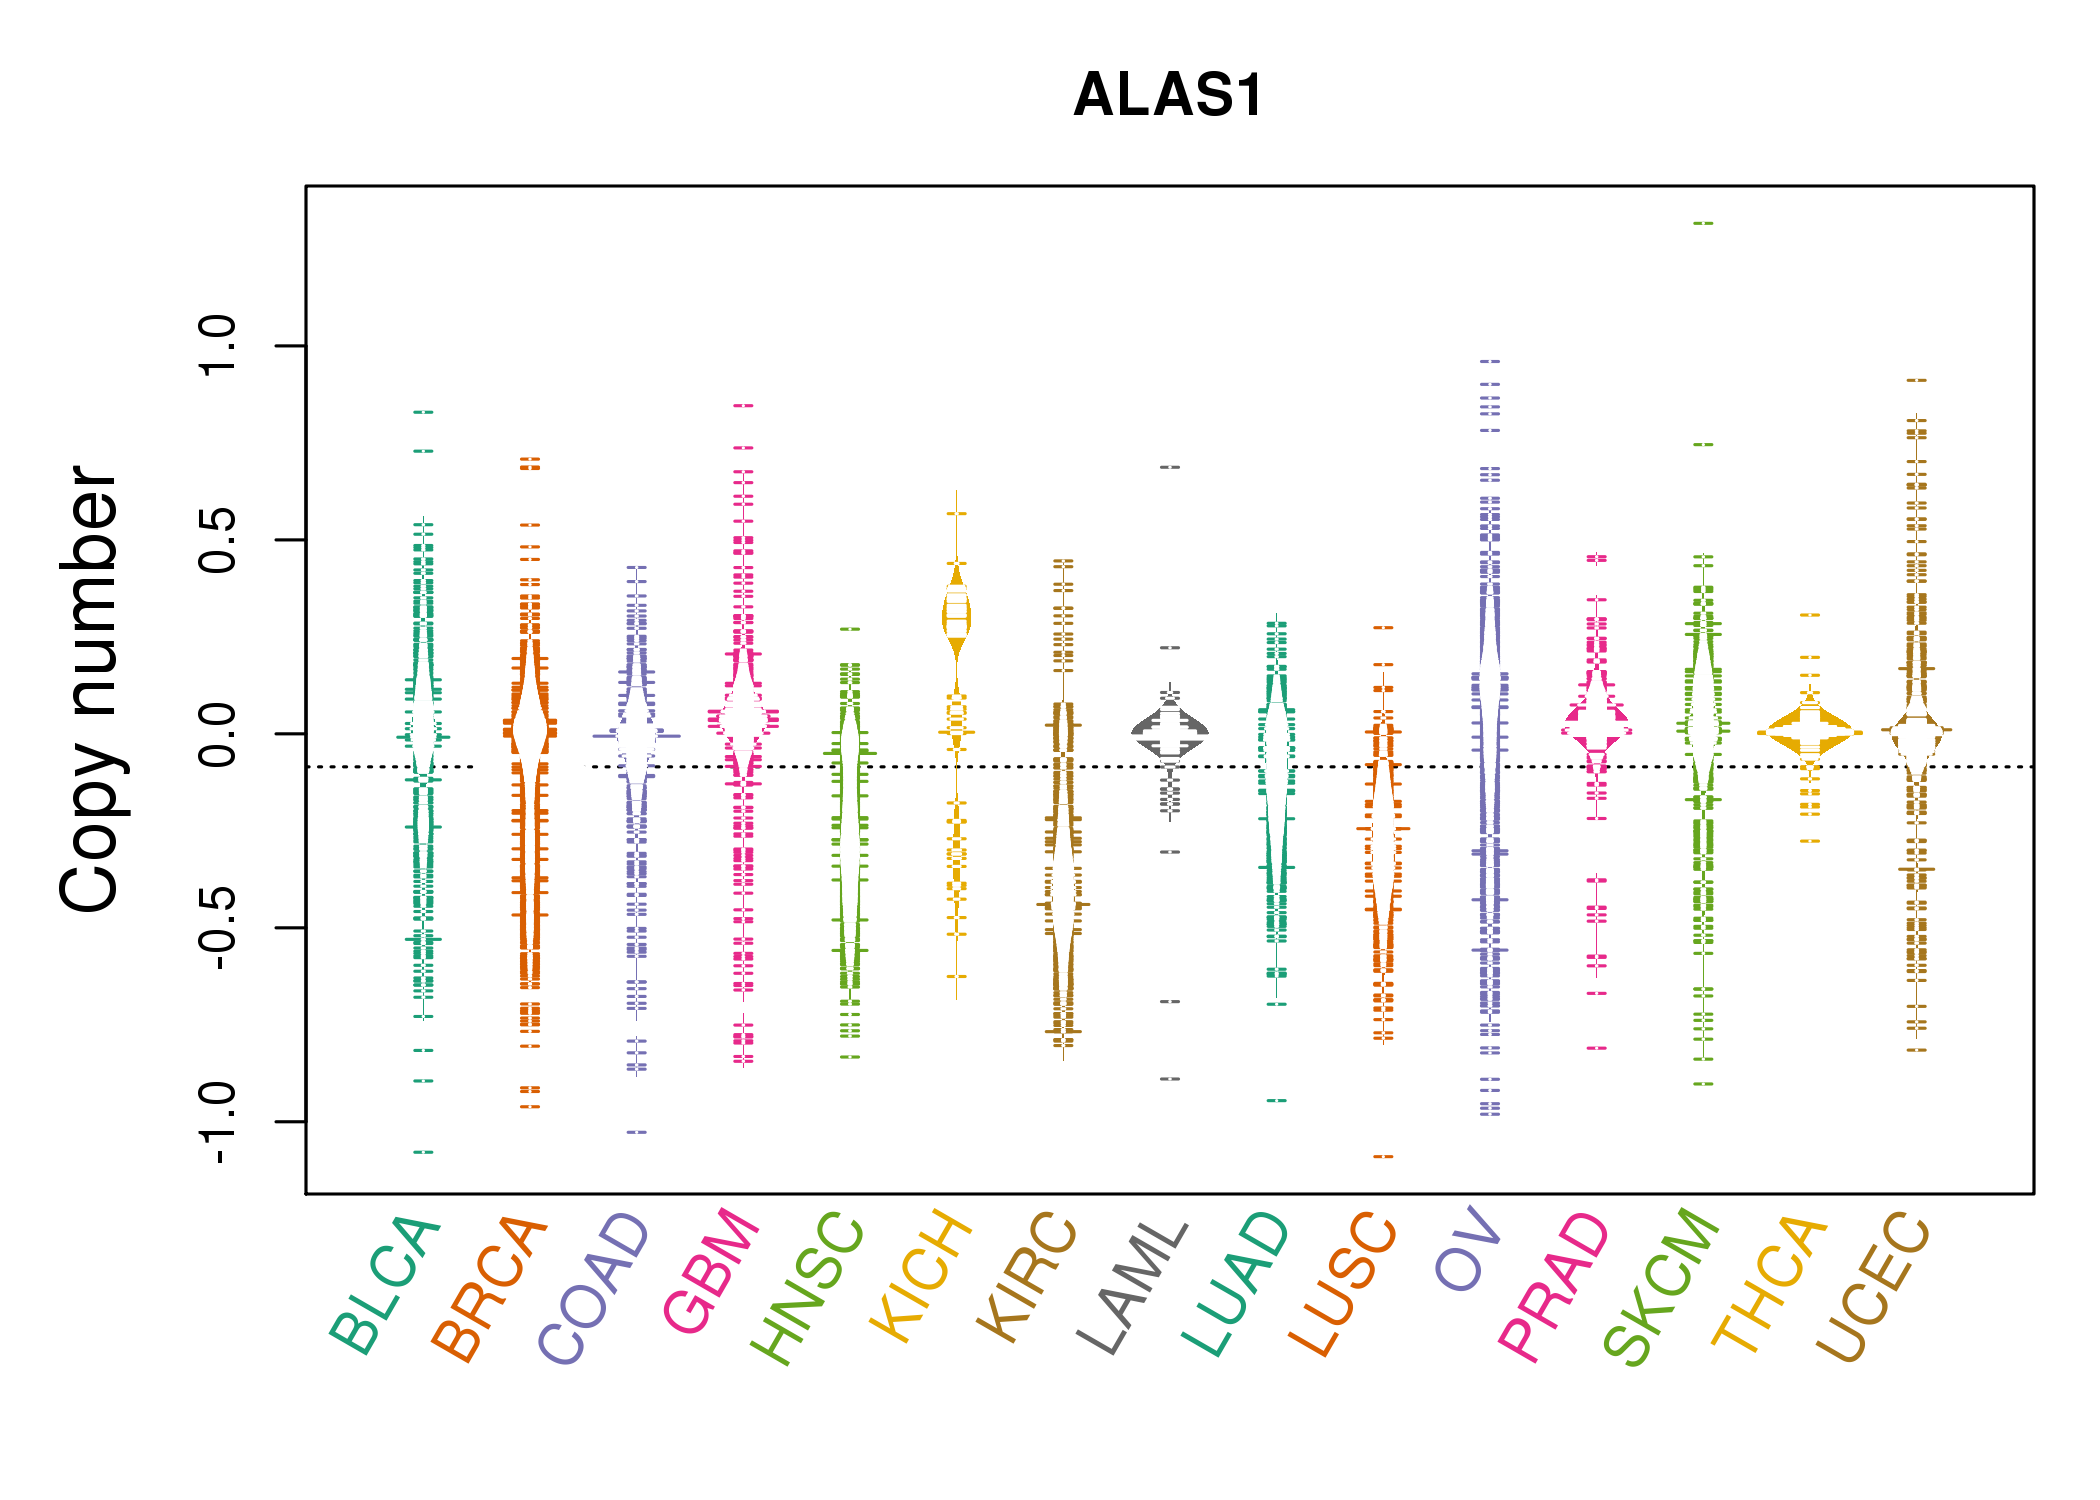 |
| cf) Tissue ID[Tissue type]: BLCA[Bladder Urothelial Carcinoma], BRCA[Breast invasive carcinoma], CESC[Cervical squamous cell carcinoma and endocervical adenocarcinoma], COAD[Colon adenocarcinoma], GBM[Glioblastoma multiforme], Glioma Low Grade, HNSC[Head and Neck squamous cell carcinoma], KICH[Kidney Chromophobe], KIRC[Kidney renal clear cell carcinoma], KIRP[Kidney renal papillary cell carcinoma], LAML[Acute Myeloid Leukemia], LUAD[Lung adenocarcinoma], LUSC[Lung squamous cell carcinoma], OV[Ovarian serous cystadenocarcinoma ], PAAD[Pancreatic adenocarcinoma], PRAD[Prostate adenocarcinoma], SKCM[Skin Cutaneous Melanoma], STAD[Stomach adenocarcinoma], THCA[Thyroid carcinoma], UCEC[Uterine Corpus Endometrial Carcinoma] |
| Top |
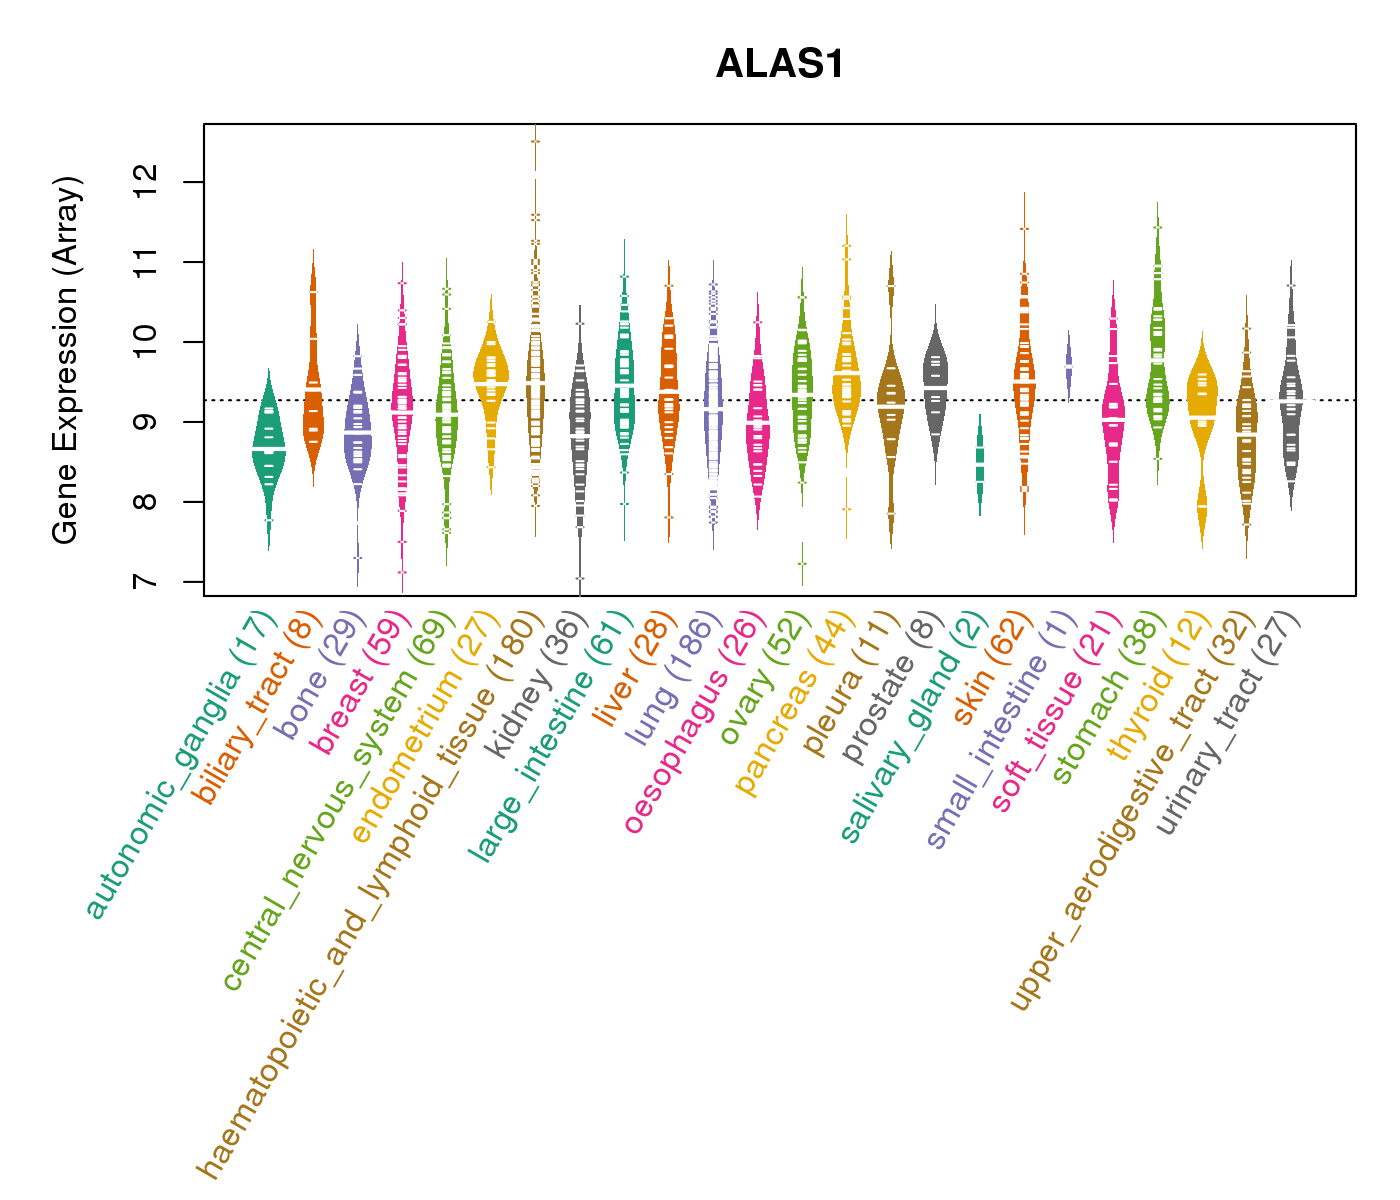
| Gene Expression for ALAS1 |
| * CCLE gene expression data were extracted from CCLE_Expression_Entrez_2012-10-18.res: Gene-centric RMA-normalized mRNA expression data. |
 |
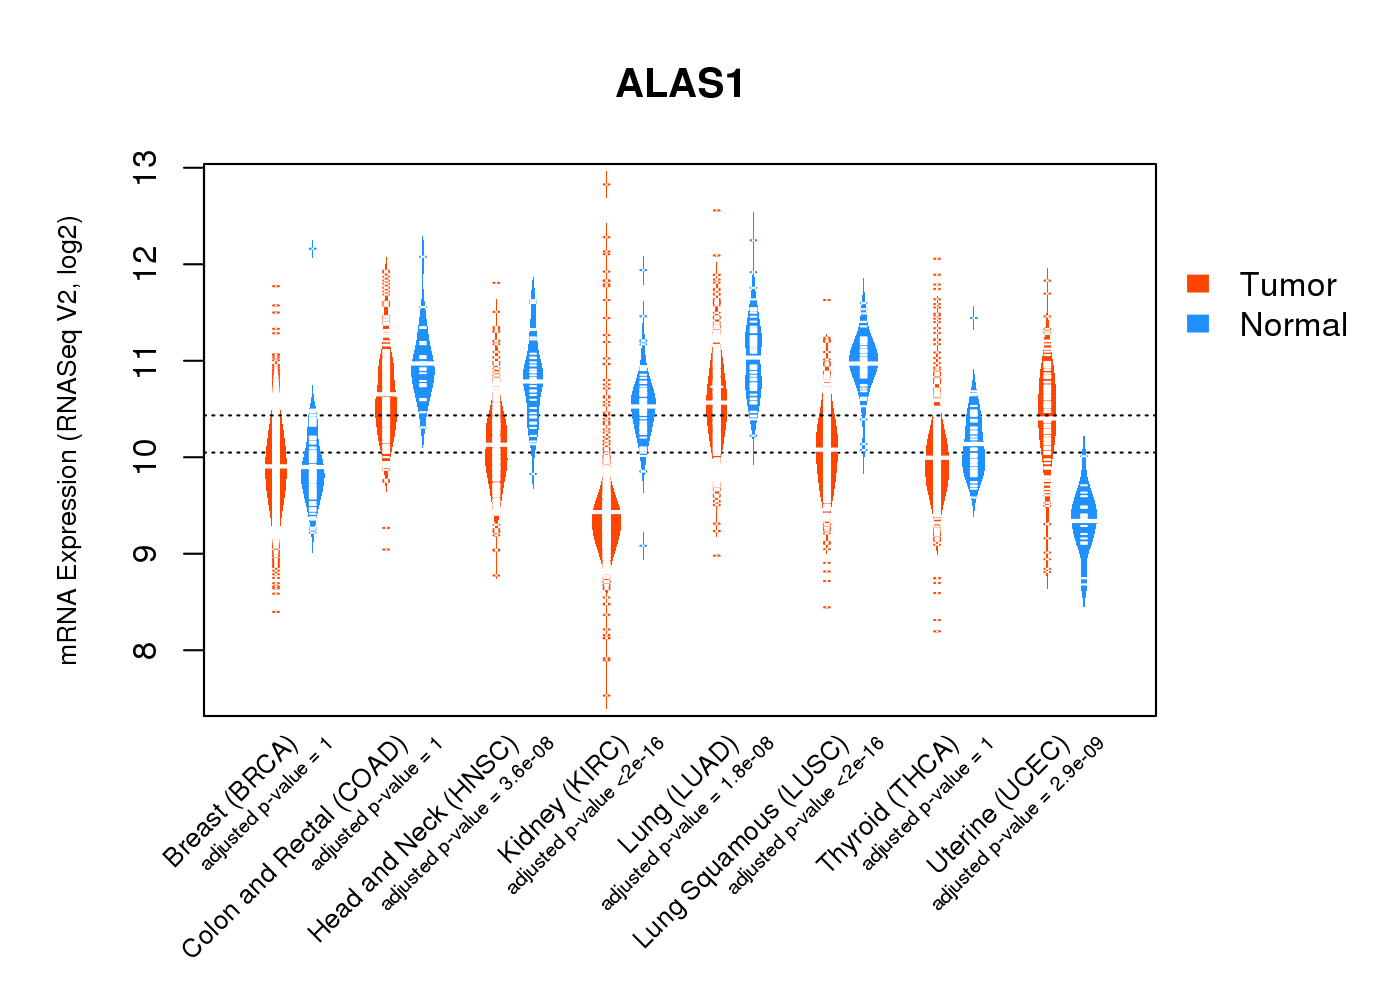
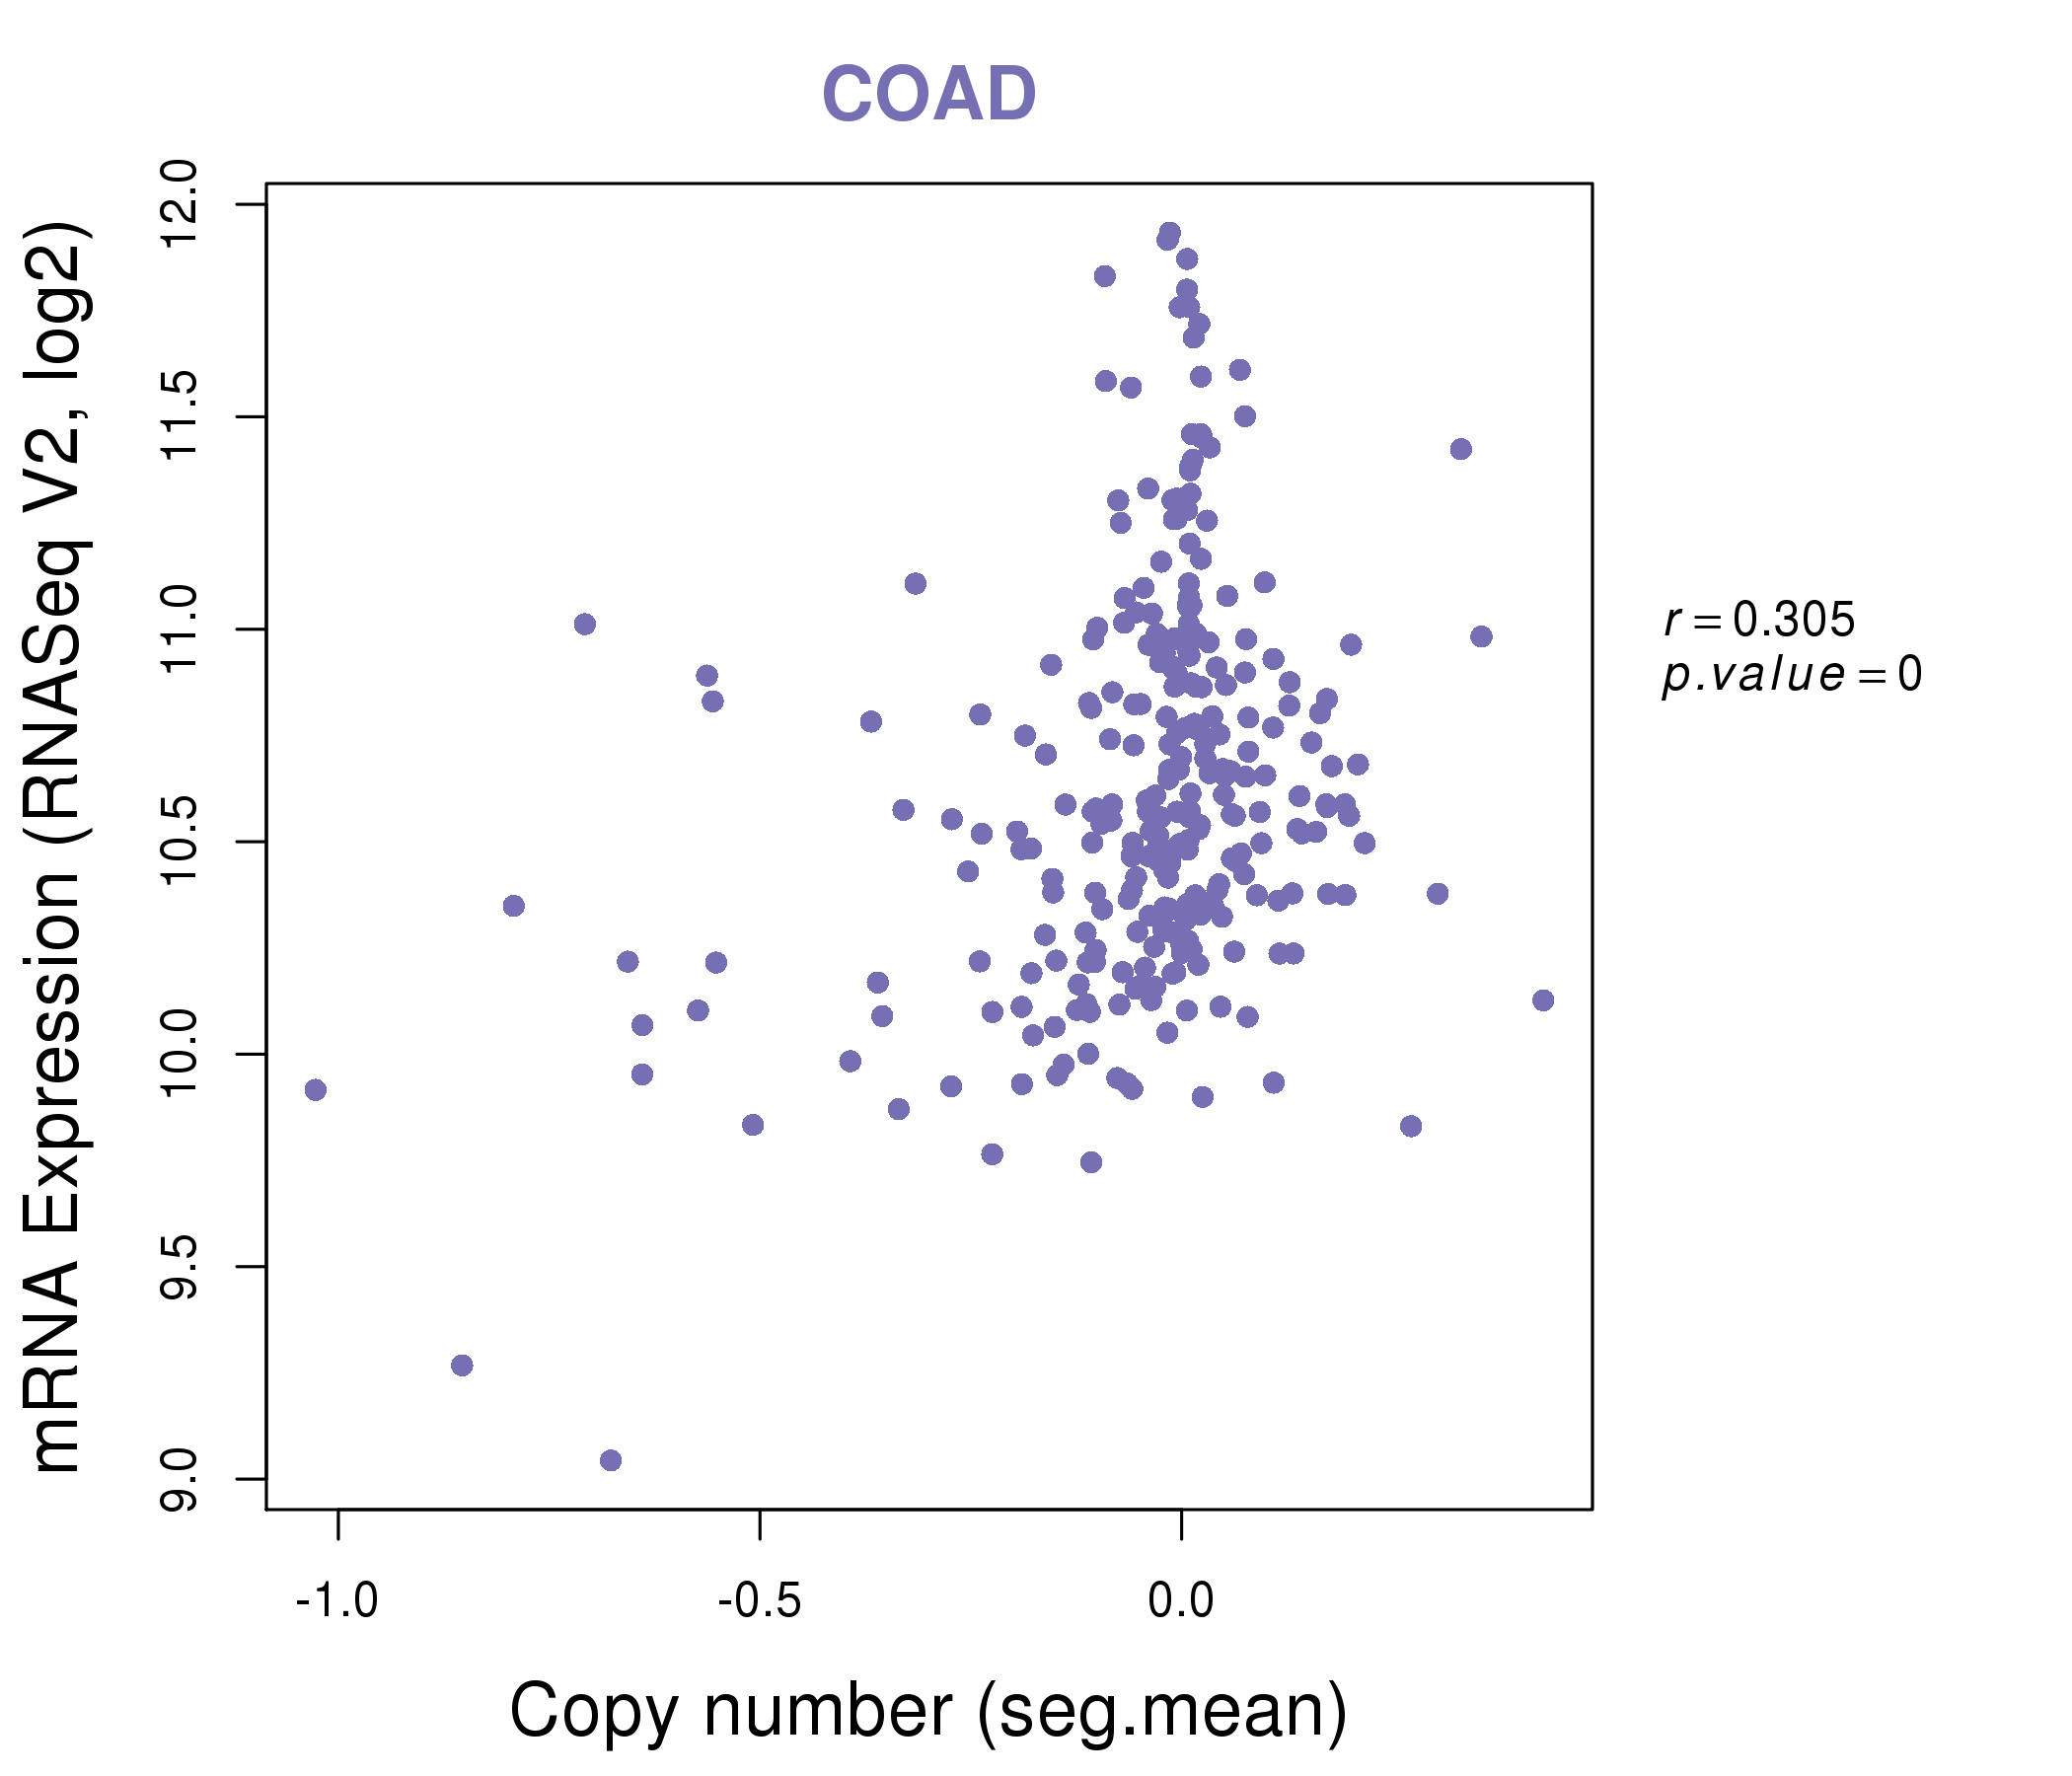
| * Normalized gene expression data of RNASeqV2 was extracted from TCGA using R package TCGA-Assembler. The URLs of all public data files on TCGA DCC data server were gathered at Jan-05-2015. Only eight cancer types have enough normal control samples for differential expression analysis. (t test, adjusted p<0.05 (using Benjamini-Hochberg FDR)) |
 |
| Top |
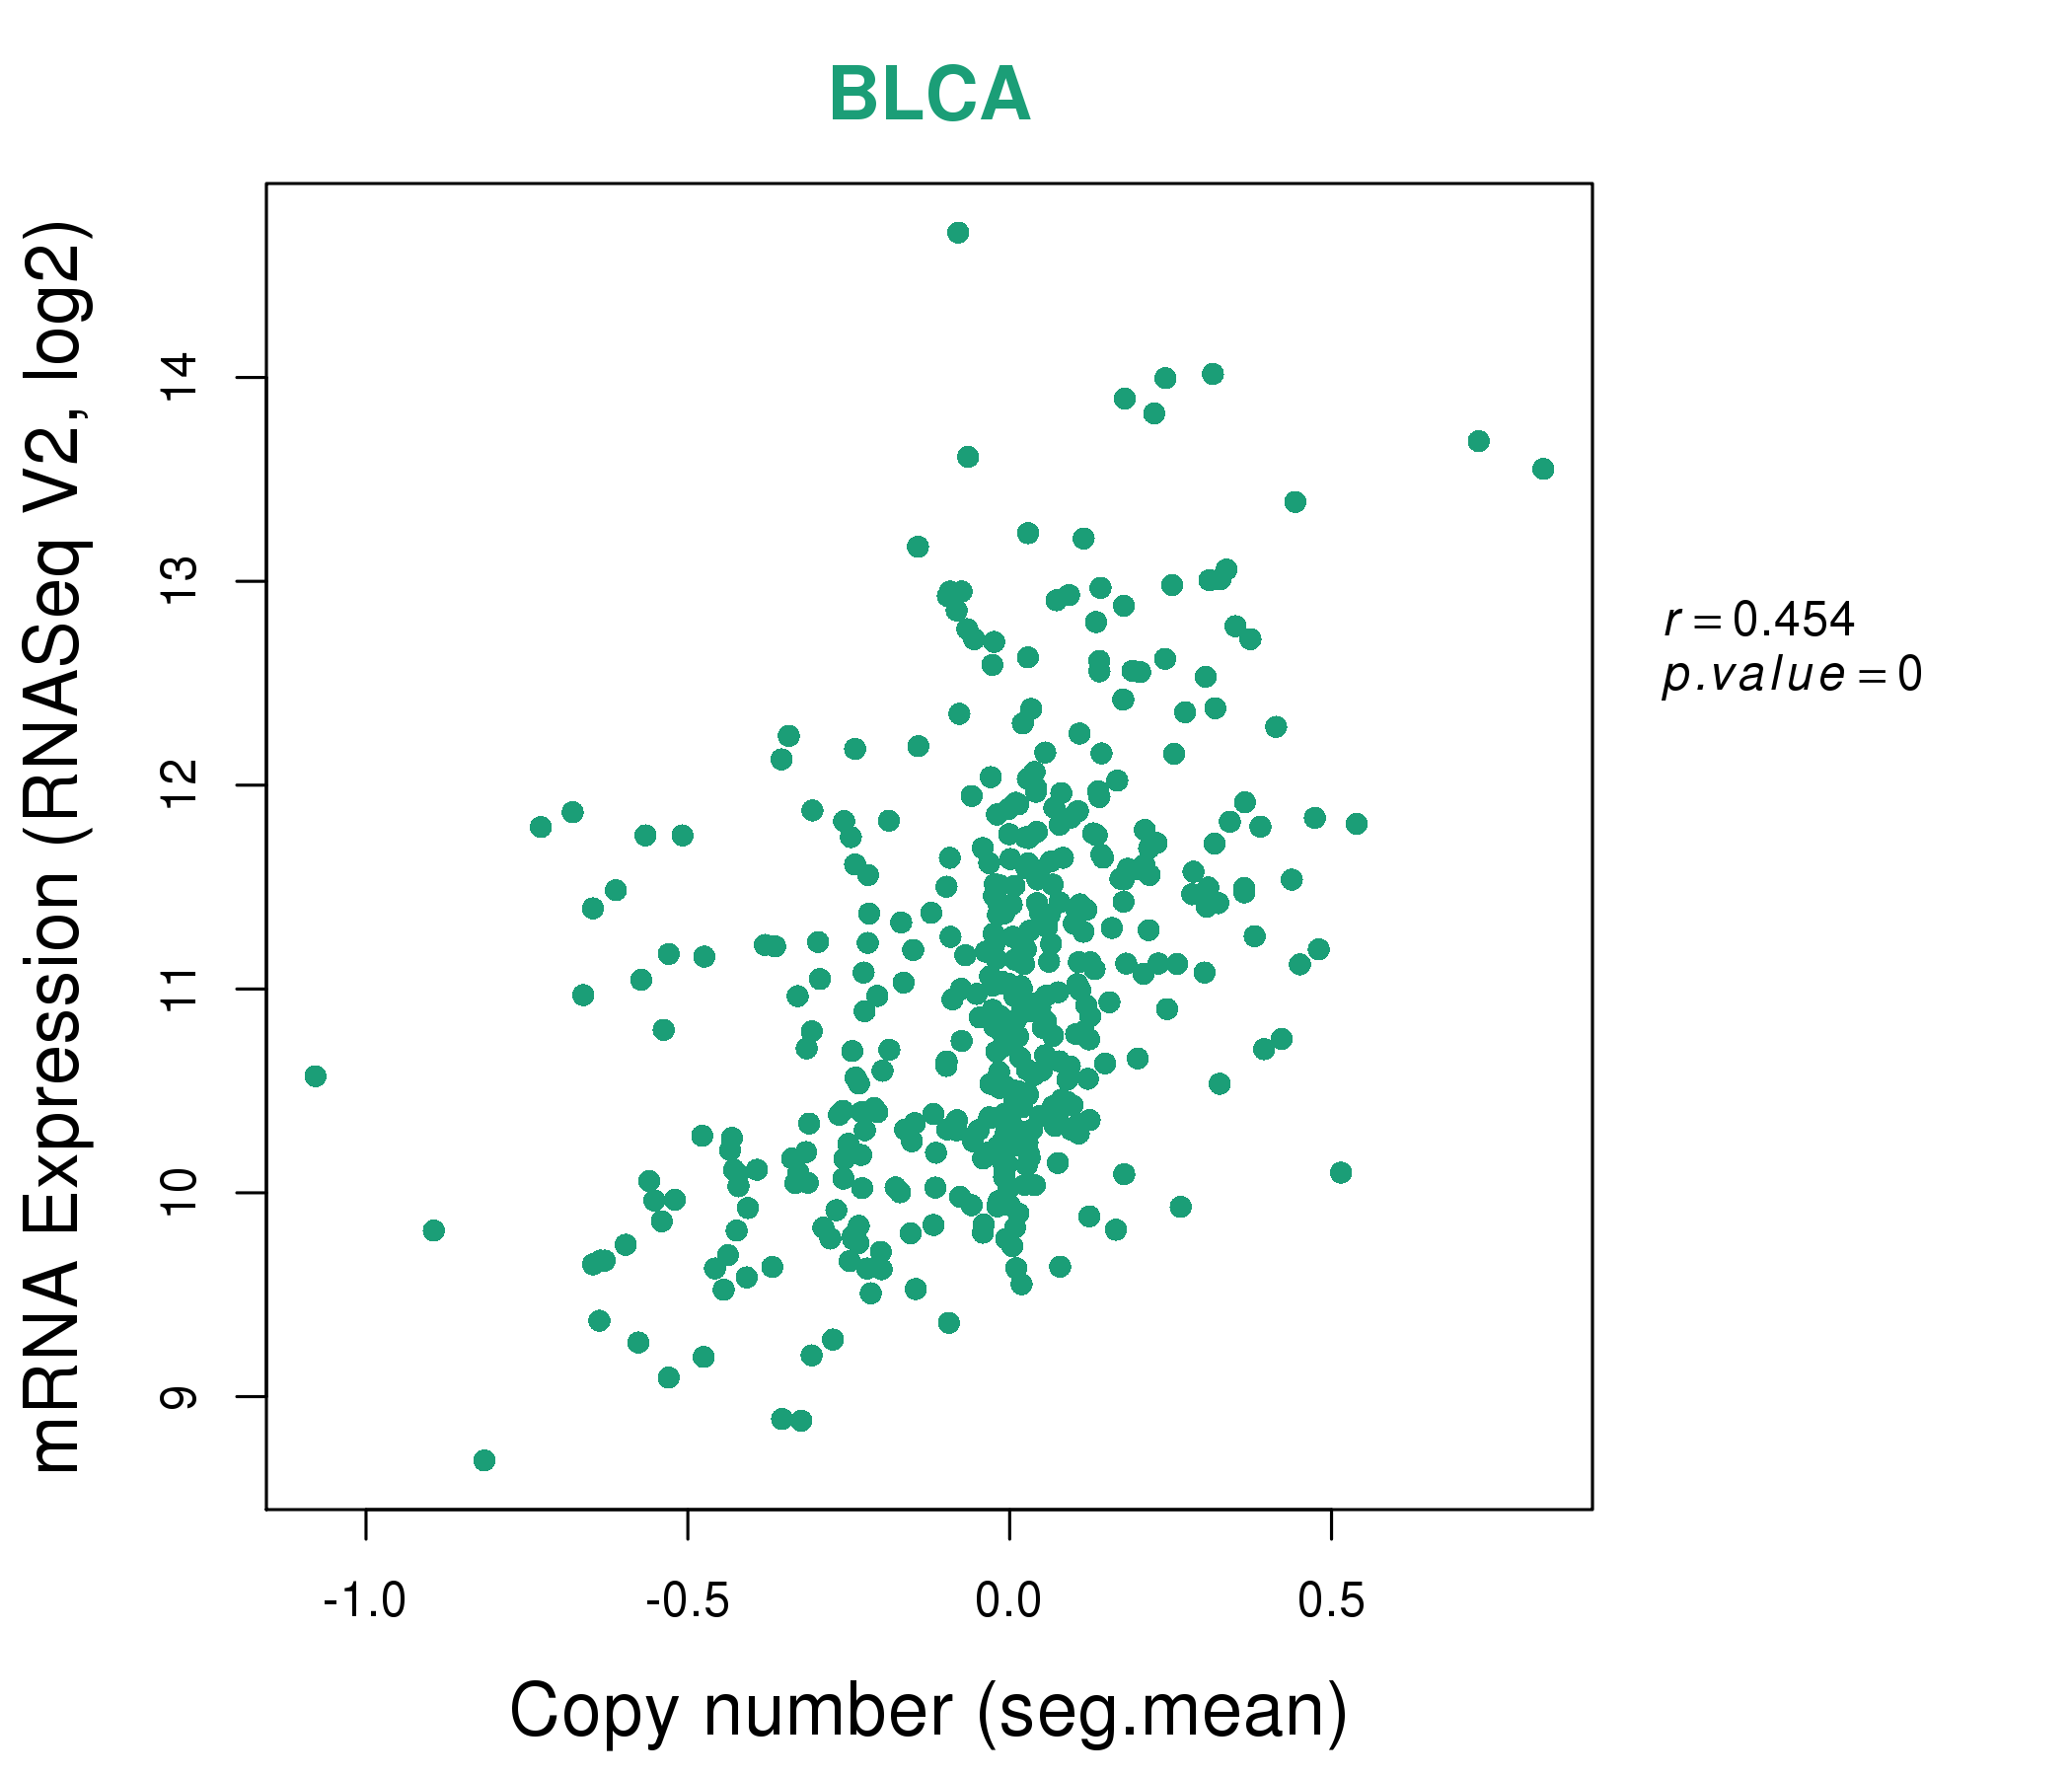
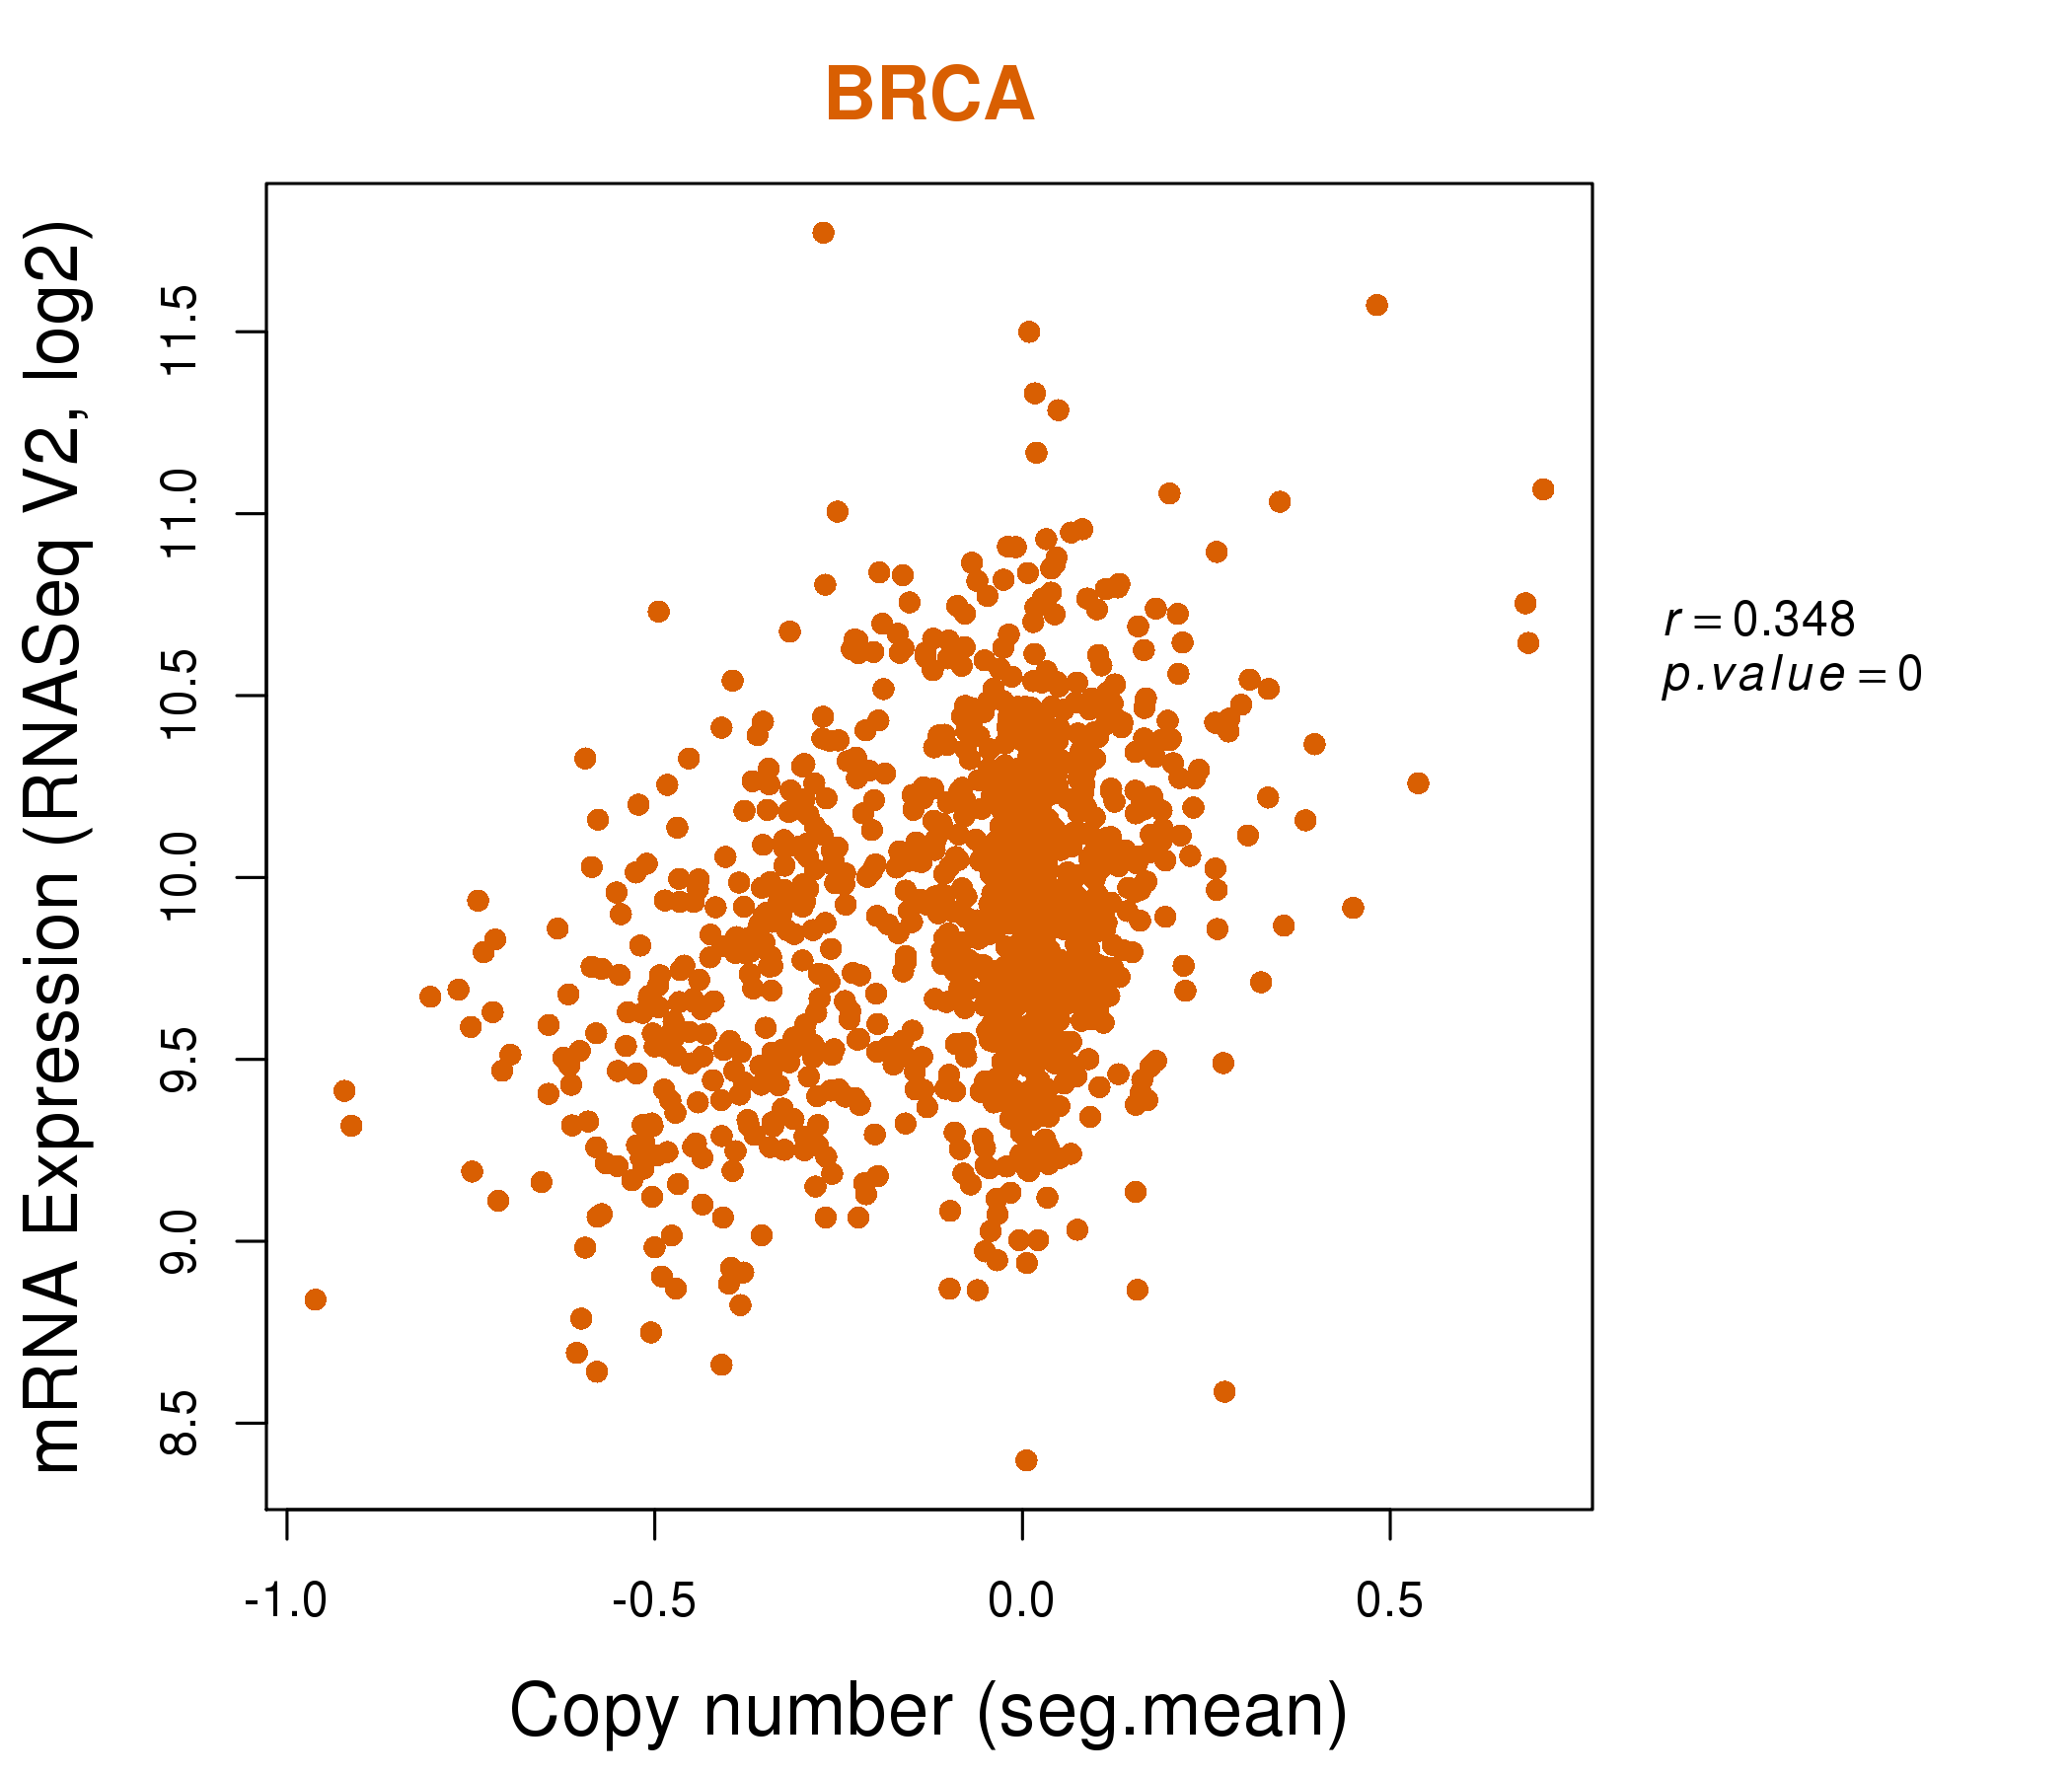
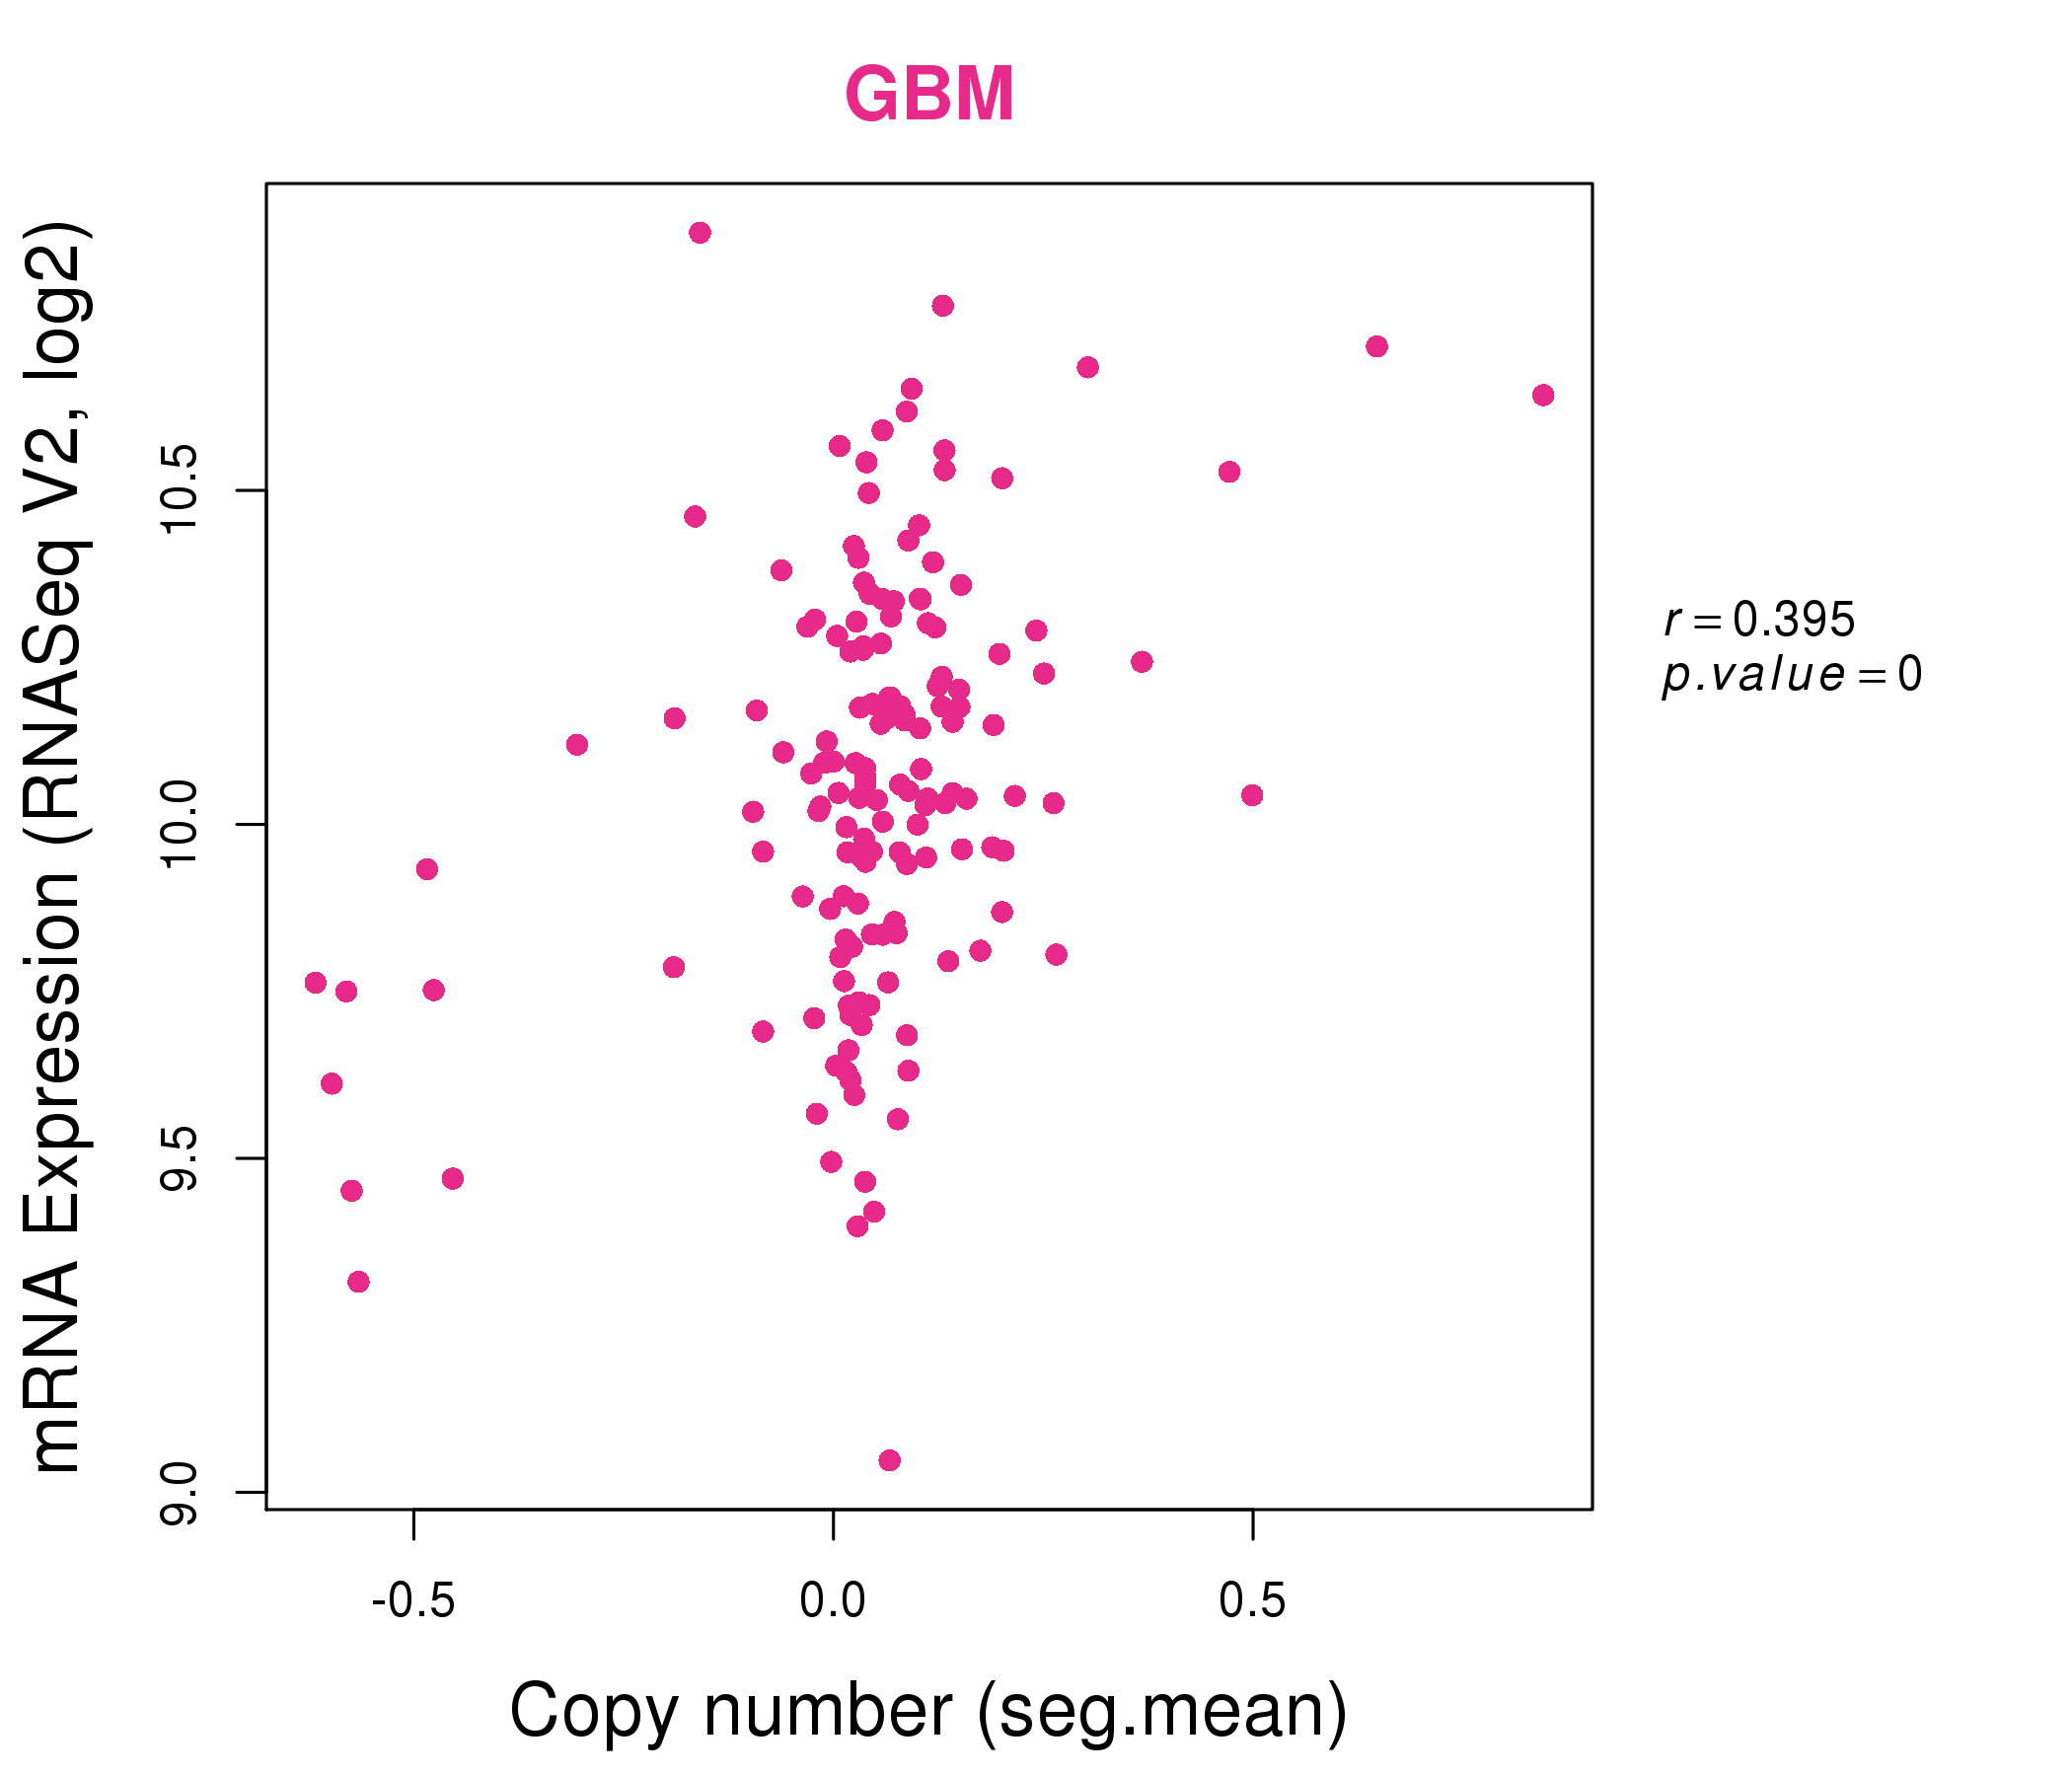
| * This plots show the correlation between CNV and gene expression. |
: Open all plots for all cancer types
 |
|
 |
|
| Top |
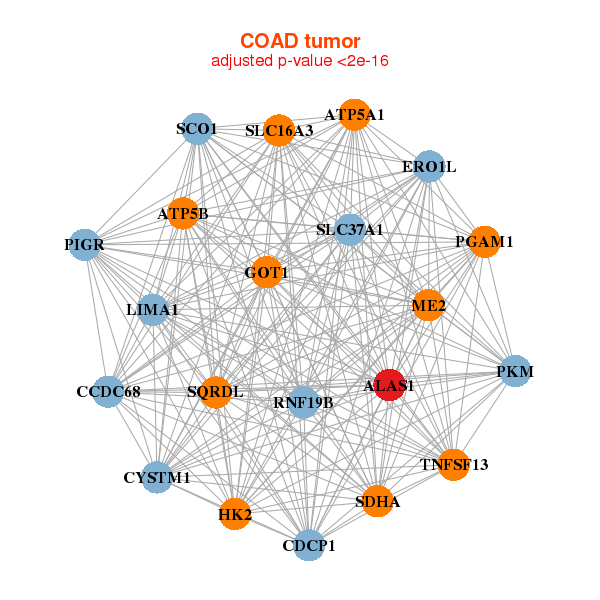
| Gene-Gene Network Information |
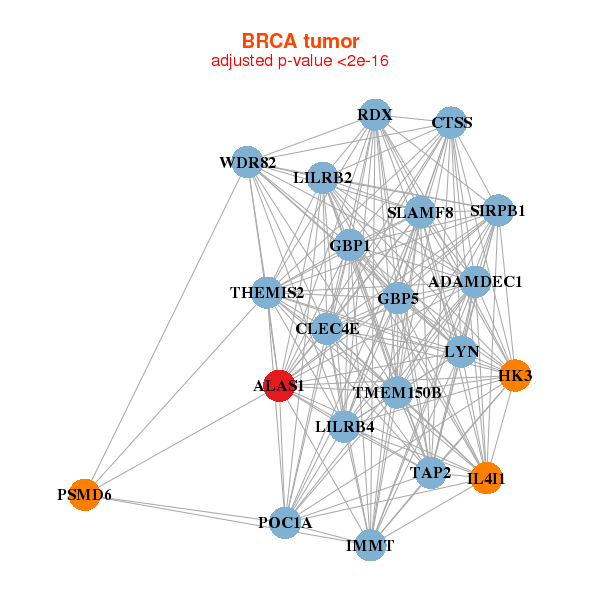
| * Co-Expression network figures were drawn using R package igraph. Only the top 20 genes with the highest correlations were shown. Red circle: input gene, orange circle: cell metabolism gene, sky circle: other gene |
: Open all plots for all cancer types
 |
| ||||
| ADAMDEC1,ALAS1,THEMIS2,CLEC4E,CTSS,GBP1,GBP5, HK3,IL4I1,IMMT,LILRB2,LILRB4,LYN,POC1A, PSMD6,RDX,SIRPB1,SLAMF8,TAP2,TMEM150B,WDR82 | AK1,ALAS1,COX7A1,CUTC,DNASE1L1,DUSP3,FHL1, FHOD1,HSPB7,KLHL30,KLHL31,LMCD1,OGDH,P2RX6, PINK1,RHOBTB1,RXRG,SCN4A,SIRT2,SNTA1,UBE2D4 | ||||
 |
| ||||
| ALAS1,ATP5A1,ATP5B,CYSTM1,CCDC68,CDCP1,ERO1L, GOT1,HK2,LIMA1,ME2,PGAM1,PIGR,PKM, RNF19B,SCO1,SDHA,SLC16A3,SLC37A1,SQRDL,TNFSF13 | ACOX1,ALAS1,ARF3,ATP1B1,CGN,RHOV___CHP1,CORO2A, CUL3,ABHD17C,ITFG1,KIF16B,MVP,PAPSS2,PDCD6IP, PIP4K2C,RAB14,RBM47,SFXN1,SLC26A3,UGT1A10,VDAC1 |

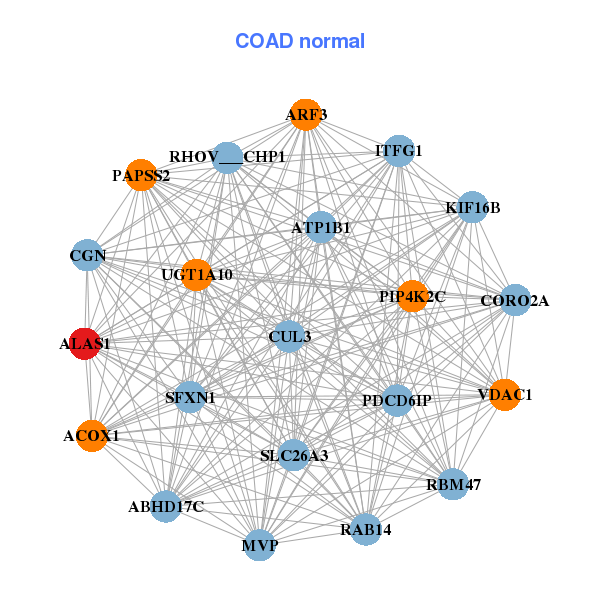
| * Co-Expression network figures were drawn using R package igraph. Only the top 20 genes with the highest correlations were shown. Red circle: input gene, orange circle: cell metabolism gene, sky circle: other gene |
: Open all plots for all cancer types
| Top |
: Open all interacting genes' information including KEGG pathway for all interacting genes from DAVID
| Top |
| Pharmacological Information for ALAS1 |
| DB Category | DB Name | DB's ID and Url link |
| * Gene Centered Interaction Network. |
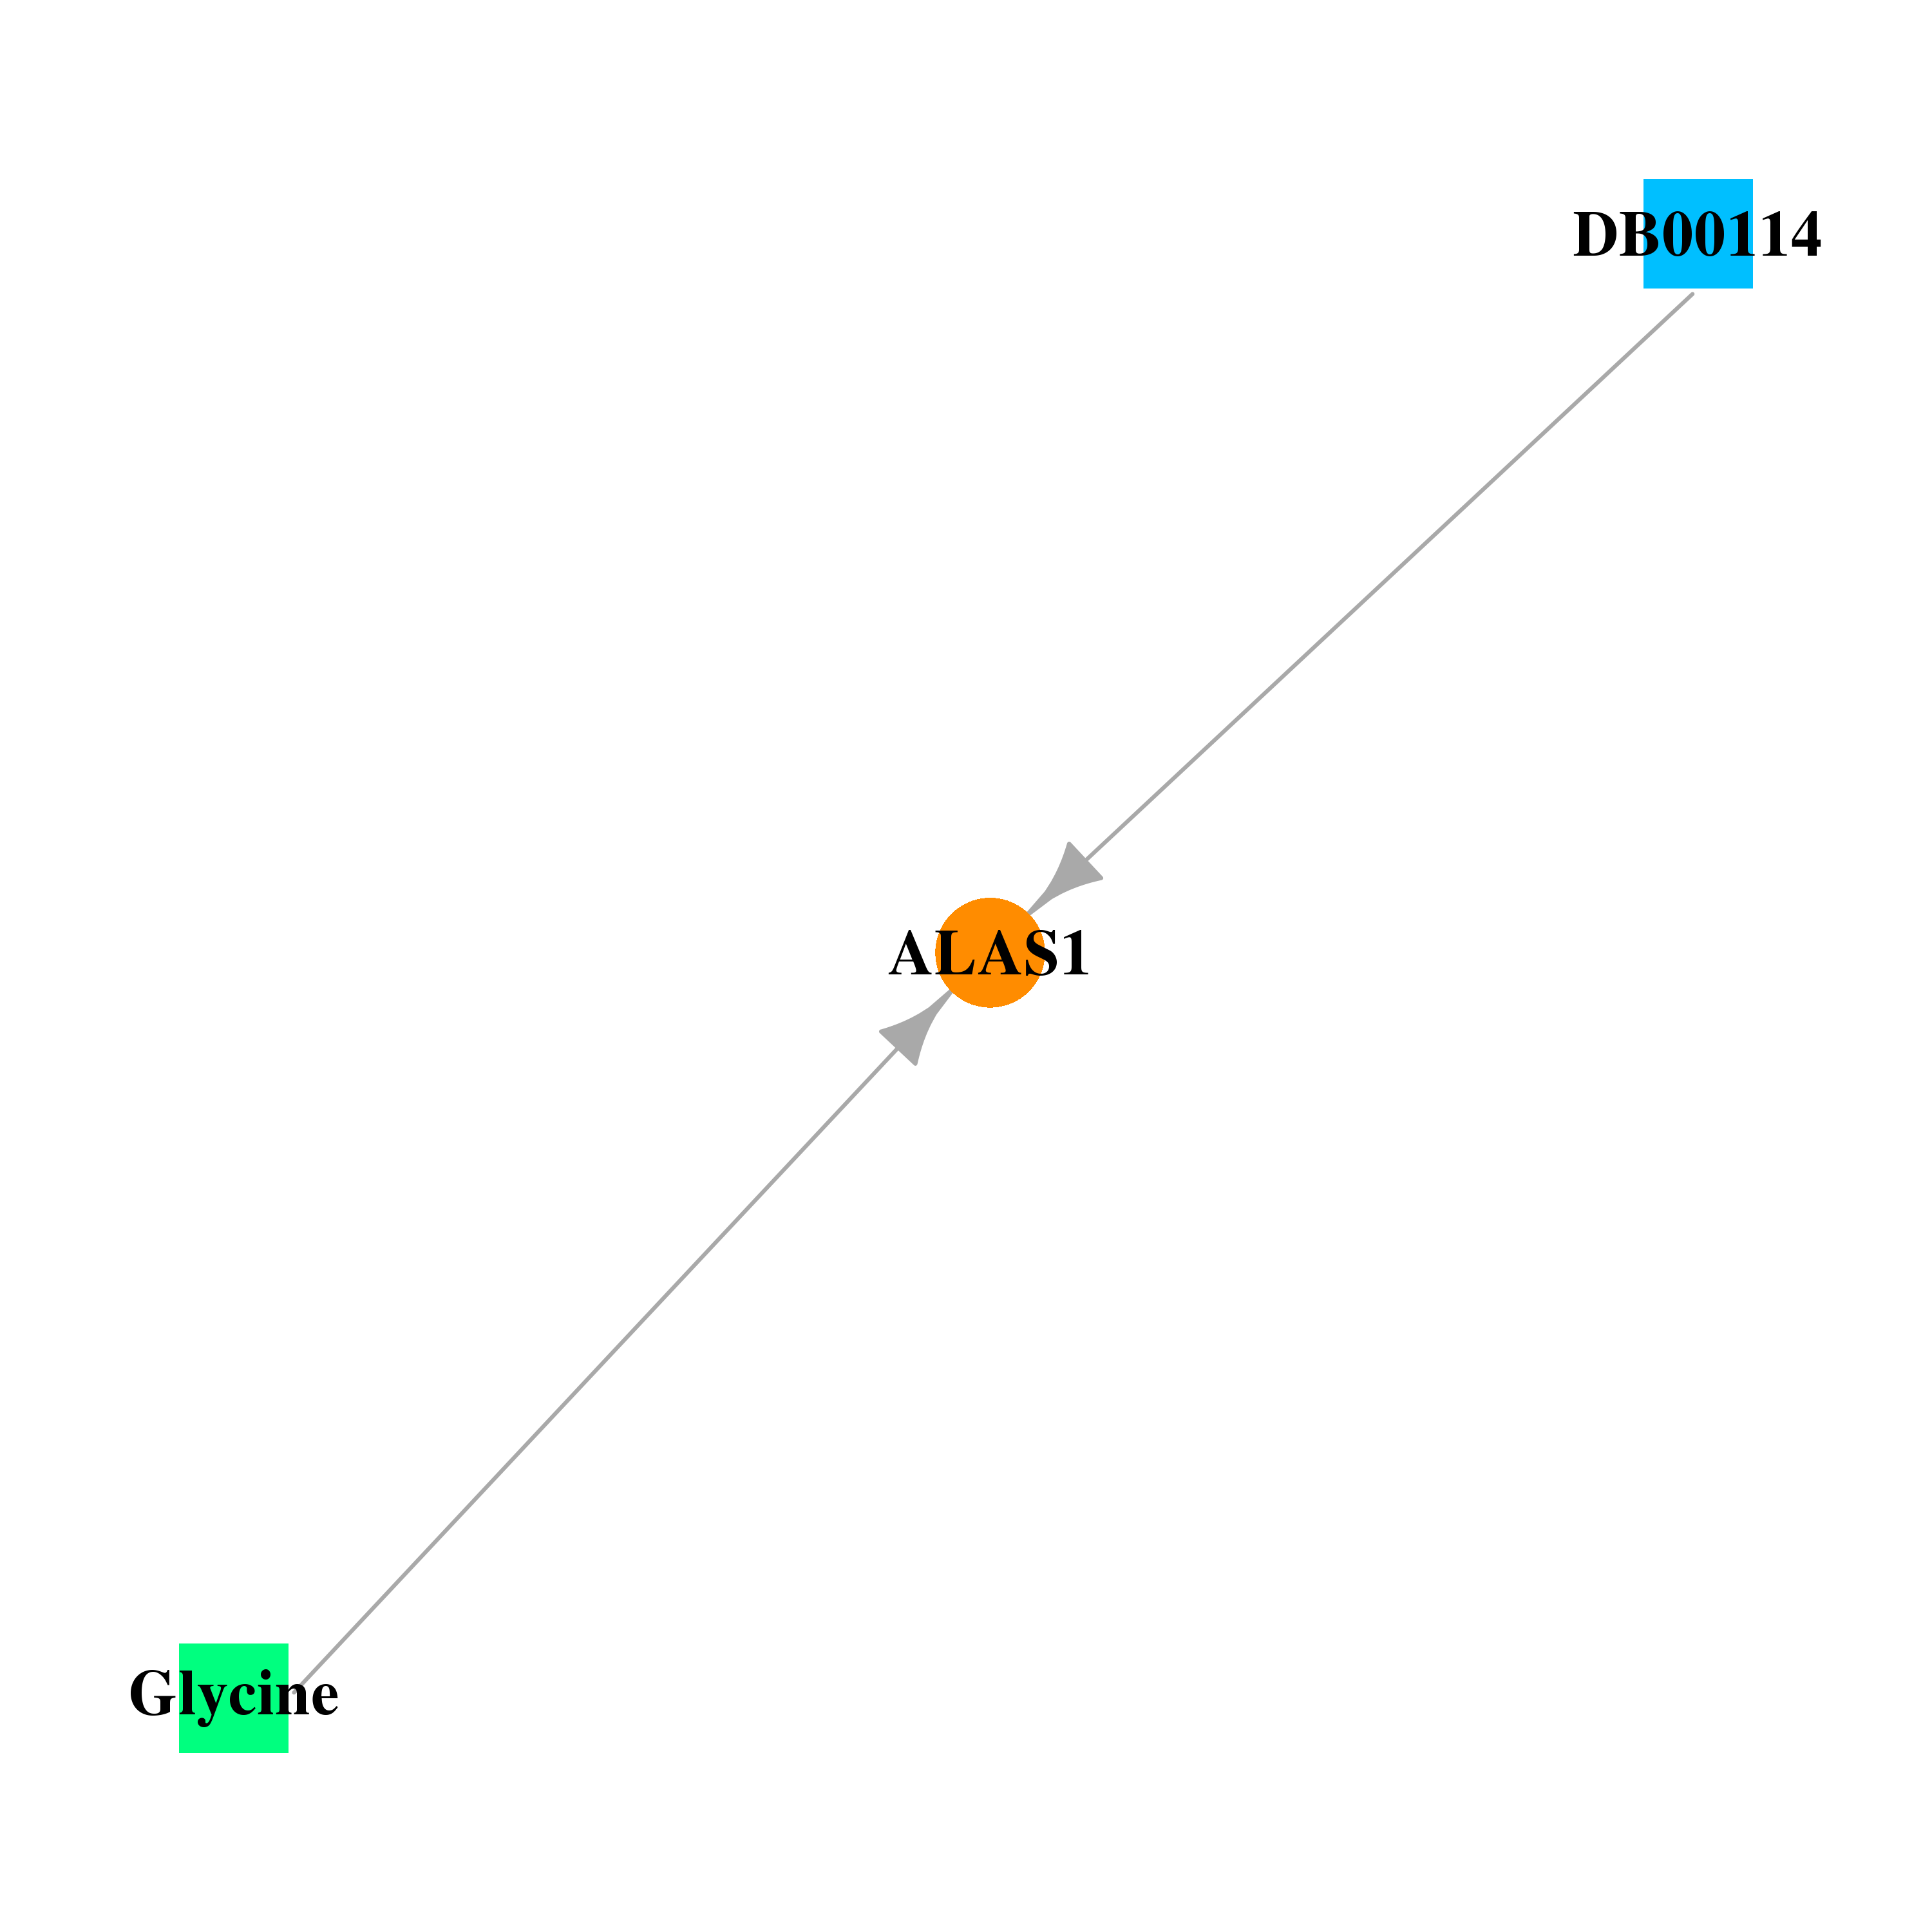 |
| * Drug Centered Interaction Network. |
| DrugBank ID | Target Name | Drug Groups | Generic Name | Drug Centered Network | Drug Structure |
| DB00114 | aminolevulinate, delta-, synthase 1 | nutraceutical | Pyridoxal Phosphate |  |  |
| DB00145 | aminolevulinate, delta-, synthase 1 | approved; nutraceutical | Glycine |  |  |
| Top |
| Cross referenced IDs for ALAS1 |
| * We obtained these cross-references from Uniprot database. It covers 150 different DBs, 18 categories. http://www.uniprot.org/help/cross_references_section |
: Open all cross reference information
|
Copyright © 2016-Present - The Univsersity of Texas Health Science Center at Houston @ |