|
|||||||||||||||||||||||||||||||||||||||||||||||||||||||||||||||||||||||||||||||||||||||||||||||||||||||||||||||||||||||||||||||||||||||||||||||||||||||||||||||||||||||||||||||||||||||||||||||||||||||||||||||||||||||||||||||||||||||||||||||||||||||||||||||||||||||||||||||||||||||||||||||||||||||||||||||||||||||||||||||||||||||||||||||||||||||||||||||||||||
| |
| Phenotypic Information (metabolism pathway, cancer, disease, phenome) |
| |
| |
| Gene-Gene Network Information: Co-Expression Network, Interacting Genes & KEGG |
| |
|


| Gene Summary for ALB |
| Basic gene info. | Gene symbol | ALB |
| Gene name | albumin | |
| Synonyms | ANALBA|FDAH|PRO0883|PRO0903|PRO1341 | |
| Cytomap | UCSC genome browser: 4q13.3 | |
| Genomic location | chr4 :74269971-74287129 | |
| Type of gene | protein-coding | |
| RefGenes | NM_000477.5, | |
| Ensembl id | ENSG00000163631 | |
| Description | albumin (32 AA)albumin (AA 34)cell growth inhibiting protein 42growth-inhibiting protein 20serum albumin | |
| Modification date | 20141207 | |
| dbXrefs | MIM : 103600 | |
| HGNC : HGNC | ||
| Ensembl : ENSG00000163631 | ||
| HPRD : 00062 | ||
| Vega : OTTHUMG00000129919 | ||
| Protein | UniProt: P02768 go to UniProt's Cross Reference DB Table | |
| Expression | CleanEX: HS_ALB | |
| BioGPS: 213 | ||
| Gene Expression Atlas: ENSG00000163631 | ||
| The Human Protein Atlas: ENSG00000163631 | ||
| Pathway | NCI Pathway Interaction Database: ALB | |
| KEGG: ALB | ||
| REACTOME: ALB | ||
| ConsensusPathDB | ||
| Pathway Commons: ALB | ||
| Metabolism | MetaCyc: ALB | |
| HUMANCyc: ALB | ||
| Regulation | Ensembl's Regulation: ENSG00000163631 | |
| miRBase: chr4 :74,269,971-74,287,129 | ||
| TargetScan: NM_000477 | ||
| cisRED: ENSG00000163631 | ||
| Context | iHOP: ALB | |
| cancer metabolism search in PubMed: ALB | ||
| UCL Cancer Institute: ALB | ||
| Assigned class in ccmGDB | A - This gene has a literature evidence and it belongs to cancer gene. | |
| References showing role of ALB in cancer cell metabolism | 1. Kamphorst JJ, Nofal M, Commisso C, Hackett SR, Lu W, et al. (2015) Human pancreatic cancer tumors are nutrient poor and tumor cells actively scavenge extracellular protein. Cancer Res 75: 544-553. doi: 10.1158/0008-5472.CAN-14-2211. pmid: 4316379. go to article | |
| Top |
| Phenotypic Information for ALB(metabolism pathway, cancer, disease, phenome) |
| Cancer | CGAP: ALB |
| Familial Cancer Database: ALB | |
| * This gene is included in those cancer gene databases. |
|
|
|
|
|
| . | |||||||||||||||||||||||||||||||||||||||||||||||||||||||||||||||||||||||||||||||||||||||||||||||||||||||||||||||||||||||||||||||||||||||||||||||||||||||||||||||||||||||||||||||||||||||||||||||||||||||||||||||||||||||||||||||||||||||||||||||||||||||||||||||||||||||||||||||||||||||||||||||||||||||||||||||||||||||||||||||||||||||||||||||||||||||||||||||
Oncogene 1 | Significant driver gene in | ||||||||||||||||||||||||||||||||||||||||||||||||||||||||||||||||||||||||||||||||||||||||||||||||||||||||||||||||||||||||||||||||||||||||||||||||||||||||||||||||||||||||||||||||||||||||||||||||||||||||||||||||||||||||||||||||||||||||||||||||||||||||||||||||||||||||||||||||||||||||||||||||||||||||||||||||||||||||||||||||||||||||||||||||||||||||||||||||||||
| cf) number; DB name 1 Oncogene; http://nar.oxfordjournals.org/content/35/suppl_1/D721.long, 2 Tumor Suppressor gene; https://bioinfo.uth.edu/TSGene/, 3 Cancer Gene Census; http://www.nature.com/nrc/journal/v4/n3/abs/nrc1299.html, 4 CancerGenes; http://nar.oxfordjournals.org/content/35/suppl_1/D721.long, 5 Network of Cancer Gene; http://ncg.kcl.ac.uk/index.php, 1Therapeutic Vulnerabilities in Cancer; http://cbio.mskcc.org/cancergenomics/statius/ |
| REACTOME_METABOLISM_OF_LIPIDS_AND_LIPOPROTEINS REACTOME_LIPOPROTEIN_METABOLISM | |
| OMIM | 103600; gene. 103600; gene. 615999; phenotype. 615999; phenotype. |
| Orphanet | 276271; Familial dysalbuminemic hyperthyroxinemia. 276271; Familial dysalbuminemic hyperthyroxinemia. 86816; Congenital analbuminemia. 86816; Congenital analbuminemia. |
| Disease | KEGG Disease: ALB |
| MedGen: ALB (Human Medical Genetics with Condition) | |
| ClinVar: ALB | |
| Phenotype | MGI: ALB (International Mouse Phenotyping Consortium) |
| PhenomicDB: ALB | |
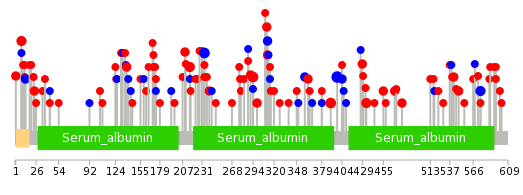
| Mutations for ALB |
| * Under tables are showing count per each tissue to give us broad intuition about tissue specific mutation patterns.You can go to the detailed page for each mutation database's web site. |
| There's no structural variation information in COSMIC data for this gene. |
| * From mRNA Sanger sequences, Chitars2.0 arranged chimeric transcripts. This table shows ALB related fusion information. |
| ID | Head Gene | Tail Gene | Accession | Gene_a | qStart_a | qEnd_a | Chromosome_a | tStart_a | tEnd_a | Gene_a | qStart_a | qEnd_a | Chromosome_a | tStart_a | tEnd_a |
| BP294362 | ALB | 1 | 475 | 4 | 74270006 | 74274476 | SERPING1 | 475 | 582 | 11 | 57381845 | 57381951 | |
| BG562874 | APOB | 1 | 367 | 2 | 21227268 | 21228146 | ALB | 359 | 660 | 4 | 74279174 | 74280877 | |
| DA643030 | EBNA1BP2 | 2 | 413 | 1 | 43680937 | 43713713 | ALB | 412 | 590 | 4 | 74270084 | 74272426 | |
| AI133546 | ALB | 10 | 564 | 4 | 74283248 | 74286029 | ZDHHC2 | 557 | 638 | 8 | 17078894 | 17078975 | |
| AI114516 | STK38L | 1 | 194 | 12 | 27476070 | 27476263 | ALB | 188 | 767 | 4 | 74279302 | 74283959 | |
| AV653907 | AOX1 | 1 | 364 | 2 | 201534428 | 201535676 | ALB | 362 | 706 | 4 | 74283944 | 74286870 | |
| AF119890 | GABPA | 1 | 354 | 21 | 27141926 | 27142279 | ALB | 350 | 1598 | 4 | 74277769 | 74286973 | |
| AW072570 | ALB | 1 | 158 | 4 | 74286814 | 74286971 | APP | 159 | 498 | 21 | 27354655 | 27394191 | |
| AF119840 | CMAS | 1 | 647 | 12 | 22215302 | 22215952 | ALB | 641 | 2699 | 4 | 74270004 | 74286973 | |
| AF118090 | ZNF536 | 1 | 697 | 19 | 30863628 | 30864332 | ALB | 692 | 1690 | 4 | 74279313 | 74286973 | |
| AI174891 | ACTR3 | 2 | 489 | 2 | 114677181 | 114677671 | ALB | 483 | 758 | 4 | 74270078 | 74274349 | |
| AF116711 | ALB | 167 | 274 | 4 | 74281996 | 74283280 | RPS4Y1 | 268 | 1144 | Y | 2709643 | 2734997 | |
| AI064841 | RABGAP1L | 13 | 211 | 1 | 174189320 | 174189518 | ALB | 208 | 654 | 4 | 74283248 | 74285307 | |
| AI114561 | MSL3 | 19 | 341 | X | 11777779 | 11778966 | ALB | 337 | 680 | 4 | 74283960 | 74286879 | |
| AI207561 | ALAS2 | 20 | 340 | X | 55035491 | 55039953 | ALB | 338 | 642 | 4 | 74285286 | 74286973 | |
| W86731 | ALB | 1 | 93 | 4 | 74279196 | 74279288 | VPS13B | 84 | 452 | 8 | 100222381 | 100222742 | |
| AI065112 | ALB | 1 | 544 | 4 | 74283820 | 74286942 | TF | 539 | 641 | 3 | 133497528 | 133497630 | |
| AI305112 | C3 | 1 | 387 | 19 | 6678438 | 6682029 | ALB | 379 | 612 | 4 | 74270017 | 74272414 | |
| BG545312 | ALB | 2 | 400 | 4 | 74270004 | 74274400 | MALAT1 | 388 | 714 | 11 | 65267378 | 65267699 | |
| AF116645 | TF | 1 | 240 | 3 | 133490670 | 133490909 | ALB | 234 | 1242 | 4 | 74279289 | 74286959 | |
| AI114654 | ALB | 8 | 218 | 4 | 74283921 | 74285332 | ALB | 216 | 744 | 4 | 74279251 | 74283862 | |
| AI174917 | ALB | 167 | 274 | 4 | 74281996 | 74283280 | RPS4Y1 | 268 | 691 | Y | 2709643 | 2722681 | |
| AI133207 | SASH3 | 1 | 58 | X | 128929090 | 128929147 | ALB | 50 | 699 | 4 | 74270004 | 74275197 | |
| AV654807 | ABLIM3 | 1 | 128 | 5 | 148534150 | 148534277 | ALB | 129 | 393 | 4 | 74270030 | 74272458 | |
| AA884347 | ALB | 1 | 158 | 4 | 74286814 | 74286971 | APP | 159 | 459 | 21 | 27354655 | 27372495 | |
| AI064877 | ALB | 1 | 51 | 4 | 74282020 | 74282070 | ALB | 48 | 444 | 4 | 74283298 | 74285307 | |
| AF116688 | MATR3 | 5 | 1032 | 5 | 138631171 | 138632200 | ALB | 1029 | 1124 | 4 | 74287034 | 74287129 | |
| AI110818 | ALB | 1 | 466 | 4 | 74280850 | 74284021 | ALB | 455 | 636 | 4 | 74279160 | 74279341 | |
| DA640348 | KNG1 | 4 | 317 | 3 | 186435149 | 186435462 | ALB | 318 | 545 | 4 | 74270004 | 74272395 | |
| AI174759 | AHSG | 1 | 163 | 3 | 186338913 | 186339075 | ALB | 154 | 609 | 4 | 74270015 | 74274466 | |
| AF075316 | ALB | 1 | 466 | 4 | 74280850 | 74284021 | ALB | 455 | 636 | 4 | 74279160 | 74279341 | |
| BG563936 | MYO18A | 2 | 363 | 17 | 27405532 | 27405893 | ALB | 359 | 685 | 4 | 74280437 | 74280766 | |
| DQ145726 | TXNL4B | 46 | 876 | 16 | 72094073 | 72094903 | ALB | 863 | 1070 | 4 | 74285996 | 74286973 | |
| AI133116 | TF | 1 | 240 | 3 | 133490670 | 133490909 | ALB | 234 | 582 | 4 | 74279289 | 74283301 | |
| AU120466 | ARID4B | 329 | 349 | 1 | 235456198 | 235456218 | ALB | 331 | 790 | 4 | 74270005 | 74274461 | |
| BG564023 | MYO18A | 2 | 363 | 17 | 27405532 | 27405893 | ALB | 359 | 683 | 4 | 74280437 | 74280763 | |
| AI207513 | ALB | 1 | 154 | 4 | 74270006 | 74270868 | SETD4 | 148 | 652 | 21 | 37444788 | 37445291 | |
| Top |
| Mutation type/ Tissue ID | brca | cns | cerv | endome | haematopo | kidn | Lintest | liver | lung | ns | ovary | pancre | prost | skin | stoma | thyro | urina | |||
| Total # sample | 1 | |||||||||||||||||||
| GAIN (# sample) | 1 | |||||||||||||||||||
| LOSS (# sample) |
| cf) Tissue ID; Tissue type (1; Breast, 2; Central_nervous_system, 3; Cervix, 4; Endometrium, 5; Haematopoietic_and_lymphoid_tissue, 6; Kidney, 7; Large_intestine, 8; Liver, 9; Lung, 10; NS, 11; Ovary, 12; Pancreas, 13; Prostate, 14; Skin, 15; Stomach, 16; Thyroid, 17; Urinary_tract) |
| Top |
|
 |
| Top |
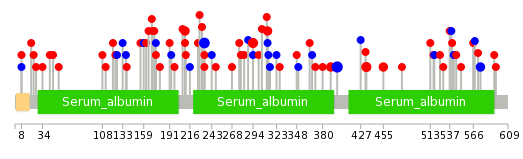
| Stat. for Non-Synonymous SNVs (# total SNVs=77) | (# total SNVs=26) |
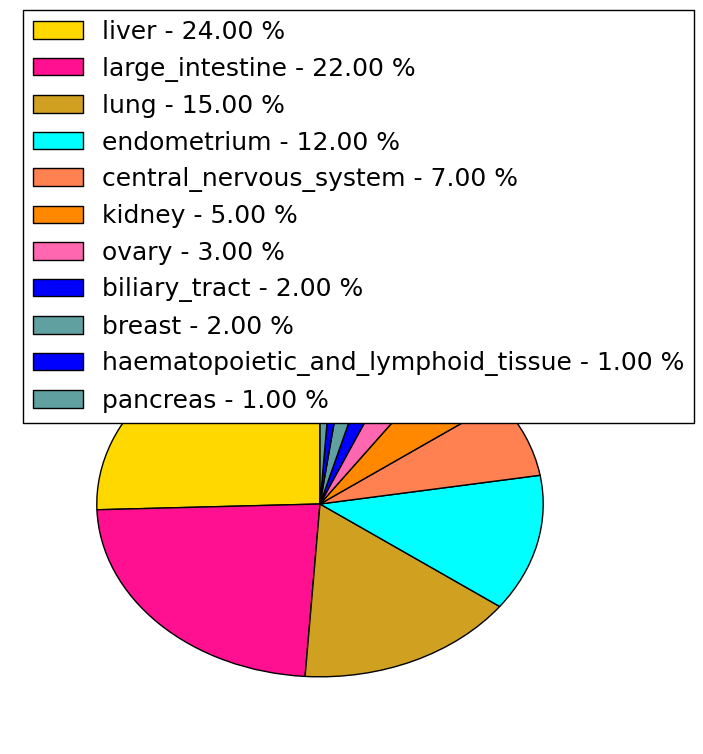 | 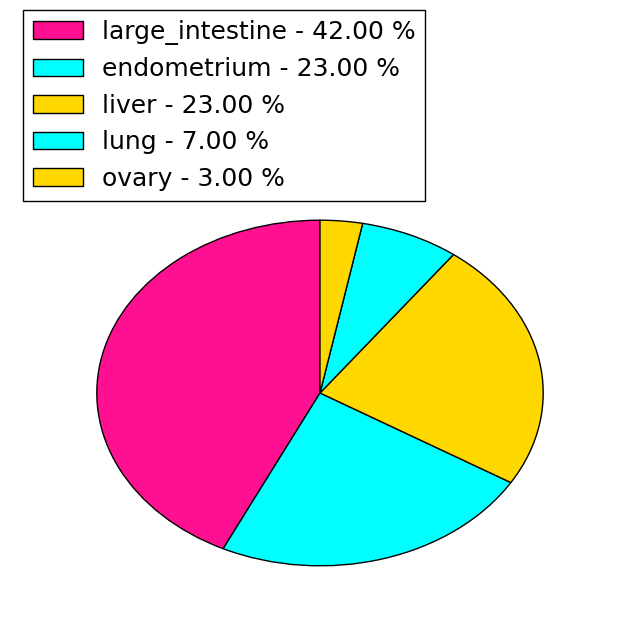 |
(# total SNVs=25) | (# total SNVs=3) |
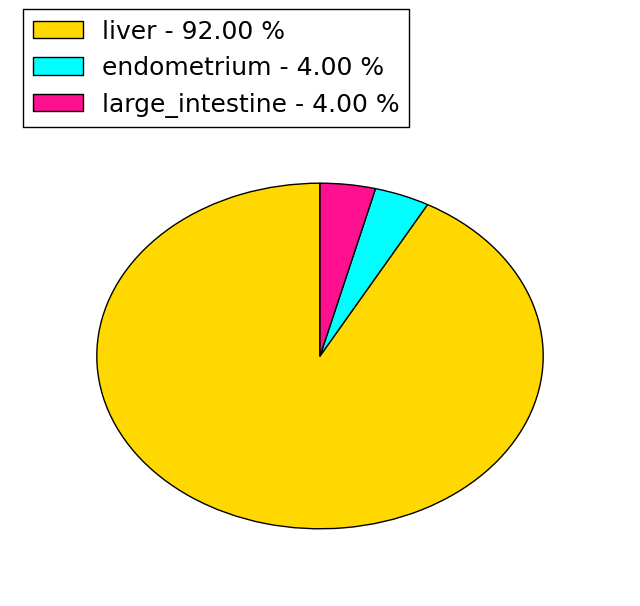 |  |
| Top |
| * When you move the cursor on each content, you can see more deailed mutation information on the Tooltip. Those are primary_site,primary_histology,mutation(aa),pubmedID. |
| GRCh37 position | Mutation(aa) | Unique sampleID count |
| chr4:74281975-74281975 | p.F398F | 6 |
| chr4:74280861-74280861 | p.P390S | 4 |
| chr4:74276115-74276115 | p.A234A | 4 |
| chr4:74279174-74279174 | p.S294L | 4 |
| chr4:74283258-74283258 | p.R434C | 4 |
| chr4:74276060-74276060 | p.S216L | 3 |
| chr4:74270067-74270067 | p.S8F | 3 |
| chr4:74285296-74285296 | p.F575F | 3 |
| chr4:74270083-74270083 | p.F13F | 2 |
| chr4:74282022-74282023 | p.N415fs*2 | 2 |
| Top |
|
 |
| Point Mutation/ Tissue ID | 1 | 2 | 3 | 4 | 5 | 6 | 7 | 8 | 9 | 10 | 11 | 12 | 13 | 14 | 15 | 16 | 17 | 18 | 19 | 20 |
| # sample | 4 | 16 | 4 | 5 | 2 | 1 | 6 | 4 | 4 | 25 | 5 | 1 | 11 | |||||||
| # mutation | 4 | 13 | 4 | 5 | 2 | 1 | 6 | 5 | 4 | 29 | 7 | 1 | 11 | |||||||
| nonsynonymous SNV | 2 | 8 | 4 | 4 | 2 | 1 | 5 | 4 | 3 | 19 | 5 | 1 | 8 | |||||||
| synonymous SNV | 2 | 5 | 1 | 1 | 1 | 1 | 10 | 2 | 3 |
| cf) Tissue ID; Tissue type (1; BLCA[Bladder Urothelial Carcinoma], 2; BRCA[Breast invasive carcinoma], 3; CESC[Cervical squamous cell carcinoma and endocervical adenocarcinoma], 4; COAD[Colon adenocarcinoma], 5; GBM[Glioblastoma multiforme], 6; Glioma Low Grade, 7; HNSC[Head and Neck squamous cell carcinoma], 8; KICH[Kidney Chromophobe], 9; KIRC[Kidney renal clear cell carcinoma], 10; KIRP[Kidney renal papillary cell carcinoma], 11; LAML[Acute Myeloid Leukemia], 12; LUAD[Lung adenocarcinoma], 13; LUSC[Lung squamous cell carcinoma], 14; OV[Ovarian serous cystadenocarcinoma ], 15; PAAD[Pancreatic adenocarcinoma], 16; PRAD[Prostate adenocarcinoma], 17; SKCM[Skin Cutaneous Melanoma], 18:STAD[Stomach adenocarcinoma], 19:THCA[Thyroid carcinoma], 20:UCEC[Uterine Corpus Endometrial Carcinoma]) |
| Top |
| * We represented just top 10 SNVs. When you move the cursor on each content, you can see more deailed mutation information on the Tooltip. Those are primary_site, primary_histology, mutation(aa), pubmedID. |
| Genomic Position | Mutation(aa) | Unique sampleID count |
| chr4:74281975 | p.F398F | 5 |
| chr4:74276115 | p.A234A | 4 |
| chr4:74283258 | p.S294L | 3 |
| chr4:74279174 | p.R434C | 3 |
| chr4:74276114 | p.R210W | 2 |
| chr4:74279228 | p.P390S | 2 |
| chr4:74276041 | p.H312R | 2 |
| chr4:74285296 | p.G455E | 2 |
| chr4:74280861 | p.F575F | 2 |
| chr4:74283322 | p.A234V | 2 |
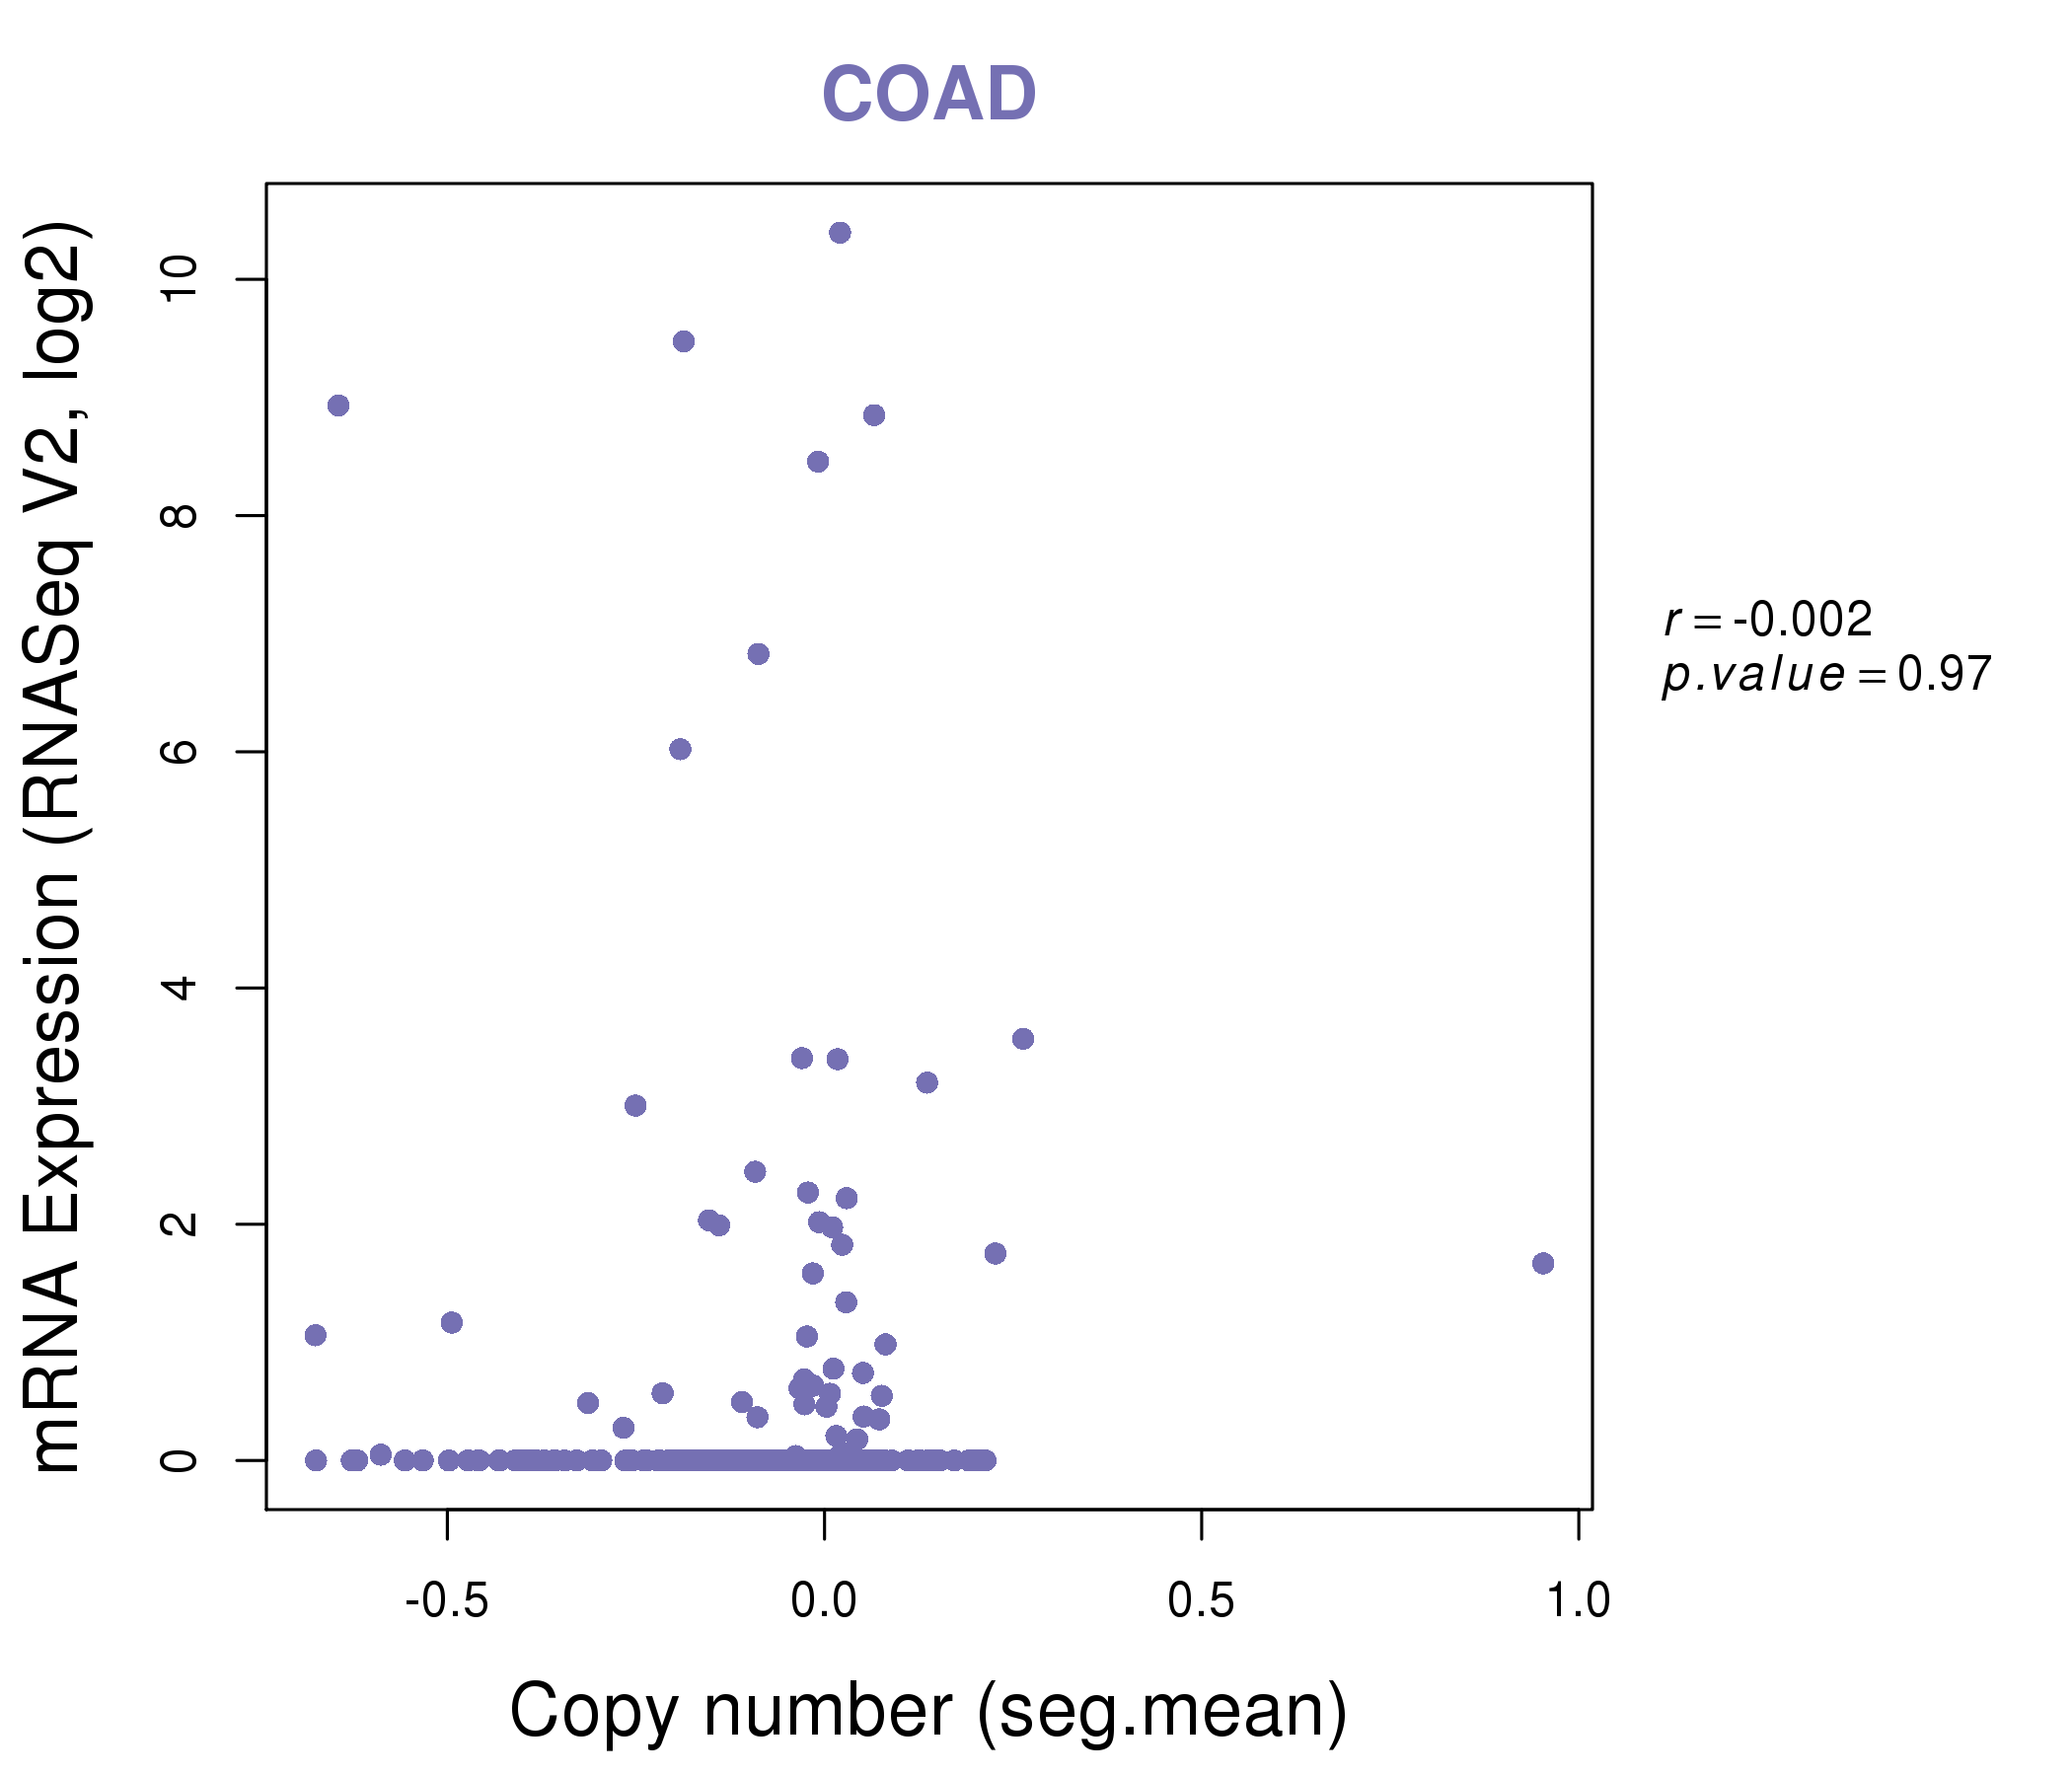
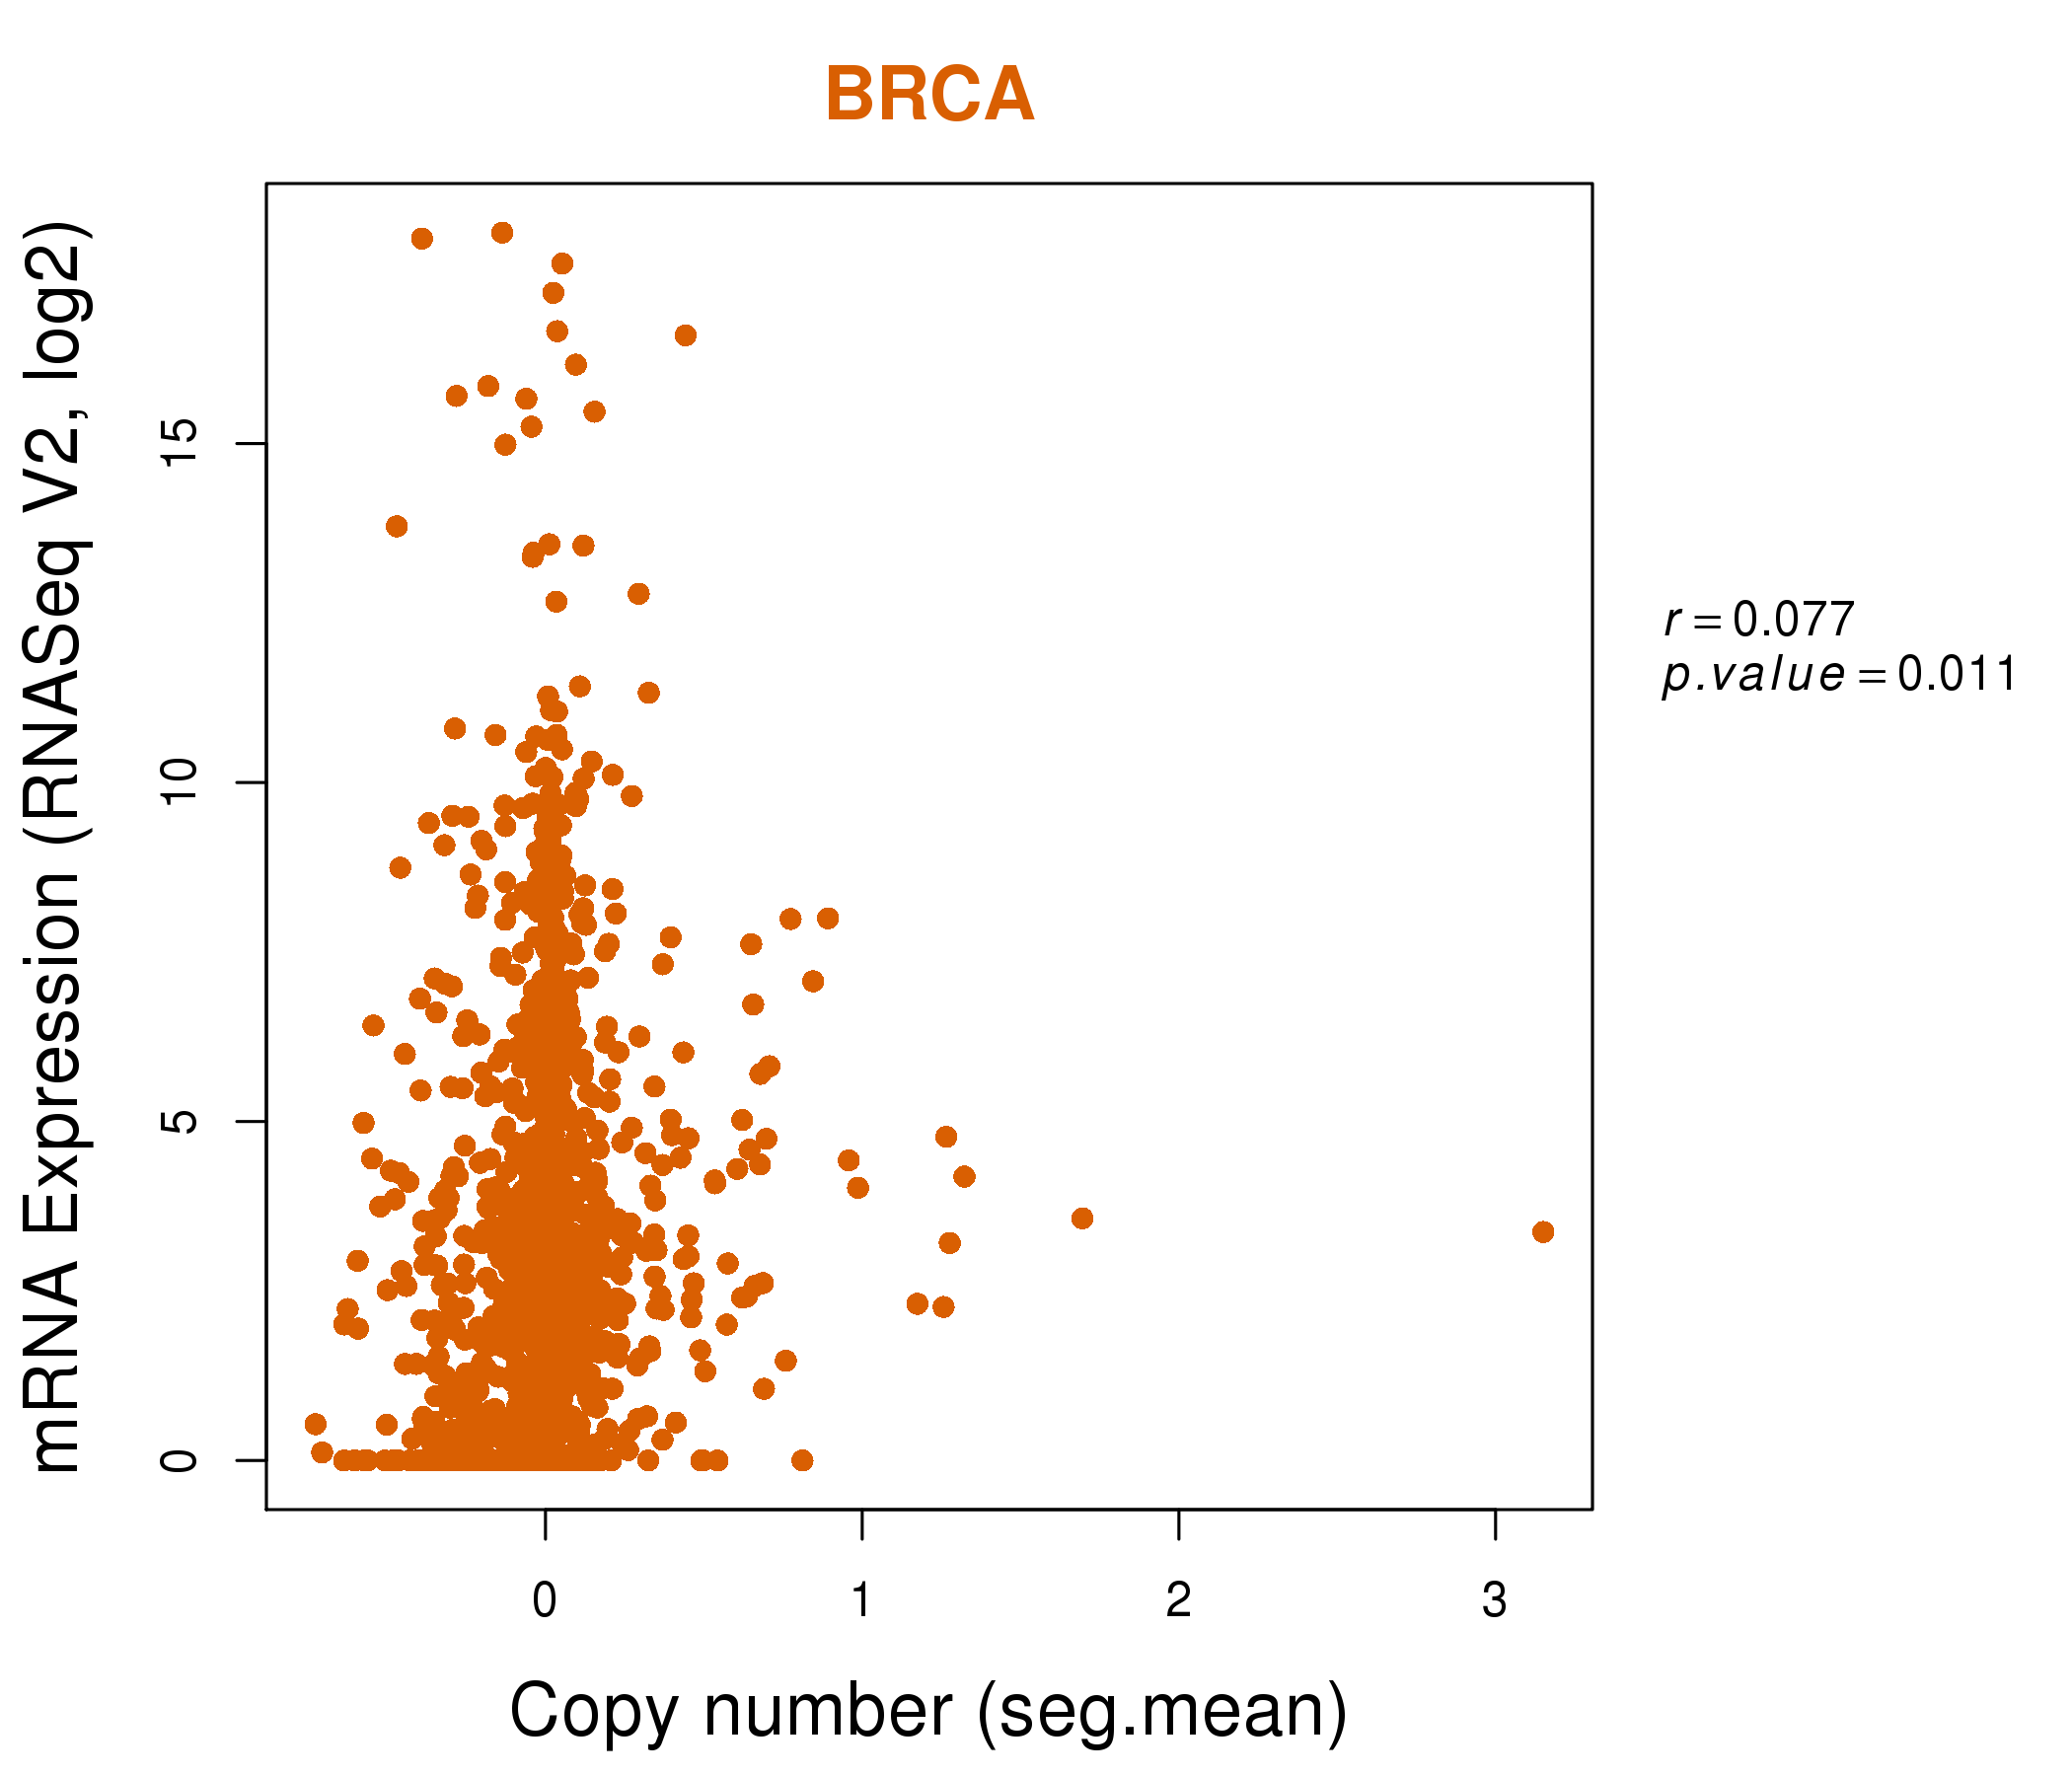
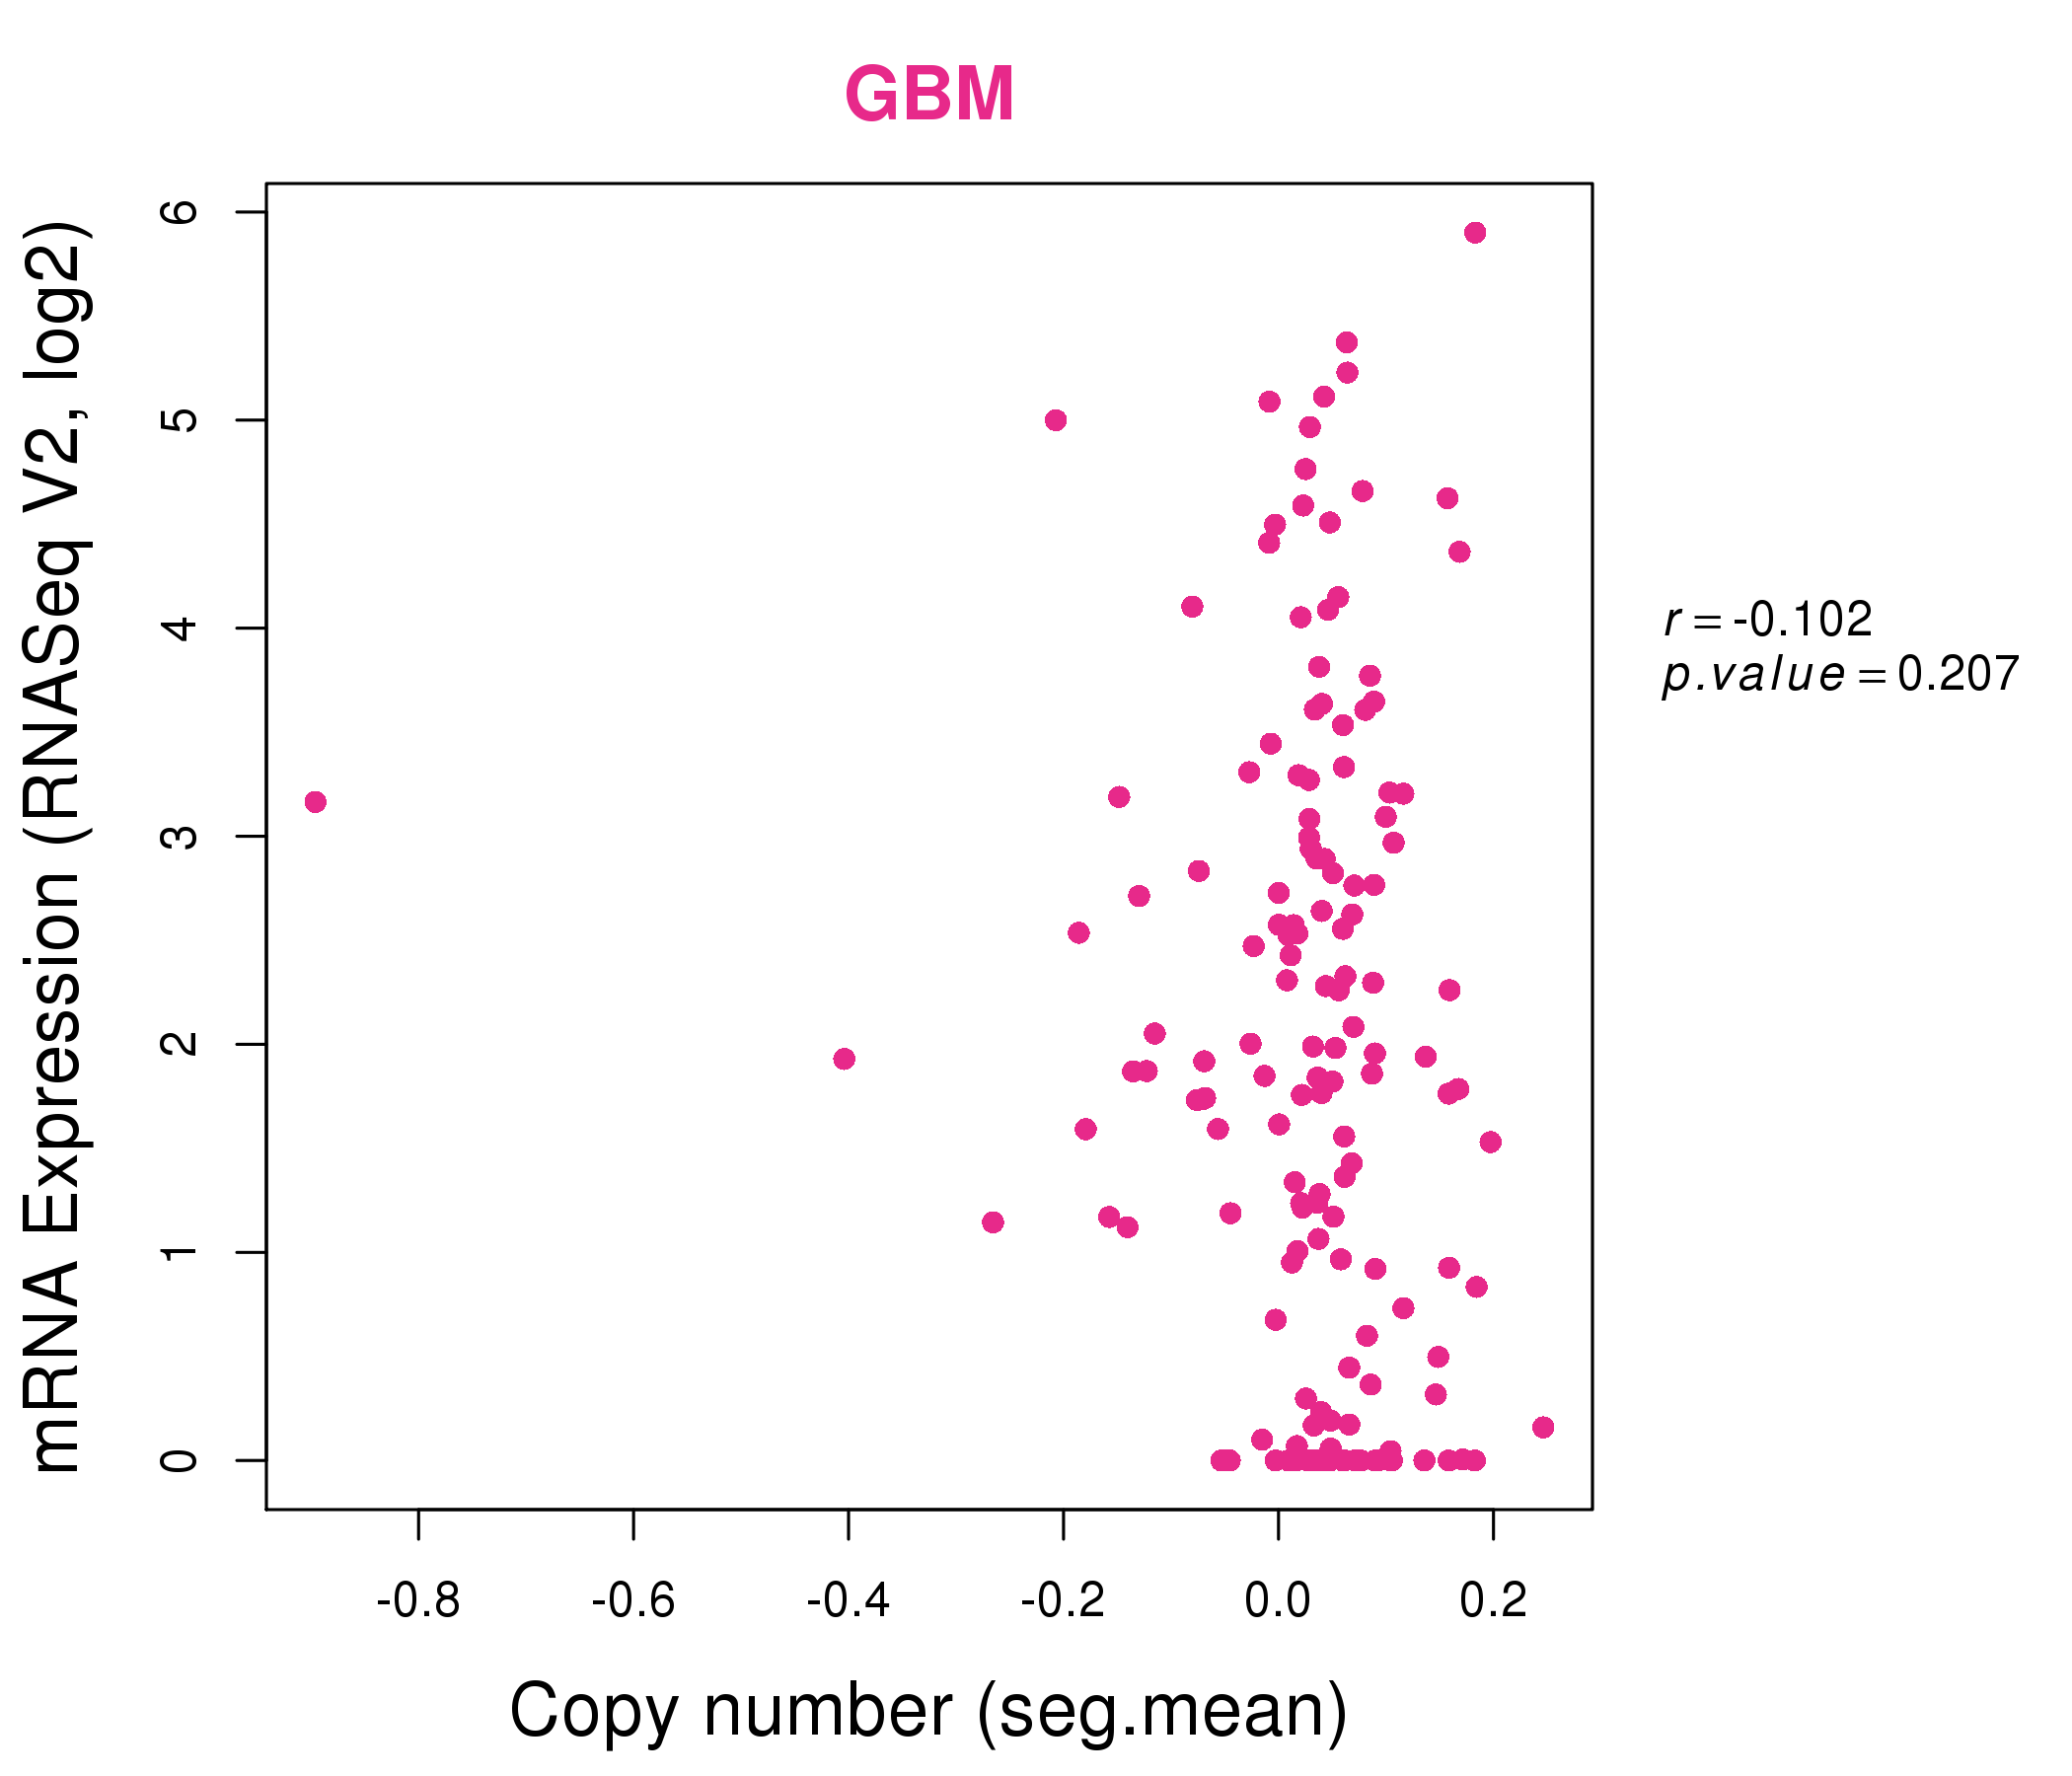
| * Copy number data were extracted from TCGA using R package TCGA-Assembler. The URLs of all public data files on TCGA DCC data server were gathered on Jan-05-2015. Function ProcessCNAData in TCGA-Assembler package was used to obtain gene-level copy number value which is calculated as the average copy number of the genomic region of a gene. |
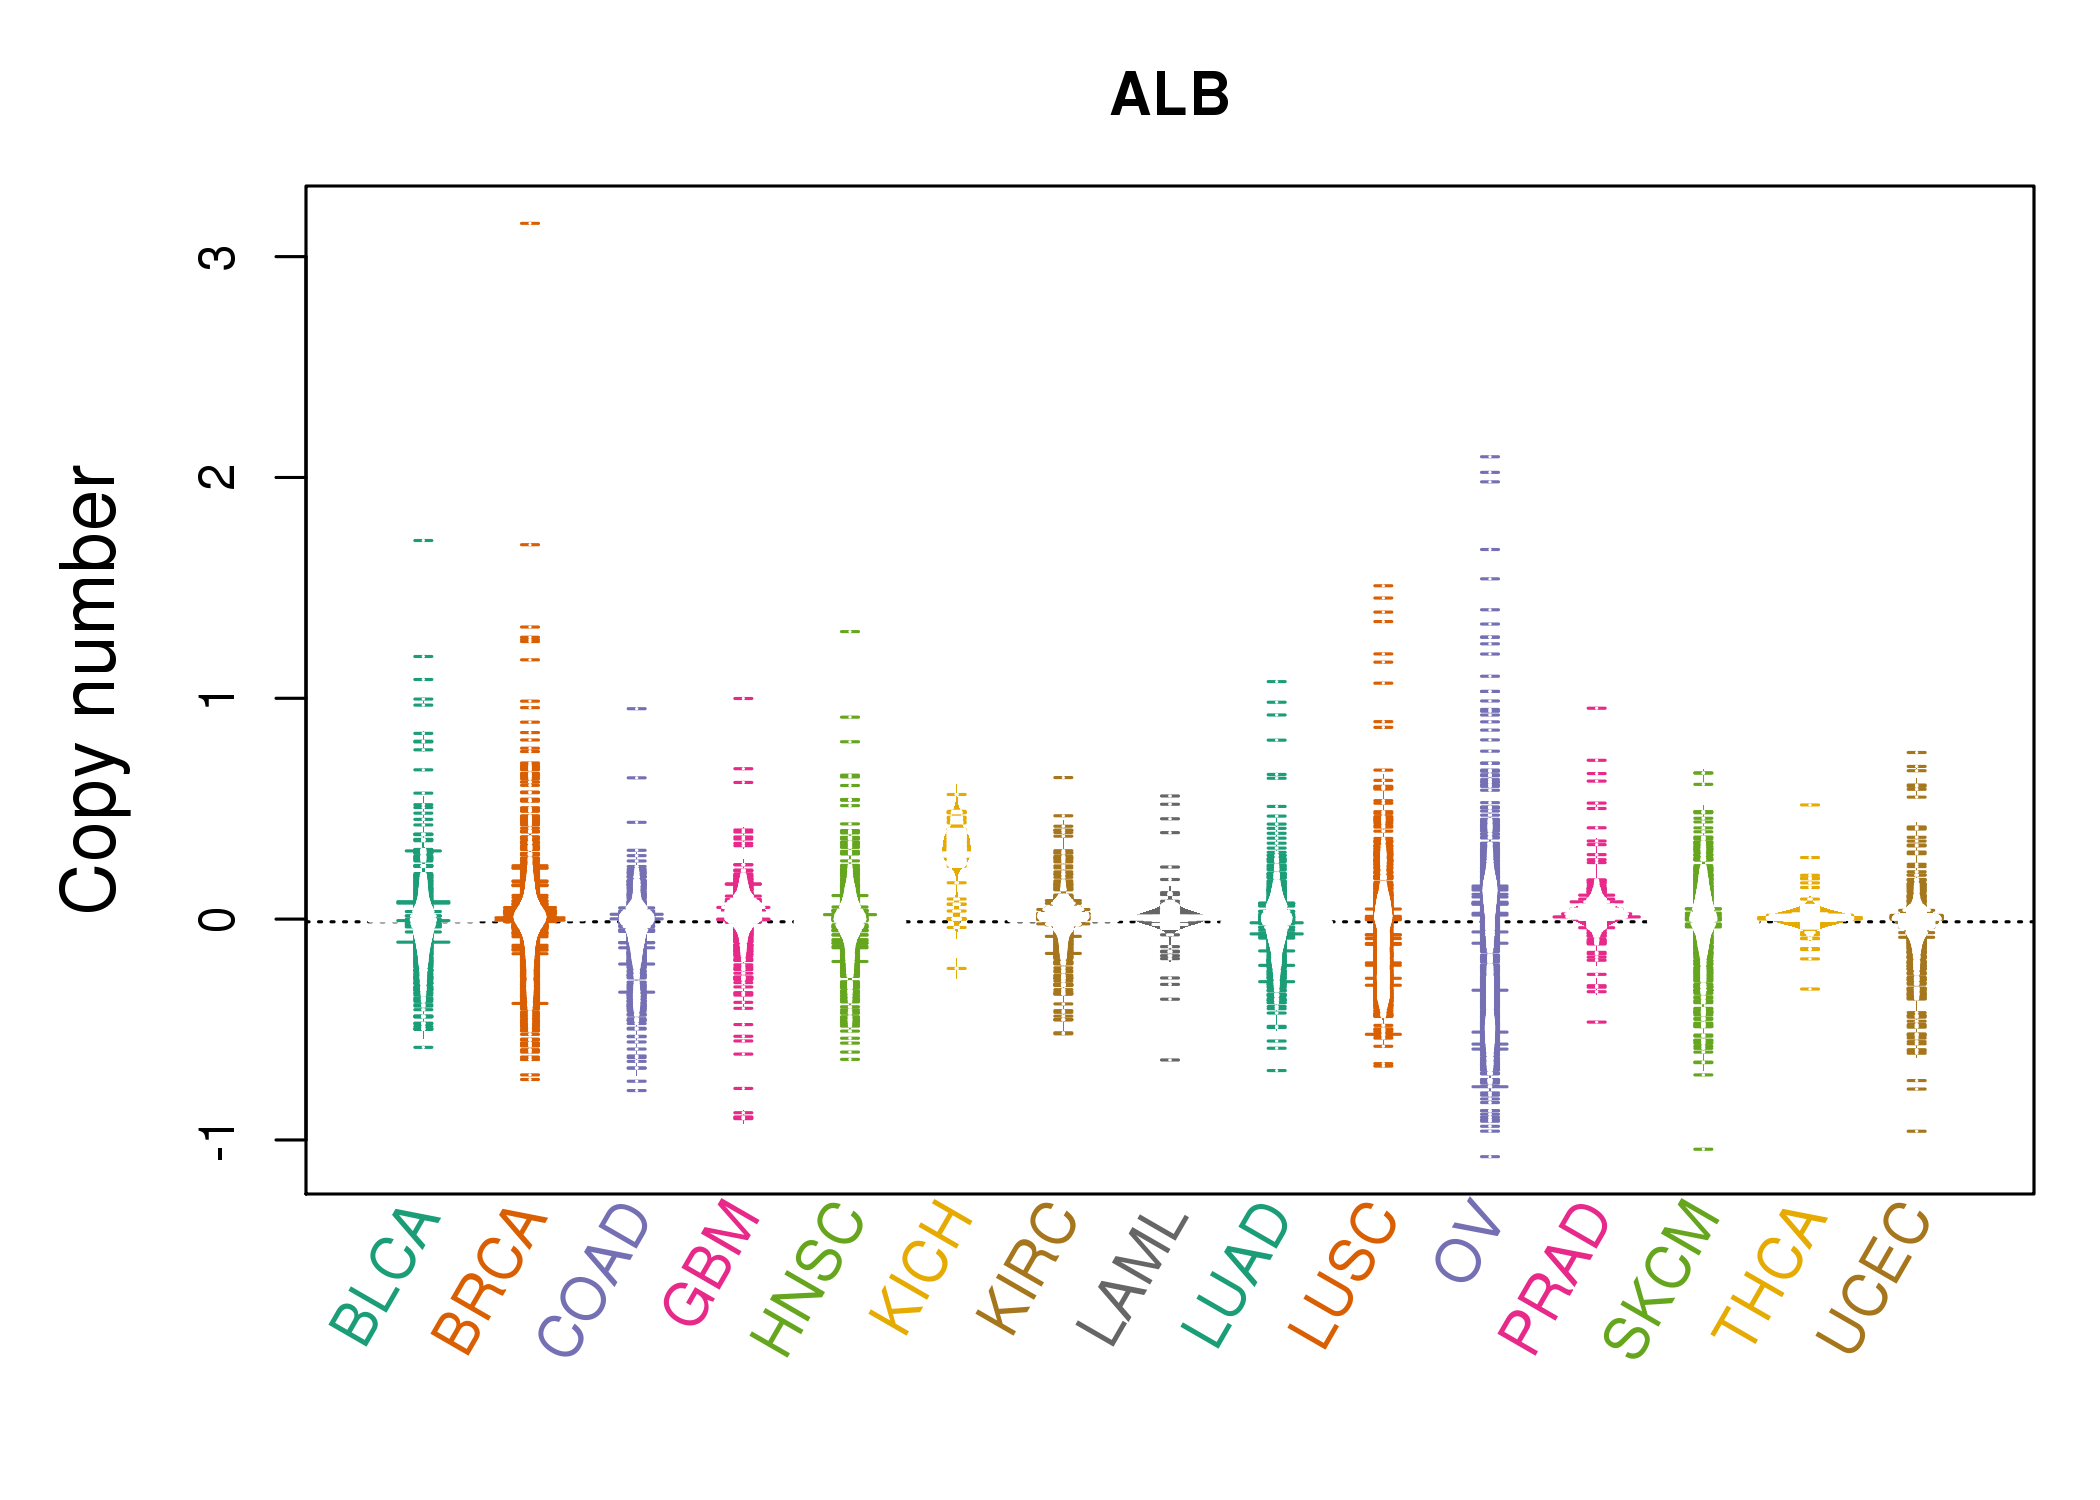 |
| cf) Tissue ID[Tissue type]: BLCA[Bladder Urothelial Carcinoma], BRCA[Breast invasive carcinoma], CESC[Cervical squamous cell carcinoma and endocervical adenocarcinoma], COAD[Colon adenocarcinoma], GBM[Glioblastoma multiforme], Glioma Low Grade, HNSC[Head and Neck squamous cell carcinoma], KICH[Kidney Chromophobe], KIRC[Kidney renal clear cell carcinoma], KIRP[Kidney renal papillary cell carcinoma], LAML[Acute Myeloid Leukemia], LUAD[Lung adenocarcinoma], LUSC[Lung squamous cell carcinoma], OV[Ovarian serous cystadenocarcinoma ], PAAD[Pancreatic adenocarcinoma], PRAD[Prostate adenocarcinoma], SKCM[Skin Cutaneous Melanoma], STAD[Stomach adenocarcinoma], THCA[Thyroid carcinoma], UCEC[Uterine Corpus Endometrial Carcinoma] |
| Top |
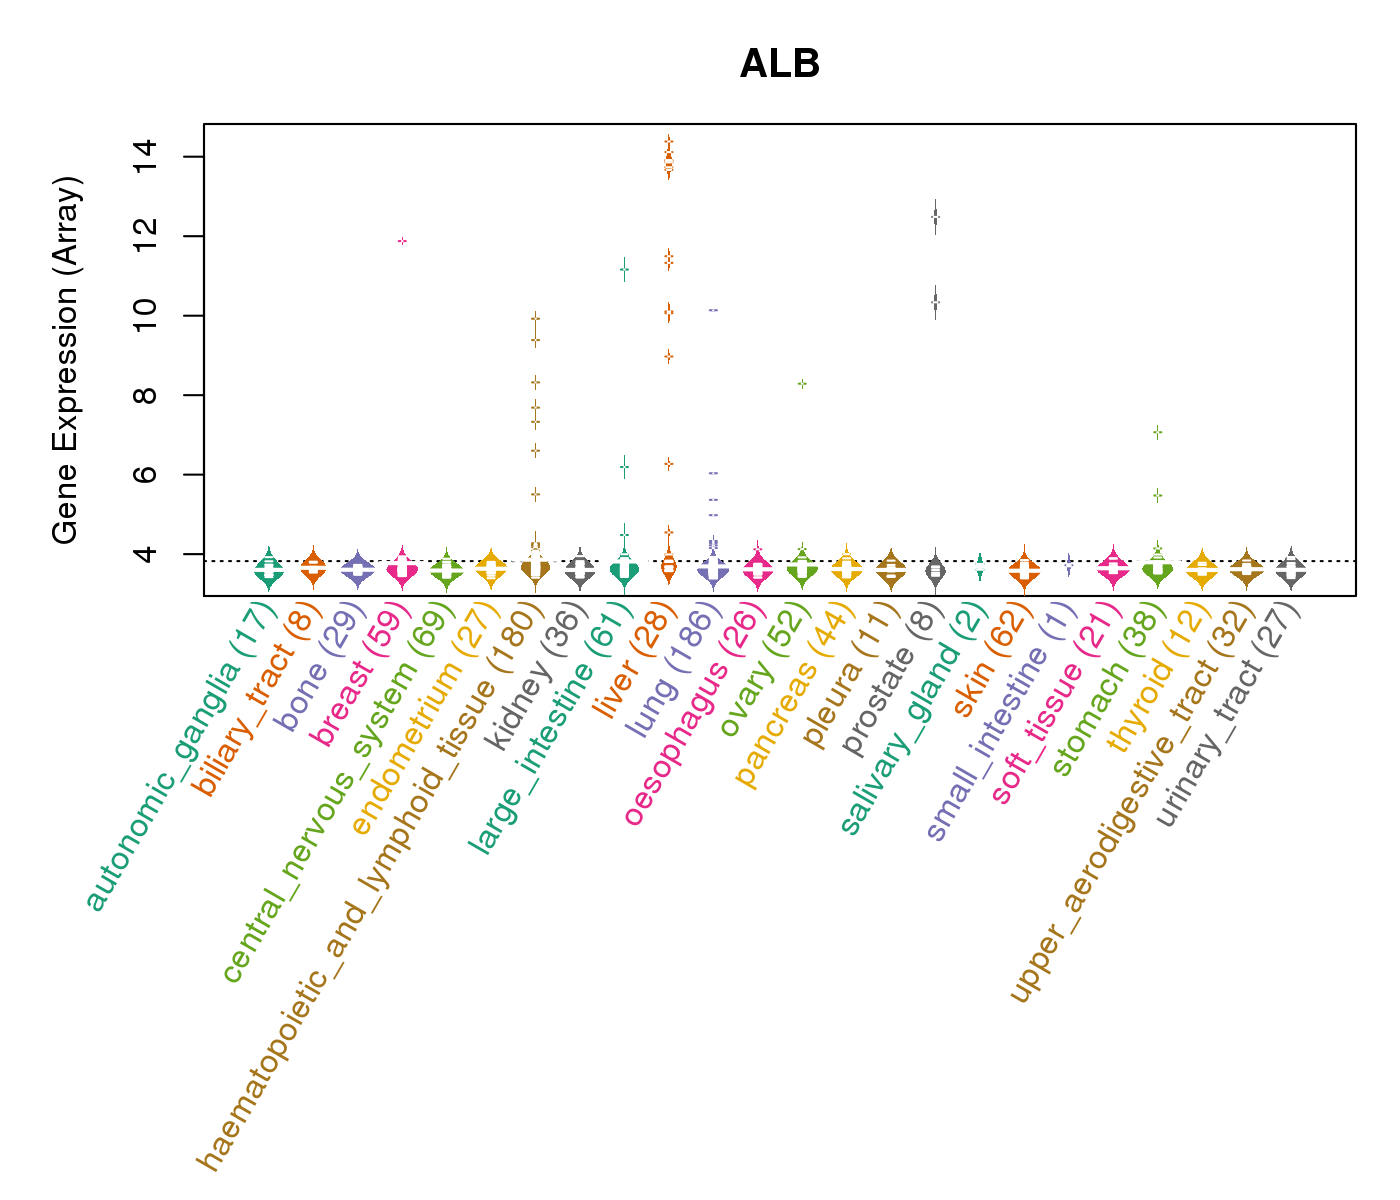
| Gene Expression for ALB |
| * CCLE gene expression data were extracted from CCLE_Expression_Entrez_2012-10-18.res: Gene-centric RMA-normalized mRNA expression data. |
 |
| * Normalized gene expression data of RNASeqV2 was extracted from TCGA using R package TCGA-Assembler. The URLs of all public data files on TCGA DCC data server were gathered at Jan-05-2015. Only eight cancer types have enough normal control samples for differential expression analysis. (t test, adjusted p<0.05 (using Benjamini-Hochberg FDR)) |
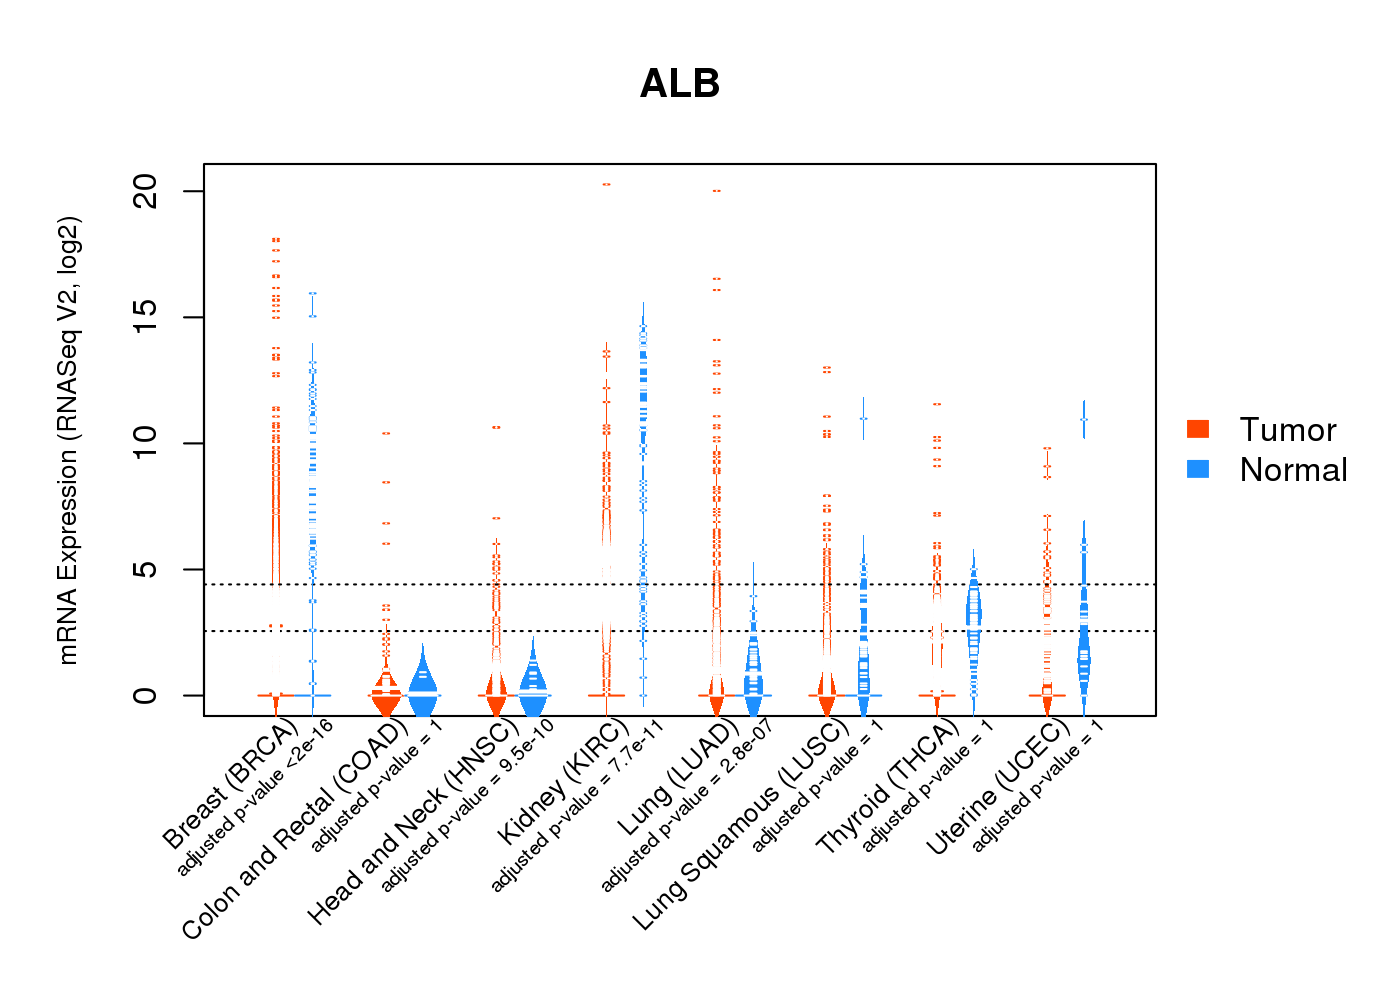 |
| Top |
| * This plots show the correlation between CNV and gene expression. |
: Open all plots for all cancer types
 |
|
 |
|
| Top |
| Gene-Gene Network Information |
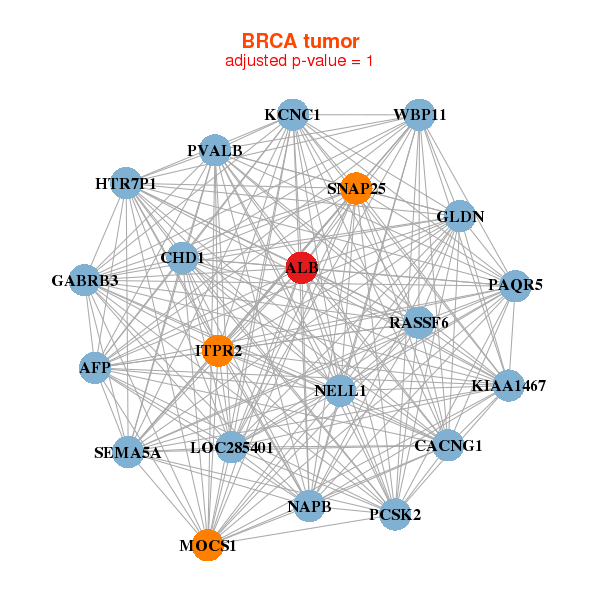
| * Co-Expression network figures were drawn using R package igraph. Only the top 20 genes with the highest correlations were shown. Red circle: input gene, orange circle: cell metabolism gene, sky circle: other gene |
: Open all plots for all cancer types
 |
| ||||
| AFP,ALB,CACNG1,CHD1,GABRB3,GLDN,HTR7P1, ITPR2,KCNC1,KIAA1467,LOC285401,MOCS1,NAPB,NELL1, PAQR5,PCSK2,PVALB,RASSF6,SEMA5A,SNAP25,WBP11 | AFP,ALB,ANGPTL3,BCO1,HNF1A-AS1,SMCO3,LINC00470___CHMP1B, HABP2,HNF1A,KCNH6,KIF12,MIA2,MTNR1B,PKHD1, POTED,SCARNA15,TMED6,TTLL6,UGT2B15,UTS2,ZNF385B | ||||
 |
| ||||
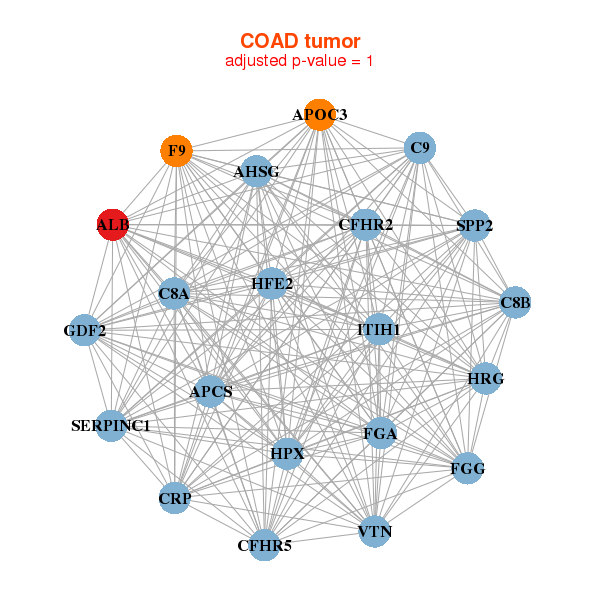
| AHSG,ALB,APCS,APOC3,C8A,C8B,C9, CFHR2,CFHR5,CRP,F9,FGA,FGG,GDF2, HFE2,HPX,HRG,ITIH1,SERPINC1,SPP2,VTN | ALB,APCS,APOA2,C3P1,C8A,CFHR2,CFHR5, CYP4A22,DNAJB8,F13B,F9,FGG,HRG,KIR3DP1, KRTAP4-11,KRTAP5-3,LECT2,LOC100129935,LINC00160,OR1N1,SLC17A2 |

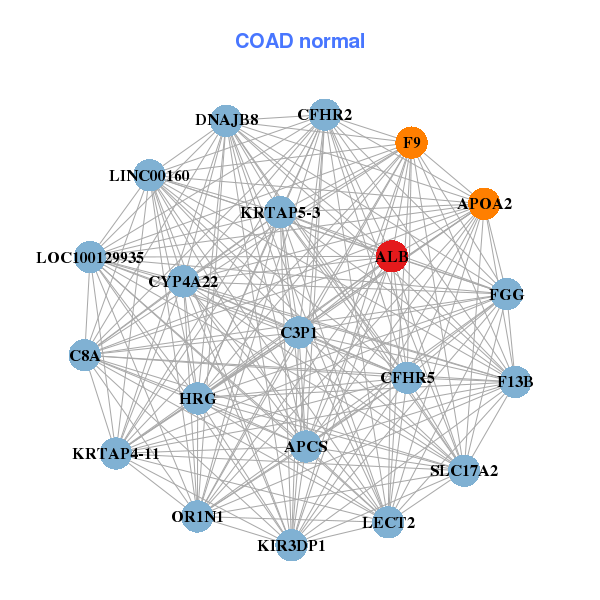
| * Co-Expression network figures were drawn using R package igraph. Only the top 20 genes with the highest correlations were shown. Red circle: input gene, orange circle: cell metabolism gene, sky circle: other gene |
: Open all plots for all cancer types
| Top |
: Open all interacting genes' information including KEGG pathway for all interacting genes from DAVID
| Top |
| Pharmacological Information for ALB |
| DB Category | DB Name | DB's ID and Url link |
| Chemistry | BindingDB | P02768; -. |
| Chemistry | ChEMBL | CHEMBL3253; -. |
| Chemistry | BindingDB | P02768; -. |
| Chemistry | ChEMBL | CHEMBL3253; -. |
| Organism-specific databases | PharmGKB | PA24690; -. |
| Organism-specific databases | PharmGKB | PA24690; -. |
| Organism-specific databases | CTD | 213; -. |
| Organism-specific databases | CTD | 213; -. |
| * Gene Centered Interaction Network. |
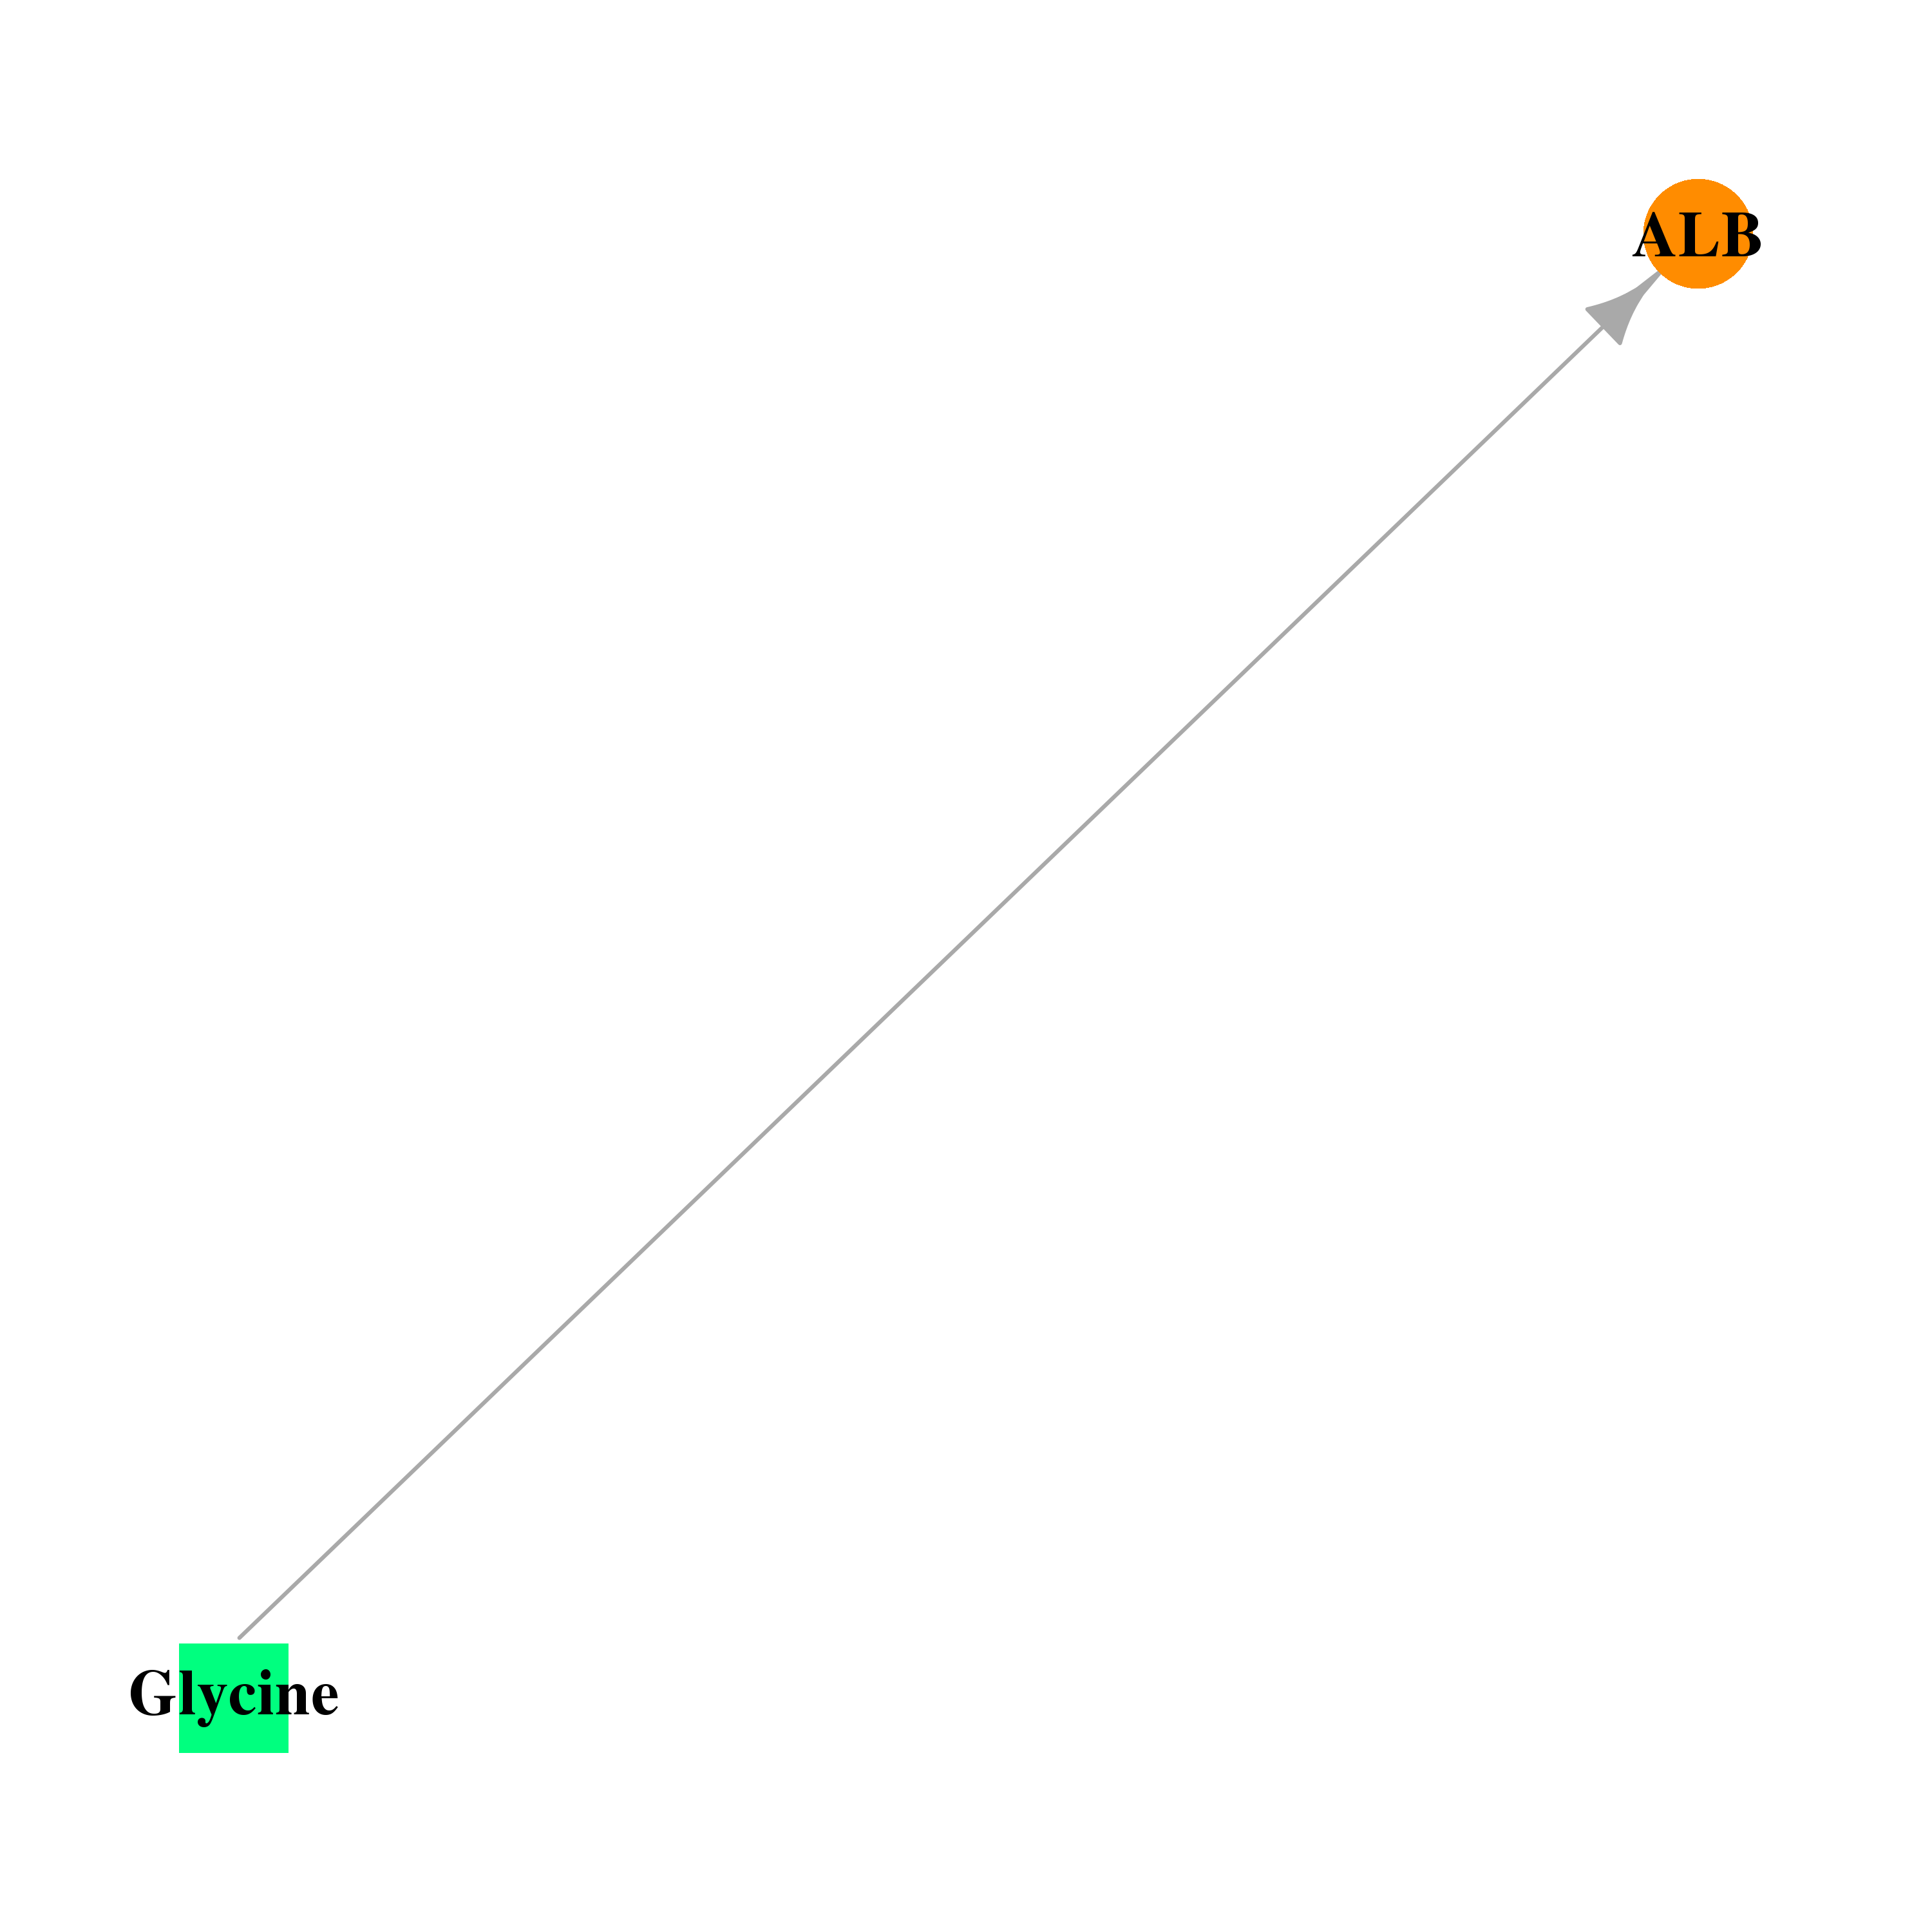 |
| * Drug Centered Interaction Network. |
| DrugBank ID | Target Name | Drug Groups | Generic Name | Drug Centered Network | Drug Structure |
| DB00145 | albumin | approved; nutraceutical | Glycine |  |  |
| Top |
| Cross referenced IDs for ALB |
| * We obtained these cross-references from Uniprot database. It covers 150 different DBs, 18 categories. http://www.uniprot.org/help/cross_references_section |
: Open all cross reference information
|
Copyright © 2016-Present - The Univsersity of Texas Health Science Center at Houston @ |