|
||||||||||||||||||||||||||||||||||||||||||||||||||||||||||||||||||||||||||||||||||||||||||||||||||||||||||||||||||||||||||||||||||||||||||||||||||||||||||||||||||||||||||||||||||||||||||||||||||||||||||||||||||||||||||||||||||||||||||||||||||||||||||||||||||||||||||||||||||||||||||||||||||||||||||||||||||||||||||
| |
| Phenotypic Information (metabolism pathway, cancer, disease, phenome) |
| |
| |
| Gene-Gene Network Information: Co-Expression Network, Interacting Genes & KEGG |
| |
|


| Gene Summary for EXT2 |
| Basic gene info. | Gene symbol | EXT2 |
| Gene name | exostosin glycosyltransferase 2 | |
| Synonyms | SOTV | |
| Cytomap | UCSC genome browser: 11p12-p11 | |
| Genomic location | chr11 :44117098-44266980 | |
| Type of gene | protein-coding | |
| RefGenes | NM_000401.3, NM_001178083.1,NM_207122.1, | |
| Ensembl id | ENSG00000151348 | |
| Description | N-acetylglucosaminyl-proteoglycan 4-beta-glucuronosyltransferaseexostosin-2glucuronosyl-N-acetylglucosaminyl-proteoglycan/N-acetylglucosaminyl-proteoglycan 4-alpha-N-acetylglucosaminyltransferasemultiple exostoses protein 2putative tumor suppressor pr | |
| Modification date | 20141219 | |
| dbXrefs | MIM : 608210 | |
| HGNC : HGNC | ||
| Ensembl : ENSG00000151348 | ||
| HPRD : 00599 | ||
| Vega : OTTHUMG00000166498 | ||
| Protein | UniProt: Q93063 go to UniProt's Cross Reference DB Table | |
| Expression | CleanEX: HS_EXT2 | |
| BioGPS: 2132 | ||
| Gene Expression Atlas: ENSG00000151348 | ||
| The Human Protein Atlas: ENSG00000151348 | ||
| Pathway | NCI Pathway Interaction Database: EXT2 | |
| KEGG: EXT2 | ||
| REACTOME: EXT2 | ||
| ConsensusPathDB | ||
| Pathway Commons: EXT2 | ||
| Metabolism | MetaCyc: EXT2 | |
| HUMANCyc: EXT2 | ||
| Regulation | Ensembl's Regulation: ENSG00000151348 | |
| miRBase: chr11 :44,117,098-44,266,980 | ||
| TargetScan: NM_000401 | ||
| cisRED: ENSG00000151348 | ||
| Context | iHOP: EXT2 | |
| cancer metabolism search in PubMed: EXT2 | ||
| UCL Cancer Institute: EXT2 | ||
| Assigned class in ccmGDB | A - This gene has a literature evidence and it belongs to cancer gene. | |
| References showing role of EXT2 in cancer cell metabolism | 1. Suhovskih AV, Domanitskaya NV, Tsidulko AY, Prudnikova TY, Kashuba VI, et al. (2015) Tissue-specificity of heparan sulfate biosynthetic machinery in cancer. Cell Adh Migr: 0. doi: 10.1080/19336918.2015.1049801. go to article 2. Jones KB, Piombo V, Searby C, Kurriger G, Yang B, et al. (2010) A mouse model of osteochondromagenesis from clonal inactivation of Ext1 in chondrocytes. Proc Natl Acad Sci U S A 107: 2054-2059. doi: 10.1073/pnas.0910875107. pmid: 2836675. go to article 3. Busse-Wicher M, Wicher KB, Kusche-Gullberg M (2014) The exostosin family: proteins with many functions. Matrix Biol 35: 25-33. doi: 10.1016/j.matbio.2013.10.001. go to article | |
| Top |
| Phenotypic Information for EXT2(metabolism pathway, cancer, disease, phenome) |
| Cancer | CGAP: EXT2 |
| Familial Cancer Database: EXT2 | |
| * This gene is included in those cancer gene databases. |
|
|
|
|
|
|
| ||||||||||||||||||||||||||||||||||||||||||||||||||||||||||||||||||||||||||||||||||||||||||||||||||||||||||||||||||||||||||||||||||||||||||||||||||||||||||||||||||||||||||||||||||||||||||||||||||||||||||||||||||||||||||||||||||||||||||||||||||||||||||||||||||||||||||||||||||||||||||||||||||||||||||||||||||||
Oncogene 1 | Significant driver gene in | |||||||||||||||||||||||||||||||||||||||||||||||||||||||||||||||||||||||||||||||||||||||||||||||||||||||||||||||||||||||||||||||||||||||||||||||||||||||||||||||||||||||||||||||||||||||||||||||||||||||||||||||||||||||||||||||||||||||||||||||||||||||||||||||||||||||||||||||||||||||||||||||||||||||||||||||||||||||||
| cf) number; DB name 1 Oncogene; http://nar.oxfordjournals.org/content/35/suppl_1/D721.long, 2 Tumor Suppressor gene; https://bioinfo.uth.edu/TSGene/, 3 Cancer Gene Census; http://www.nature.com/nrc/journal/v4/n3/abs/nrc1299.html, 4 CancerGenes; http://nar.oxfordjournals.org/content/35/suppl_1/D721.long, 5 Network of Cancer Gene; http://ncg.kcl.ac.uk/index.php, 1Therapeutic Vulnerabilities in Cancer; http://cbio.mskcc.org/cancergenomics/statius/ |
| REACTOME_METABOLISM_OF_CARBOHYDRATES | |
| OMIM | 133701; phenotype. 601224; phenotype. 608210; gene. |
| Orphanet | 321; Multiple osteochondromas. 52022; Potocki-Shaffer syndrome. |
| Disease | KEGG Disease: EXT2 |
| MedGen: EXT2 (Human Medical Genetics with Condition) | |
| ClinVar: EXT2 | |
| Phenotype | MGI: EXT2 (International Mouse Phenotyping Consortium) |
| PhenomicDB: EXT2 | |
| Mutations for EXT2 |
| * Under tables are showing count per each tissue to give us broad intuition about tissue specific mutation patterns.You can go to the detailed page for each mutation database's web site. |
| - Statistics for Tissue and Mutation type | Top |
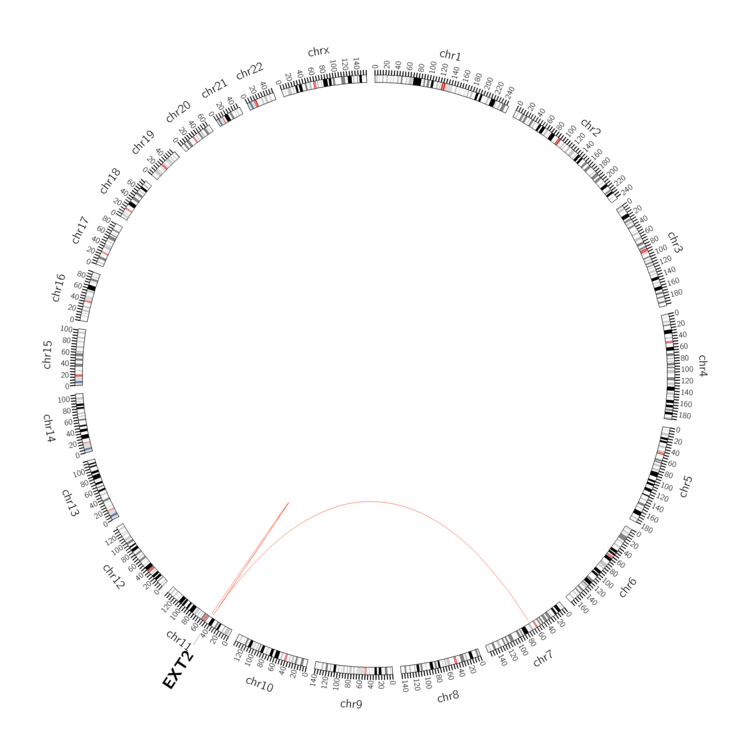 |
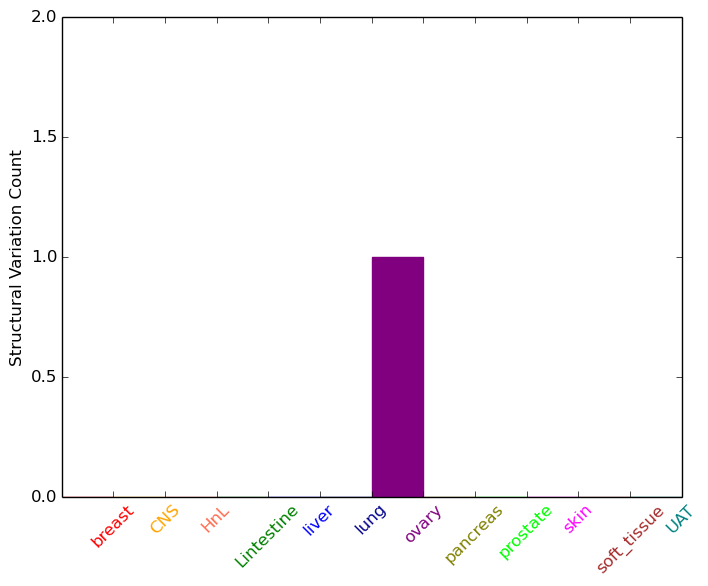
| - For Inter-chromosomal Variations |
| * Inter-chromosomal variantions includes 'interchromosomal amplicon to amplicon', 'interchromosomal amplicon to non-amplified dna', 'interchromosomal insertion', 'Interchromosomal unknown type'. |
 |
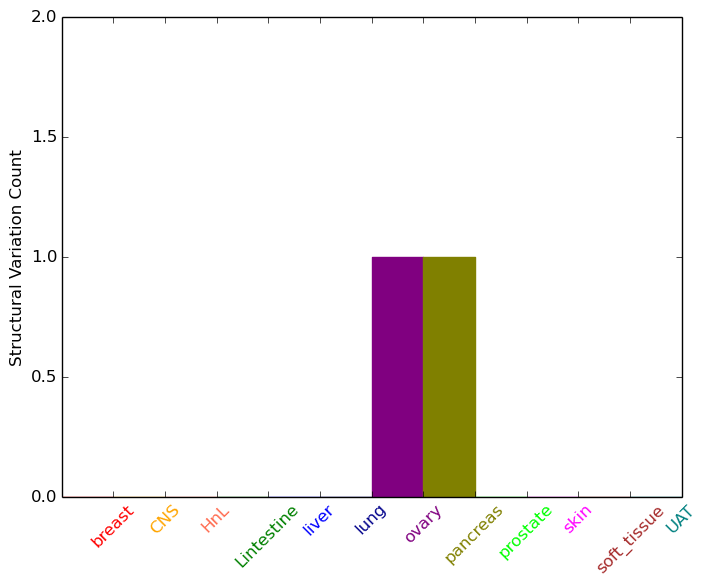
| - For Intra-chromosomal Variations |
| * Intra-chromosomal variantions includes 'intrachromosomal amplicon to amplicon', 'intrachromosomal amplicon to non-amplified dna', 'intrachromosomal deletion', 'intrachromosomal fold-back inversion', 'intrachromosomal inversion', 'intrachromosomal tandem duplication', 'Intrachromosomal unknown type', 'intrachromosomal with inverted orientation', 'intrachromosomal with non-inverted orientation'. |
 |
| Sample | Symbol_a | Chr_a | Start_a | End_a | Symbol_b | Chr_b | Start_b | End_b |
| ovary | EXT2 | chr11 | 44173451 | 44173471 | EXT2 | chr11 | 44173533 | 44173553 |
| pancreas | EXT2 | chr11 | 44259822 | 44259842 | chr11 | 47885222 | 47885242 |
| cf) Tissue number; Tissue name (1;Breast, 2;Central_nervous_system, 3;Haematopoietic_and_lymphoid_tissue, 4;Large_intestine, 5;Liver, 6;Lung, 7;Ovary, 8;Pancreas, 9;Prostate, 10;Skin, 11;Soft_tissue, 12;Upper_aerodigestive_tract) |
| * From mRNA Sanger sequences, Chitars2.0 arranged chimeric transcripts. This table shows EXT2 related fusion information. |
| ID | Head Gene | Tail Gene | Accession | Gene_a | qStart_a | qEnd_a | Chromosome_a | tStart_a | tEnd_a | Gene_a | qStart_a | qEnd_a | Chromosome_a | tStart_a | tEnd_a |
| AA554222 | CSTB | 2 | 148 | 21 | 45193831 | 45193977 | EXT2 | 144 | 254 | 11 | 44200528 | 44200638 | |
| T17444 | SBF2 | 186 | 207 | 11 | 10061641 | 10061662 | EXT2 | 190 | 459 | 11 | 44266705 | 44266974 | |
| Top |
| Mutation type/ Tissue ID | brca | cns | cerv | endome | haematopo | kidn | Lintest | liver | lung | ns | ovary | pancre | prost | skin | stoma | thyro | urina | |||
| Total # sample | 1 | 1 | 1 | |||||||||||||||||
| GAIN (# sample) | 1 | 1 | 1 | |||||||||||||||||
| LOSS (# sample) |
| cf) Tissue ID; Tissue type (1; Breast, 2; Central_nervous_system, 3; Cervix, 4; Endometrium, 5; Haematopoietic_and_lymphoid_tissue, 6; Kidney, 7; Large_intestine, 8; Liver, 9; Lung, 10; NS, 11; Ovary, 12; Pancreas, 13; Prostate, 14; Skin, 15; Stomach, 16; Thyroid, 17; Urinary_tract) |
| Top |
|
 |
| Top |
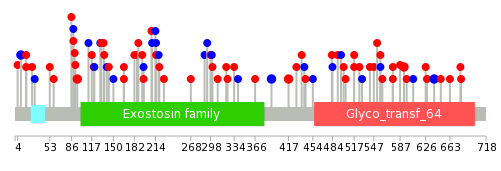
| Stat. for Non-Synonymous SNVs (# total SNVs=49) | (# total SNVs=16) |
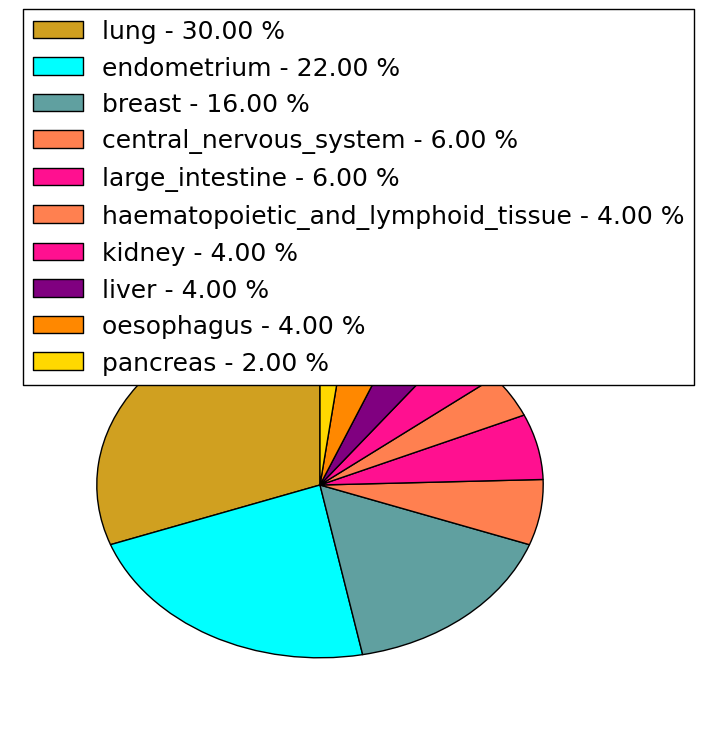 | 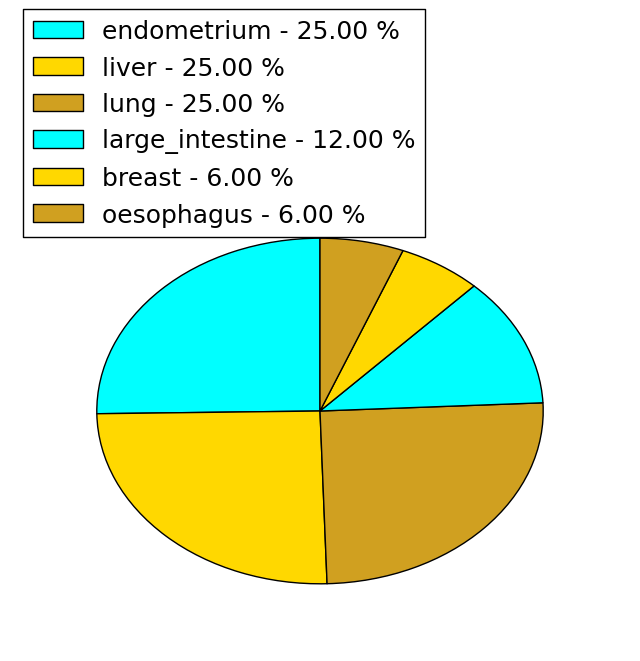 |
(# total SNVs=0) | (# total SNVs=0) |
| Top |
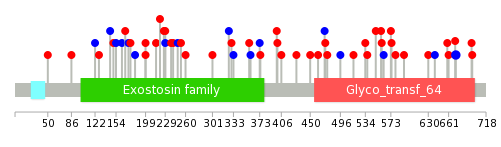
| * When you move the cursor on each content, you can see more deailed mutation information on the Tooltip. Those are primary_site,primary_histology,mutation(aa),pubmedID. |
| GRCh37 position | Mutation(aa) | Unique sampleID count |
| chr11:44129289-44129289 | p.I9I | 2 |
| chr11:44129312-44129312 | p.R17K | 2 |
| chr11:44129545-44129545 | p.R95C | 2 |
| chr11:44255775-44255775 | p.T639T | 2 |
| chr11:44151688-44151688 | p.Q391Q | 2 |
| chr11:44193237-44193237 | p.R417Q | 2 |
| chr11:44228397-44228397 | p.N517I | 2 |
| chr11:44130751-44130751 | p.R182* | 2 |
| chr11:44254017-44254017 | p.V593L | 2 |
| chr11:44219521-44219521 | p.S483F | 1 |
| Top |
|
 |
| Point Mutation/ Tissue ID | 1 | 2 | 3 | 4 | 5 | 6 | 7 | 8 | 9 | 10 | 11 | 12 | 13 | 14 | 15 | 16 | 17 | 18 | 19 | 20 |
| # sample | 1 | 6 | 4 | 1 | 2 | 2 | 5 | 2 | 1 | 2 | 8 | 10 | 11 | |||||||
| # mutation | 1 | 6 | 4 | 1 | 2 | 2 | 7 | 2 | 1 | 2 | 9 | 10 | 12 | |||||||
| nonsynonymous SNV | 6 | 2 | 1 | 2 | 2 | 6 | 1 | 1 | 2 | 5 | 6 | 8 | ||||||||
| synonymous SNV | 1 | 2 | 1 | 1 | 4 | 4 | 4 |
| cf) Tissue ID; Tissue type (1; BLCA[Bladder Urothelial Carcinoma], 2; BRCA[Breast invasive carcinoma], 3; CESC[Cervical squamous cell carcinoma and endocervical adenocarcinoma], 4; COAD[Colon adenocarcinoma], 5; GBM[Glioblastoma multiforme], 6; Glioma Low Grade, 7; HNSC[Head and Neck squamous cell carcinoma], 8; KICH[Kidney Chromophobe], 9; KIRC[Kidney renal clear cell carcinoma], 10; KIRP[Kidney renal papillary cell carcinoma], 11; LAML[Acute Myeloid Leukemia], 12; LUAD[Lung adenocarcinoma], 13; LUSC[Lung squamous cell carcinoma], 14; OV[Ovarian serous cystadenocarcinoma ], 15; PAAD[Pancreatic adenocarcinoma], 16; PRAD[Prostate adenocarcinoma], 17; SKCM[Skin Cutaneous Melanoma], 18:STAD[Stomach adenocarcinoma], 19:THCA[Thyroid carcinoma], 20:UCEC[Uterine Corpus Endometrial Carcinoma]) |
| Top |
| * We represented just top 10 SNVs. When you move the cursor on each content, you can see more deailed mutation information on the Tooltip. Those are primary_site, primary_histology, mutation(aa), pubmedID. |
| Genomic Position | Mutation(aa) | Unique sampleID count |
| chr11:44255775 | p.T672T,EXT2 | 2 |
| chr11:44129312 | p.P558S,EXT2 | 1 |
| chr11:44151611 | p.R215Q,EXT2 | 1 |
| chr11:44129712 | p.V373V,EXT2 | 1 |
| chr11:44228348 | p.Y559C,EXT2 | 1 |
| chr11:44135768 | p.L221W,EXT2 | 1 |
| chr11:44255677 | p.P374R,EXT2 | 1 |
| chr11:44129420 | p.I562I,EXT2 | 1 |
| chr11:44151632 | p.R50I,EXT2 | 1 |
| chr11:44129758 | p.G227E,EXT2 | 1 |
| * Copy number data were extracted from TCGA using R package TCGA-Assembler. The URLs of all public data files on TCGA DCC data server were gathered on Jan-05-2015. Function ProcessCNAData in TCGA-Assembler package was used to obtain gene-level copy number value which is calculated as the average copy number of the genomic region of a gene. |
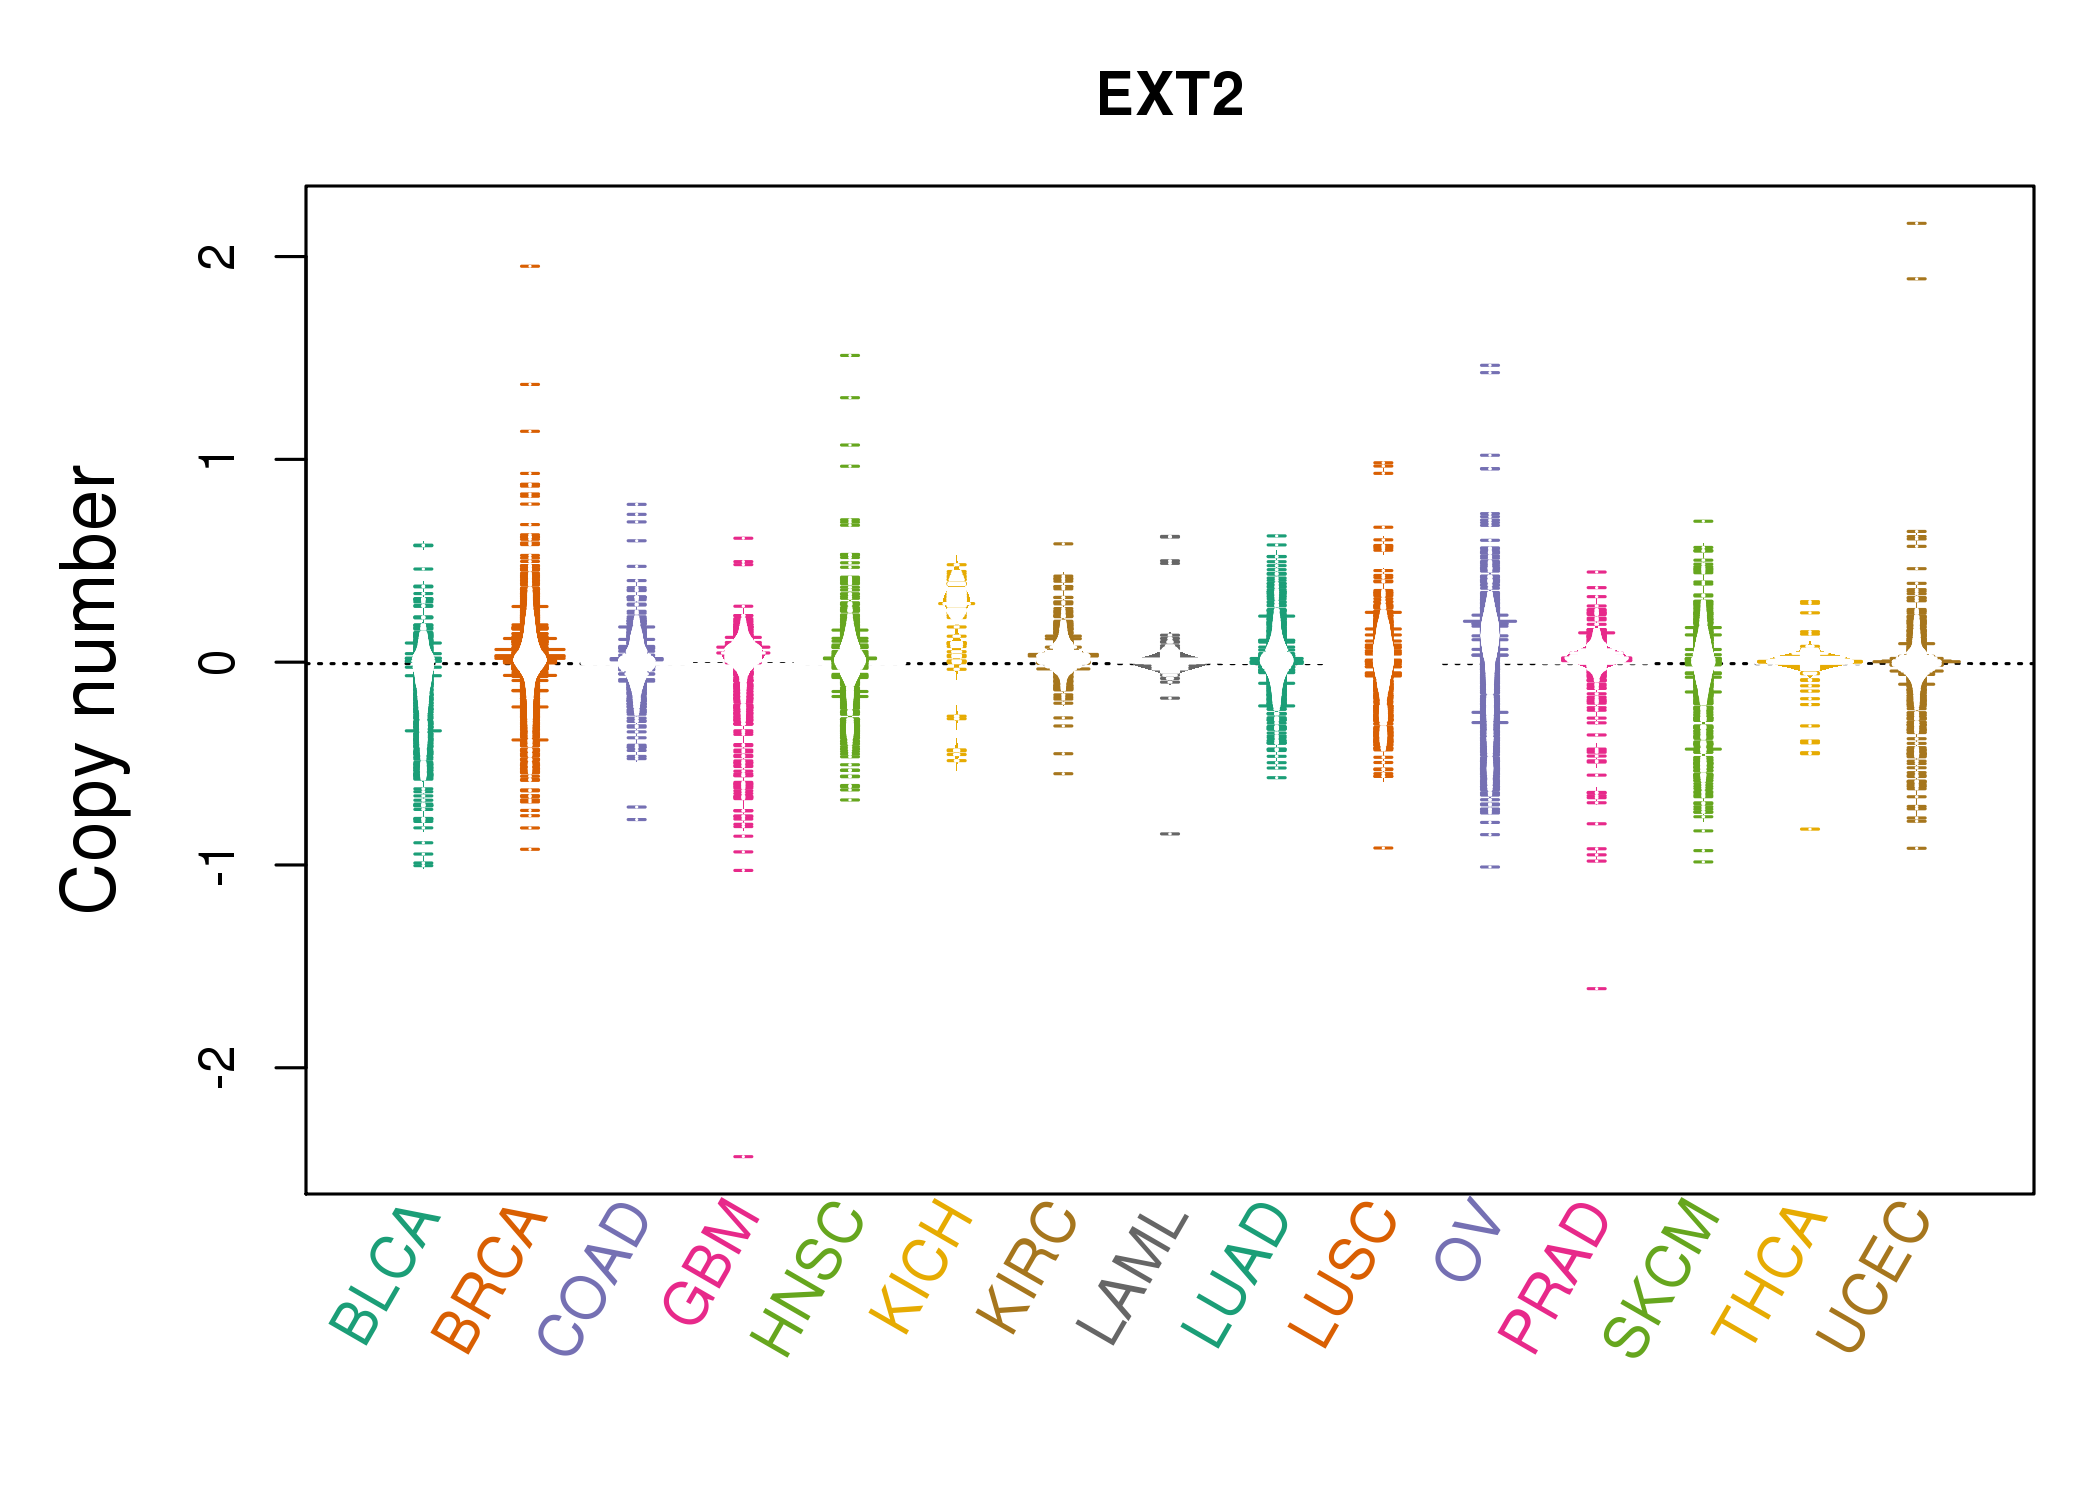 |
| cf) Tissue ID[Tissue type]: BLCA[Bladder Urothelial Carcinoma], BRCA[Breast invasive carcinoma], CESC[Cervical squamous cell carcinoma and endocervical adenocarcinoma], COAD[Colon adenocarcinoma], GBM[Glioblastoma multiforme], Glioma Low Grade, HNSC[Head and Neck squamous cell carcinoma], KICH[Kidney Chromophobe], KIRC[Kidney renal clear cell carcinoma], KIRP[Kidney renal papillary cell carcinoma], LAML[Acute Myeloid Leukemia], LUAD[Lung adenocarcinoma], LUSC[Lung squamous cell carcinoma], OV[Ovarian serous cystadenocarcinoma ], PAAD[Pancreatic adenocarcinoma], PRAD[Prostate adenocarcinoma], SKCM[Skin Cutaneous Melanoma], STAD[Stomach adenocarcinoma], THCA[Thyroid carcinoma], UCEC[Uterine Corpus Endometrial Carcinoma] |
| Top |
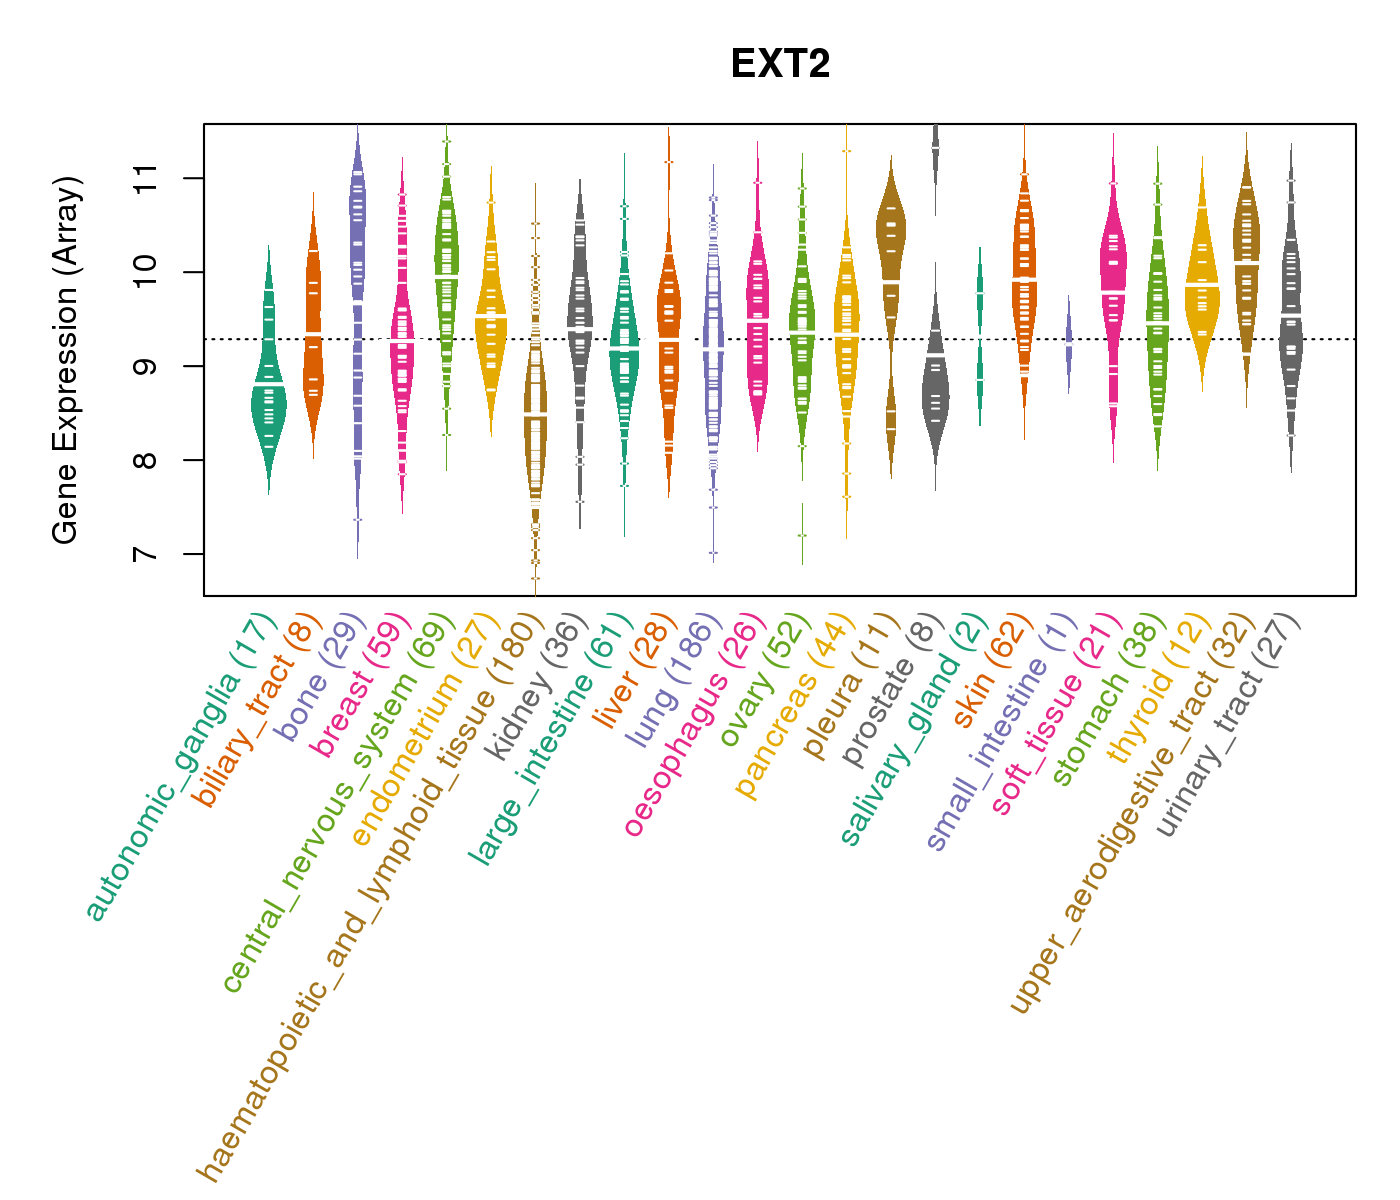
| Gene Expression for EXT2 |
| * CCLE gene expression data were extracted from CCLE_Expression_Entrez_2012-10-18.res: Gene-centric RMA-normalized mRNA expression data. |
 |
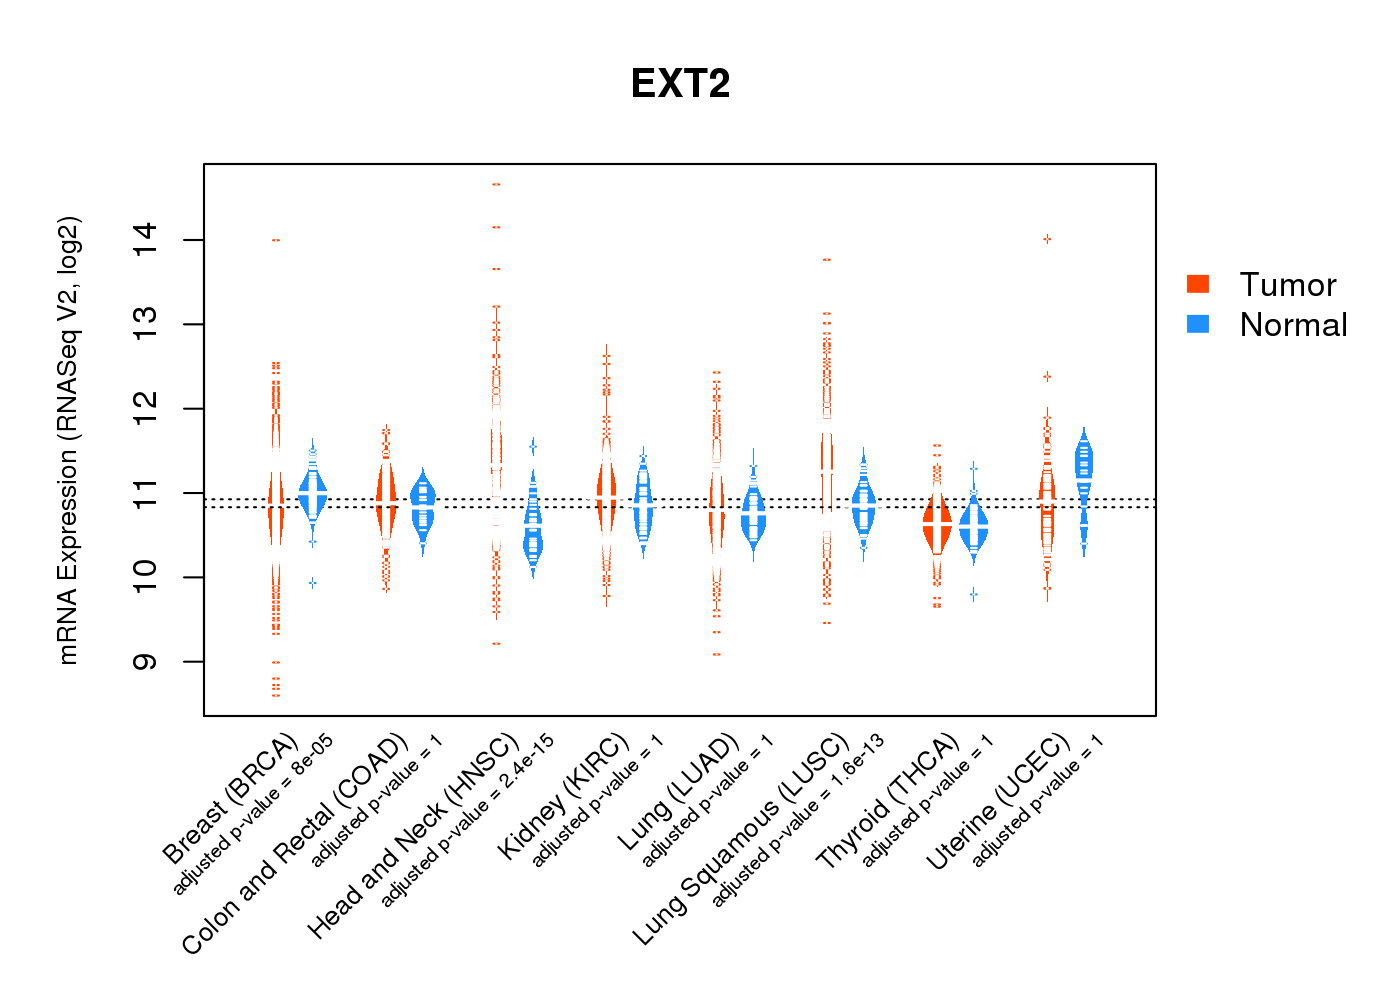
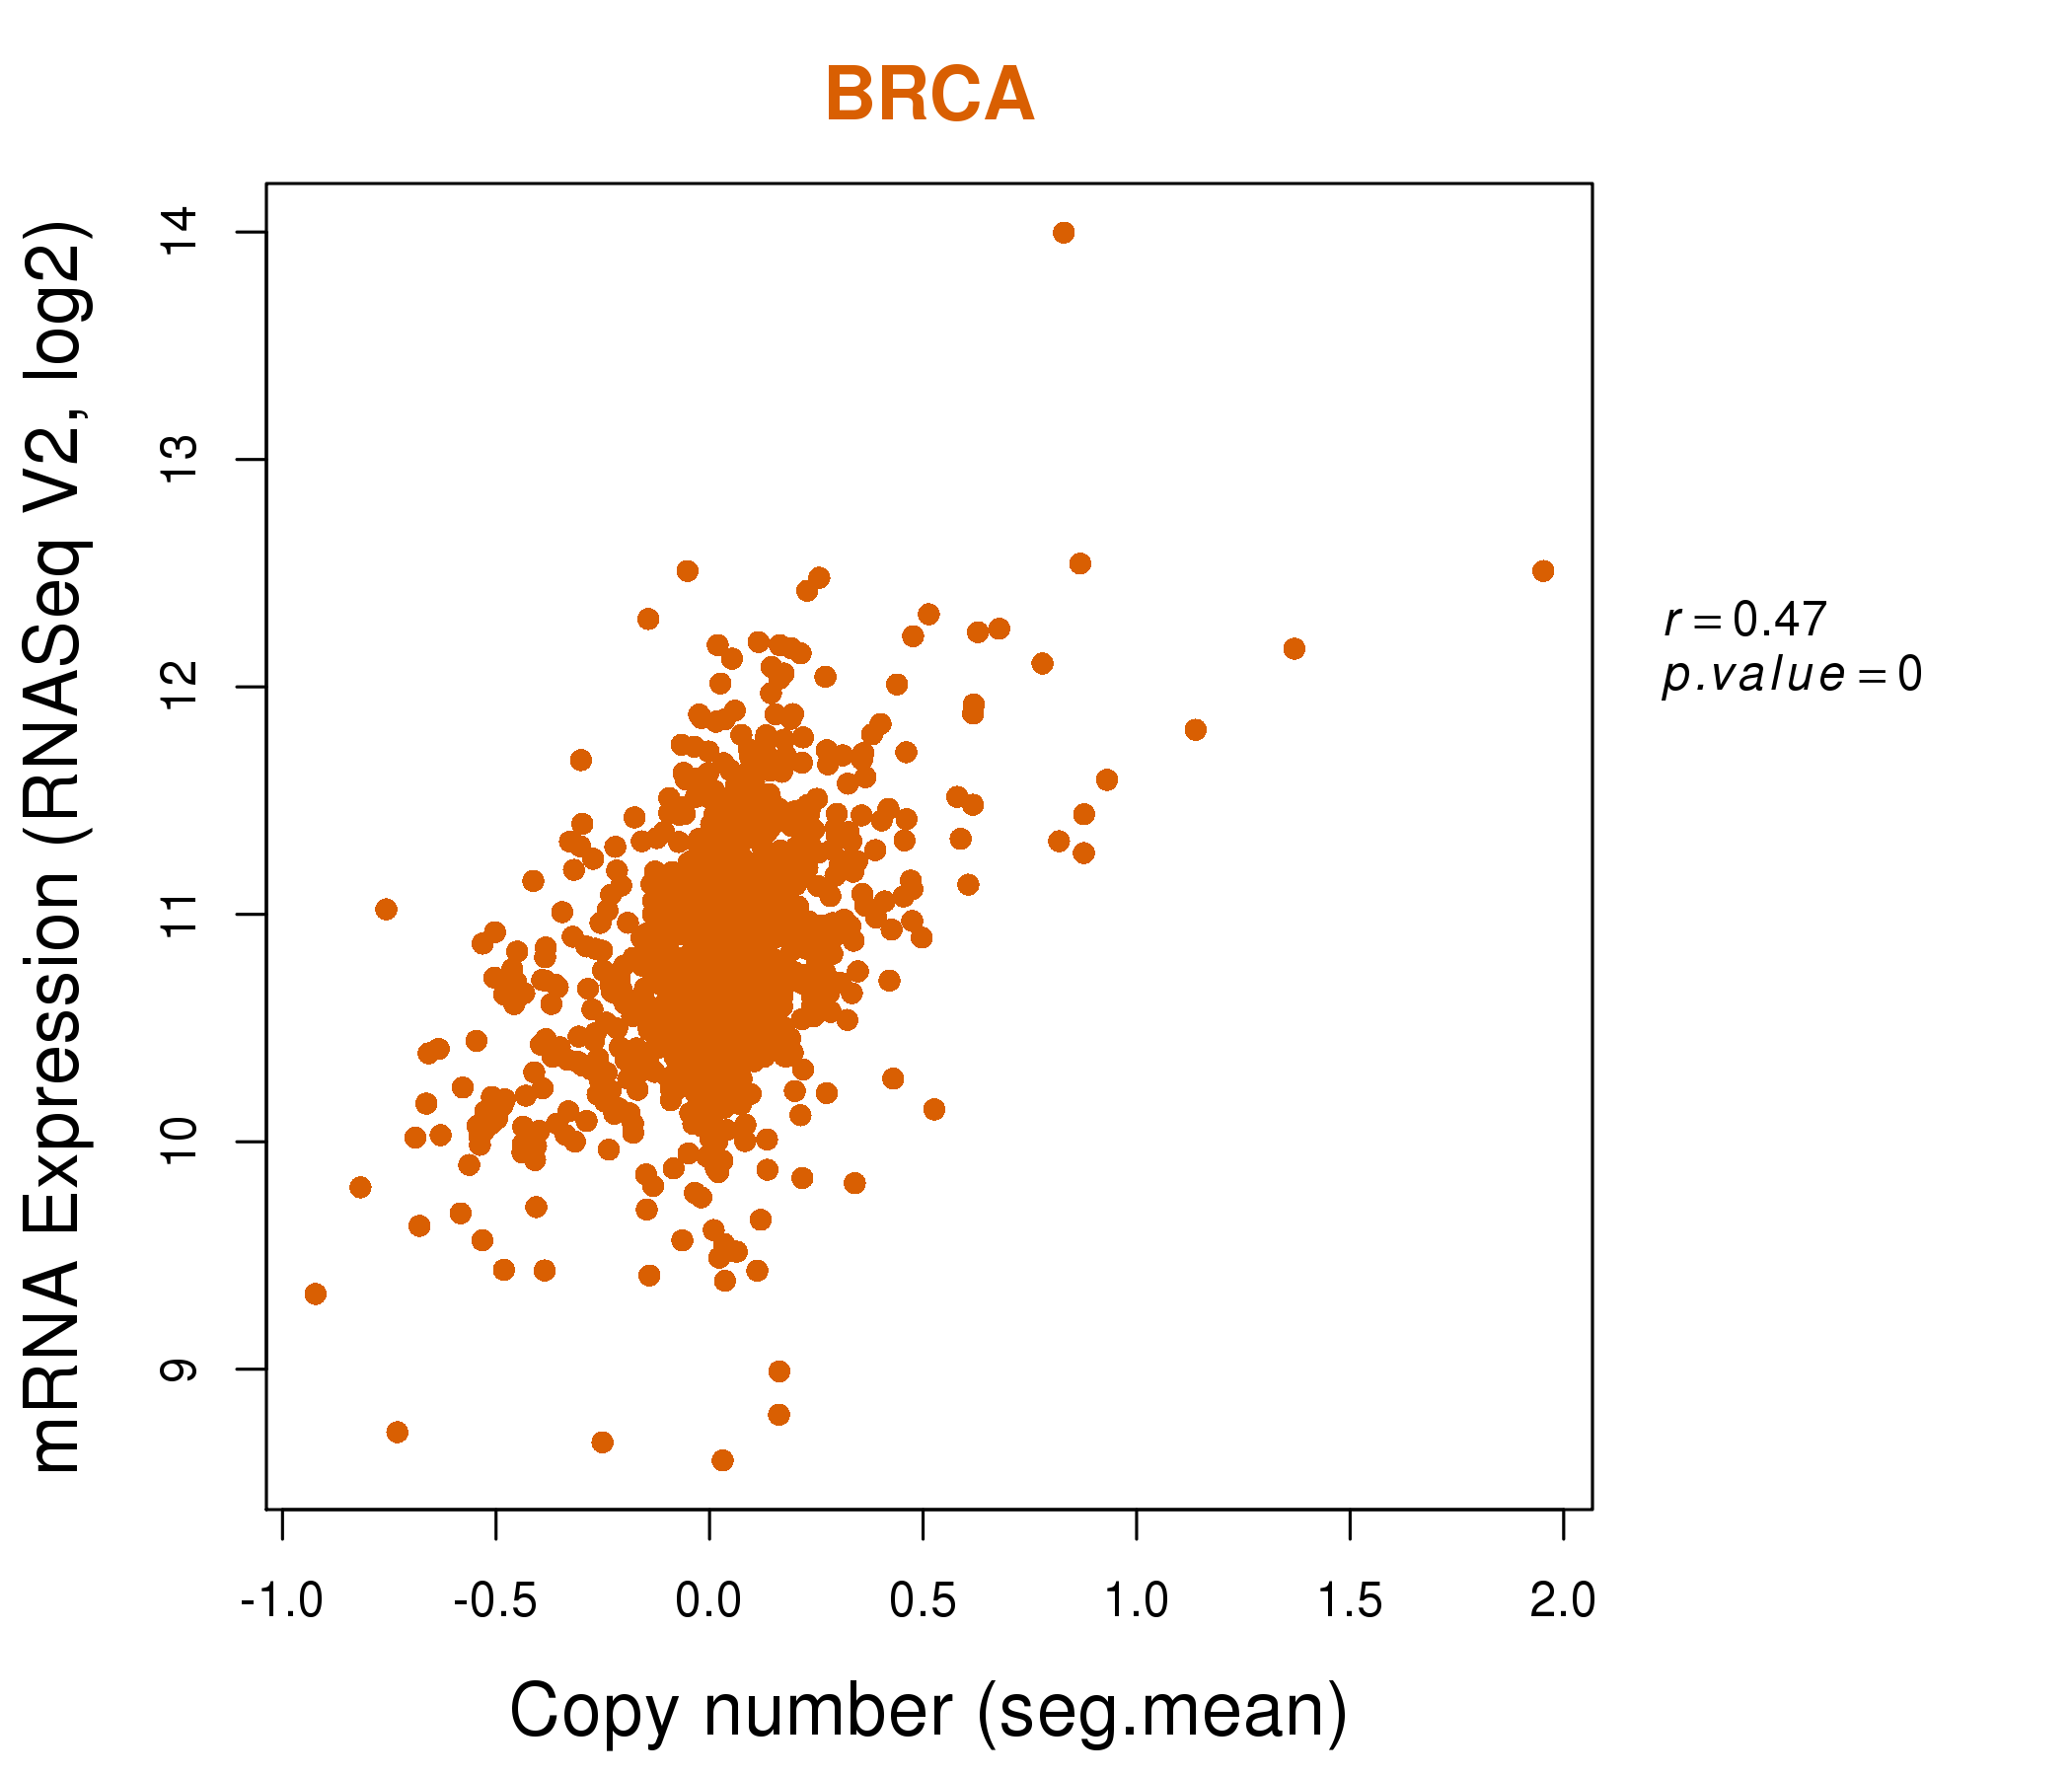
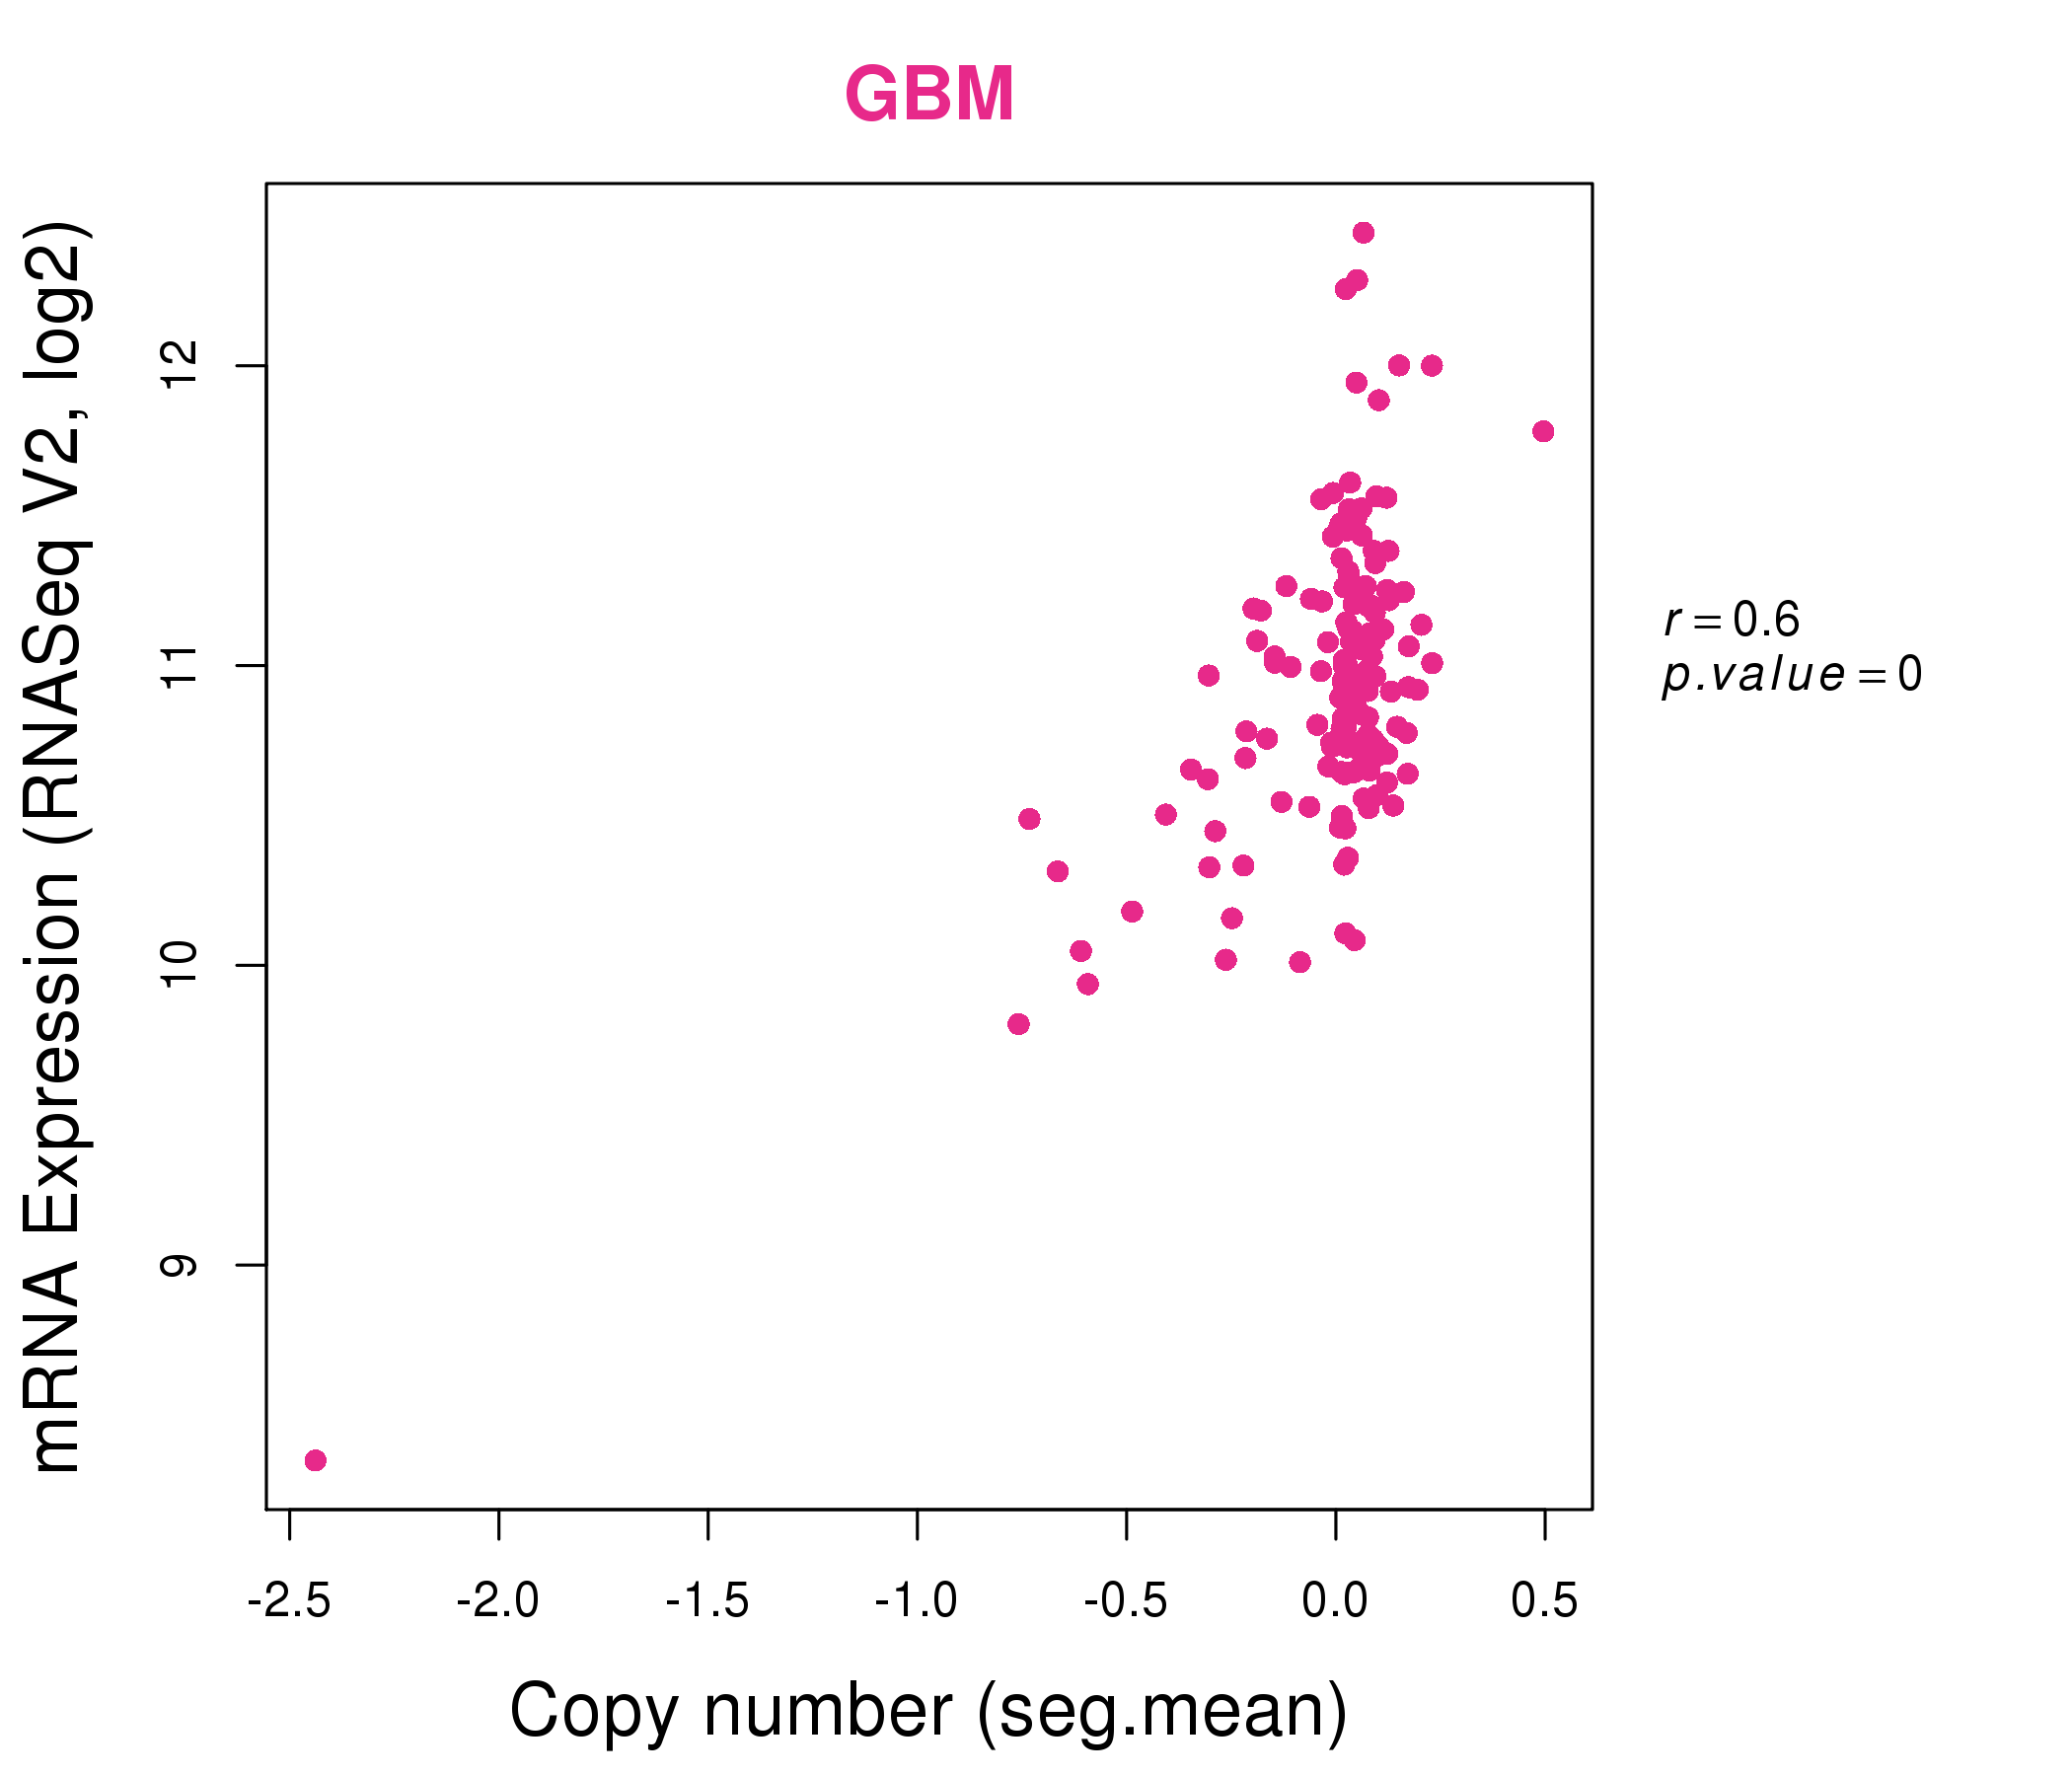
| * Normalized gene expression data of RNASeqV2 was extracted from TCGA using R package TCGA-Assembler. The URLs of all public data files on TCGA DCC data server were gathered at Jan-05-2015. Only eight cancer types have enough normal control samples for differential expression analysis. (t test, adjusted p<0.05 (using Benjamini-Hochberg FDR)) |
 |
| Top |
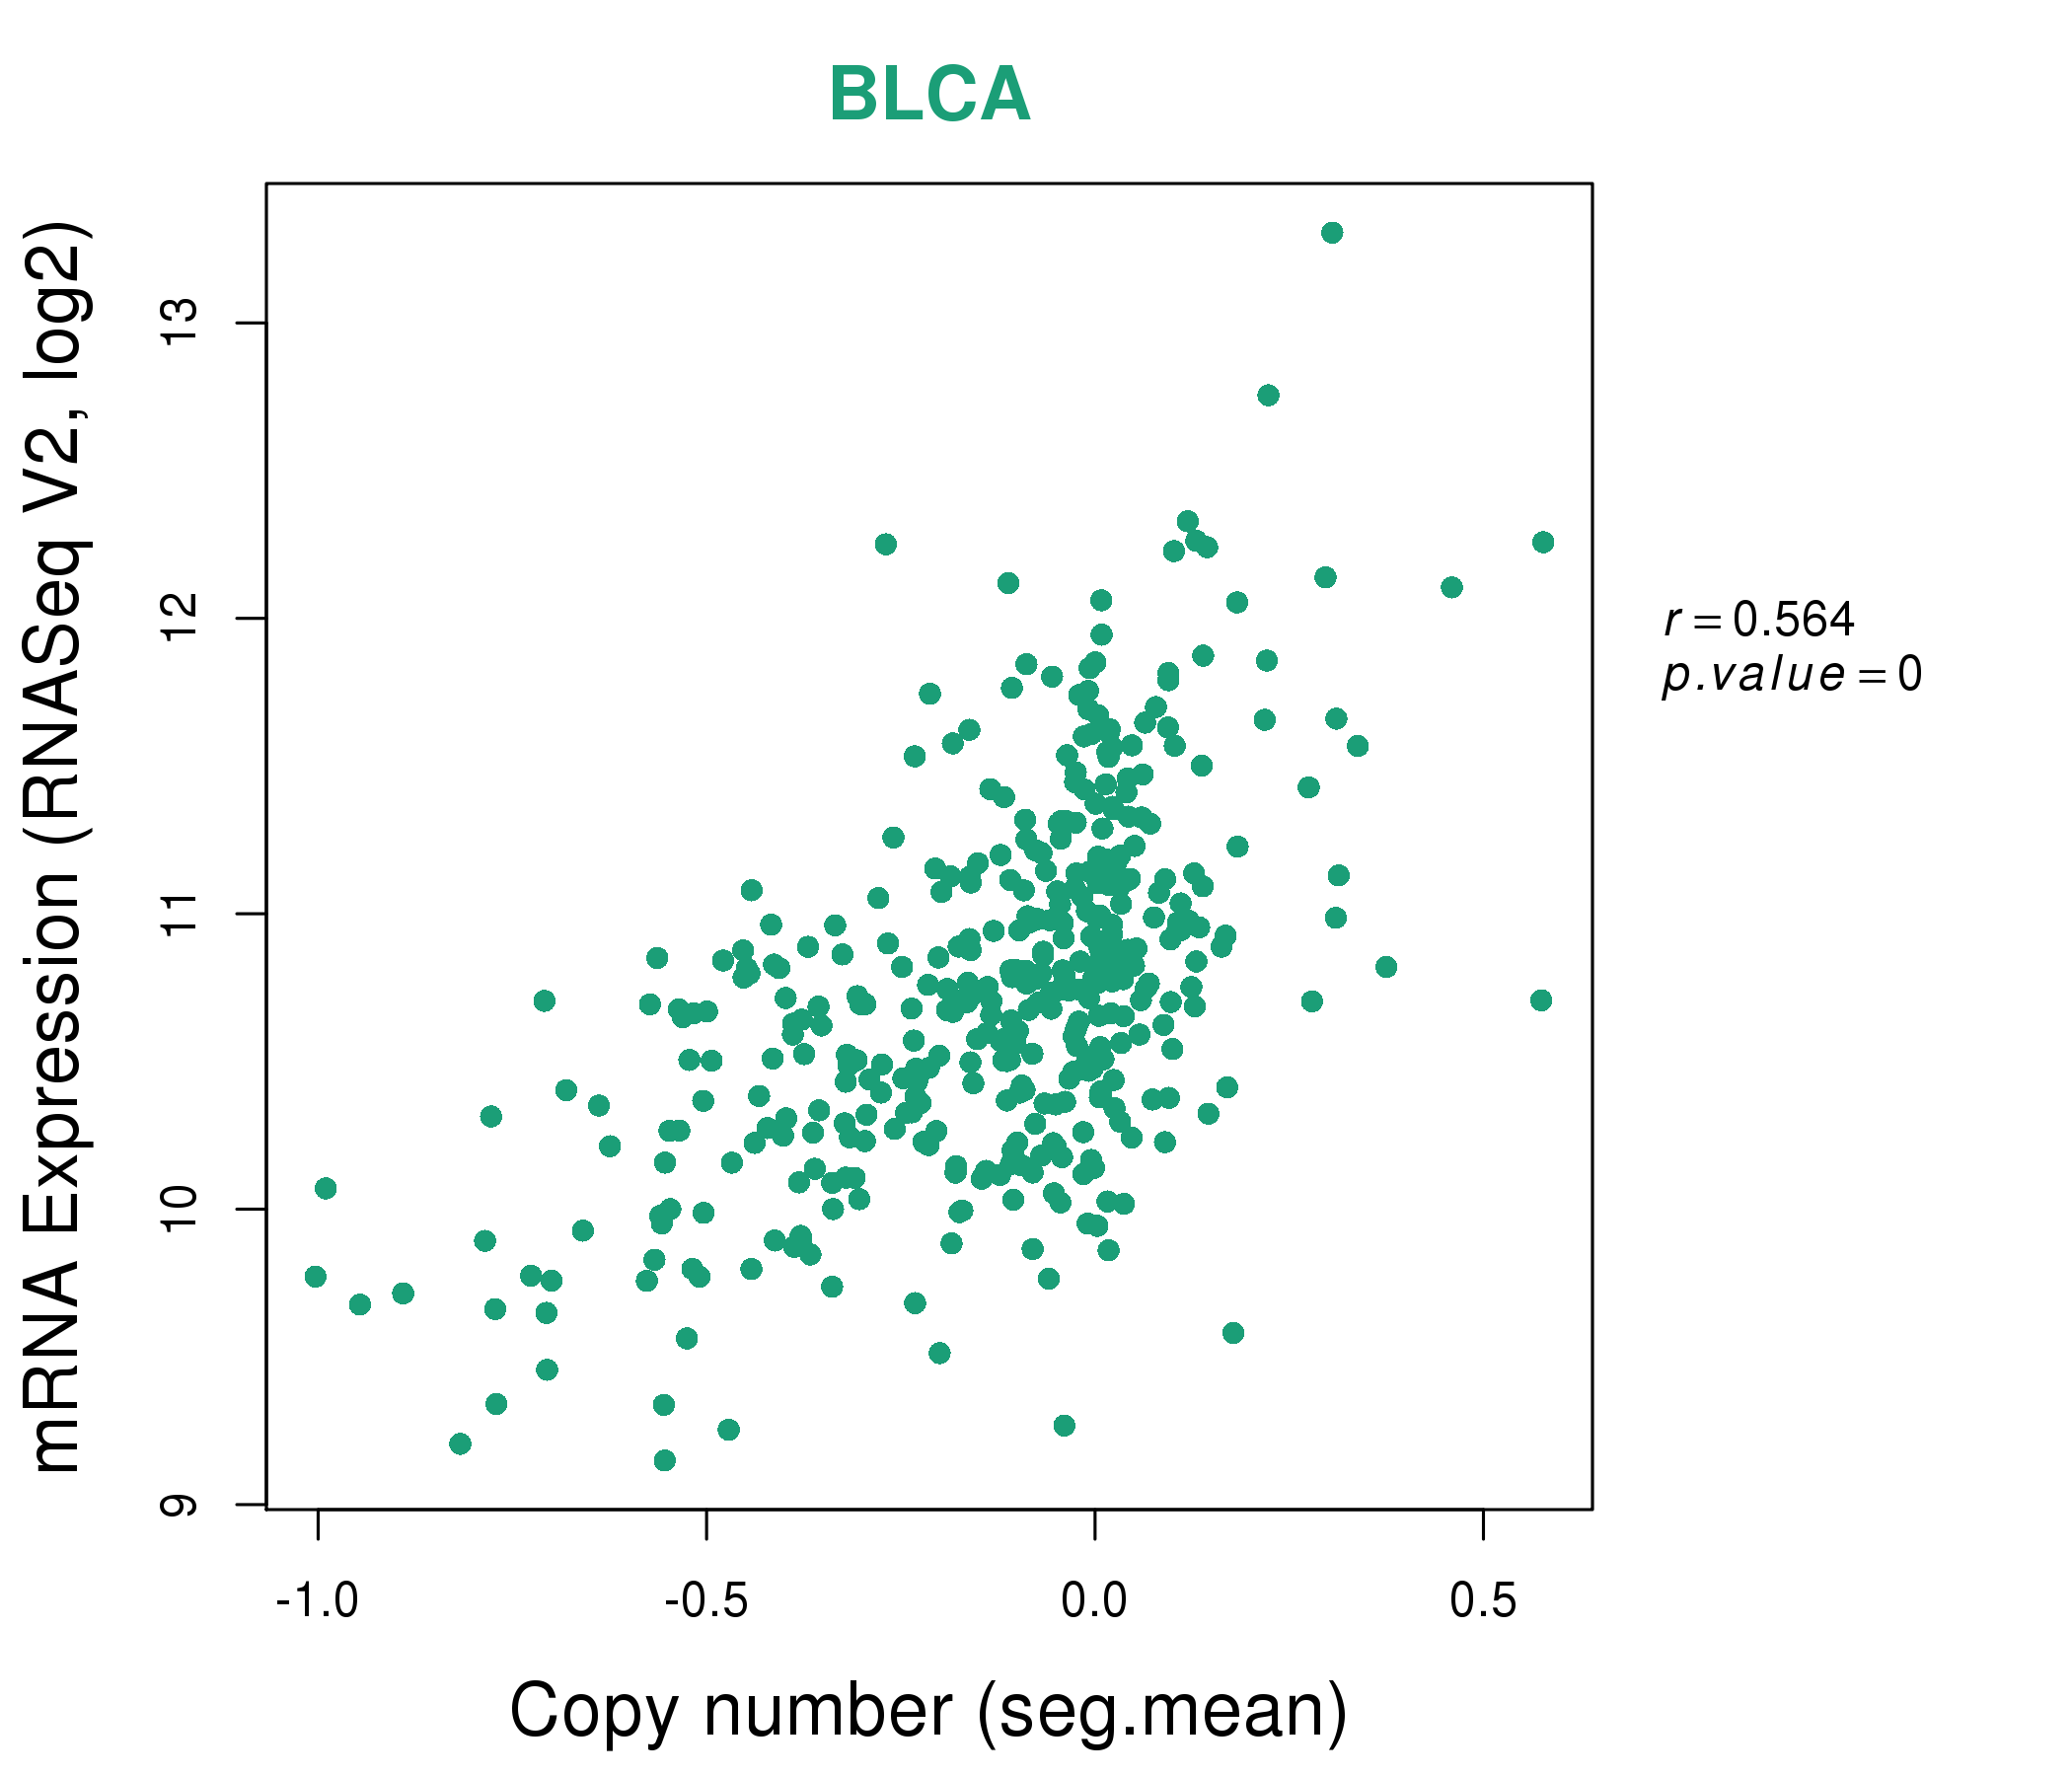
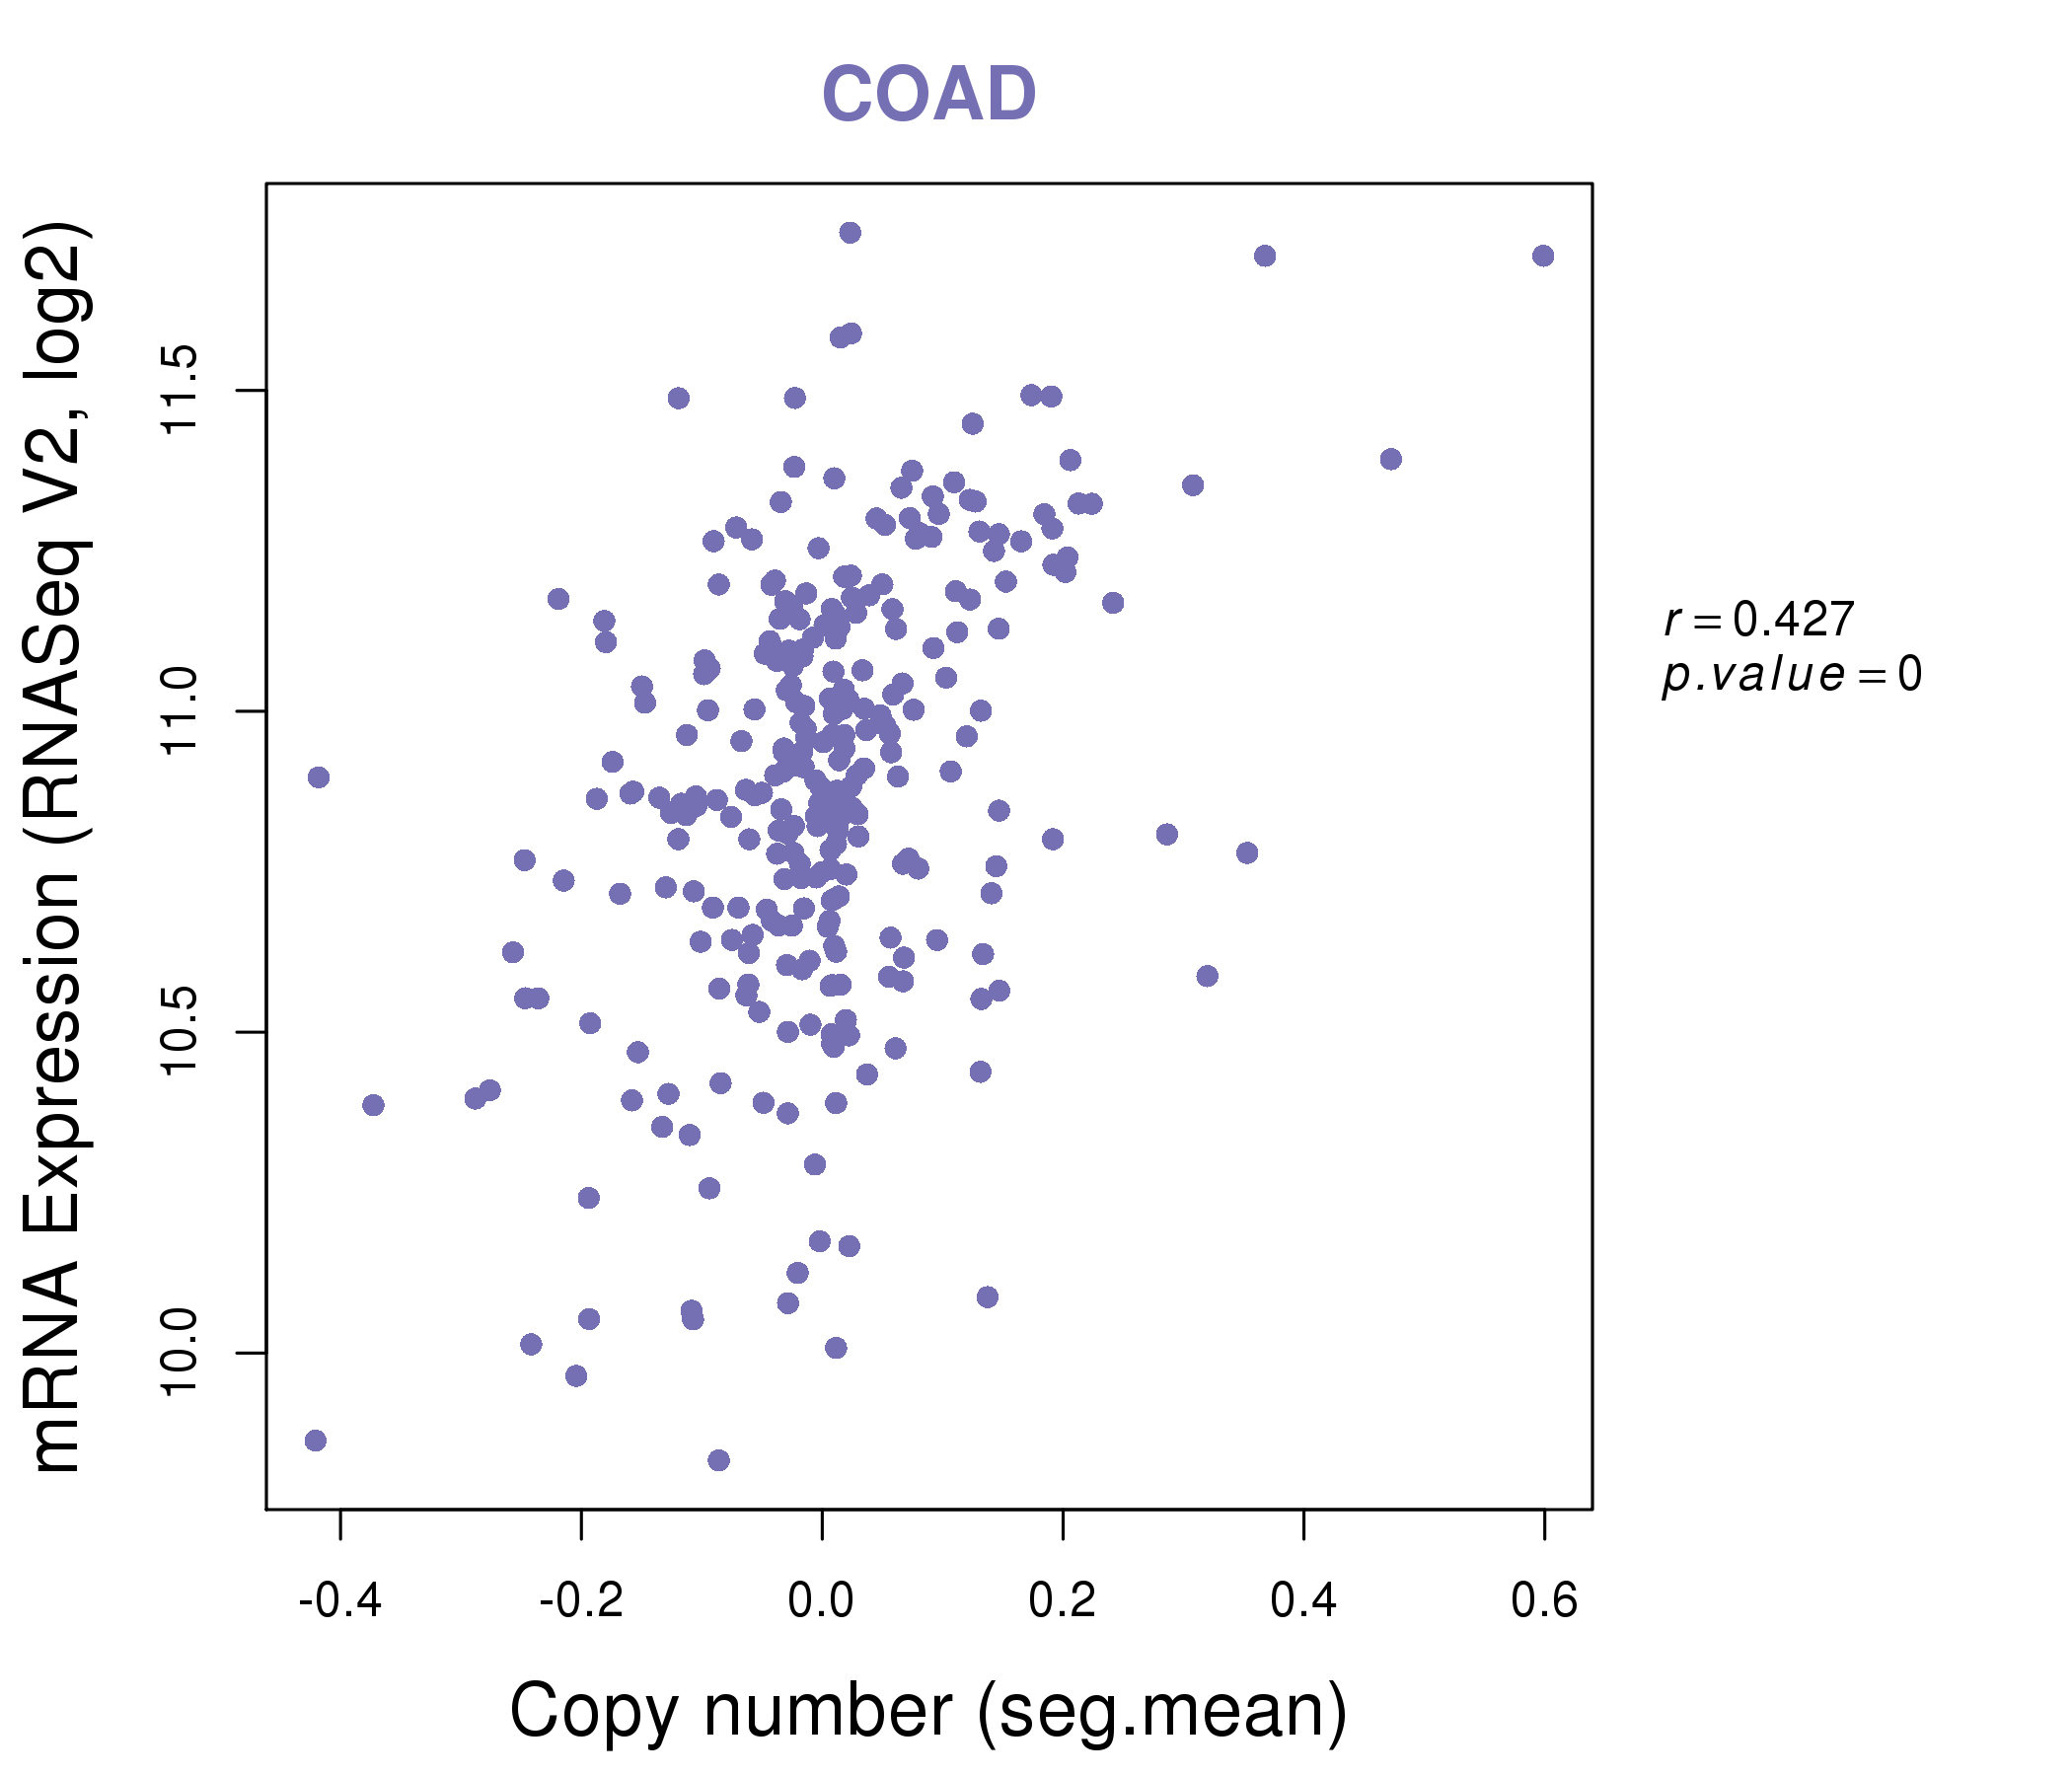
| * This plots show the correlation between CNV and gene expression. |
: Open all plots for all cancer types
 |
|
 |
|
| Top |
| Gene-Gene Network Information |
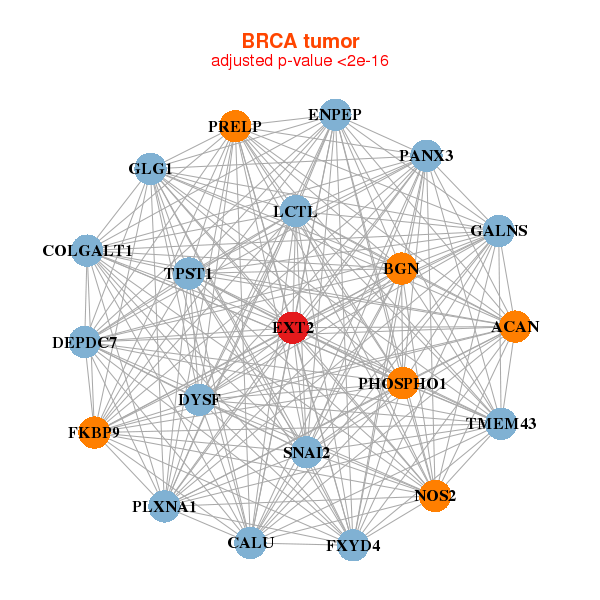
| * Co-Expression network figures were drawn using R package igraph. Only the top 20 genes with the highest correlations were shown. Red circle: input gene, orange circle: cell metabolism gene, sky circle: other gene |
: Open all plots for all cancer types
 |
|
| ACAN,BGN,CALU,DEPDC7,DYSF,ENPEP,EXT2, FKBP9,FXYD4,GALNS,GLG1,COLGALT1,LCTL,NOS2, PANX3,PHOSPHO1,PLXNA1,PRELP,SNAI2,TMEM43,TPST1 | XXYLT1,CALU,CAPN5,EXT1,EXT2,FBXL7,FKBP9, FSTL1,FUCA2,GNB1,GPX8,HEXA,HTRA1,KDELR3, LPAR1,PGAM1,CPQ,PPIC,SEPN1,TPST1,TRAM2 |
 |
|
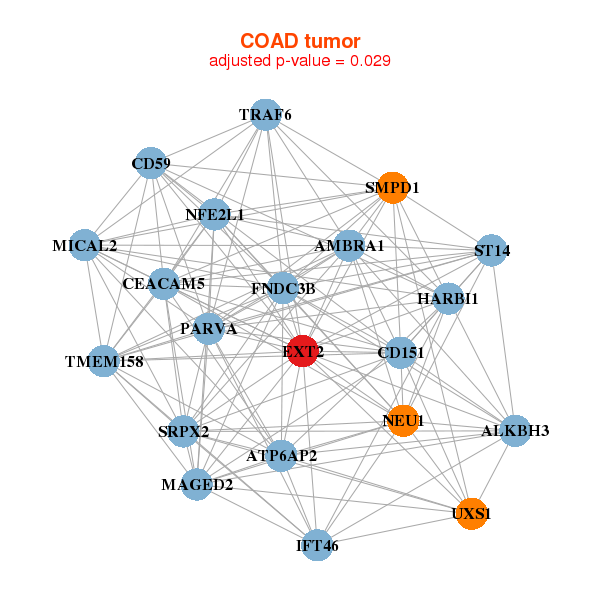
| ALKBH3,AMBRA1,ATP6AP2,CD151,CD59,CEACAM5,EXT2, FNDC3B,HARBI1,IFT46,MAGED2,MICAL2,NEU1,NFE2L1, PARVA,SMPD1,SRPX2,ST14,TMEM158,TRAF6,UXS1 | C9orf64,CANX,EPB41L2,ERO1L,EXT2,HNRNPH2,INPP4B, LDHA,LONP2,PCYT1A,PIGX,PIR,PSMD1,RAB6A, RAD23B,SDCBP,SERPINB6,SSR1,SURF4,VAPB,XRCC5 |
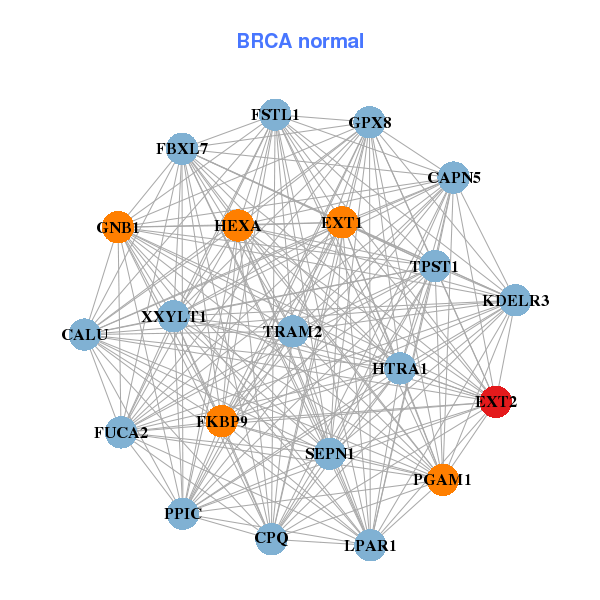
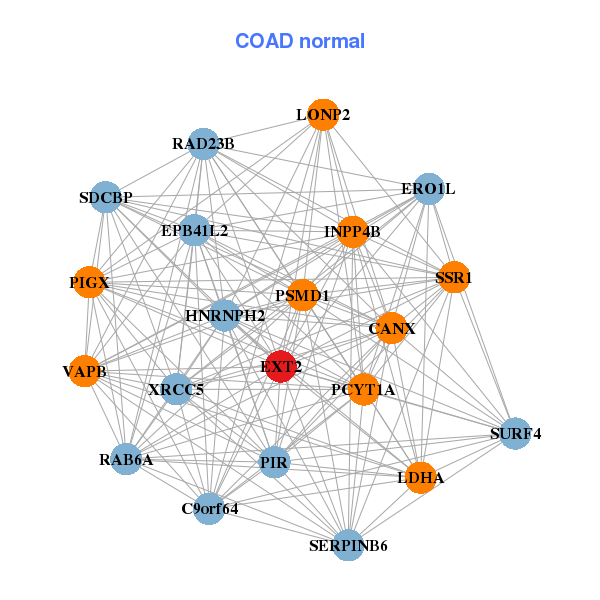
| * Co-Expression network figures were drawn using R package igraph. Only the top 20 genes with the highest correlations were shown. Red circle: input gene, orange circle: cell metabolism gene, sky circle: other gene |
: Open all plots for all cancer types
| Top |
: Open all interacting genes' information including KEGG pathway for all interacting genes from DAVID
| Top |
| Pharmacological Information for EXT2 |
| There's no related Drug. |
| Top |
| Cross referenced IDs for EXT2 |
| * We obtained these cross-references from Uniprot database. It covers 150 different DBs, 18 categories. http://www.uniprot.org/help/cross_references_section |
: Open all cross reference information
|
Copyright © 2016-Present - The Univsersity of Texas Health Science Center at Houston @ |