|
||||||||||||||||||||
| |
| Phenotypic Information (metabolism pathway, cancer, disease, phenome) |
| |
| |
| Gene-Gene Network Information: Co-Expression Network, Interacting Genes & KEGG |
| |
|


| Gene Summary for F9 |
| Top |
| Phenotypic Information for F9(metabolism pathway, cancer, disease, phenome) |
| Cancer | CGAP: F9 |
| Familial Cancer Database: F9 | |
| * This gene is included in those cancer gene databases. |
|
|
|
|
|
| . | ||||||||||||||
Oncogene 1 | Significant driver gene in | |||||||||||||||||||
| cf) number; DB name 1 Oncogene; http://nar.oxfordjournals.org/content/35/suppl_1/D721.long, 2 Tumor Suppressor gene; https://bioinfo.uth.edu/TSGene/, 3 Cancer Gene Census; http://www.nature.com/nrc/journal/v4/n3/abs/nrc1299.html, 4 CancerGenes; http://nar.oxfordjournals.org/content/35/suppl_1/D721.long, 5 Network of Cancer Gene; http://ncg.kcl.ac.uk/index.php, 1Therapeutic Vulnerabilities in Cancer; http://cbio.mskcc.org/cancergenomics/statius/ |
| REACTOME_METABOLISM_OF_PROTEINS | |
| OMIM | |
| Orphanet | |
| Disease | KEGG Disease: F9 |
| MedGen: F9 (Human Medical Genetics with Condition) | |
| ClinVar: F9 | |
| Phenotype | MGI: F9 (International Mouse Phenotyping Consortium) |
| PhenomicDB: F9 | |
| Mutations for F9 |
| * Under tables are showing count per each tissue to give us broad intuition about tissue specific mutation patterns.You can go to the detailed page for each mutation database's web site. |
| There's no structural variation information in COSMIC data for this gene. |
| * From mRNA Sanger sequences, Chitars2.0 arranged chimeric transcripts. This table shows F9 related fusion information. |
| ID | Head Gene | Tail Gene | Accession | Gene_a | qStart_a | qEnd_a | Chromosome_a | tStart_a | tEnd_a | Gene_a | qStart_a | qEnd_a | Chromosome_a | tStart_a | tEnd_a |
| Top |
| There's no copy number variation information in COSMIC data for this gene. |
| Top |
|
 |
| Top |
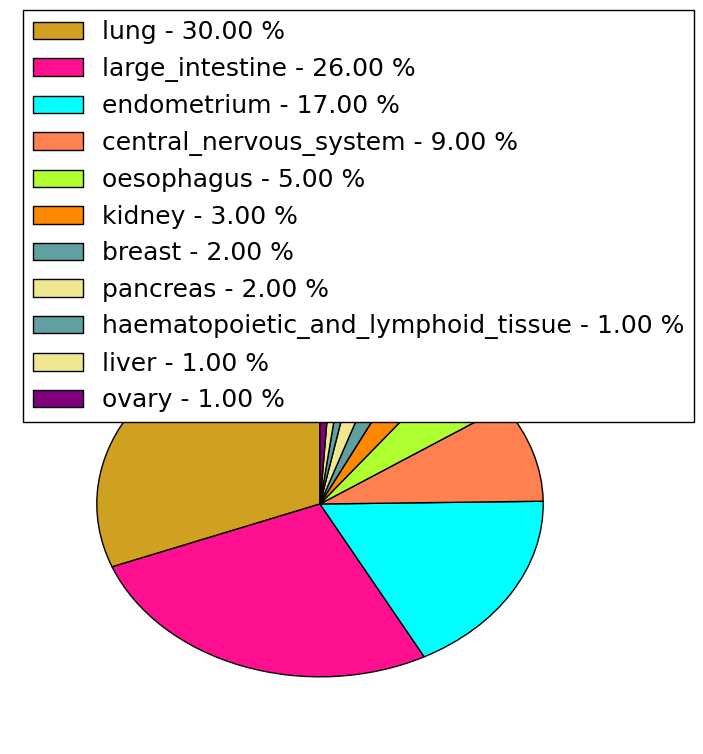
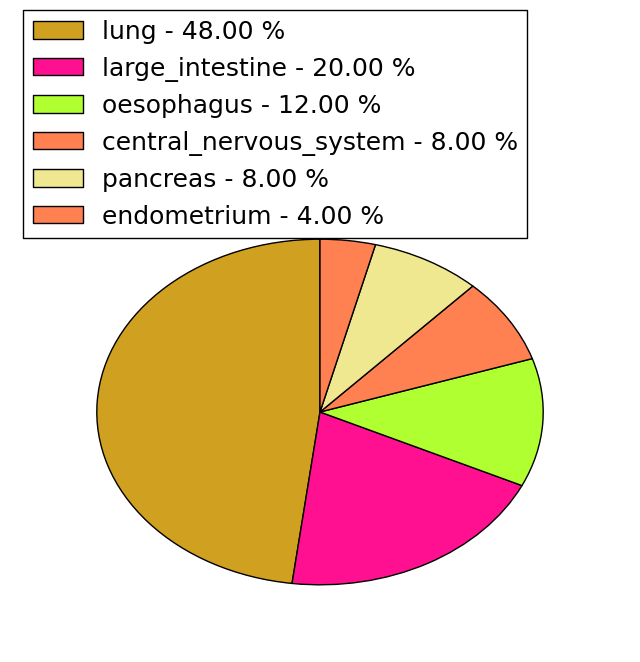
| Stat. for Non-Synonymous SNVs (# total SNVs=95) | (# total SNVs=25) |
 |  |
(# total SNVs=0) | (# total SNVs=0) |
| Top |
| * When you move the cursor on each content, you can see more deailed mutation information on the Tooltip. Those are primary_site,primary_histology,mutation(aa),pubmedID. |
| GRCh37 position | Mutation(aa) | Unique sampleID count |
| chr23:138643994-138643994 | p.R384* | 5 |
| chr23:138633258-138633258 | p.T186T | 4 |
| chr23:138644029-138644029 | p.F395L | 3 |
| chr23:138623283-138623283 | p.K109R | 3 |
| chr23:138630596-138630596 | p.S156T | 3 |
| chr23:138643011-138643011 | p.A279T | 2 |
| chr23:138642899-138642899 | p.? | 2 |
| chr23:138643813-138643813 | p.E323E | 2 |
| chr23:138633280-138633280 | p.T194A | 2 |
| chr23:138633289-138633289 | p.P197S | 2 |
| Top |
|
 |
| Point Mutation/ Tissue ID | 1 | 2 | 3 | 4 | 5 | 6 | 7 | 8 | 9 | 10 | 11 | 12 | 13 | 14 | 15 | 16 | 17 | 18 | 19 | 20 |
| # sample | 1 | 20 | 3 | 5 | 2 | 12 | 7 | 1 | 8 | 5 | 9 | |||||||||
| # mutation | 1 | 16 | 3 | 5 | 2 | 15 | 7 | 1 | 9 | 5 | 8 | |||||||||
| nonsynonymous SNV | 1 | 12 | 2 | 5 | 2 | 12 | 5 | 1 | 7 | 4 | 7 | |||||||||
| synonymous SNV | 4 | 1 | 3 | 2 | 2 | 1 | 1 |
| cf) Tissue ID; Tissue type (1; BLCA[Bladder Urothelial Carcinoma], 2; BRCA[Breast invasive carcinoma], 3; CESC[Cervical squamous cell carcinoma and endocervical adenocarcinoma], 4; COAD[Colon adenocarcinoma], 5; GBM[Glioblastoma multiforme], 6; Glioma Low Grade, 7; HNSC[Head and Neck squamous cell carcinoma], 8; KICH[Kidney Chromophobe], 9; KIRC[Kidney renal clear cell carcinoma], 10; KIRP[Kidney renal papillary cell carcinoma], 11; LAML[Acute Myeloid Leukemia], 12; LUAD[Lung adenocarcinoma], 13; LUSC[Lung squamous cell carcinoma], 14; OV[Ovarian serous cystadenocarcinoma ], 15; PAAD[Pancreatic adenocarcinoma], 16; PRAD[Prostate adenocarcinoma], 17; SKCM[Skin Cutaneous Melanoma], 18:STAD[Stomach adenocarcinoma], 19:THCA[Thyroid carcinoma], 20:UCEC[Uterine Corpus Endometrial Carcinoma]) |
| Top |
| * We represented just top 10 SNVs. When you move the cursor on each content, you can see more deailed mutation information on the Tooltip. Those are primary_site, primary_histology, mutation(aa), pubmedID. |
| Genomic Position | Mutation(aa) | Unique sampleID count |
| chrX:138623283 | p.K109R | 3 |
| chrX:138643737 | p.S156P | 2 |
| chrX:138643813 | p.G280S | 2 |
| chrX:138644029 | p.F395L | 2 |
| chrX:138633258 | p.R298Q | 2 |
| chrX:138643014 | p.E323E | 2 |
| chrX:138630596 | p.T186T | 2 |
| chrX:138643729 | p.I256I | 1 |
| chrX:138623299 | p.L372I | 1 |
| chrX:138644001 | p.F55L | 1 |
| * Copy number data were extracted from TCGA using R package TCGA-Assembler. The URLs of all public data files on TCGA DCC data server were gathered on Jan-05-2015. Function ProcessCNAData in TCGA-Assembler package was used to obtain gene-level copy number value which is calculated as the average copy number of the genomic region of a gene. |
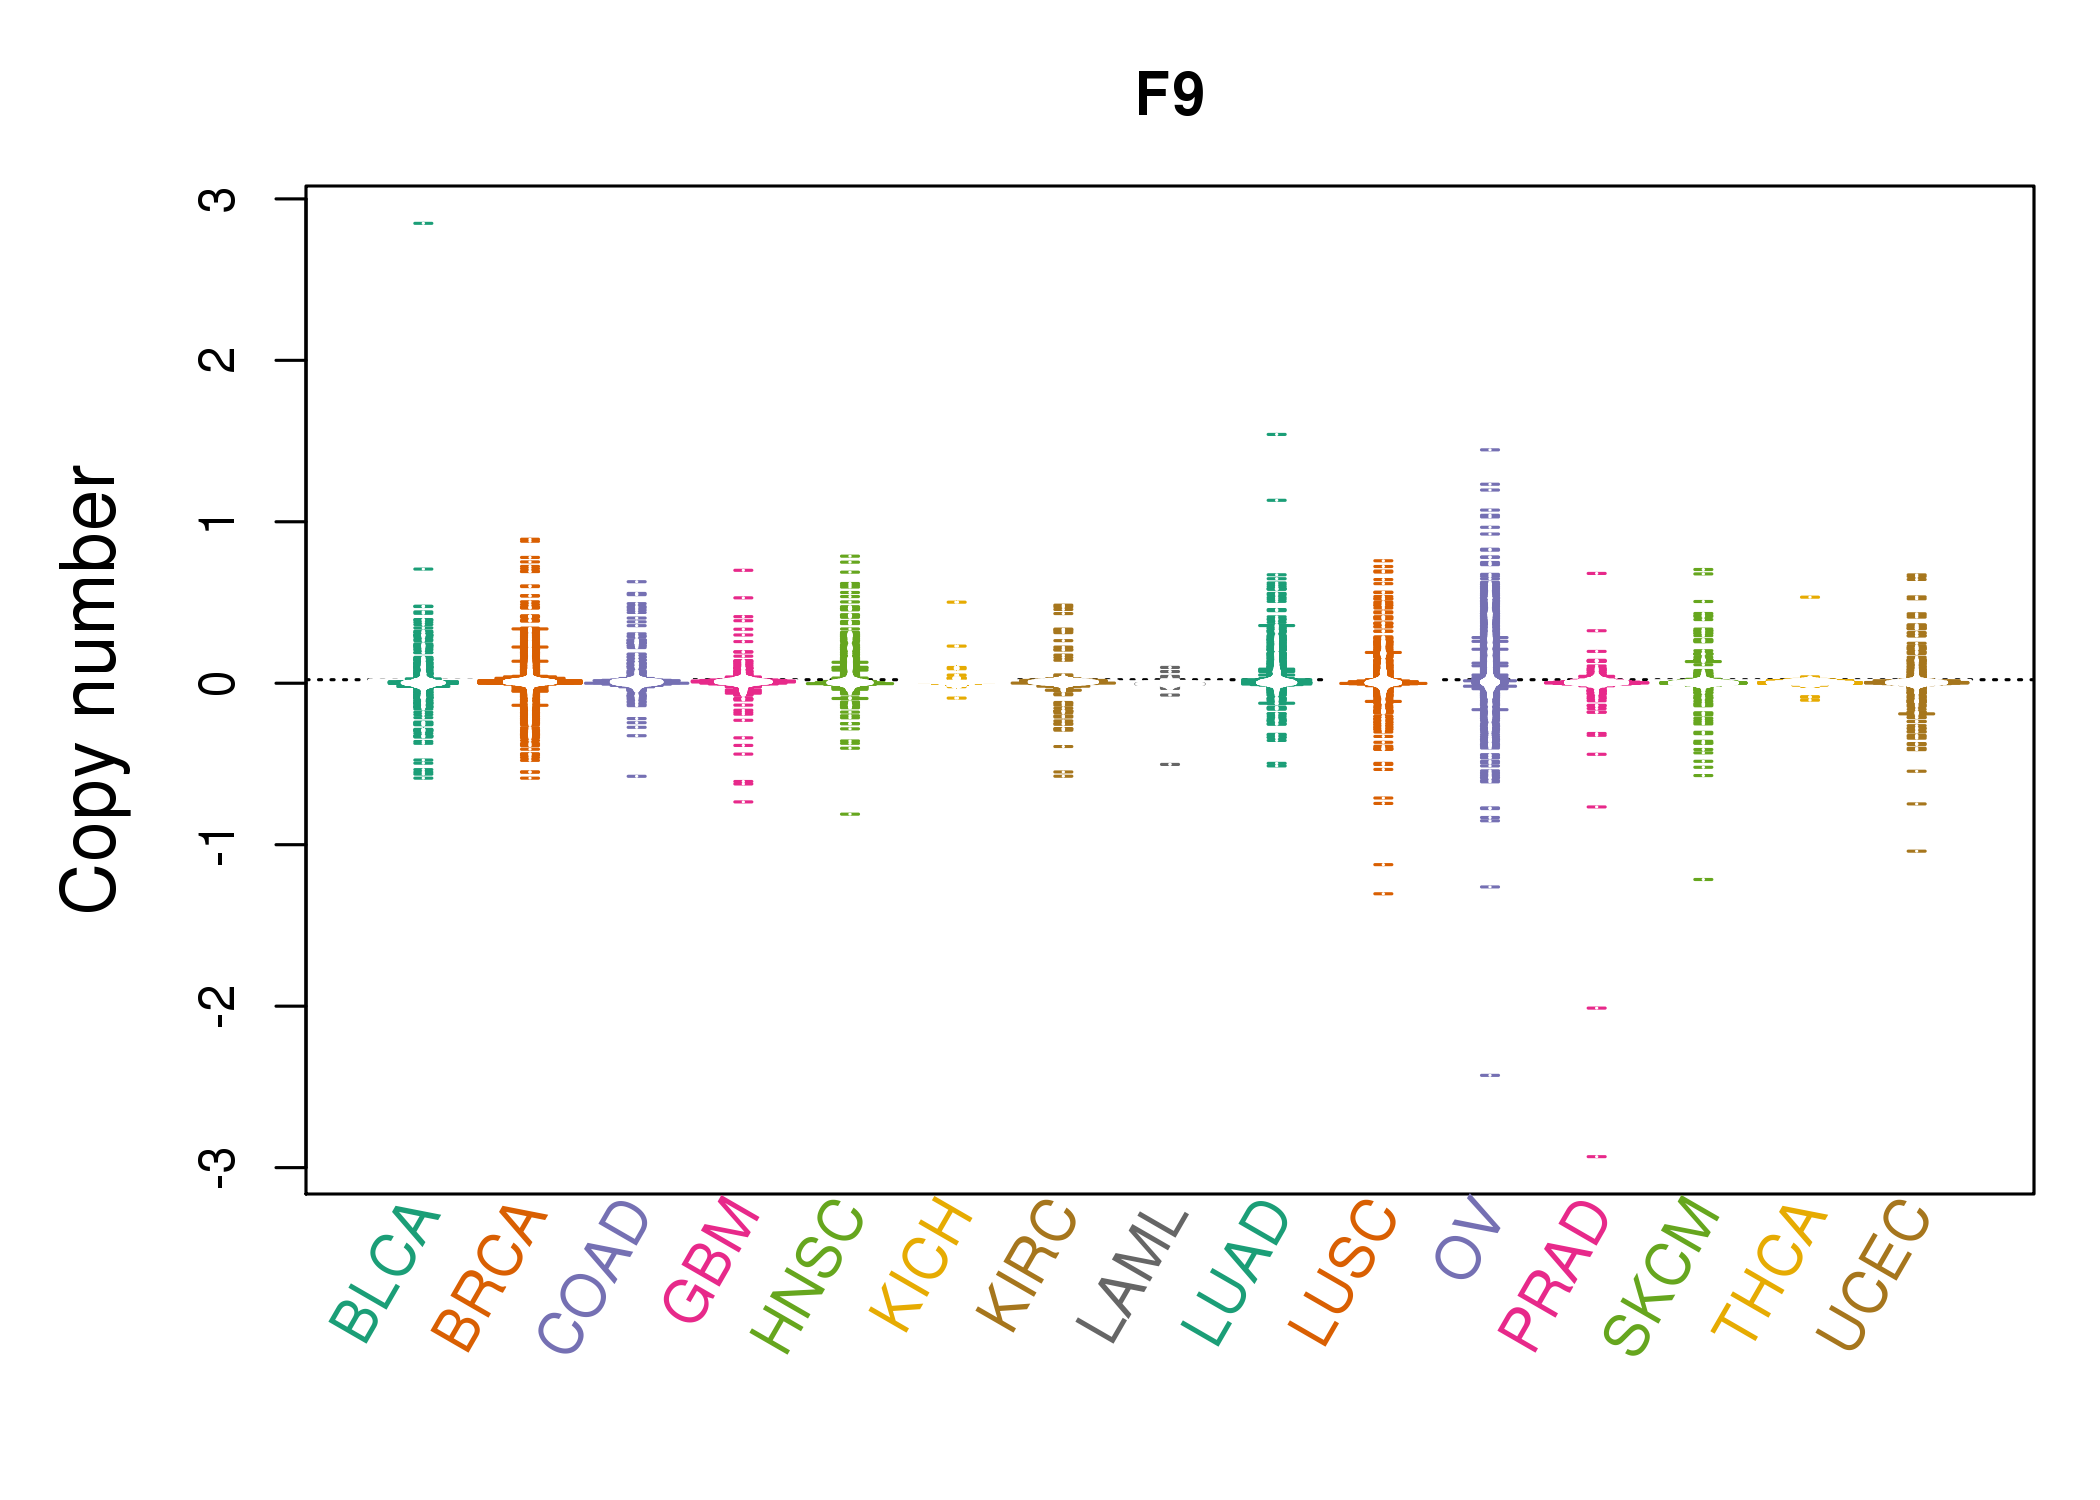 |
| cf) Tissue ID[Tissue type]: BLCA[Bladder Urothelial Carcinoma], BRCA[Breast invasive carcinoma], CESC[Cervical squamous cell carcinoma and endocervical adenocarcinoma], COAD[Colon adenocarcinoma], GBM[Glioblastoma multiforme], Glioma Low Grade, HNSC[Head and Neck squamous cell carcinoma], KICH[Kidney Chromophobe], KIRC[Kidney renal clear cell carcinoma], KIRP[Kidney renal papillary cell carcinoma], LAML[Acute Myeloid Leukemia], LUAD[Lung adenocarcinoma], LUSC[Lung squamous cell carcinoma], OV[Ovarian serous cystadenocarcinoma ], PAAD[Pancreatic adenocarcinoma], PRAD[Prostate adenocarcinoma], SKCM[Skin Cutaneous Melanoma], STAD[Stomach adenocarcinoma], THCA[Thyroid carcinoma], UCEC[Uterine Corpus Endometrial Carcinoma] |
| Top |
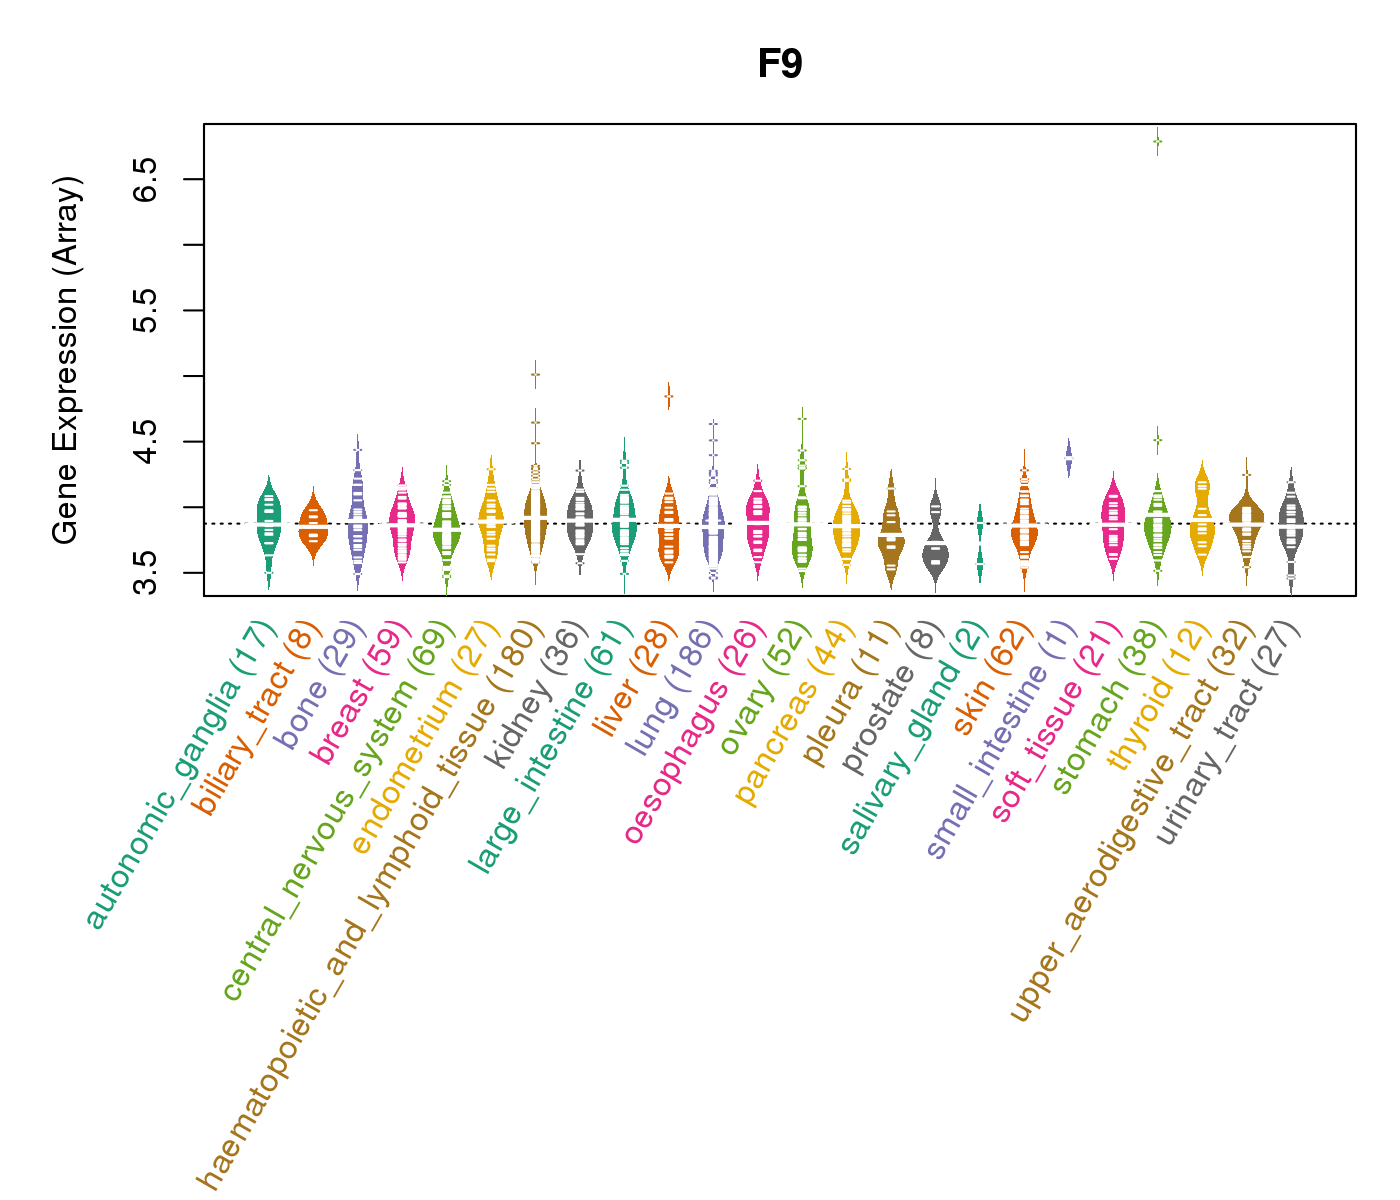
| Gene Expression for F9 |
| * CCLE gene expression data were extracted from CCLE_Expression_Entrez_2012-10-18.res: Gene-centric RMA-normalized mRNA expression data. |
 |
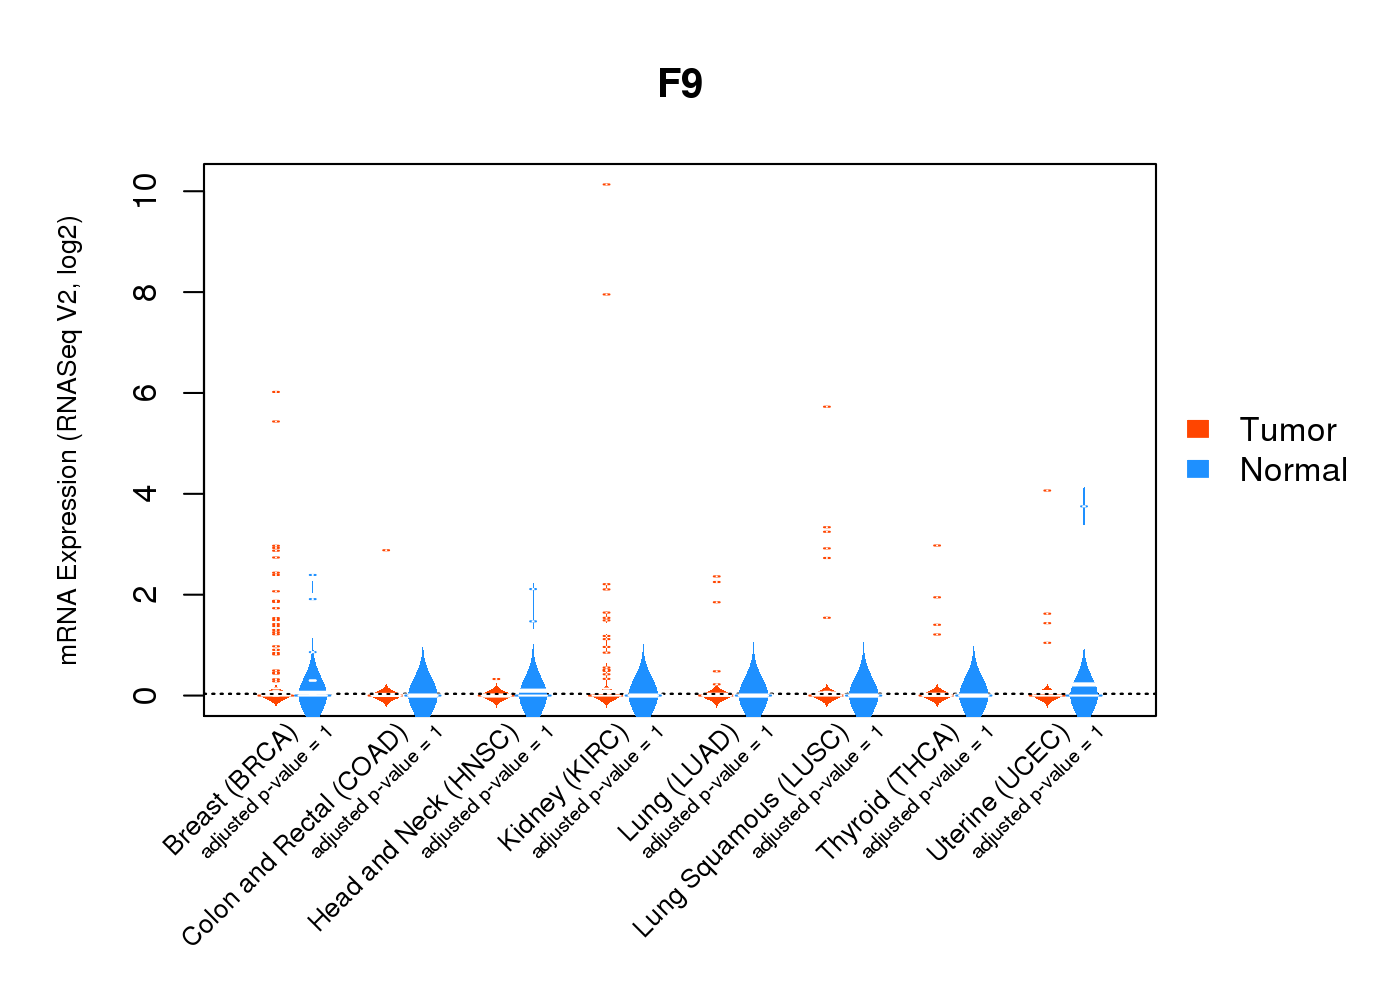
| * Normalized gene expression data of RNASeqV2 was extracted from TCGA using R package TCGA-Assembler. The URLs of all public data files on TCGA DCC data server were gathered at Jan-05-2015. Only eight cancer types have enough normal control samples for differential expression analysis. (t test, adjusted p<0.05 (using Benjamini-Hochberg FDR)) |
 |
| Top |
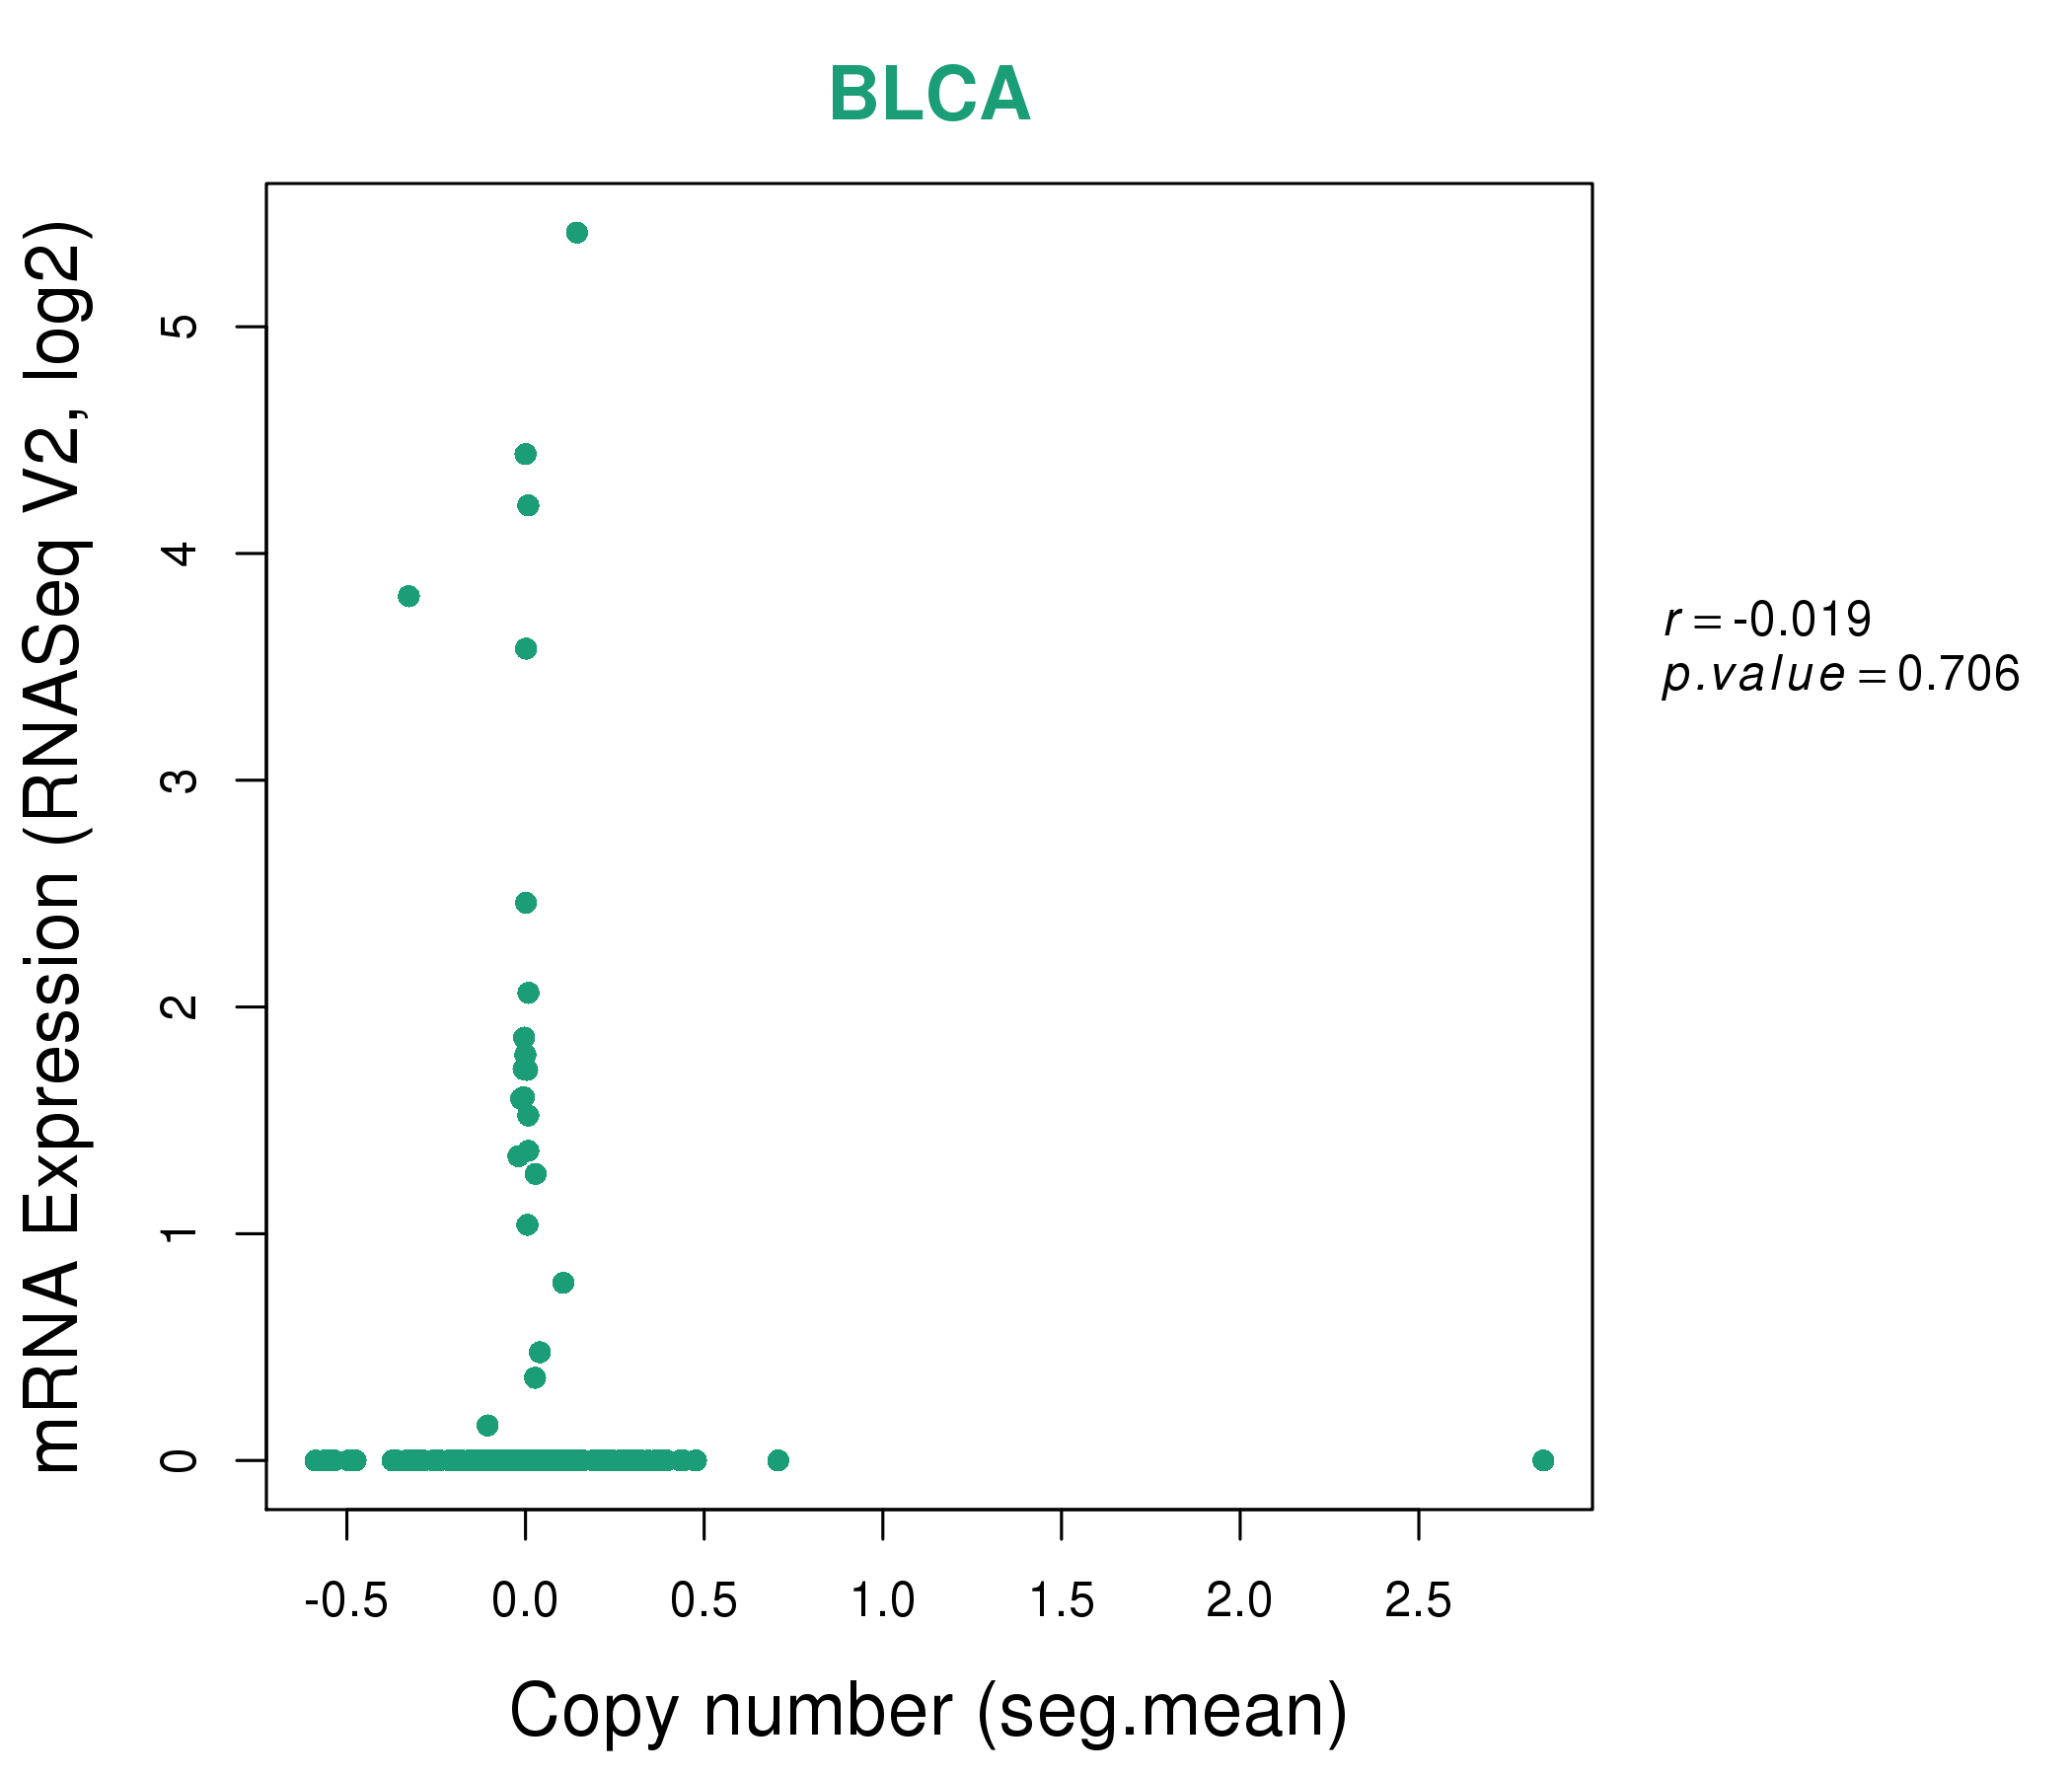
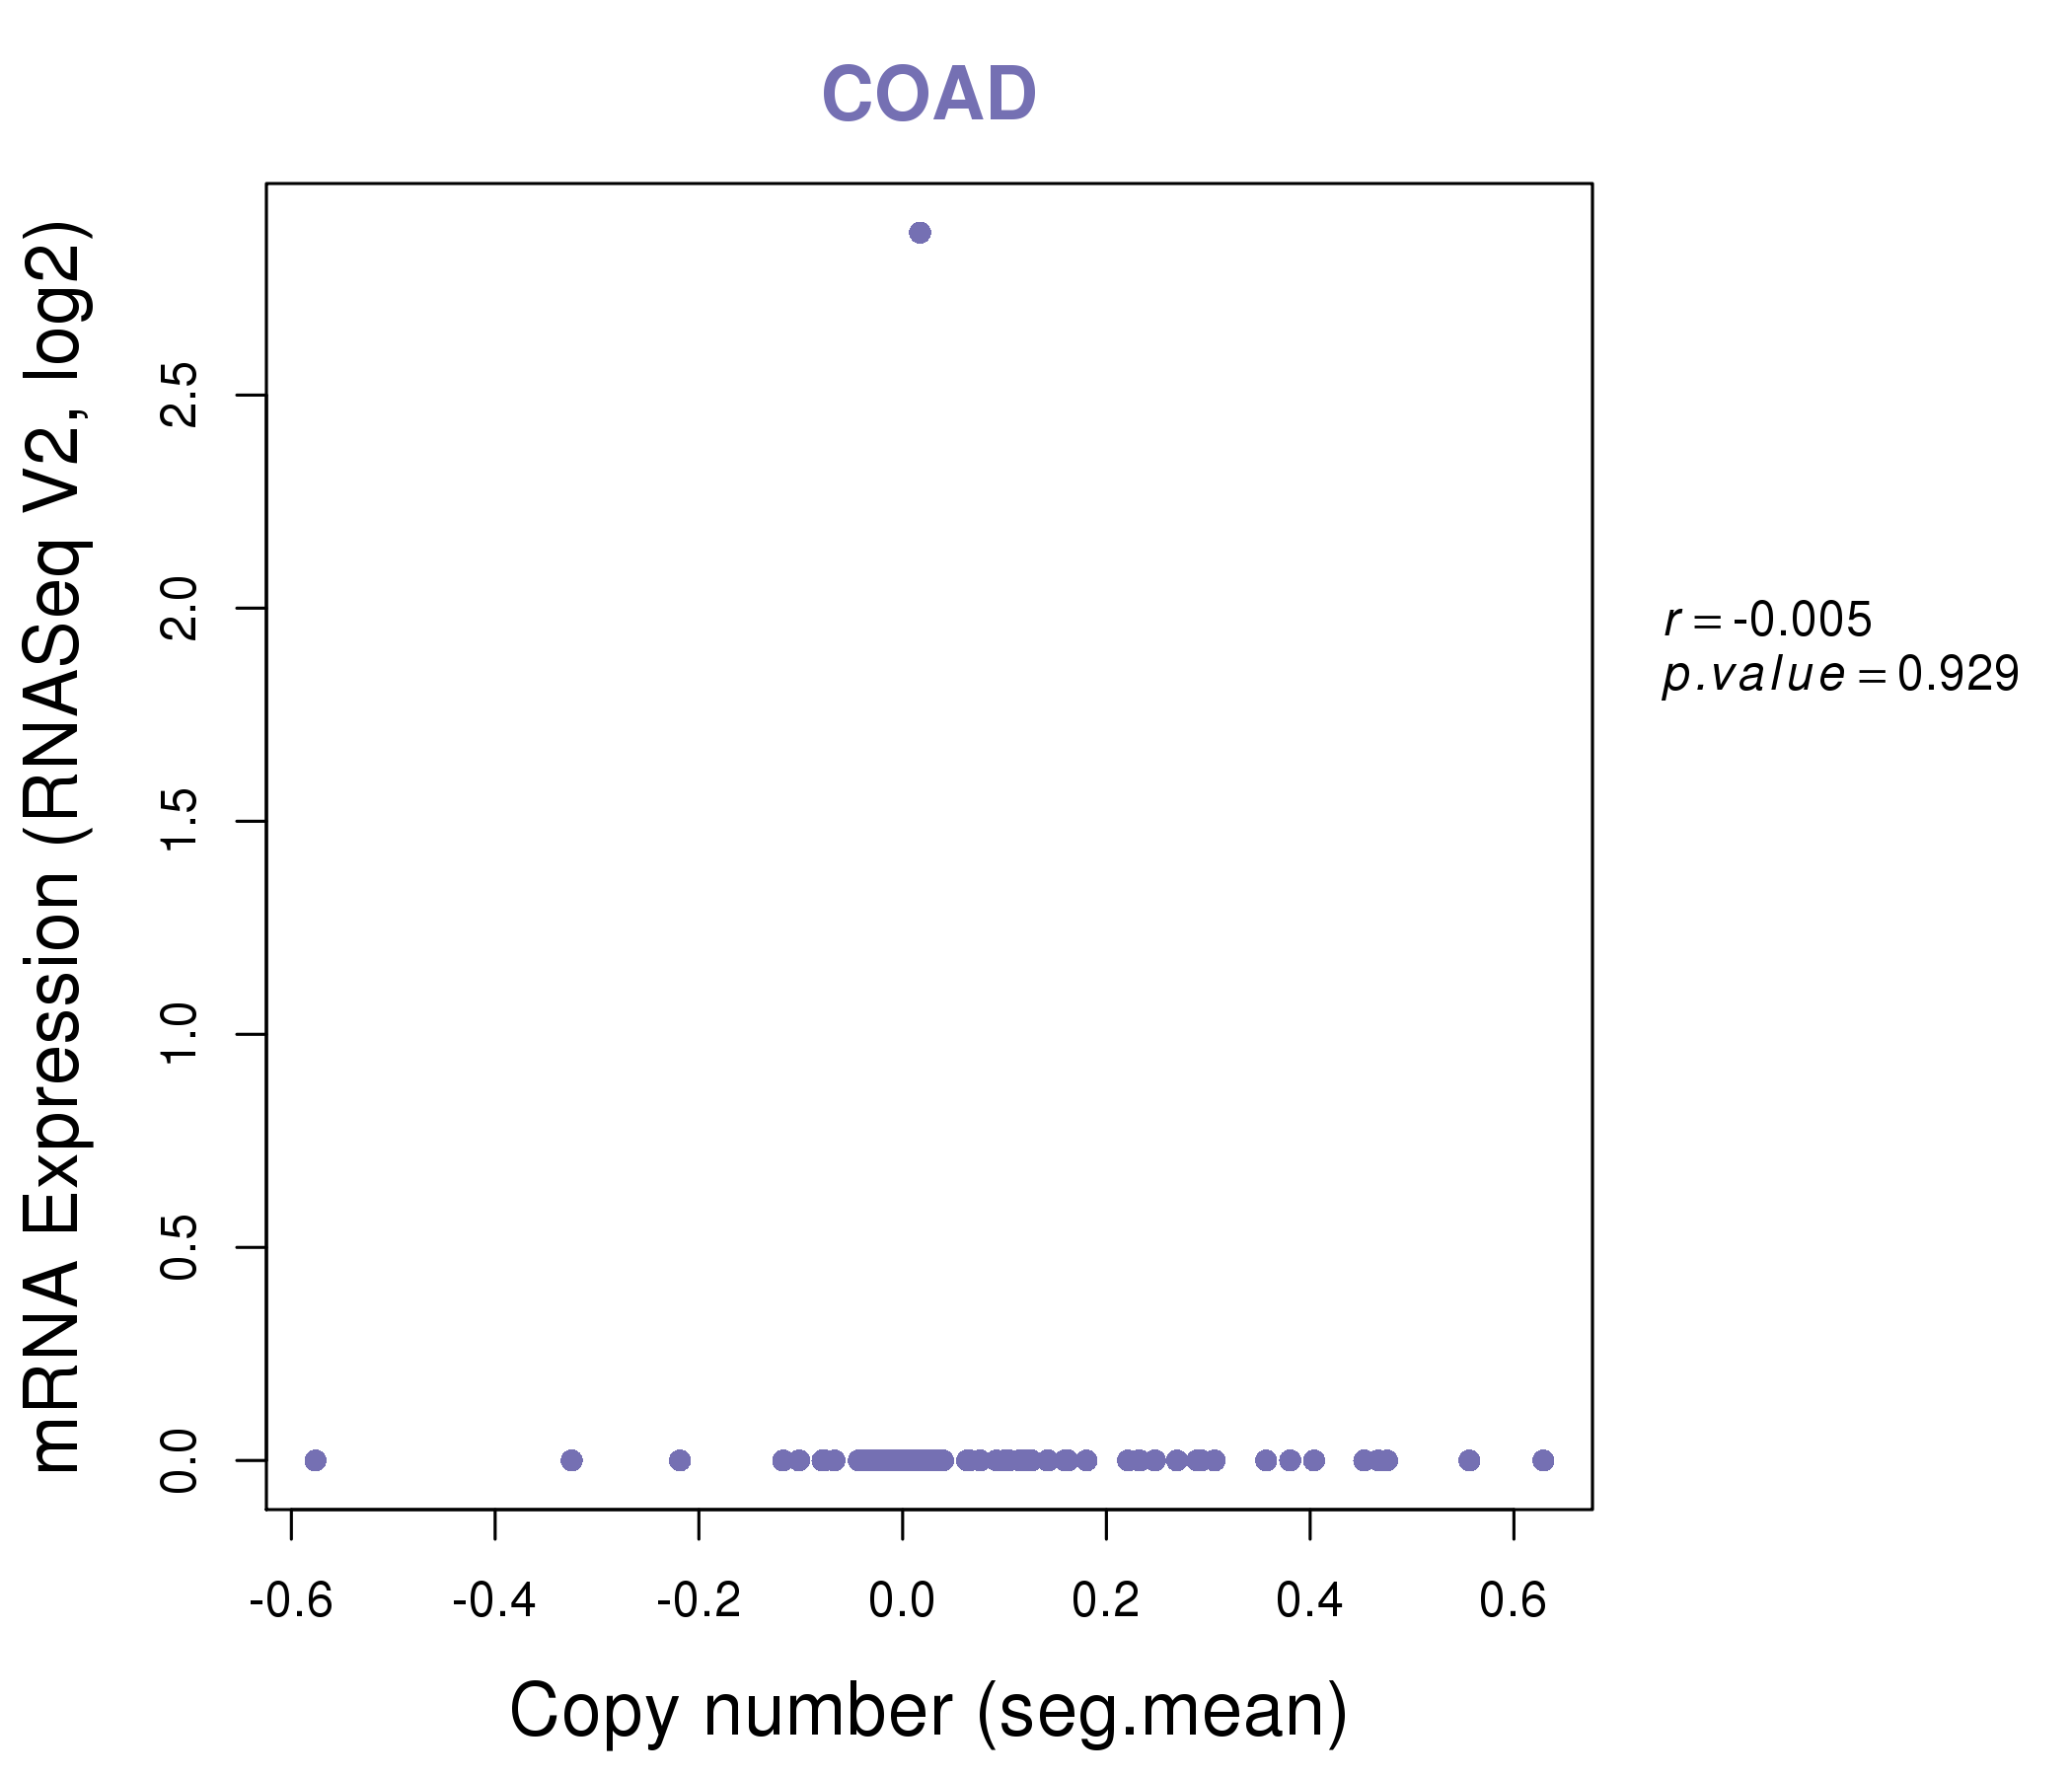
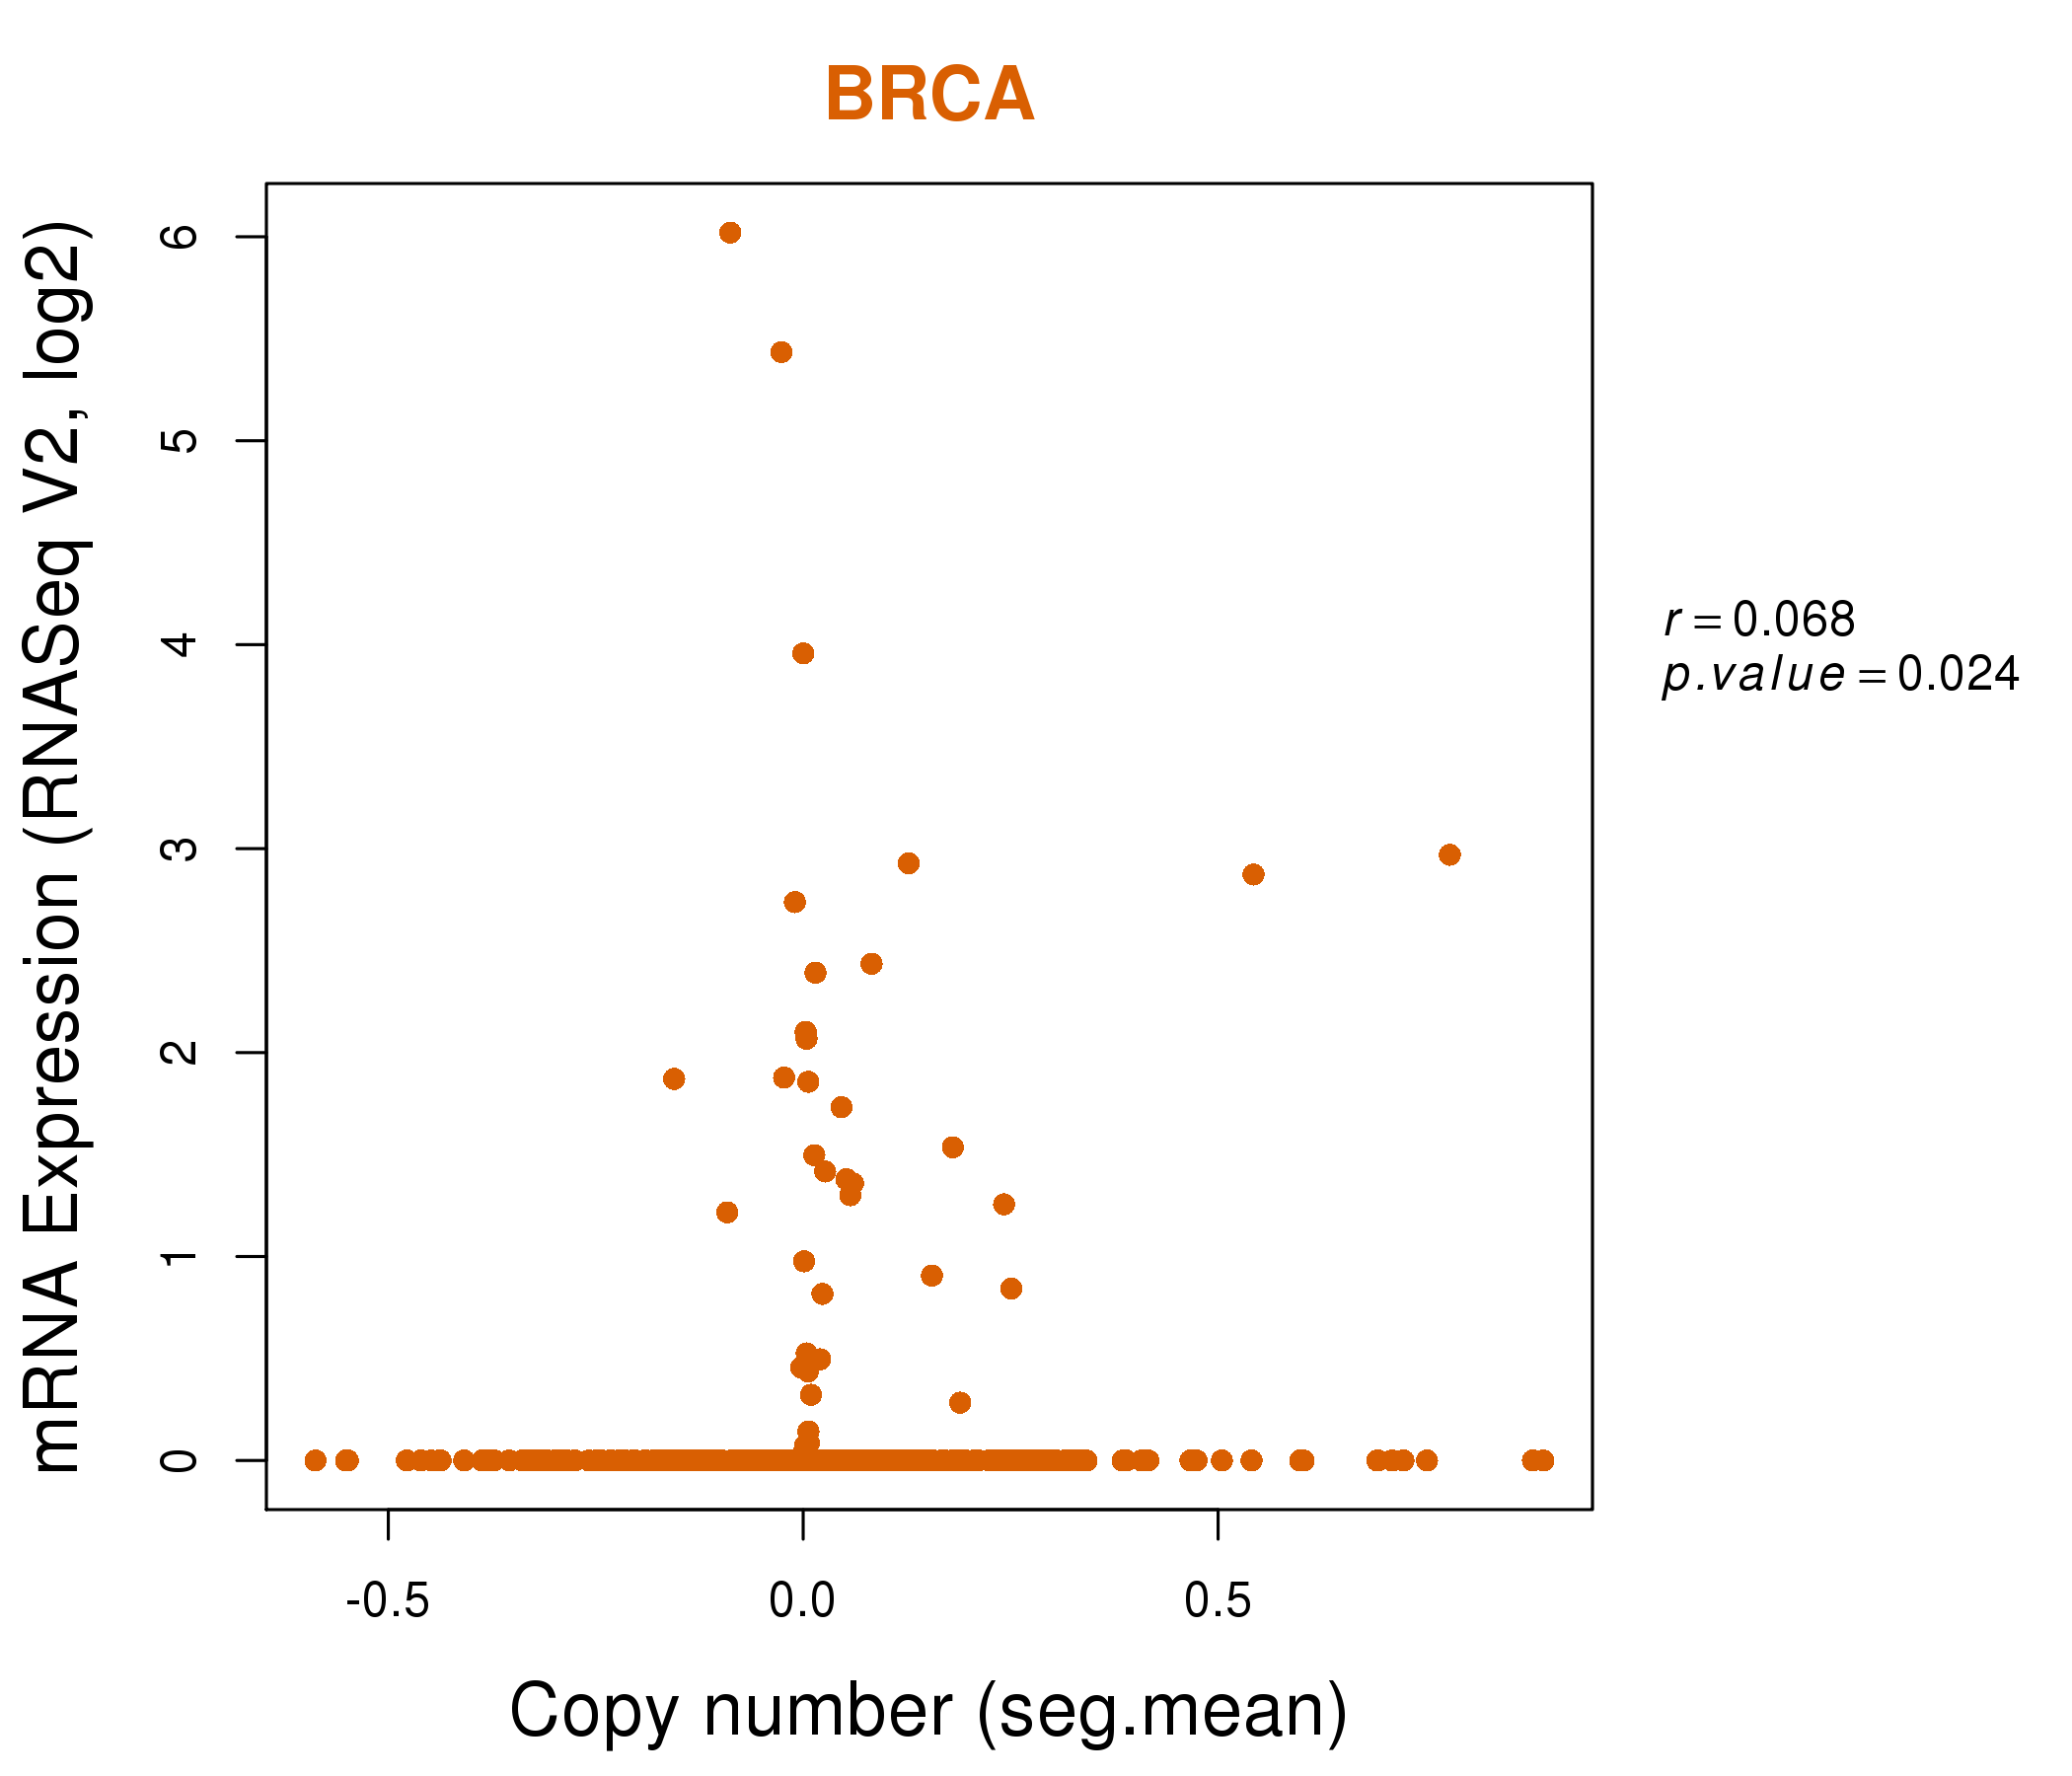
| * This plots show the correlation between CNV and gene expression. |
: Open all plots for all cancer types
 |
|
 |
|

| Top |
| Gene-Gene Network Information |
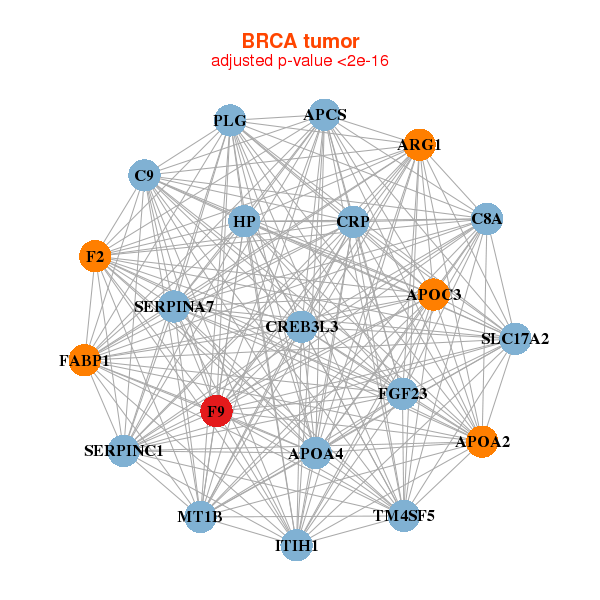
| * Co-Expression network figures were drawn using R package igraph. Only the top 20 genes with the highest correlations were shown. Red circle: input gene, orange circle: cell metabolism gene, sky circle: other gene |
: Open all plots for all cancer types
 |
| ||||
| APCS,APOA2,APOA4,APOC3,ARG1,C8A,C9, CREB3L3,CRP,F2,F9,FABP1,FGF23,HP, ITIH1,MT1B,PLG,SERPINA7,SERPINC1,SLC17A2,TM4SF5 | ACSL3,ADAM2,ALOX15B,APOD,DHRS2,ENPP3,F9, GUSB,HAAO,HIST1H2BG,HIST1H4H,NANOG,NAT2,PPEF1, RNASE12,SERHL2,SERHL,SPINK8,SULT1C3,UGT2B10,UGT2B11 | ||||
 |
| ||||
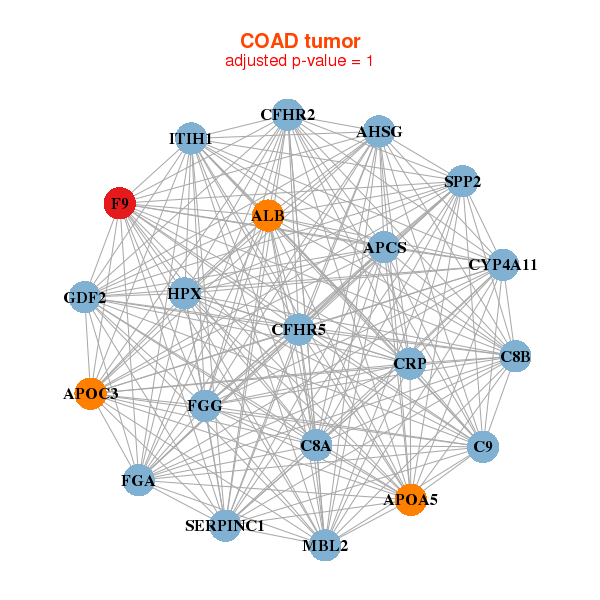
| AHSG,ALB,APCS,APOA5,APOC3,C8A,C8B, C9,CFHR2,CFHR5,CRP,CYP4A11,F9,FGA, FGG,GDF2,HPX,ITIH1,MBL2,SERPINC1,SPP2 | ALB,APCS,APOA2,C3P1,C8A,CFHR2,CFHR5, CYP4A22,DNAJB8,F13B,F9,FGG,HRG,KIR3DP1, KRTAP4-11,KRTAP5-3,LECT2,LOC100129935,LINC00160,OR1N1,SLC17A2 |

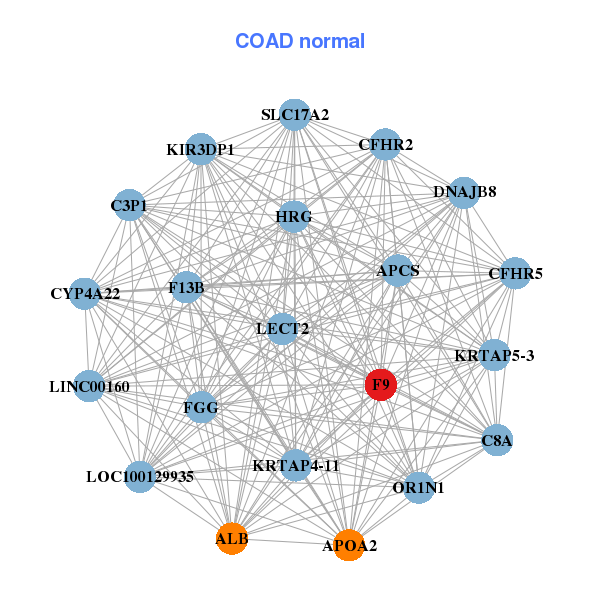
| * Co-Expression network figures were drawn using R package igraph. Only the top 20 genes with the highest correlations were shown. Red circle: input gene, orange circle: cell metabolism gene, sky circle: other gene |
: Open all plots for all cancer types
| Top |
: Open all interacting genes' information including KEGG pathway for all interacting genes from DAVID
| Top |
| Pharmacological Information for F9 |
| DB Category | DB Name | DB's ID and Url link |
| * Gene Centered Interaction Network. |
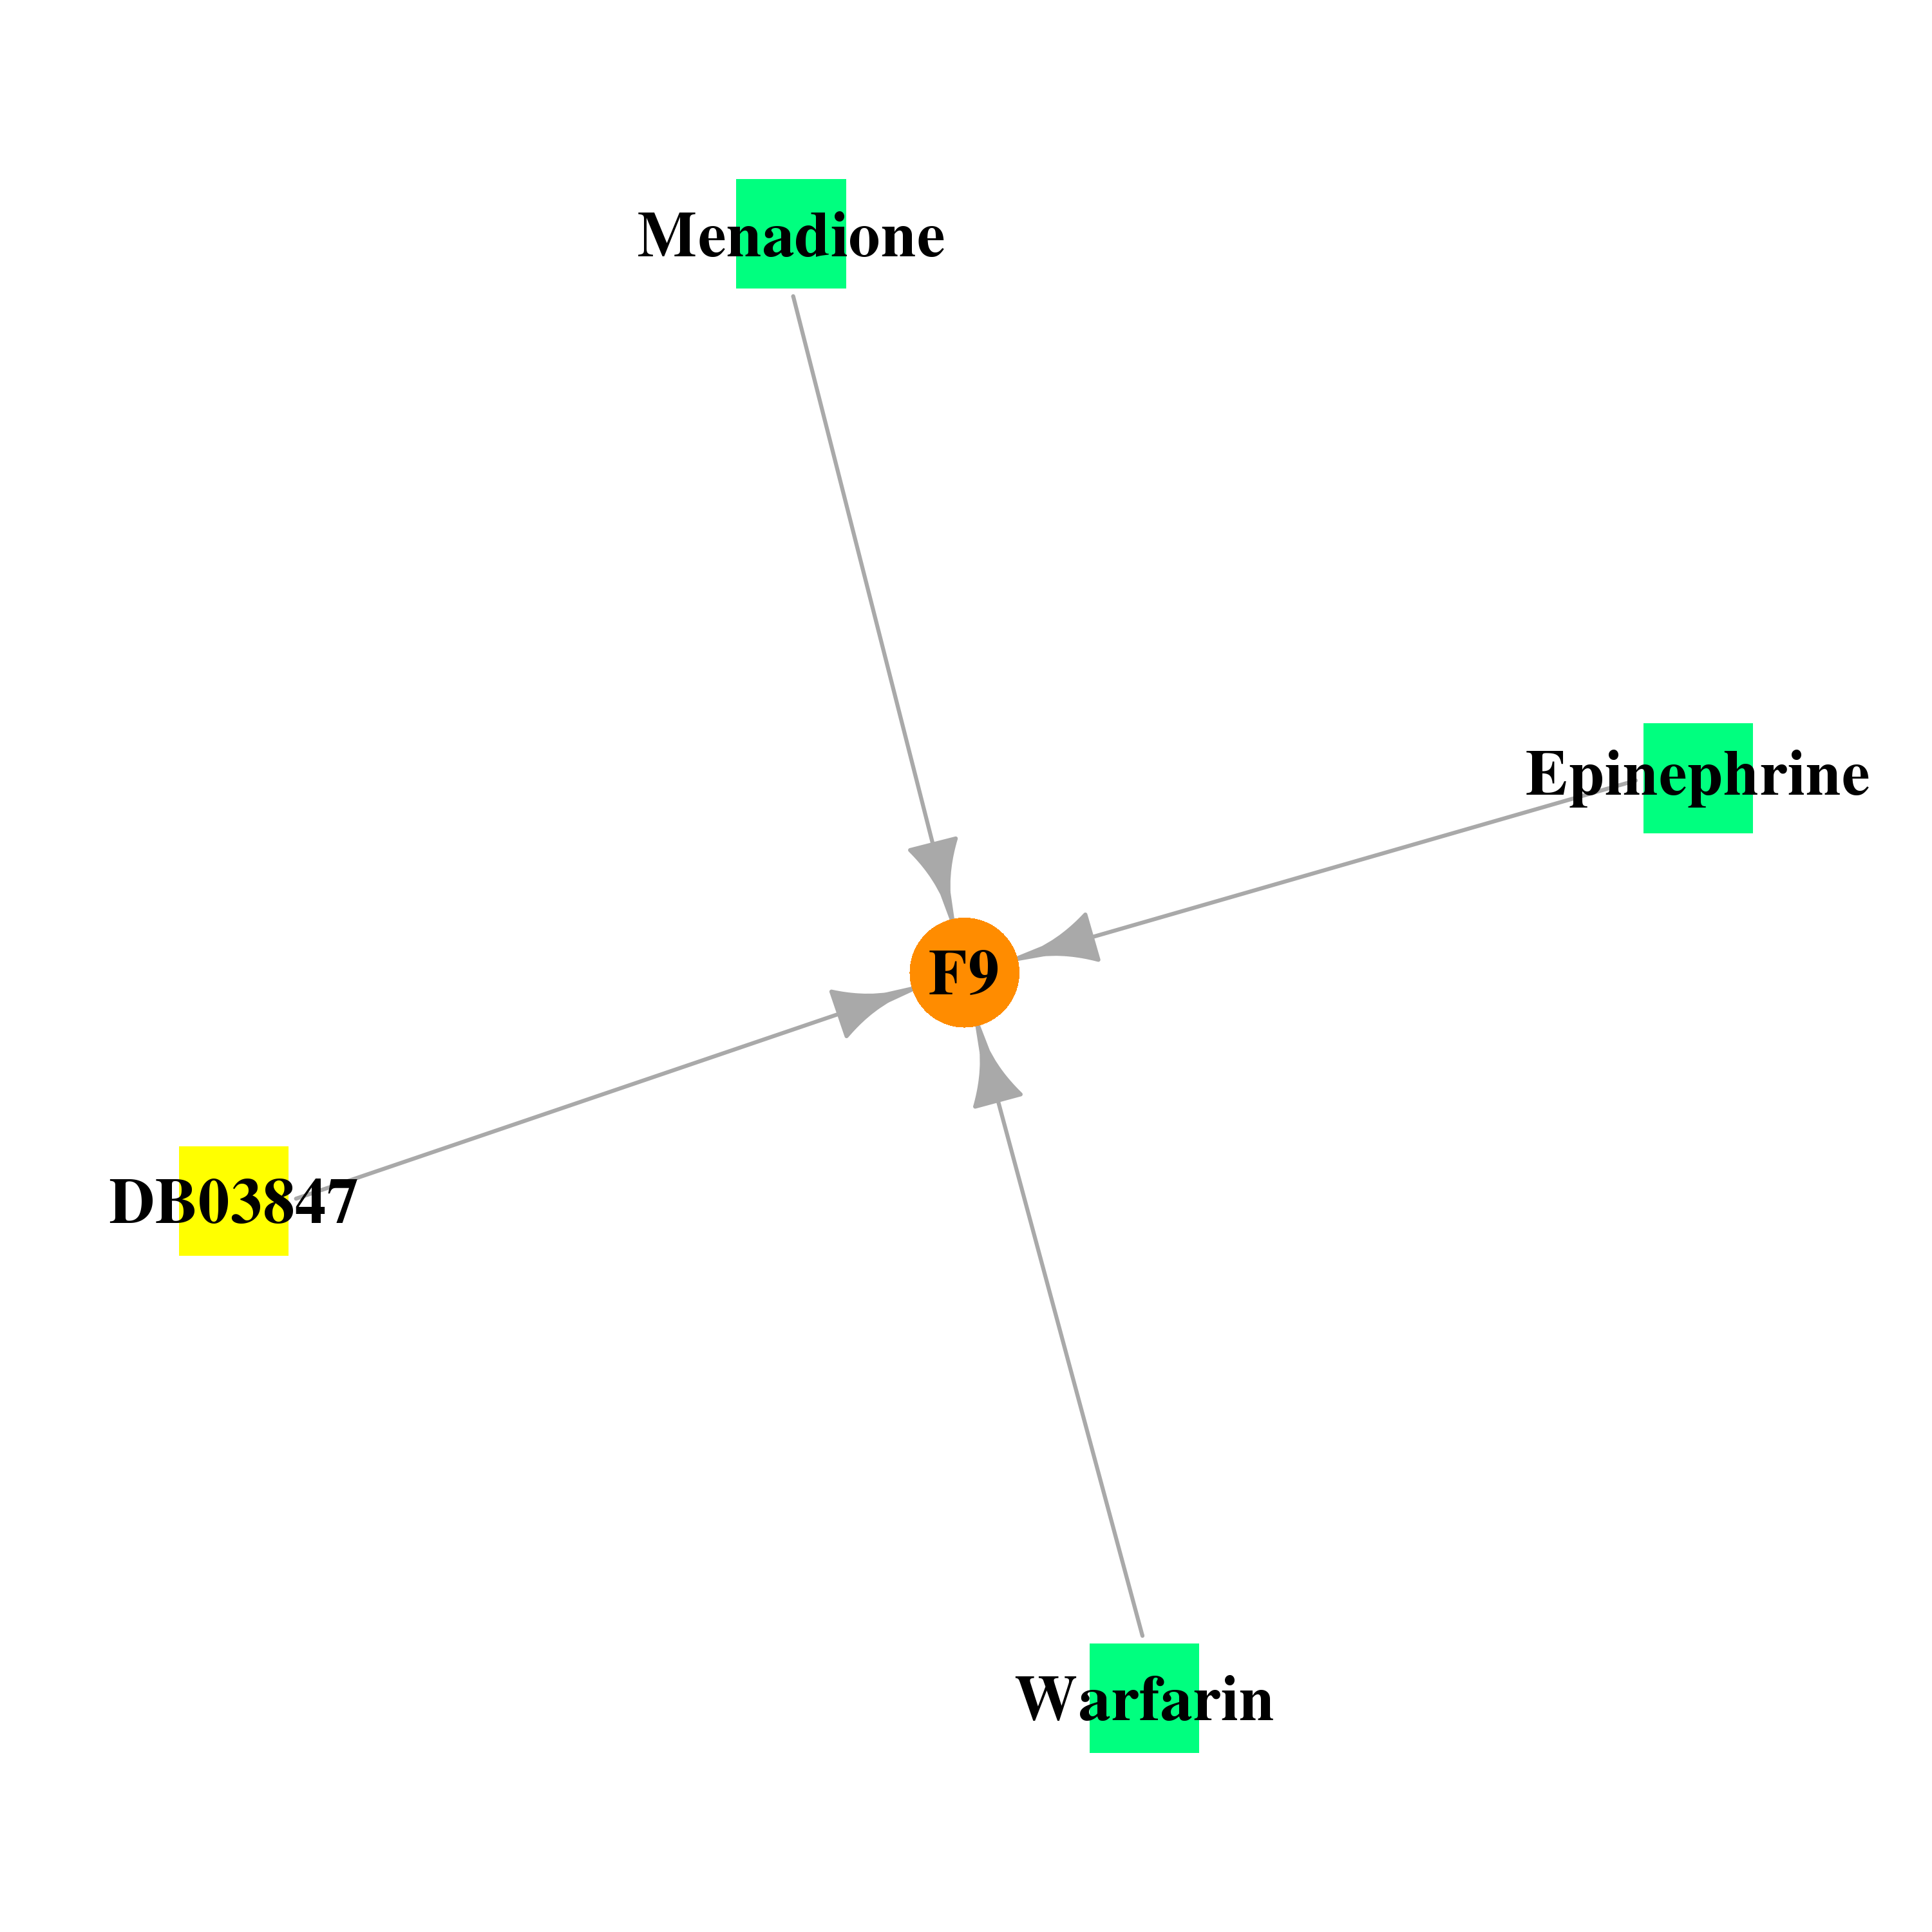 |
| * Drug Centered Interaction Network. |
| DrugBank ID | Target Name | Drug Groups | Generic Name | Drug Centered Network | Drug Structure |
| DB00170 | coagulation factor IX | approved; nutraceutical | Menadione |  |  |
| DB03847 | coagulation factor IX | experimental | Gamma-Carboxy-Glutamic Acid | 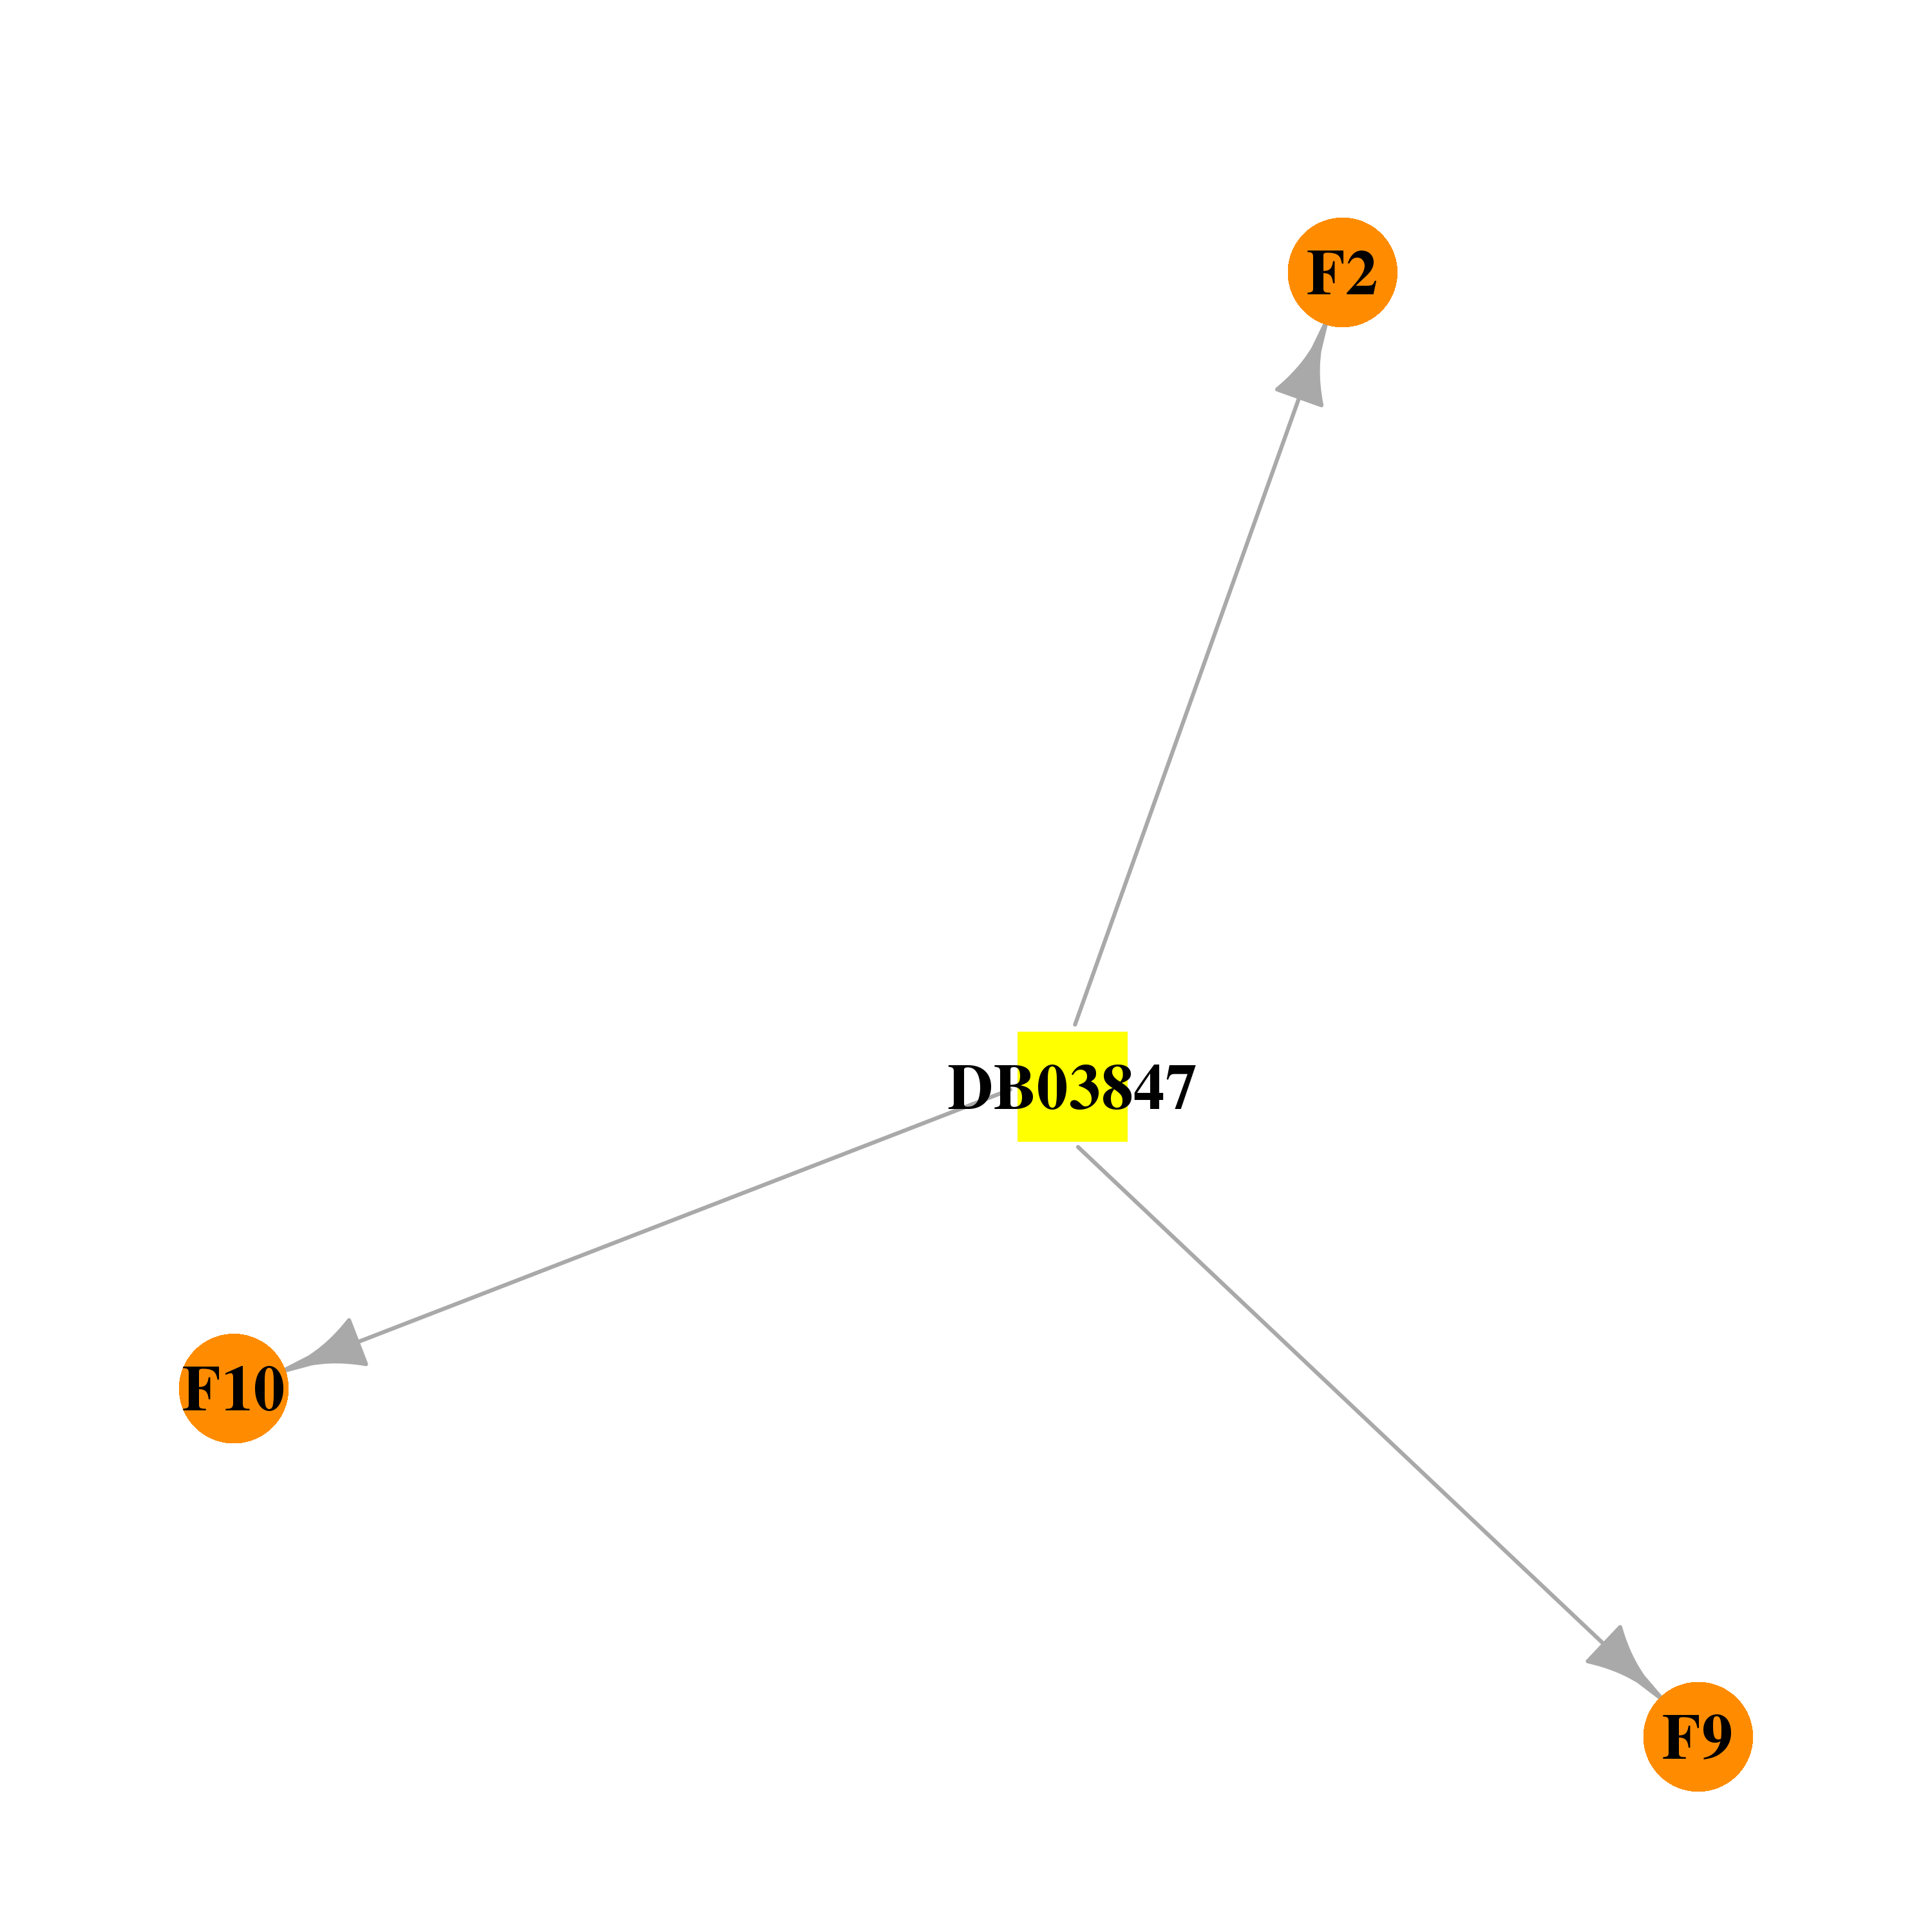 | 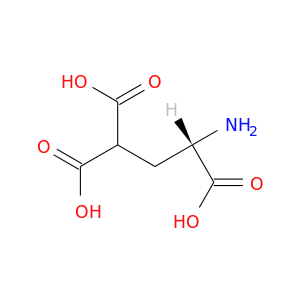 |
| DB00682 | coagulation factor IX | approved | Warfarin |  | 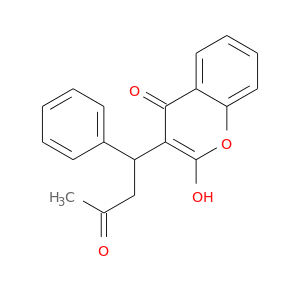 |
| DB00668 | coagulation factor IX | approved | Epinephrine | 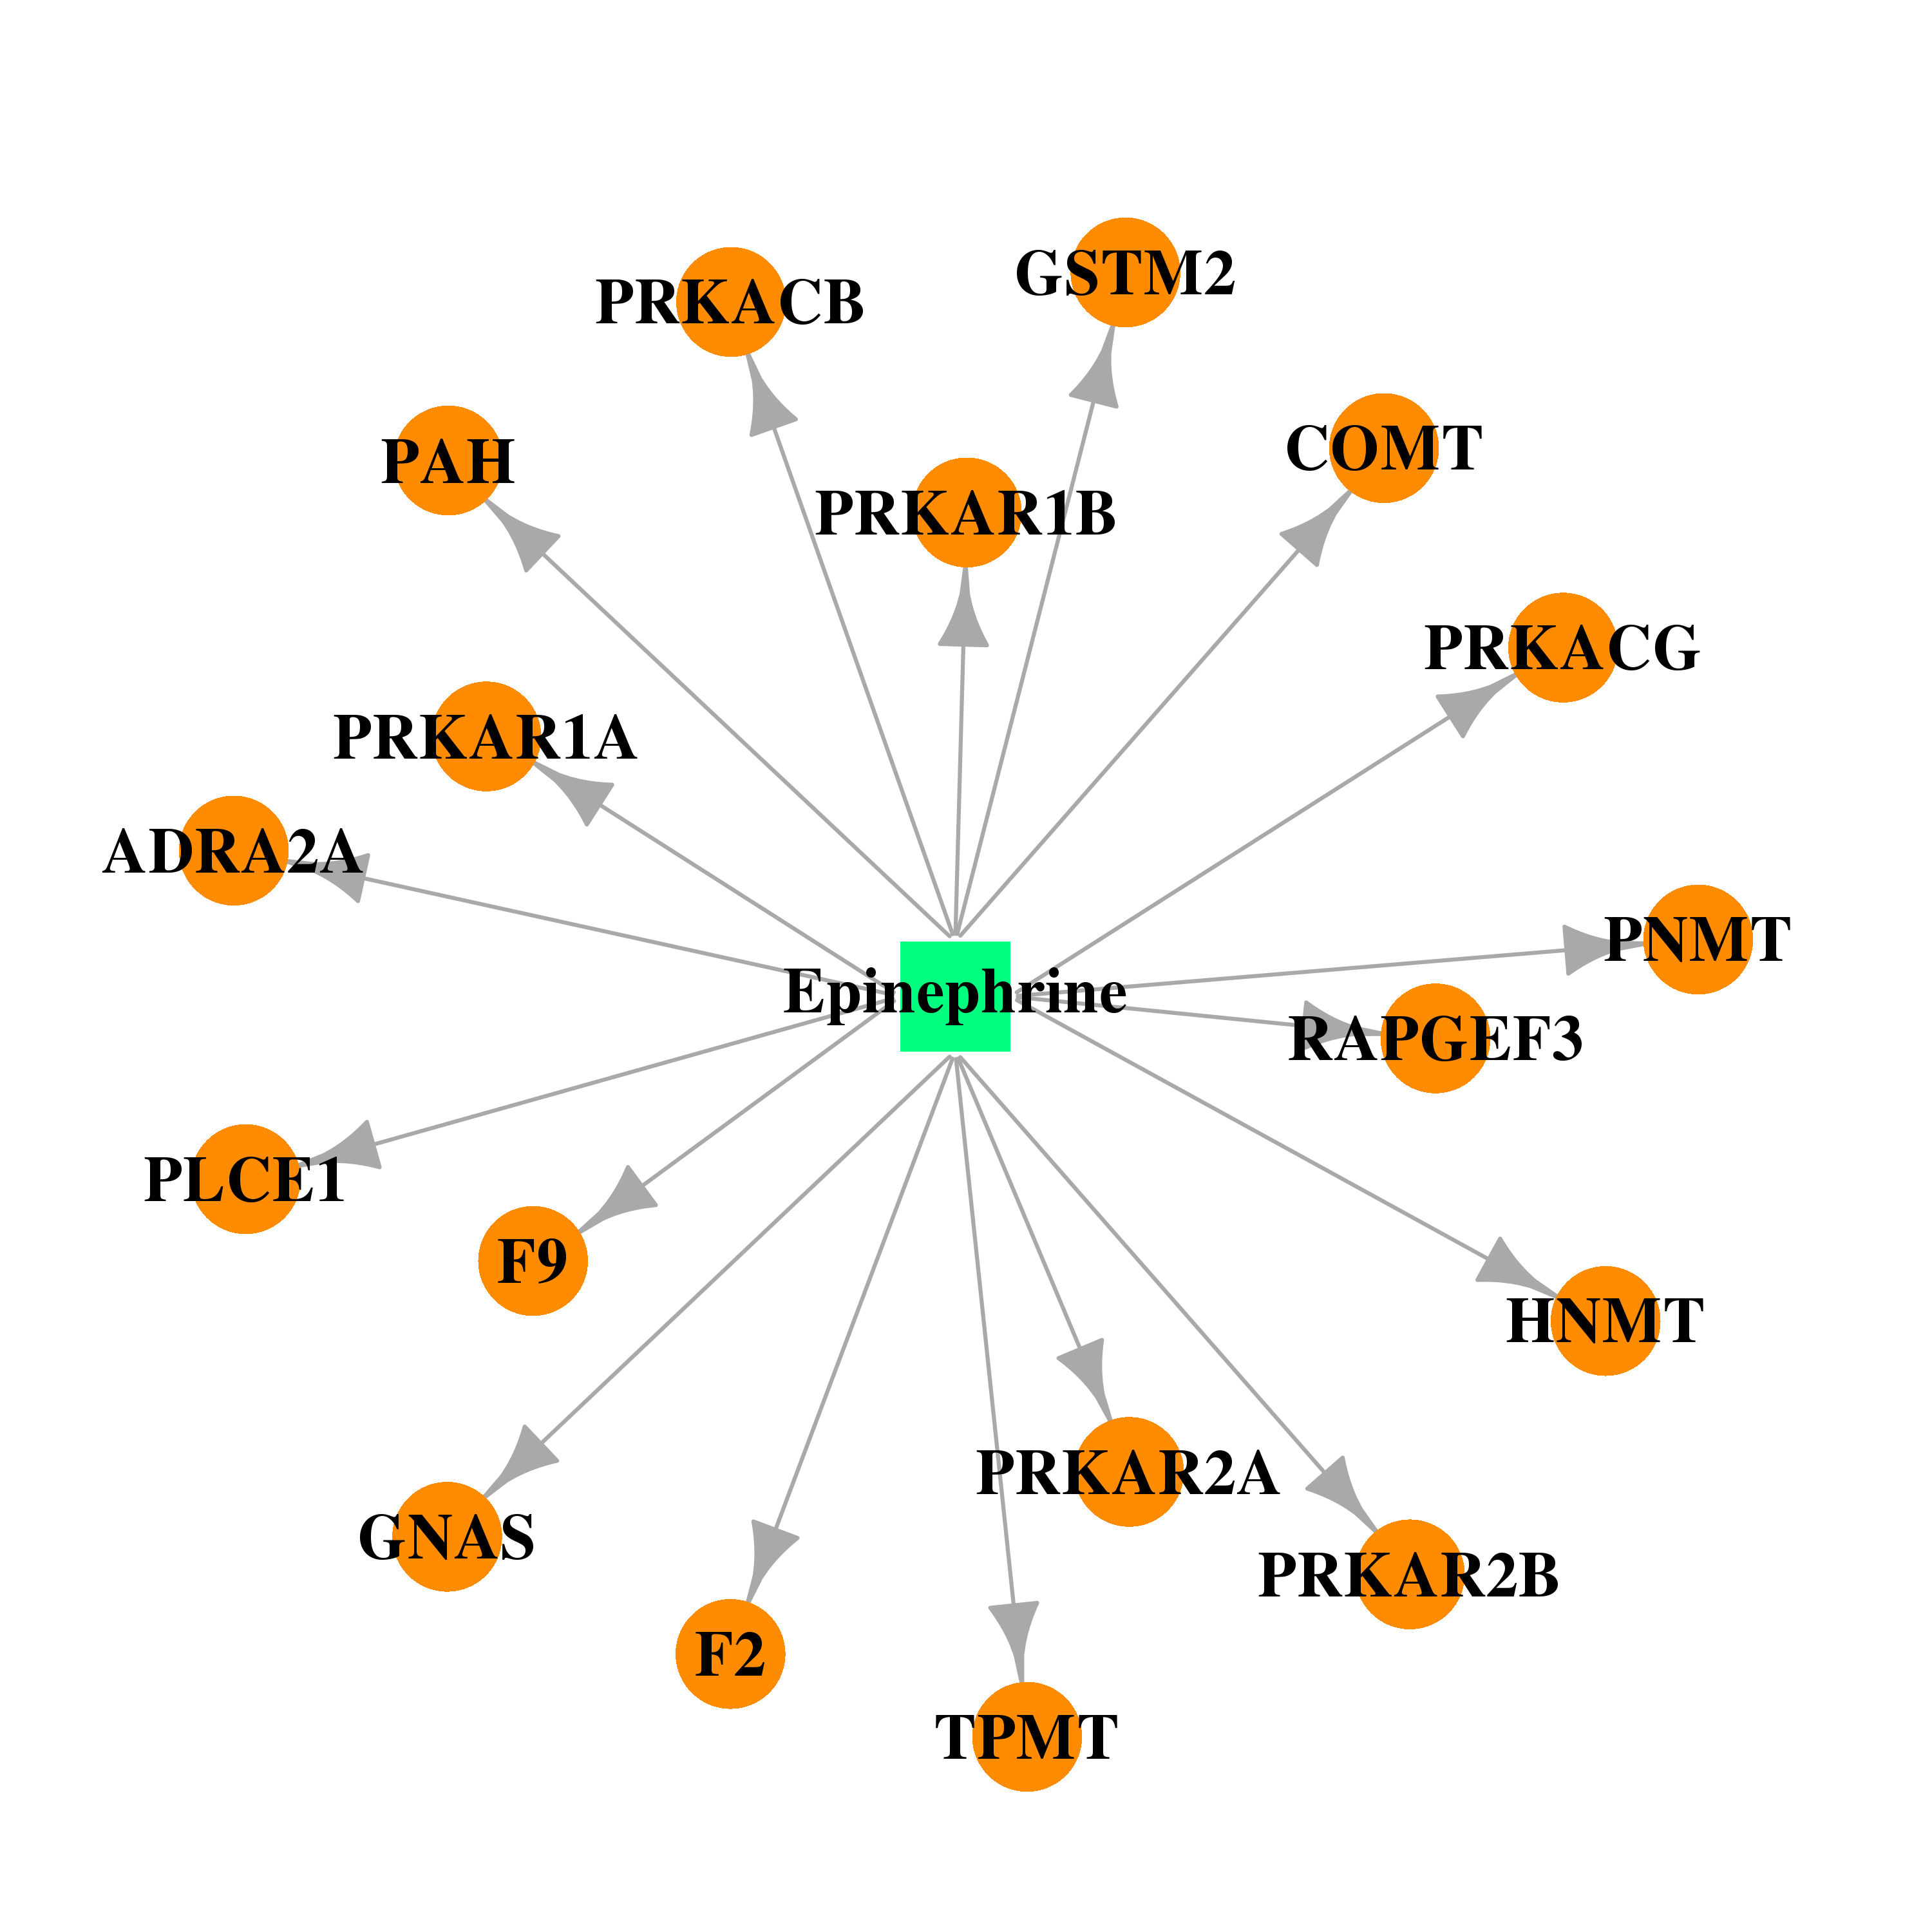 |  |
| Top |
| Cross referenced IDs for F9 |
| * We obtained these cross-references from Uniprot database. It covers 150 different DBs, 18 categories. http://www.uniprot.org/help/cross_references_section |
: Open all cross reference information
|
Copyright © 2016-Present - The Univsersity of Texas Health Science Center at Houston @ |