|
||||||||||||||||||||
| |
| Phenotypic Information (metabolism pathway, cancer, disease, phenome) |
| |
| |
| Gene-Gene Network Information: Co-Expression Network, Interacting Genes & KEGG |
| |
|


| Gene Summary for ALDH1A1 |
| Basic gene info. | Gene symbol | ALDH1A1 |
| Gene name | aldehyde dehydrogenase 1 family, member A1 | |
| Synonyms | ALDC|ALDH-E1|ALDH1|ALDH11|HEL-9|HEL-S-53e|HEL12|PUMB1|RALDH1 | |
| Cytomap | UCSC genome browser: 9q21.13 | |
| Genomic location | chr9 :75515577-75568233 | |
| Type of gene | protein-coding | |
| RefGenes | NM_000689.4, | |
| Ensembl id | ENSG00000165092 | |
| Description | ALDH class 1ALHDIIRALDH 1acetaldehyde dehydrogenase 1aldehyde dehydrogenase 1, solublealdehyde dehydrogenase, liver cytosolicepididymis luminal protein 12epididymis luminal protein 9epididymis secretory sperm binding protein Li 53eretinal dehydro | |
| Modification date | 20141222 | |
| dbXrefs | MIM : 100640 | |
| HGNC : HGNC | ||
| Ensembl : ENSG00000165092 | ||
| HPRD : 00001 | ||
| Vega : OTTHUMG00000020019 | ||
| Protein | UniProt: go to UniProt's Cross Reference DB Table | |
| Expression | CleanEX: HS_ALDH1A1 | |
| BioGPS: 216 | ||
| Gene Expression Atlas: ENSG00000165092 | ||
| The Human Protein Atlas: ENSG00000165092 | ||
| Pathway | NCI Pathway Interaction Database: ALDH1A1 | |
| KEGG: ALDH1A1 | ||
| REACTOME: ALDH1A1 | ||
| ConsensusPathDB | ||
| Pathway Commons: ALDH1A1 | ||
| Metabolism | MetaCyc: ALDH1A1 | |
| HUMANCyc: ALDH1A1 | ||
| Regulation | Ensembl's Regulation: ENSG00000165092 | |
| miRBase: chr9 :75,515,577-75,568,233 | ||
| TargetScan: NM_000689 | ||
| cisRED: ENSG00000165092 | ||
| Context | iHOP: ALDH1A1 | |
| cancer metabolism search in PubMed: ALDH1A1 | ||
| UCL Cancer Institute: ALDH1A1 | ||
| Assigned class in ccmGDB | C | |
| Top |
| Phenotypic Information for ALDH1A1(metabolism pathway, cancer, disease, phenome) |
| Cancer | CGAP: ALDH1A1 |
| Familial Cancer Database: ALDH1A1 | |
| * This gene is included in those cancer gene databases. |
|
|
|
|
|
|
| ||||||||||||||
Oncogene 1 | Significant driver gene in | |||||||||||||||||||
| cf) number; DB name 1 Oncogene; http://nar.oxfordjournals.org/content/35/suppl_1/D721.long, 2 Tumor Suppressor gene; https://bioinfo.uth.edu/TSGene/, 3 Cancer Gene Census; http://www.nature.com/nrc/journal/v4/n3/abs/nrc1299.html, 4 CancerGenes; http://nar.oxfordjournals.org/content/35/suppl_1/D721.long, 5 Network of Cancer Gene; http://ncg.kcl.ac.uk/index.php, 1Therapeutic Vulnerabilities in Cancer; http://cbio.mskcc.org/cancergenomics/statius/ |
| KEGG_RETINOL_METABOLISM | |
| Mutations for ALDH1A1 |
| * Under tables are showing count per each tissue to give us broad intuition about tissue specific mutation patterns.You can go to the detailed page for each mutation database's web site. |
| There's no structural variation information in COSMIC data for this gene. |
| * From mRNA Sanger sequences, Chitars2.0 arranged chimeric transcripts. This table shows ALDH1A1 related fusion information. |
| ID | Head Gene | Tail Gene | Accession | Gene_a | qStart_a | qEnd_a | Chromosome_a | tStart_a | tEnd_a | Gene_a | qStart_a | qEnd_a | Chromosome_a | tStart_a | tEnd_a |
| DA668305 | HSPA8 | 2 | 89 | 11 | 122930043 | 122930129 | ALDH1A1 | 90 | 558 | 9 | 75531952 | 75542085 | |
| BF436998 | ALDH1A1 | 35 | 274 | 9 | 75515618 | 75515857 | EPB41L4A | 273 | 330 | 5 | 111754705 | 111754762 | |
| AI493829 | ALDH1A1 | 1 | 21 | 9 | 75652605 | 75652625 | ELL | 8 | 477 | 19 | 18555203 | 18555674 | |
| AA515000 | ALDH1A1 | 8 | 87 | 9 | 75515725 | 75515804 | ALDH1A1 | 81 | 217 | 9 | 75515589 | 75515725 | |
| BQ317586 | ALDH1A1 | 23 | 244 | 9 | 75540456 | 75543894 | ALDH1A1 | 238 | 333 | 9 | 75545800 | 75545895 | |
| BU674486 | ALDH1A1 | 19 | 132 | 9 | 75515585 | 75515698 | ALDH1A1 | 122 | 538 | 9 | 75515748 | 75516164 | |
| DA896624 | ALDH1A1 | 1 | 475 | 9 | 75531935 | 75567934 | ALDH1A1 | 469 | 540 | 9 | 75540406 | 75540477 | |
| BU685483 | ALDH1A1 | 18 | 129 | 9 | 75515587 | 75515698 | ALDH1A1 | 119 | 577 | 9 | 75515706 | 75516164 | |
| Top |
| There's no copy number variation information in COSMIC data for this gene. |
| Top |
|
 |
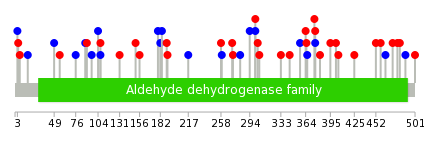
| Top |
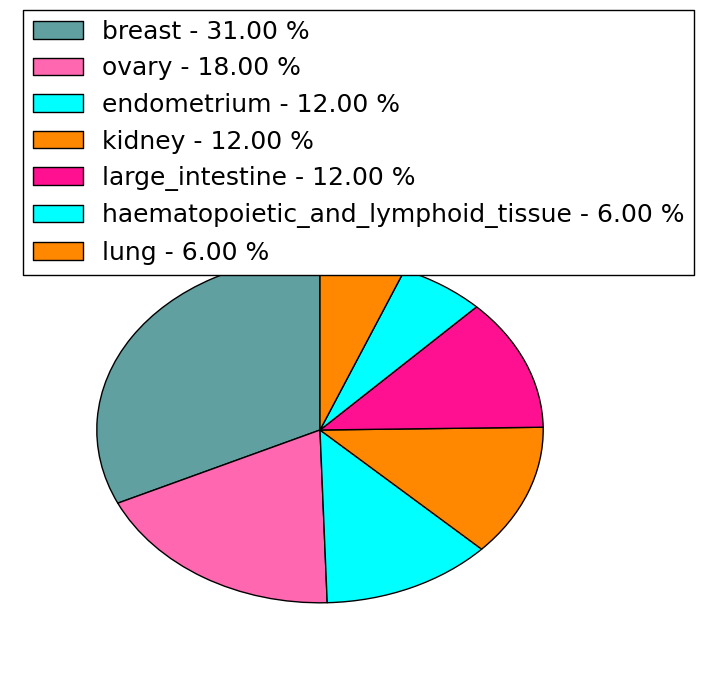
| Stat. for Non-Synonymous SNVs (# total SNVs=44) | (# total SNVs=16) |
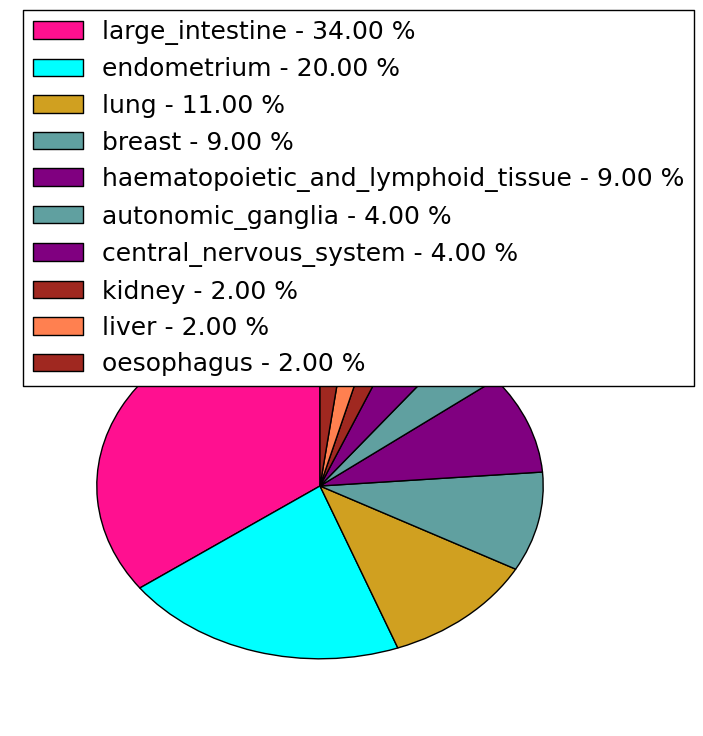 |  |
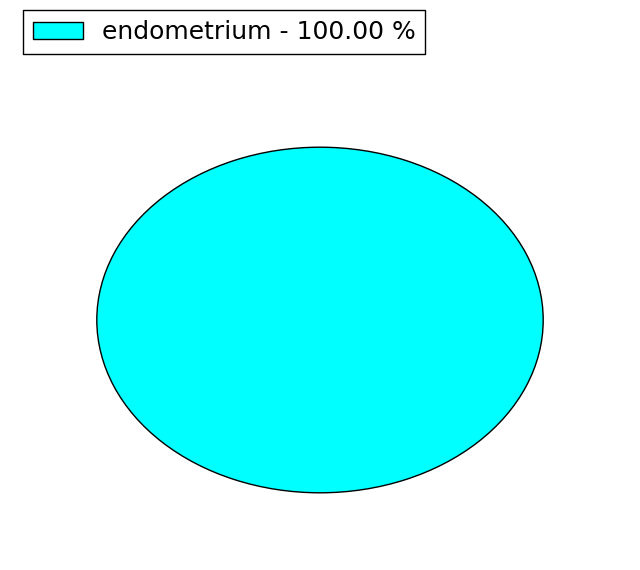
(# total SNVs=1) | (# total SNVs=0) |
 |
| Top |
| * When you move the cursor on each content, you can see more deailed mutation information on the Tooltip. Those are primary_site,primary_histology,mutation(aa),pubmedID. |
| GRCh37 position | Mutation(aa) | Unique sampleID count |
| chr9:75539039-75539039 | p.P215S | 3 |
| chr9:75545879-75545879 | p.P76P | 2 |
| chr9:75520915-75520915 | p.C464C | 2 |
| chr9:75520934-75520934 | p.G458D | 2 |
| chr9:75567907-75567907 | p.S4A | 1 |
| chr9:75526891-75526891 | p.R395C | 1 |
| chr9:75540481-75540481 | p.L184L | 1 |
| chr9:75543930-75543930 | p.E107G | 1 |
| chr9:75527039-75527039 | p.? | 1 |
| chr9:75524517-75524517 | p.? | 1 |
| Top |
|
 |
| Point Mutation/ Tissue ID | 1 | 2 | 3 | 4 | 5 | 6 | 7 | 8 | 9 | 10 | 11 | 12 | 13 | 14 | 15 | 16 | 17 | 18 | 19 | 20 |
| # sample | 4 | 6 | 10 | 1 | 1 | 3 | 5 | 1 | 3 | 3 | 6 | 9 | ||||||||
| # mutation | 4 | 6 | 10 | 1 | 1 | 3 | 5 | 1 | 3 | 3 | 6 | 10 | ||||||||
| nonsynonymous SNV | 2 | 2 | 9 | 1 | 1 | 4 | 3 | 2 | 8 | |||||||||||
| synonymous SNV | 2 | 4 | 1 | 1 | 2 | 1 | 1 | 3 | 4 | 2 |
| cf) Tissue ID; Tissue type (1; BLCA[Bladder Urothelial Carcinoma], 2; BRCA[Breast invasive carcinoma], 3; CESC[Cervical squamous cell carcinoma and endocervical adenocarcinoma], 4; COAD[Colon adenocarcinoma], 5; GBM[Glioblastoma multiforme], 6; Glioma Low Grade, 7; HNSC[Head and Neck squamous cell carcinoma], 8; KICH[Kidney Chromophobe], 9; KIRC[Kidney renal clear cell carcinoma], 10; KIRP[Kidney renal papillary cell carcinoma], 11; LAML[Acute Myeloid Leukemia], 12; LUAD[Lung adenocarcinoma], 13; LUSC[Lung squamous cell carcinoma], 14; OV[Ovarian serous cystadenocarcinoma ], 15; PAAD[Pancreatic adenocarcinoma], 16; PRAD[Prostate adenocarcinoma], 17; SKCM[Skin Cutaneous Melanoma], 18:STAD[Stomach adenocarcinoma], 19:THCA[Thyroid carcinoma], 20:UCEC[Uterine Corpus Endometrial Carcinoma]) |
| Top |
| * We represented just top 10 SNVs. When you move the cursor on each content, you can see more deailed mutation information on the Tooltip. Those are primary_site, primary_histology, mutation(aa), pubmedID. |
| Genomic Position | Mutation(aa) | Unique sampleID count |
| chr9:75531989 | p.S4A | 1 |
| chr9:75520915 | p.G473A | 1 |
| chr9:75540496 | p.P344S | 1 |
| chr9:75526976 | p.P182P | 1 |
| chr9:75555069 | p.S3S | 1 |
| chr9:75533640 | p.C464C | 1 |
| chr9:75520934 | p.G333E | 1 |
| chr9:75542069 | p.K179K | 1 |
| chr9:75526981 | p.G458D | 1 |
| chr9:75555088 | p.A306T | 1 |
| * Copy number data were extracted from TCGA using R package TCGA-Assembler. The URLs of all public data files on TCGA DCC data server were gathered on Jan-05-2015. Function ProcessCNAData in TCGA-Assembler package was used to obtain gene-level copy number value which is calculated as the average copy number of the genomic region of a gene. |
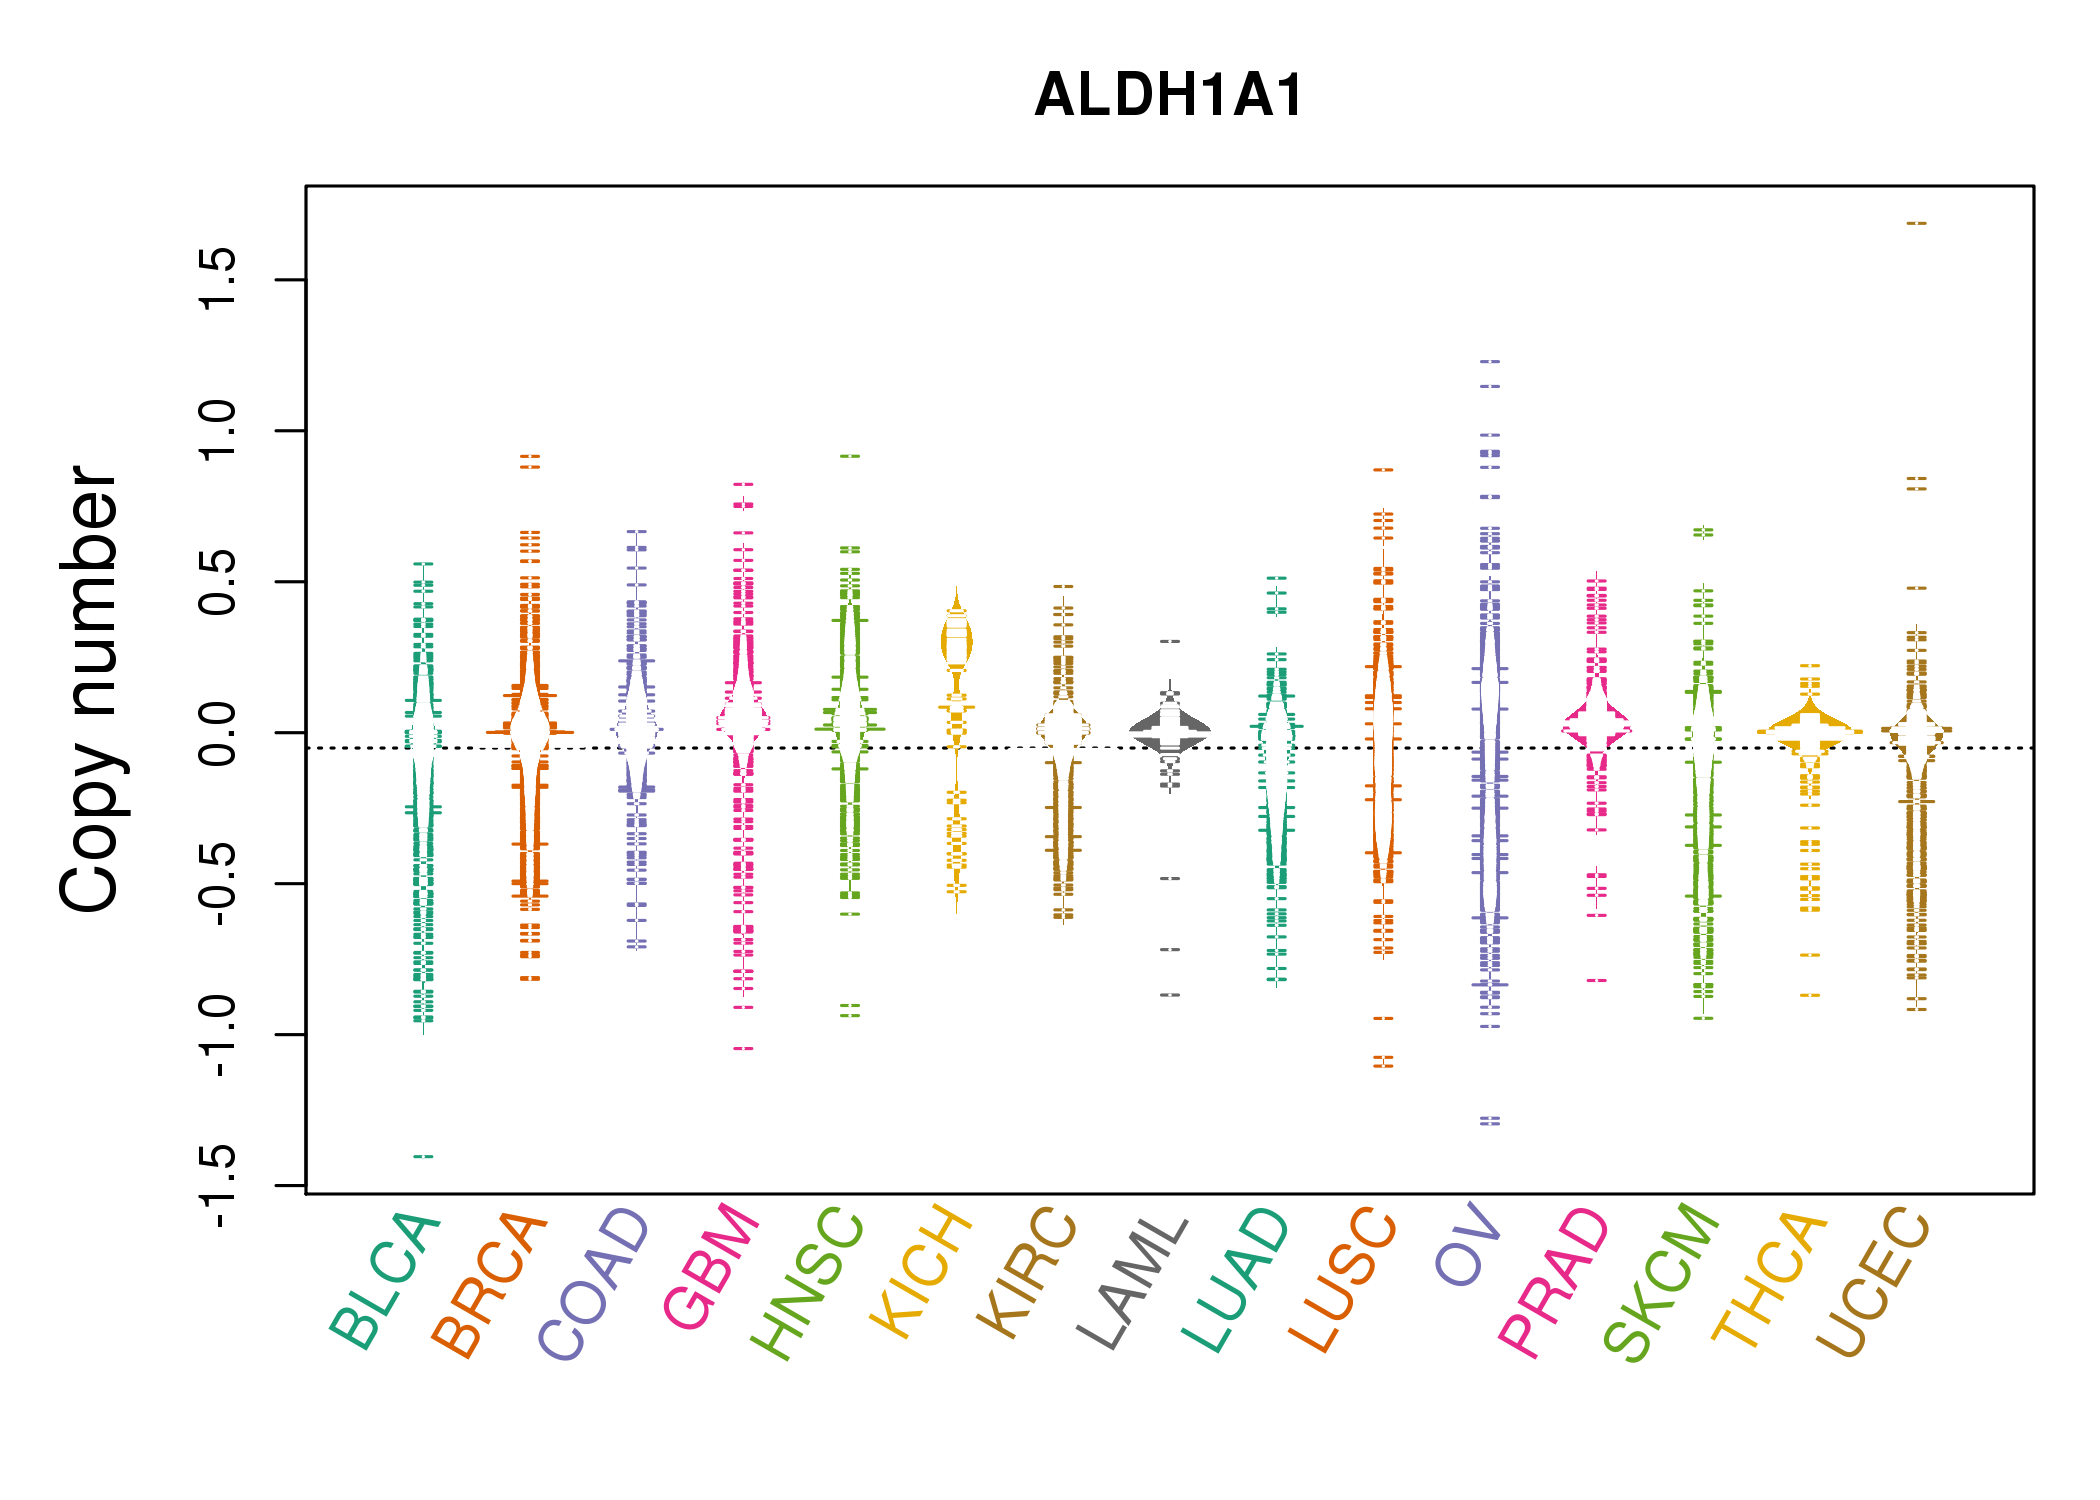 |
| cf) Tissue ID[Tissue type]: BLCA[Bladder Urothelial Carcinoma], BRCA[Breast invasive carcinoma], CESC[Cervical squamous cell carcinoma and endocervical adenocarcinoma], COAD[Colon adenocarcinoma], GBM[Glioblastoma multiforme], Glioma Low Grade, HNSC[Head and Neck squamous cell carcinoma], KICH[Kidney Chromophobe], KIRC[Kidney renal clear cell carcinoma], KIRP[Kidney renal papillary cell carcinoma], LAML[Acute Myeloid Leukemia], LUAD[Lung adenocarcinoma], LUSC[Lung squamous cell carcinoma], OV[Ovarian serous cystadenocarcinoma ], PAAD[Pancreatic adenocarcinoma], PRAD[Prostate adenocarcinoma], SKCM[Skin Cutaneous Melanoma], STAD[Stomach adenocarcinoma], THCA[Thyroid carcinoma], UCEC[Uterine Corpus Endometrial Carcinoma] |
| Top |
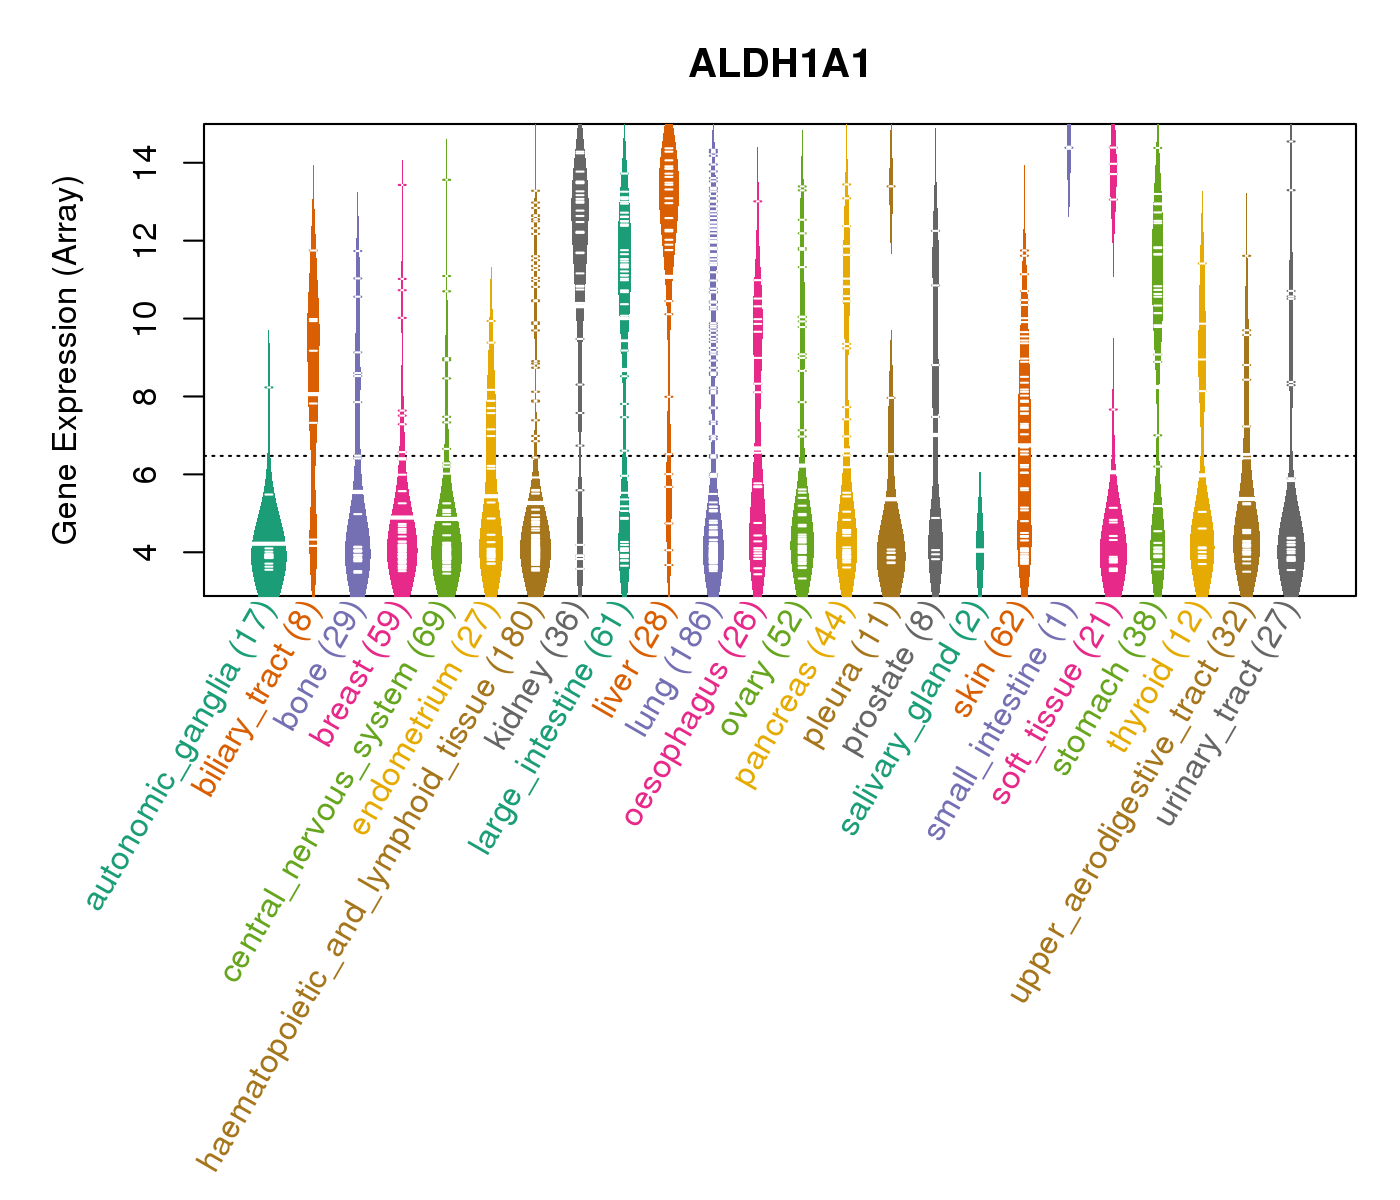
| Gene Expression for ALDH1A1 |
| * CCLE gene expression data were extracted from CCLE_Expression_Entrez_2012-10-18.res: Gene-centric RMA-normalized mRNA expression data. |
 |
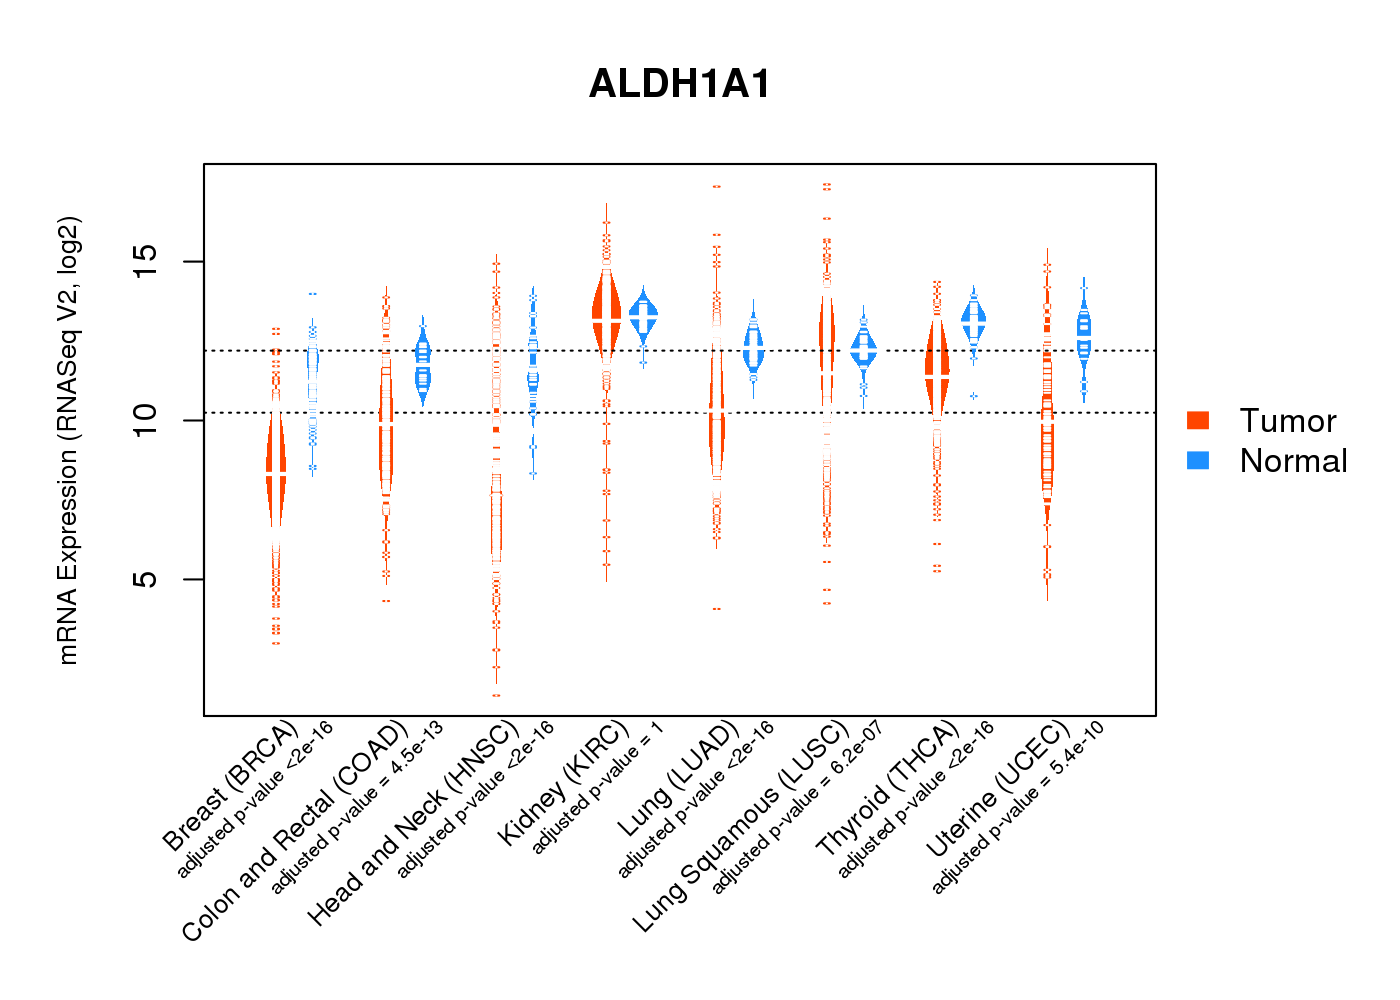
| * Normalized gene expression data of RNASeqV2 was extracted from TCGA using R package TCGA-Assembler. The URLs of all public data files on TCGA DCC data server were gathered at Jan-05-2015. Only eight cancer types have enough normal control samples for differential expression analysis. (t test, adjusted p<0.05 (using Benjamini-Hochberg FDR)) |
 |
| Top |
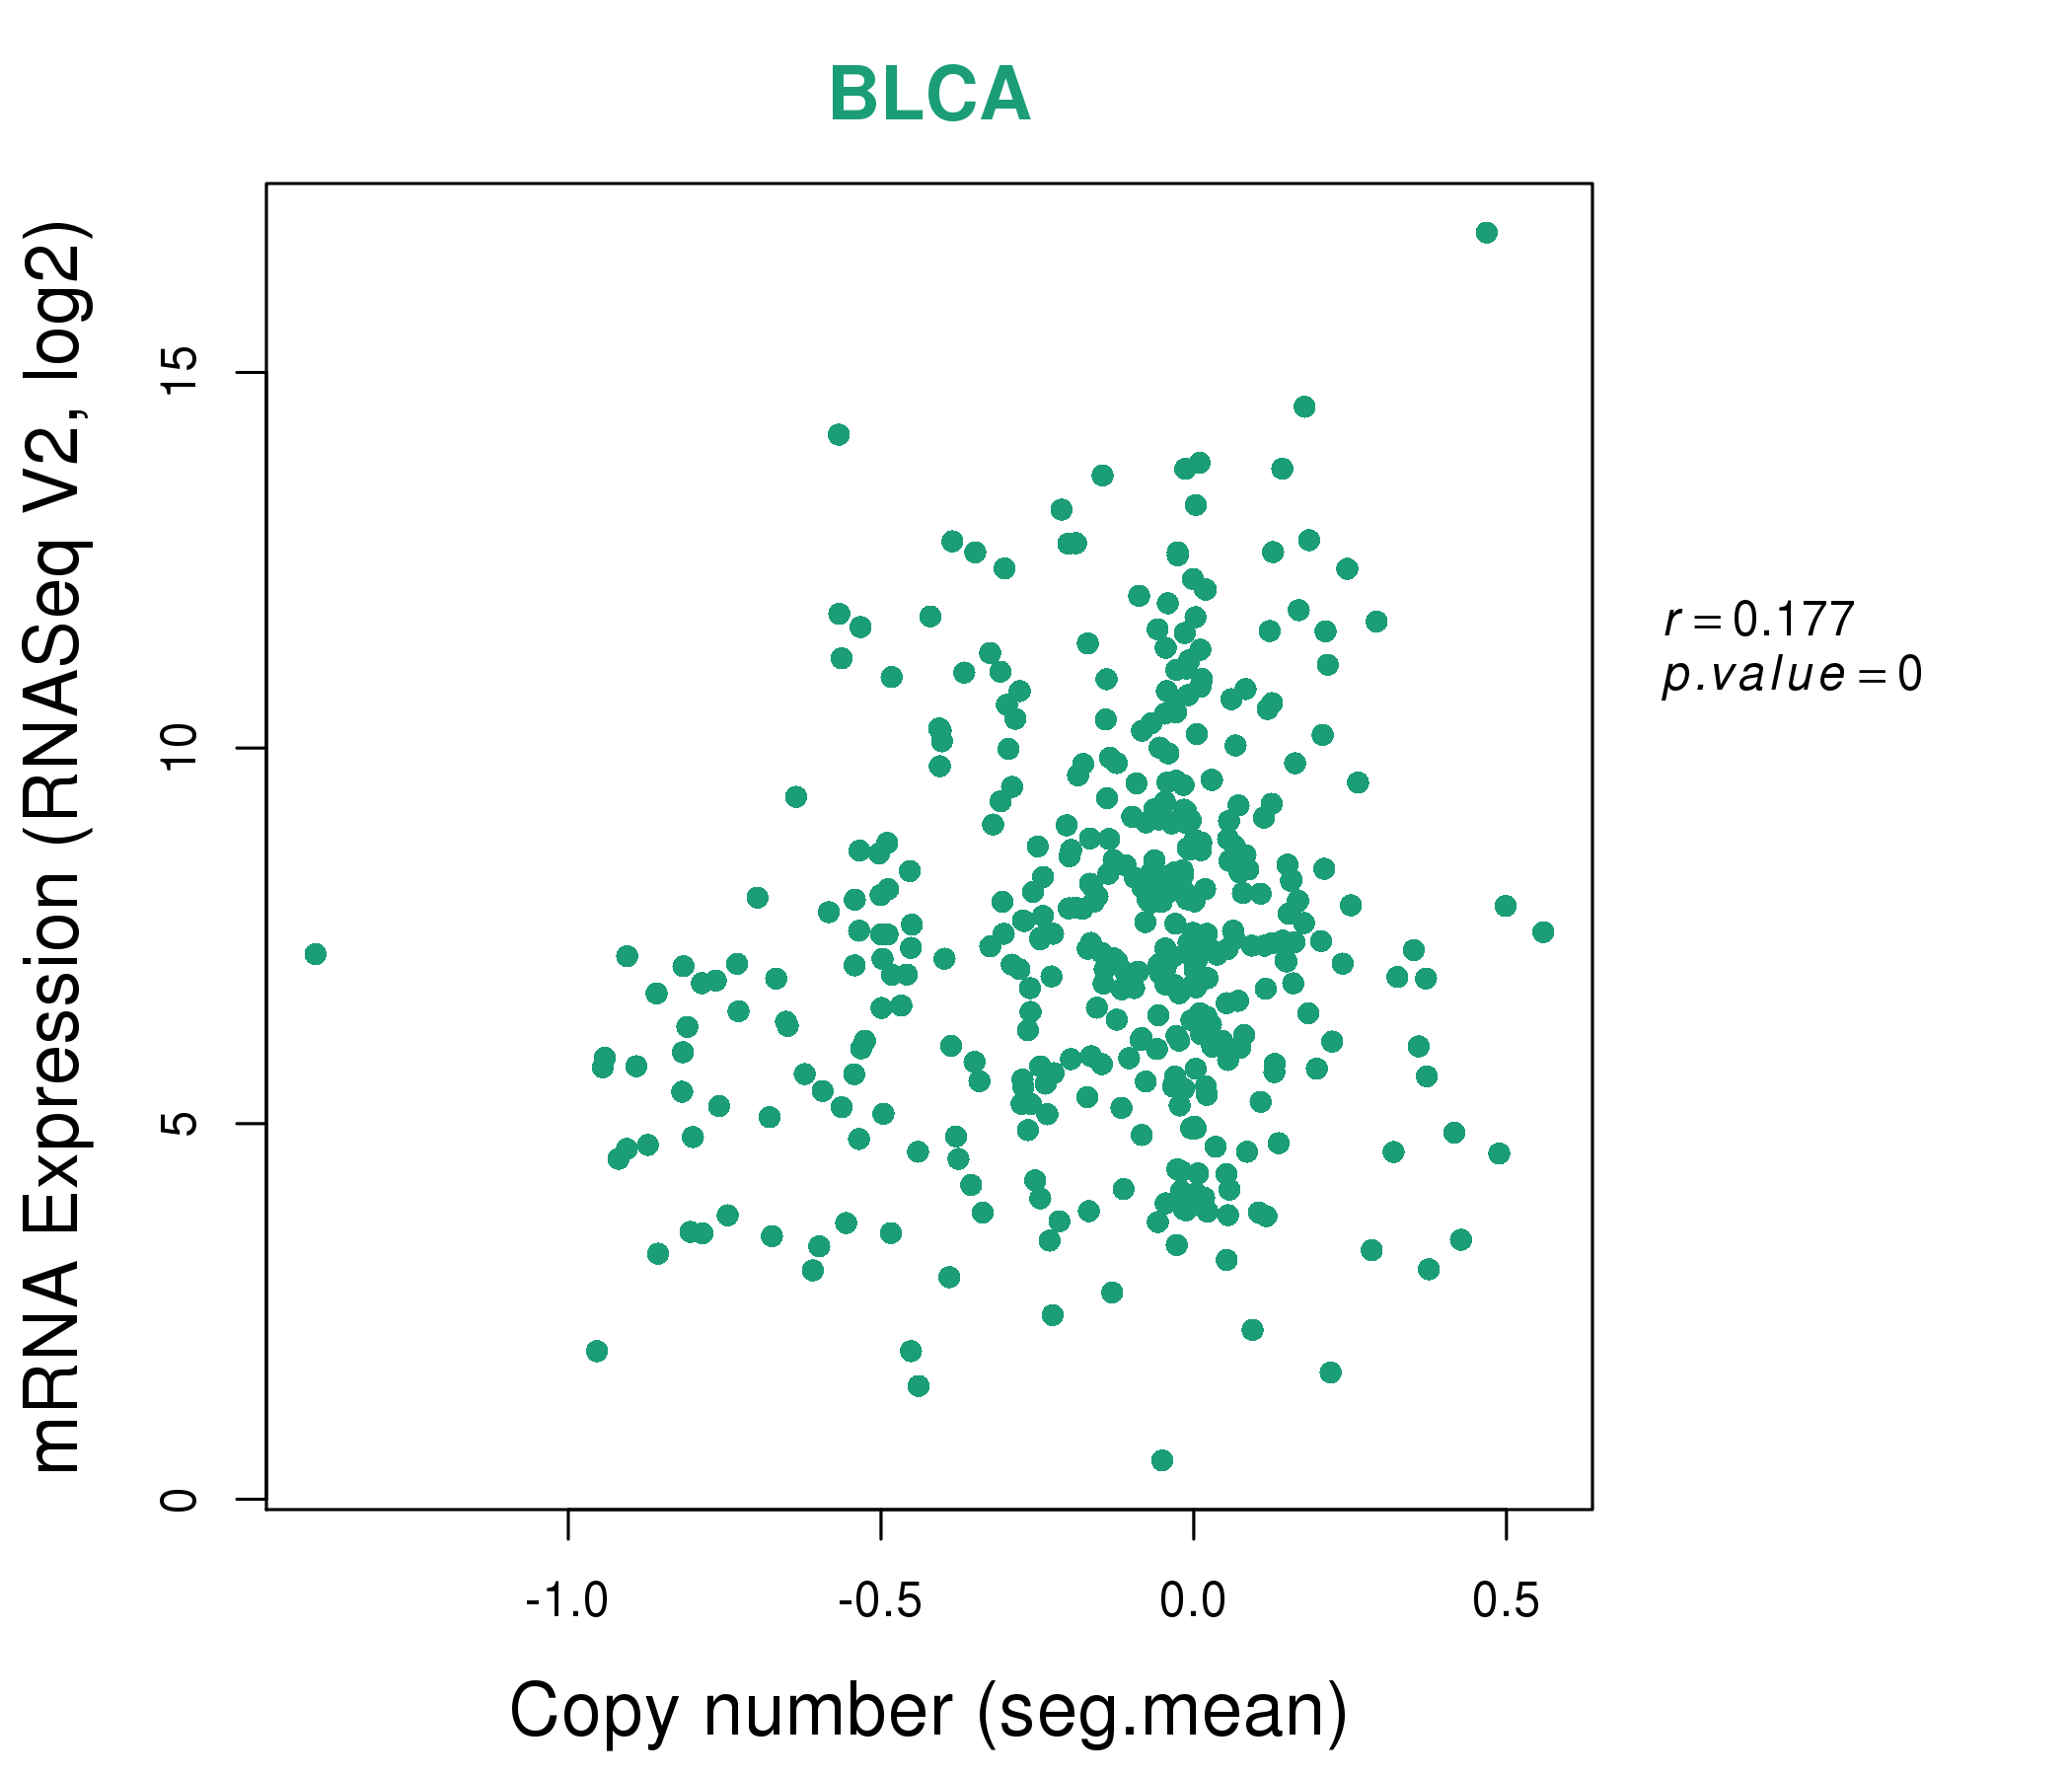
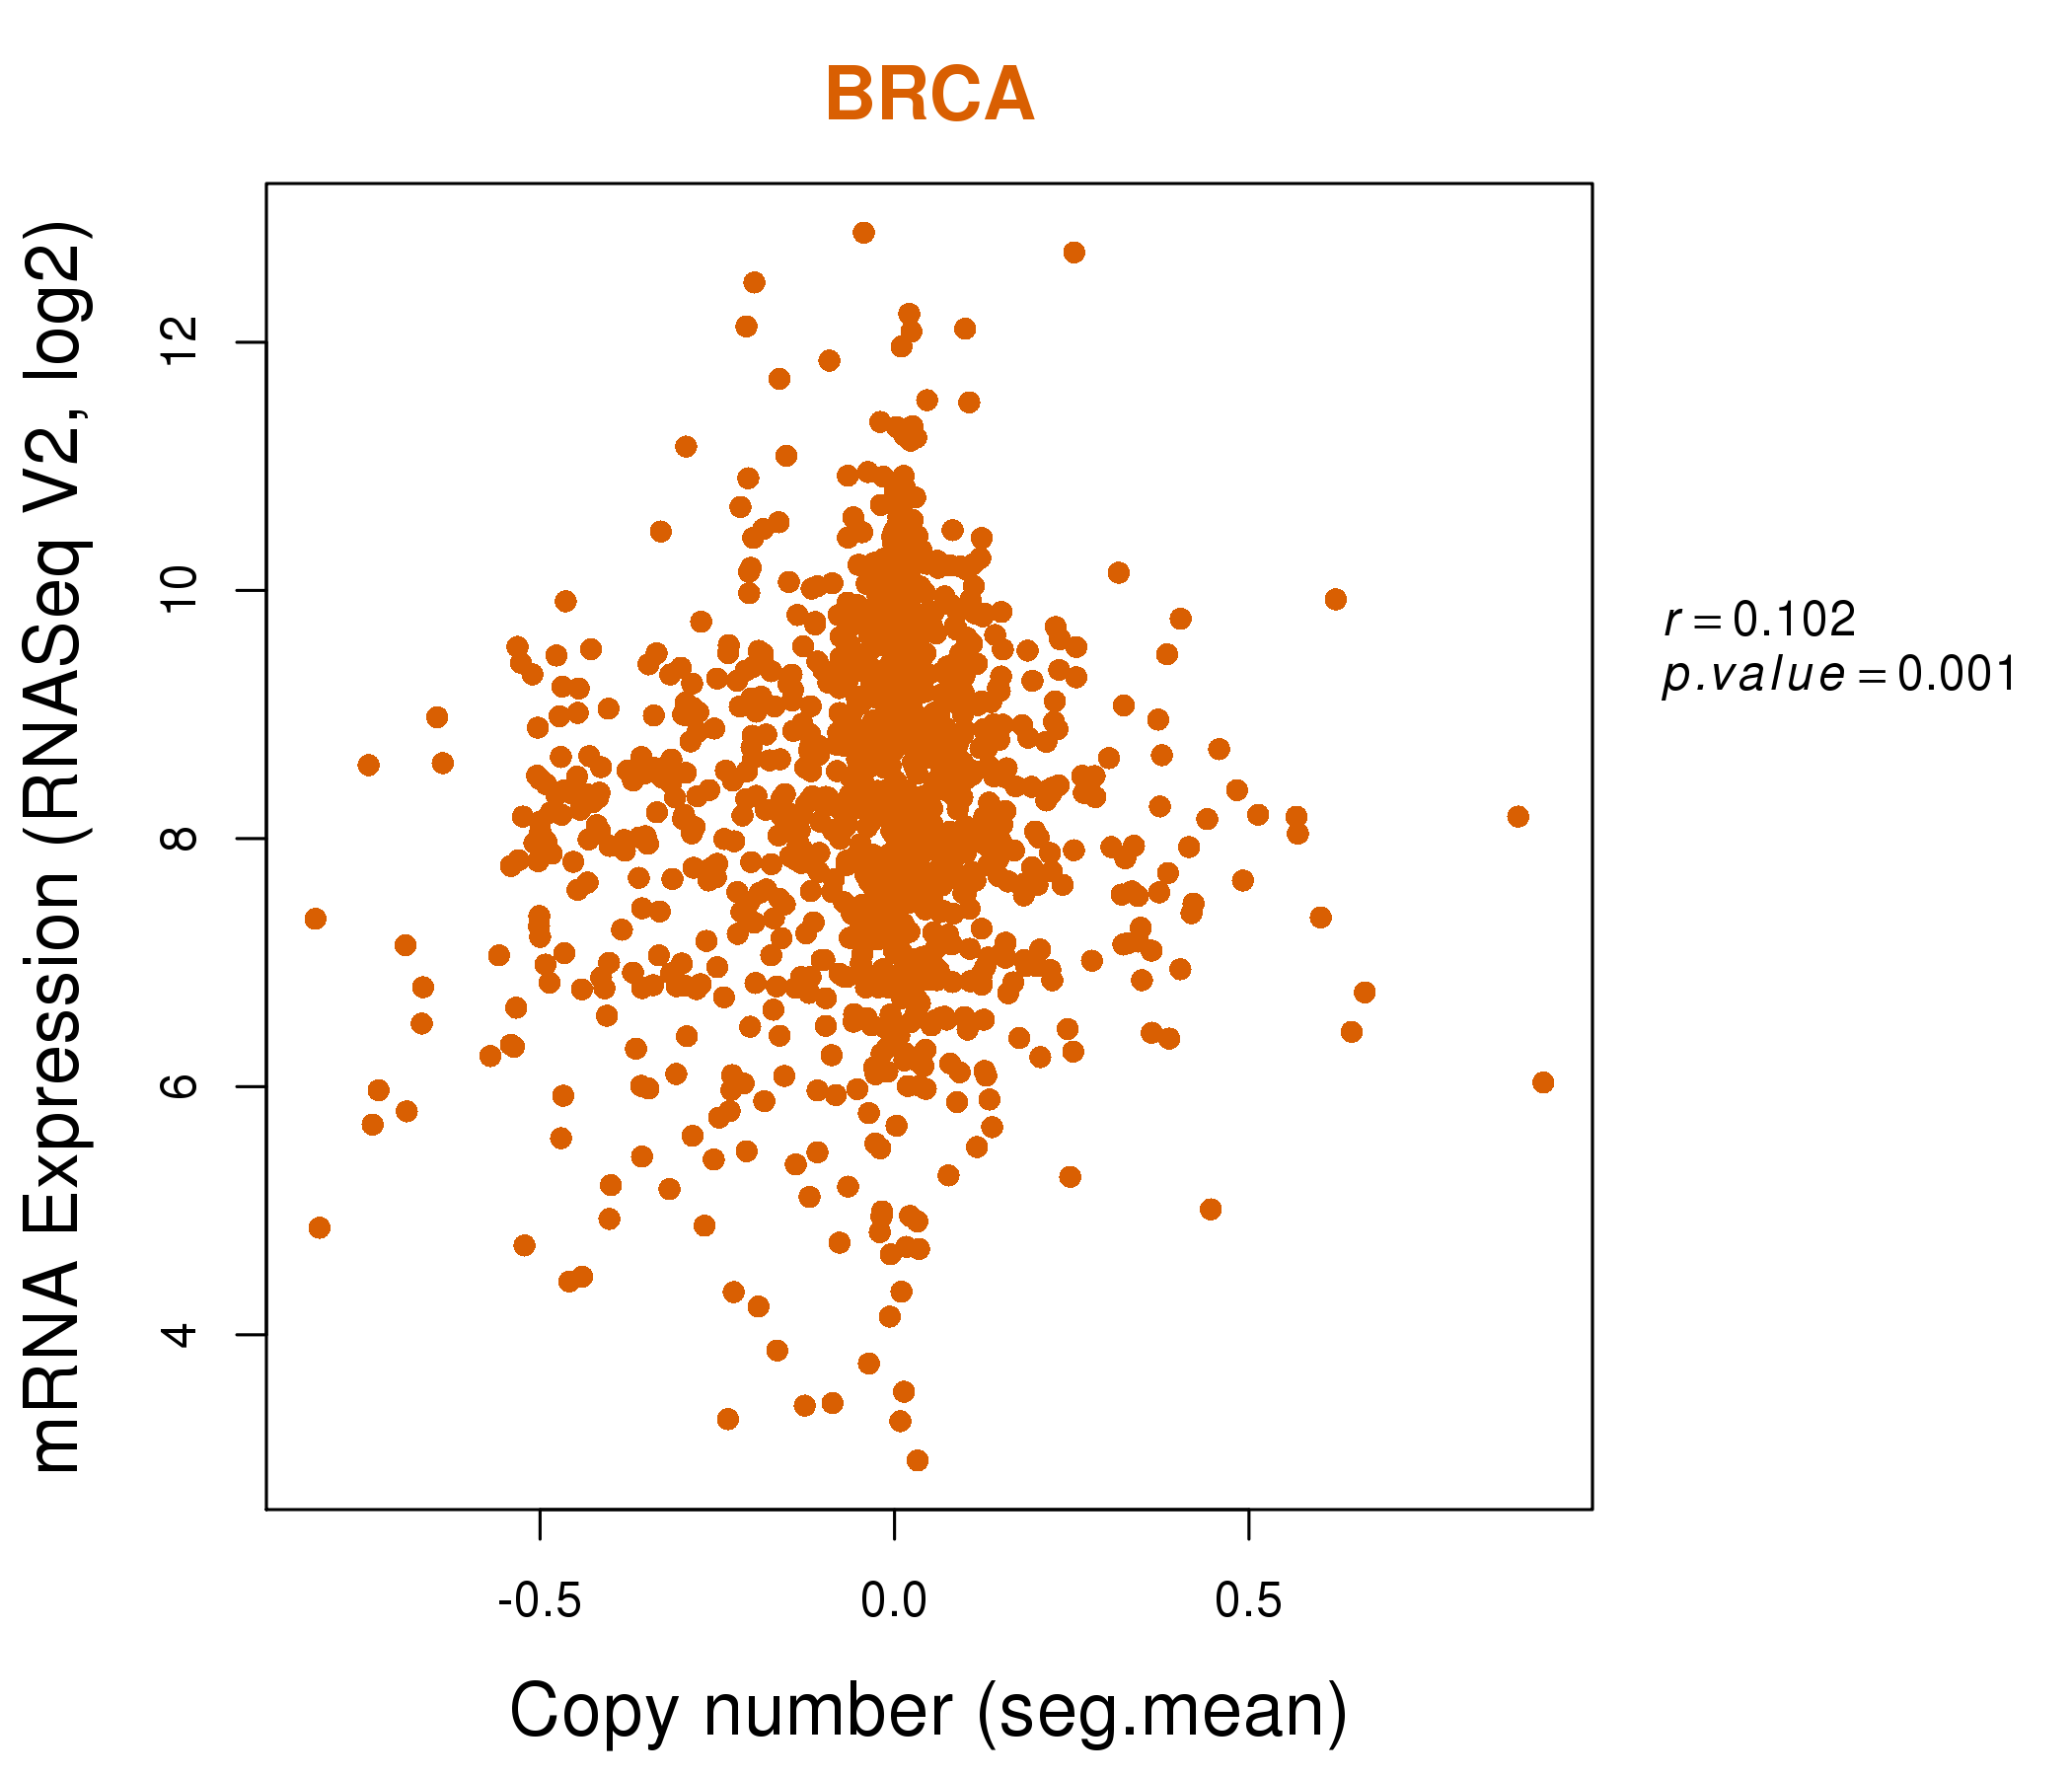
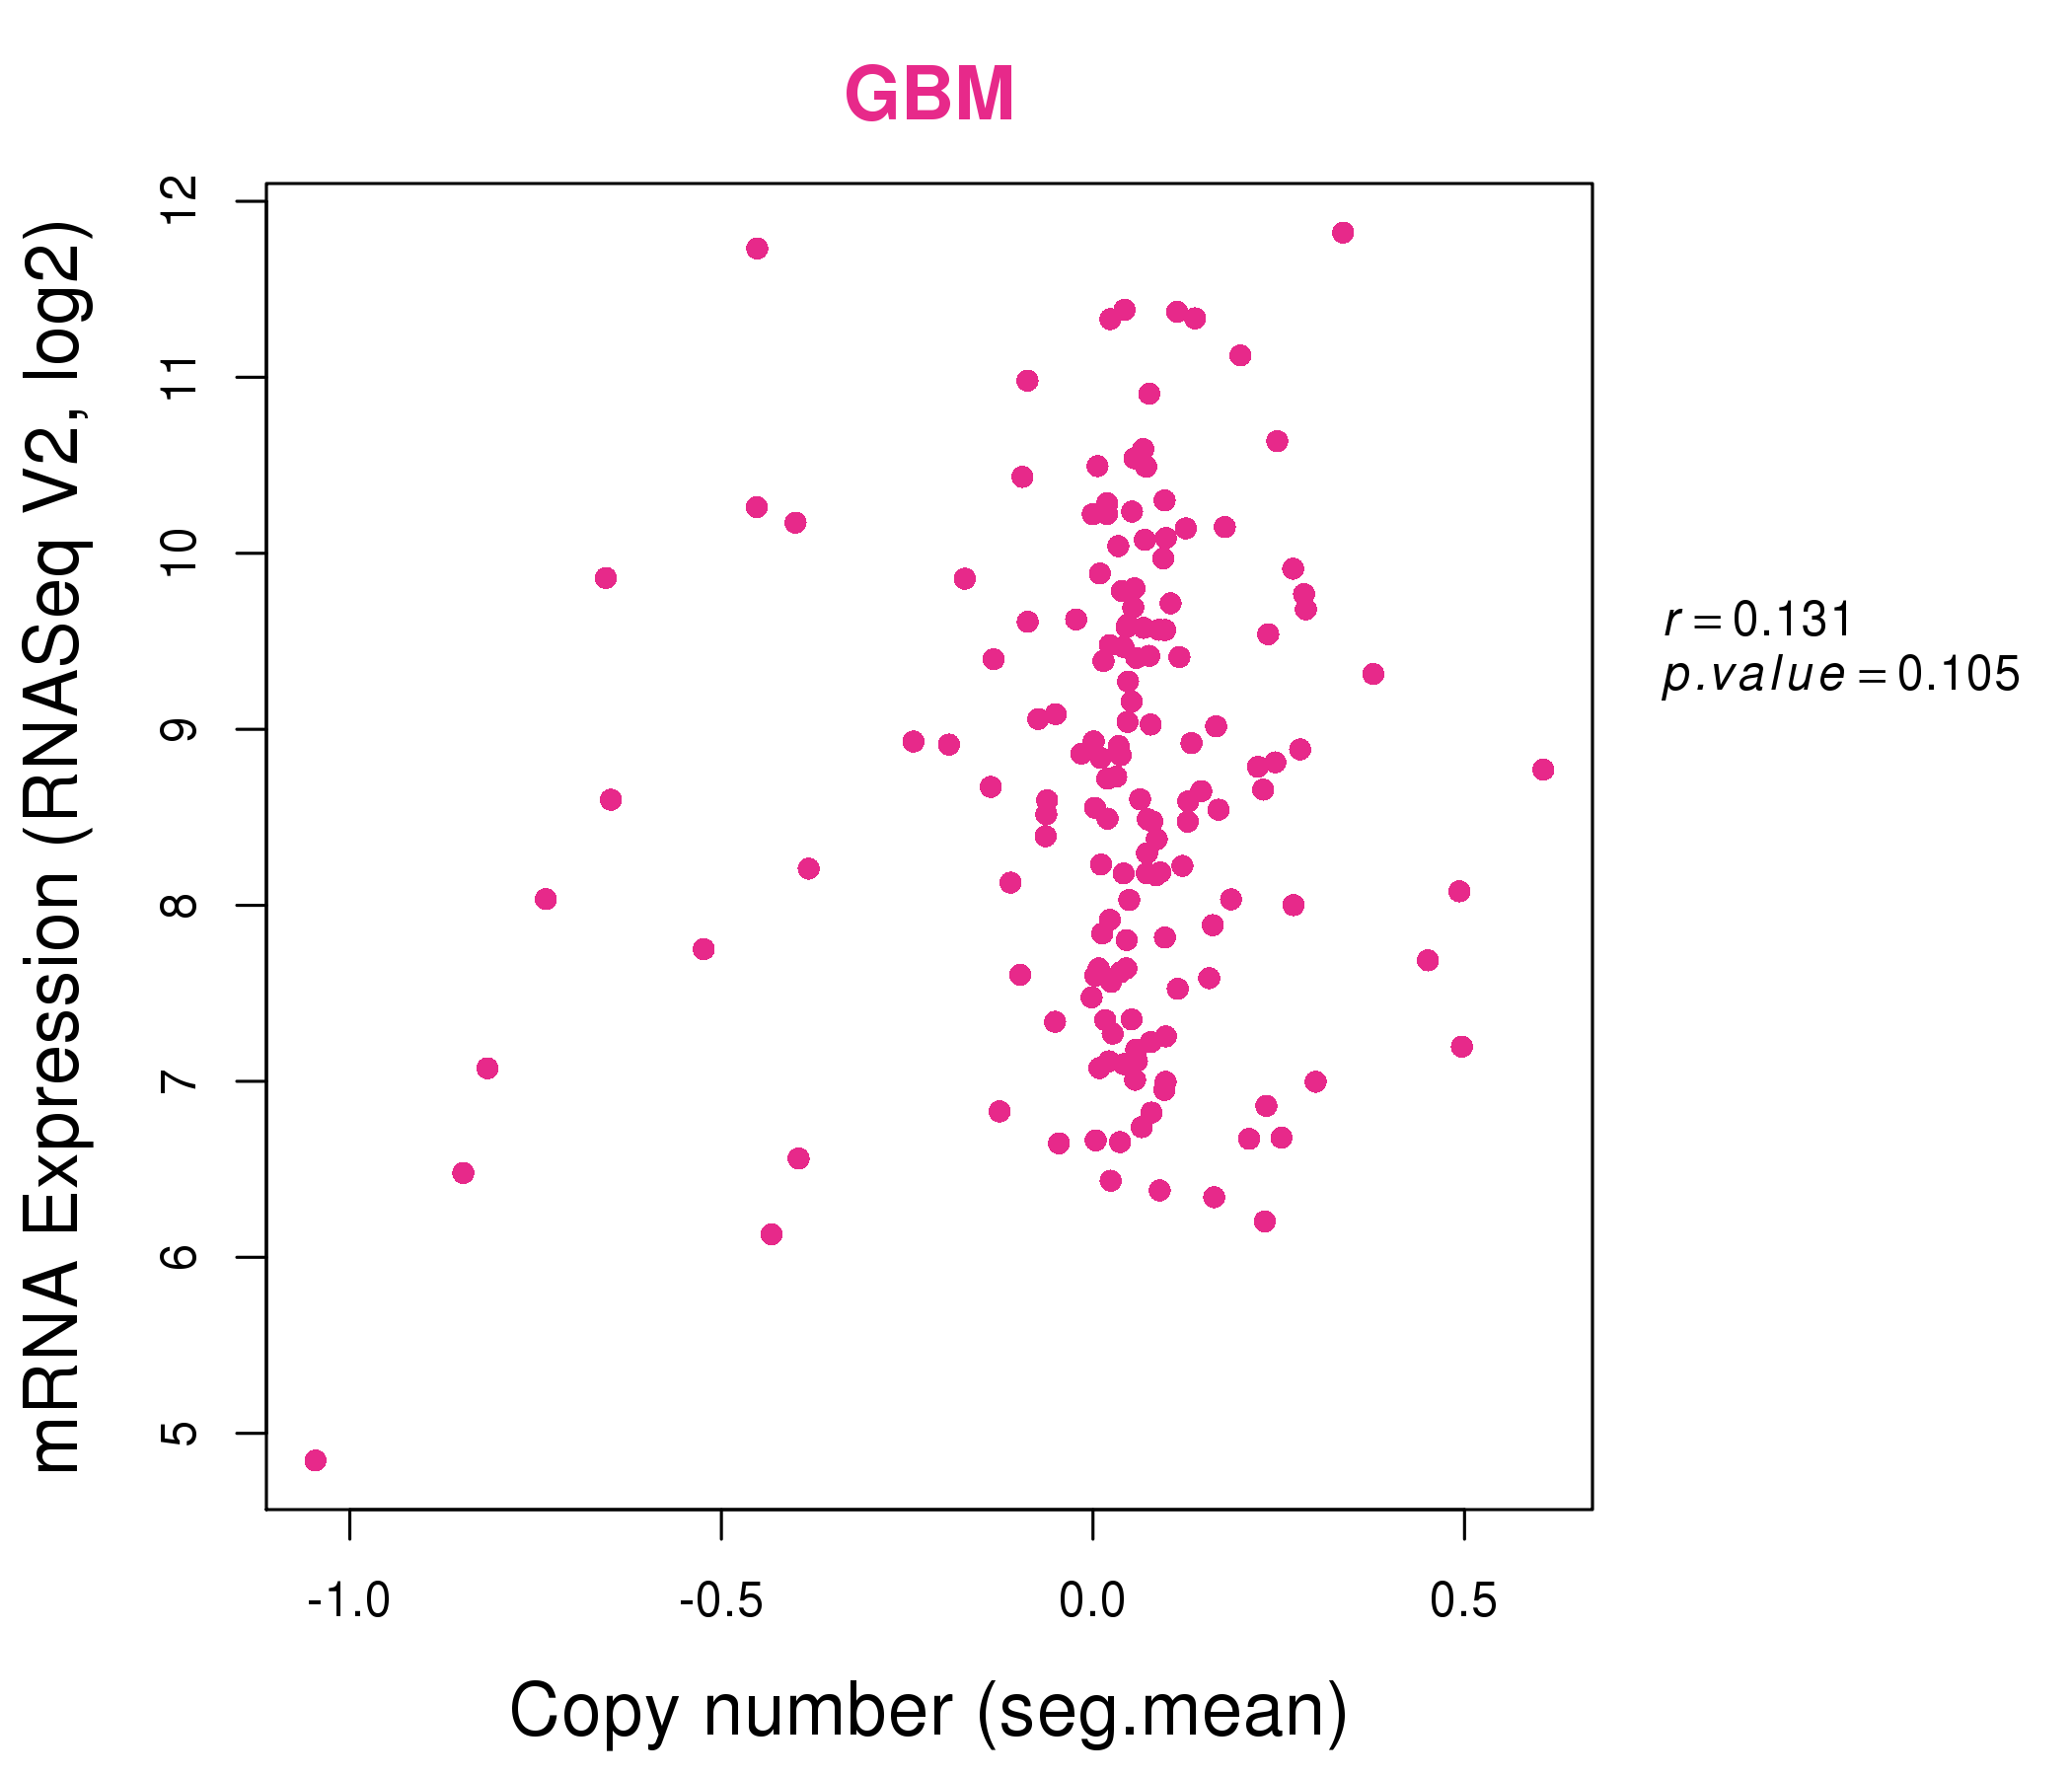
| * This plots show the correlation between CNV and gene expression. |
: Open all plots for all cancer types
 |
|
 |
|
| Top |
| Gene-Gene Network Information |
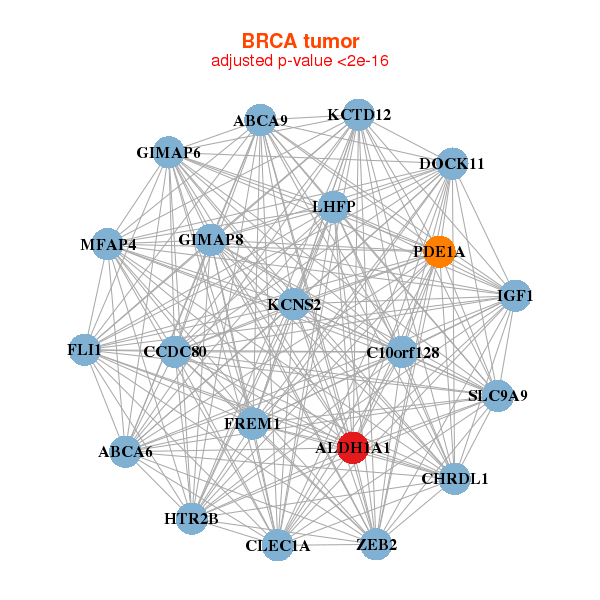
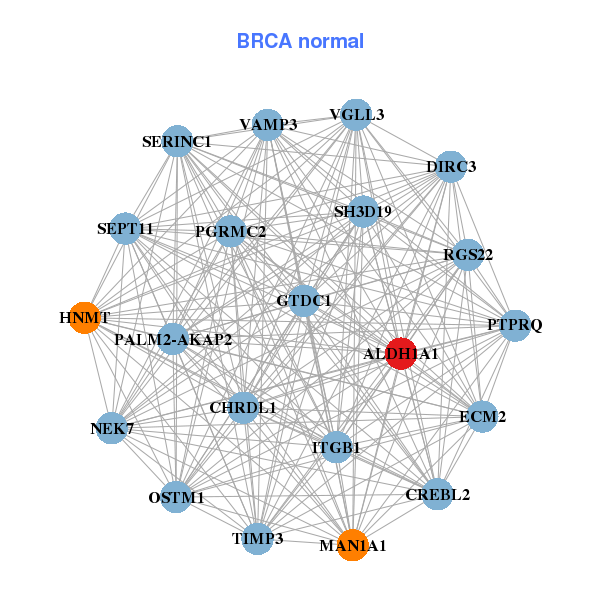
| * Co-Expression network figures were drawn using R package igraph. Only the top 20 genes with the highest correlations were shown. Red circle: input gene, orange circle: cell metabolism gene, sky circle: other gene |
: Open all plots for all cancer types
 |
| ||||
| ABCA6,ABCA9,ALDH1A1,C10orf128,CCDC80,CHRDL1,CLEC1A, DOCK11,FLI1,FREM1,GIMAP6,GIMAP8,HTR2B,IGF1, KCNS2,KCTD12,LHFP,MFAP4,PDE1A,SLC9A9,ZEB2 | ALDH1A1,CHRDL1,CREBL2,DIRC3,ECM2,GTDC1,HNMT, ITGB1,MAN1A1,NEK7,OSTM1,PALM2-AKAP2,PGRMC2,PTPRQ, RGS22,SEPT11,SERINC1,SH3D19,TIMP3,VAMP3,VGLL3 | ||||
 |
| ||||
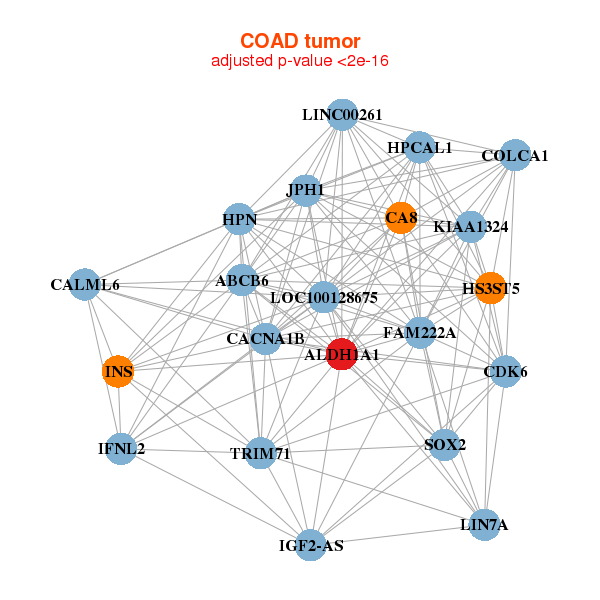
| ABCB6,ALDH1A1,COLCA1,FAM222A,LINC00261,CA8,CACNA1B, CALML6,CDK6,HPCAL1,HPN,HS3ST5,IGF2-AS,IFNL2, INS,JPH1,KIAA1324,LIN7A,LOC100128675,SOX2,TRIM71 | ALDH1A1,ANO6,AQP1,C4orf3,CYP2U1,FAM172A,GRIK2, IMMP2L,ISCU,KCTD3,LMO4,PFN2,CPQ,PLA2G4C, SEC22C,STK33,TMEM64,VKORC1,WRB,ZNF16,ZNF639 |
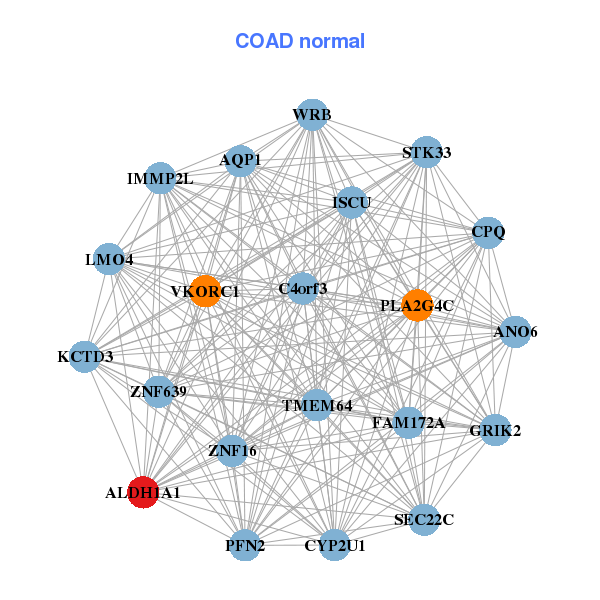
| * Co-Expression network figures were drawn using R package igraph. Only the top 20 genes with the highest correlations were shown. Red circle: input gene, orange circle: cell metabolism gene, sky circle: other gene |
: Open all plots for all cancer types
| Top |
: Open all interacting genes' information including KEGG pathway for all interacting genes from DAVID
| Top |
| Pharmacological Information for ALDH1A1 |
| DB Category | DB Name | DB's ID and Url link |
| * Gene Centered Interaction Network. |
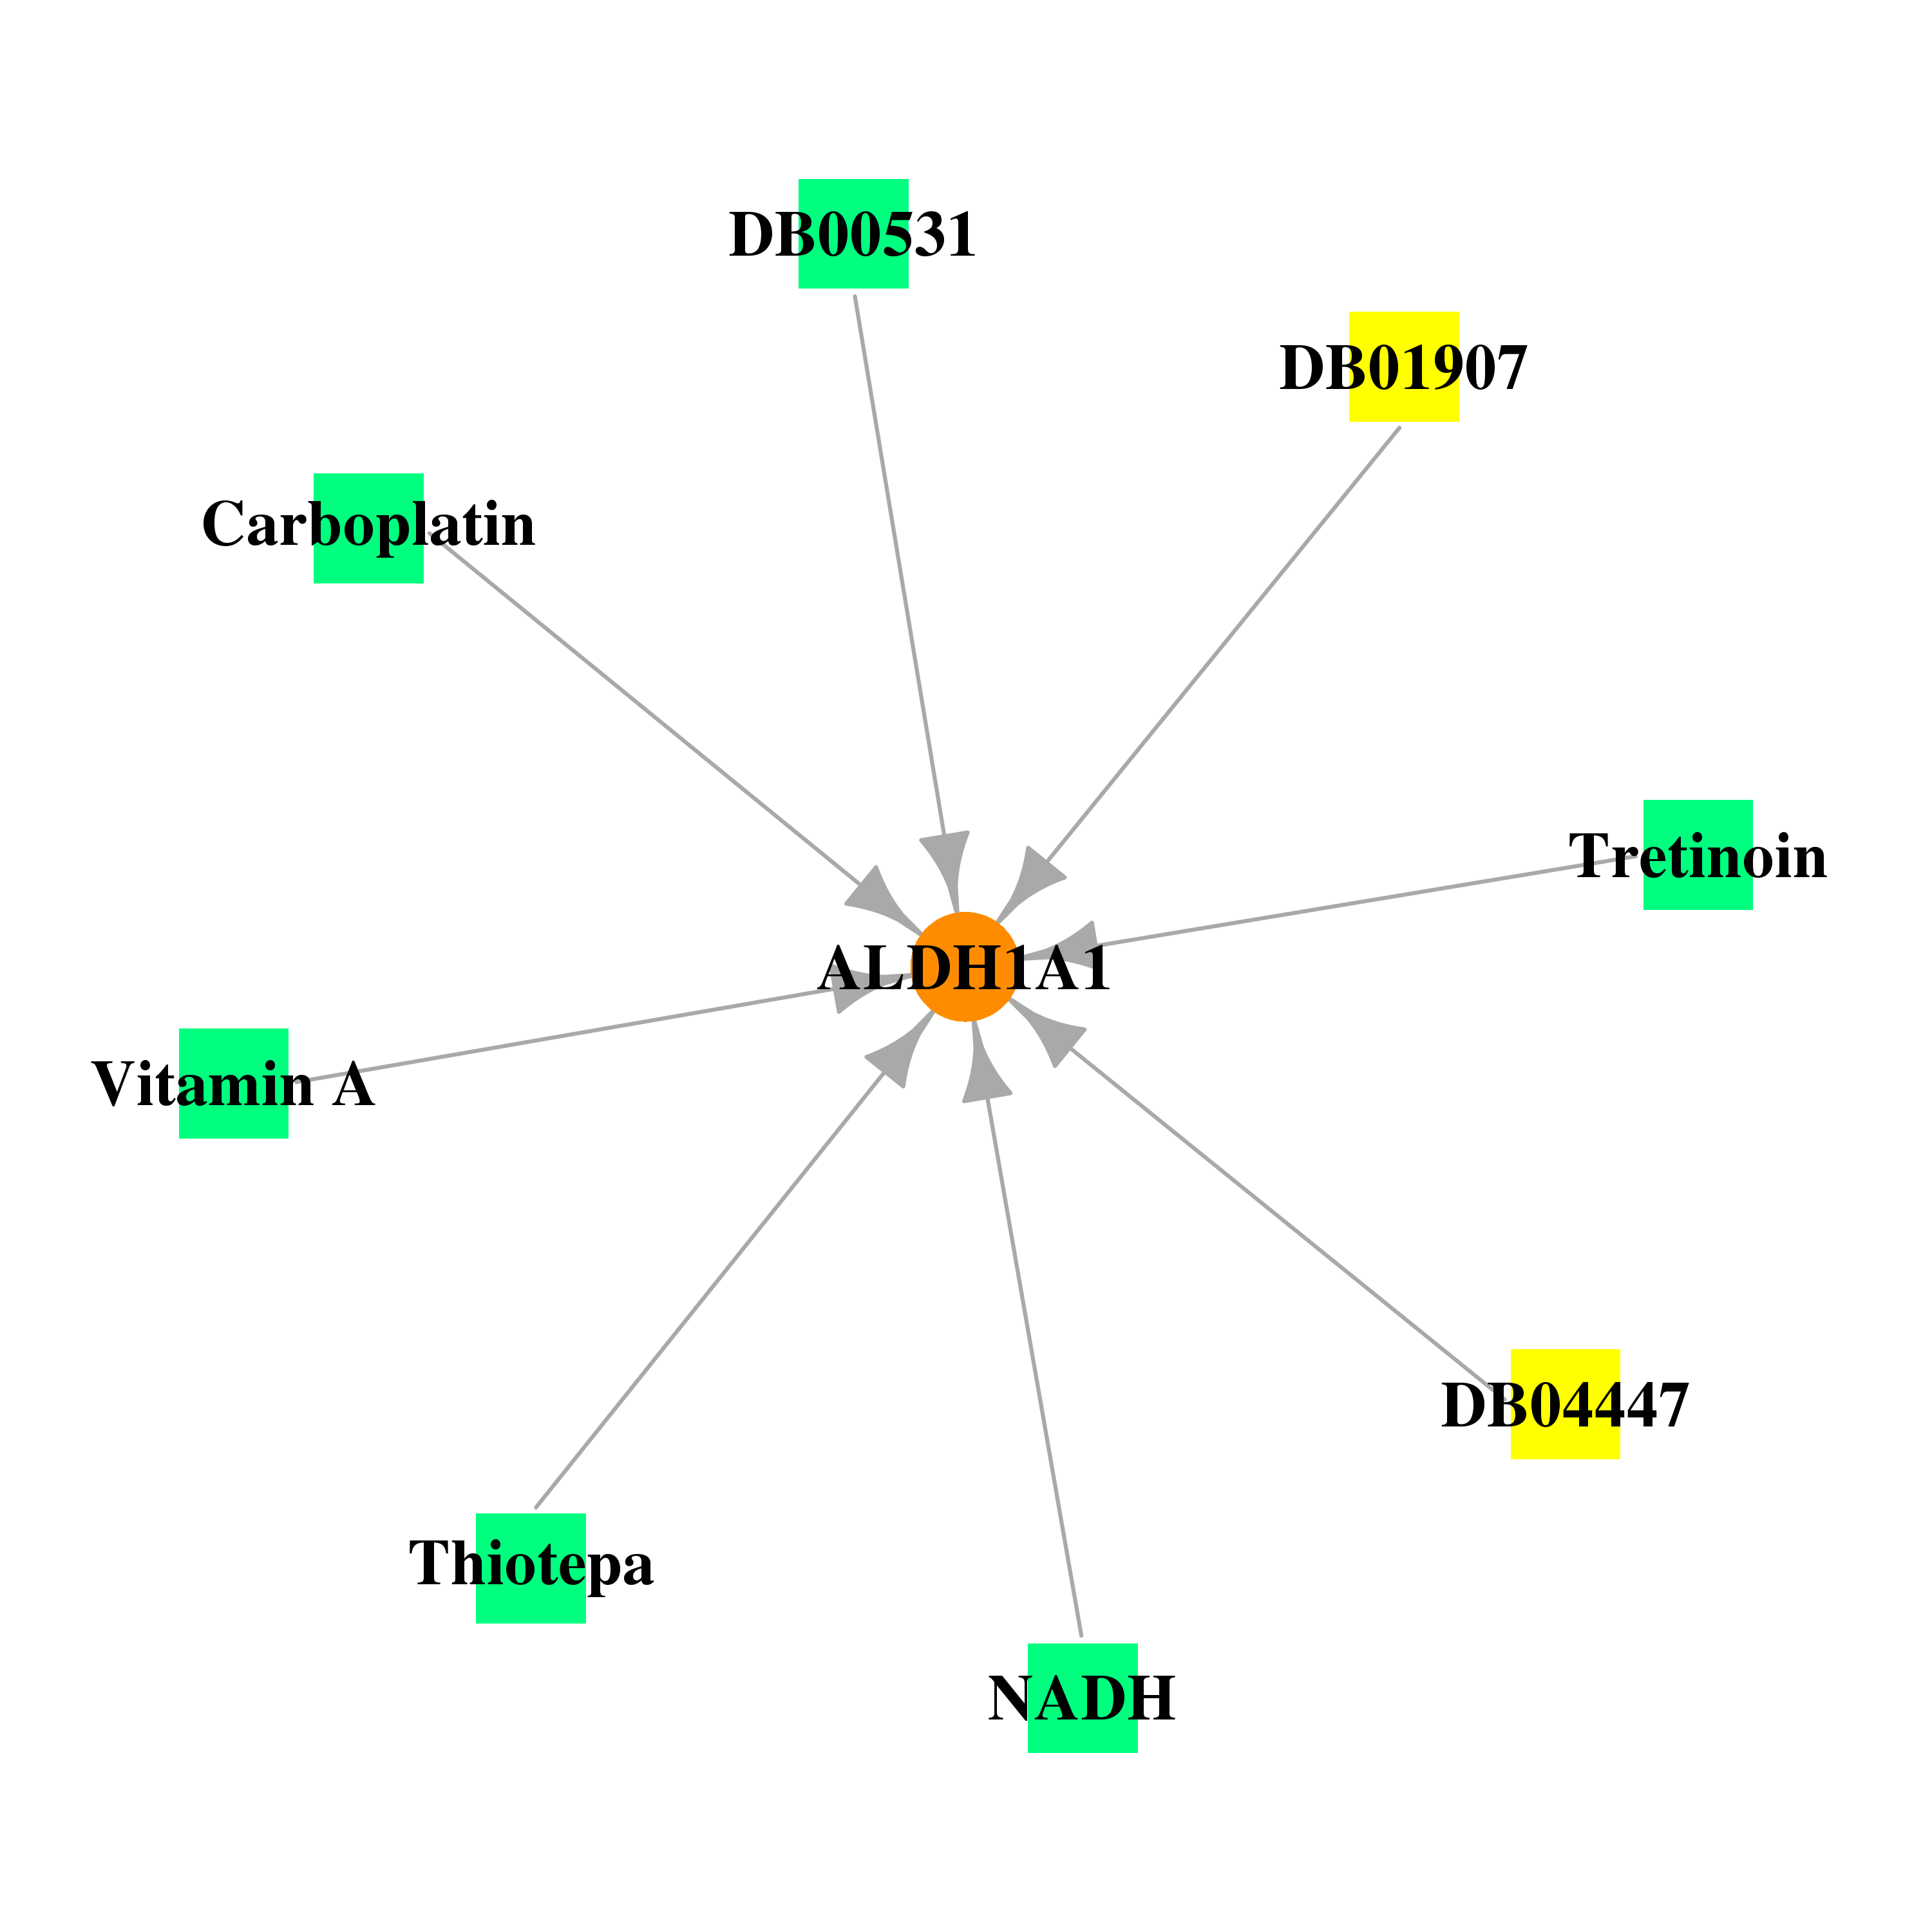 |
| * Drug Centered Interaction Network. |
| DrugBank ID | Target Name | Drug Groups | Generic Name | Drug Centered Network | Drug Structure |
| DB00157 | aldehyde dehydrogenase 1 family, member A1 | approved; nutraceutical | NADH |  |  |
| DB00162 | aldehyde dehydrogenase 1 family, member A1 | approved; nutraceutical | Vitamin A | 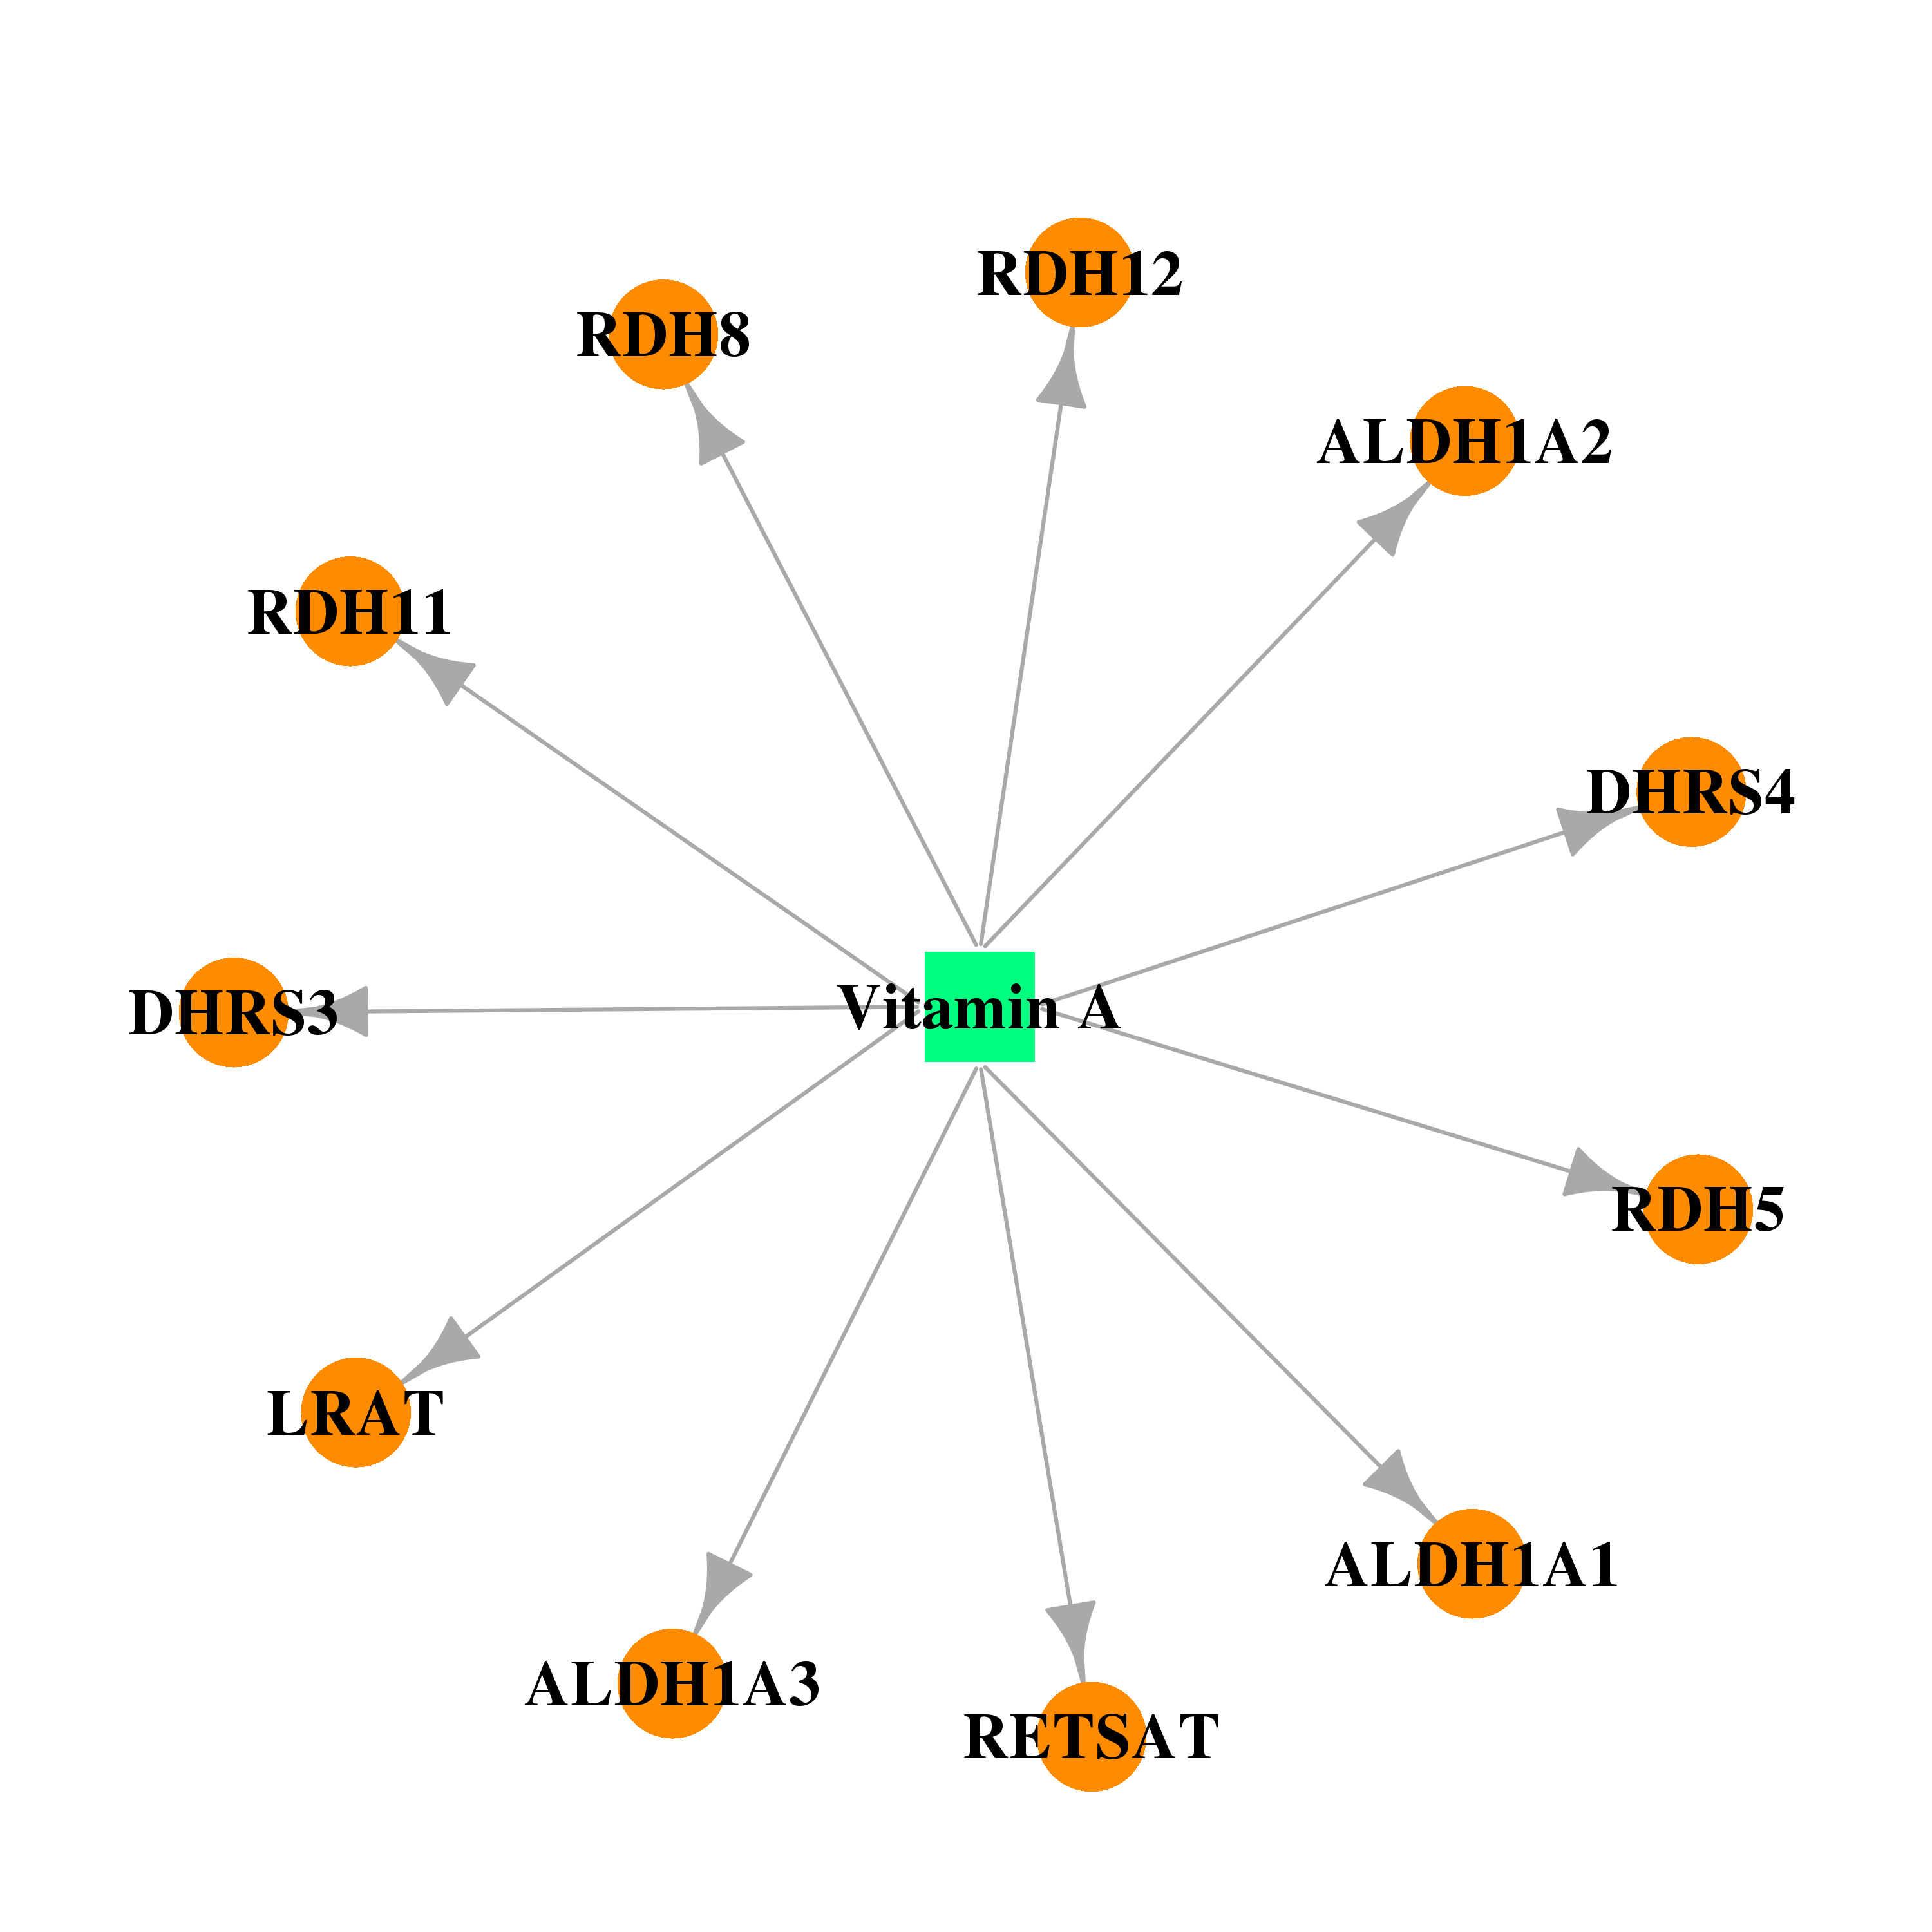 |  |
| DB00755 | aldehyde dehydrogenase 1 family, member A1 | approved; nutraceutical; investigational | Tretinoin | 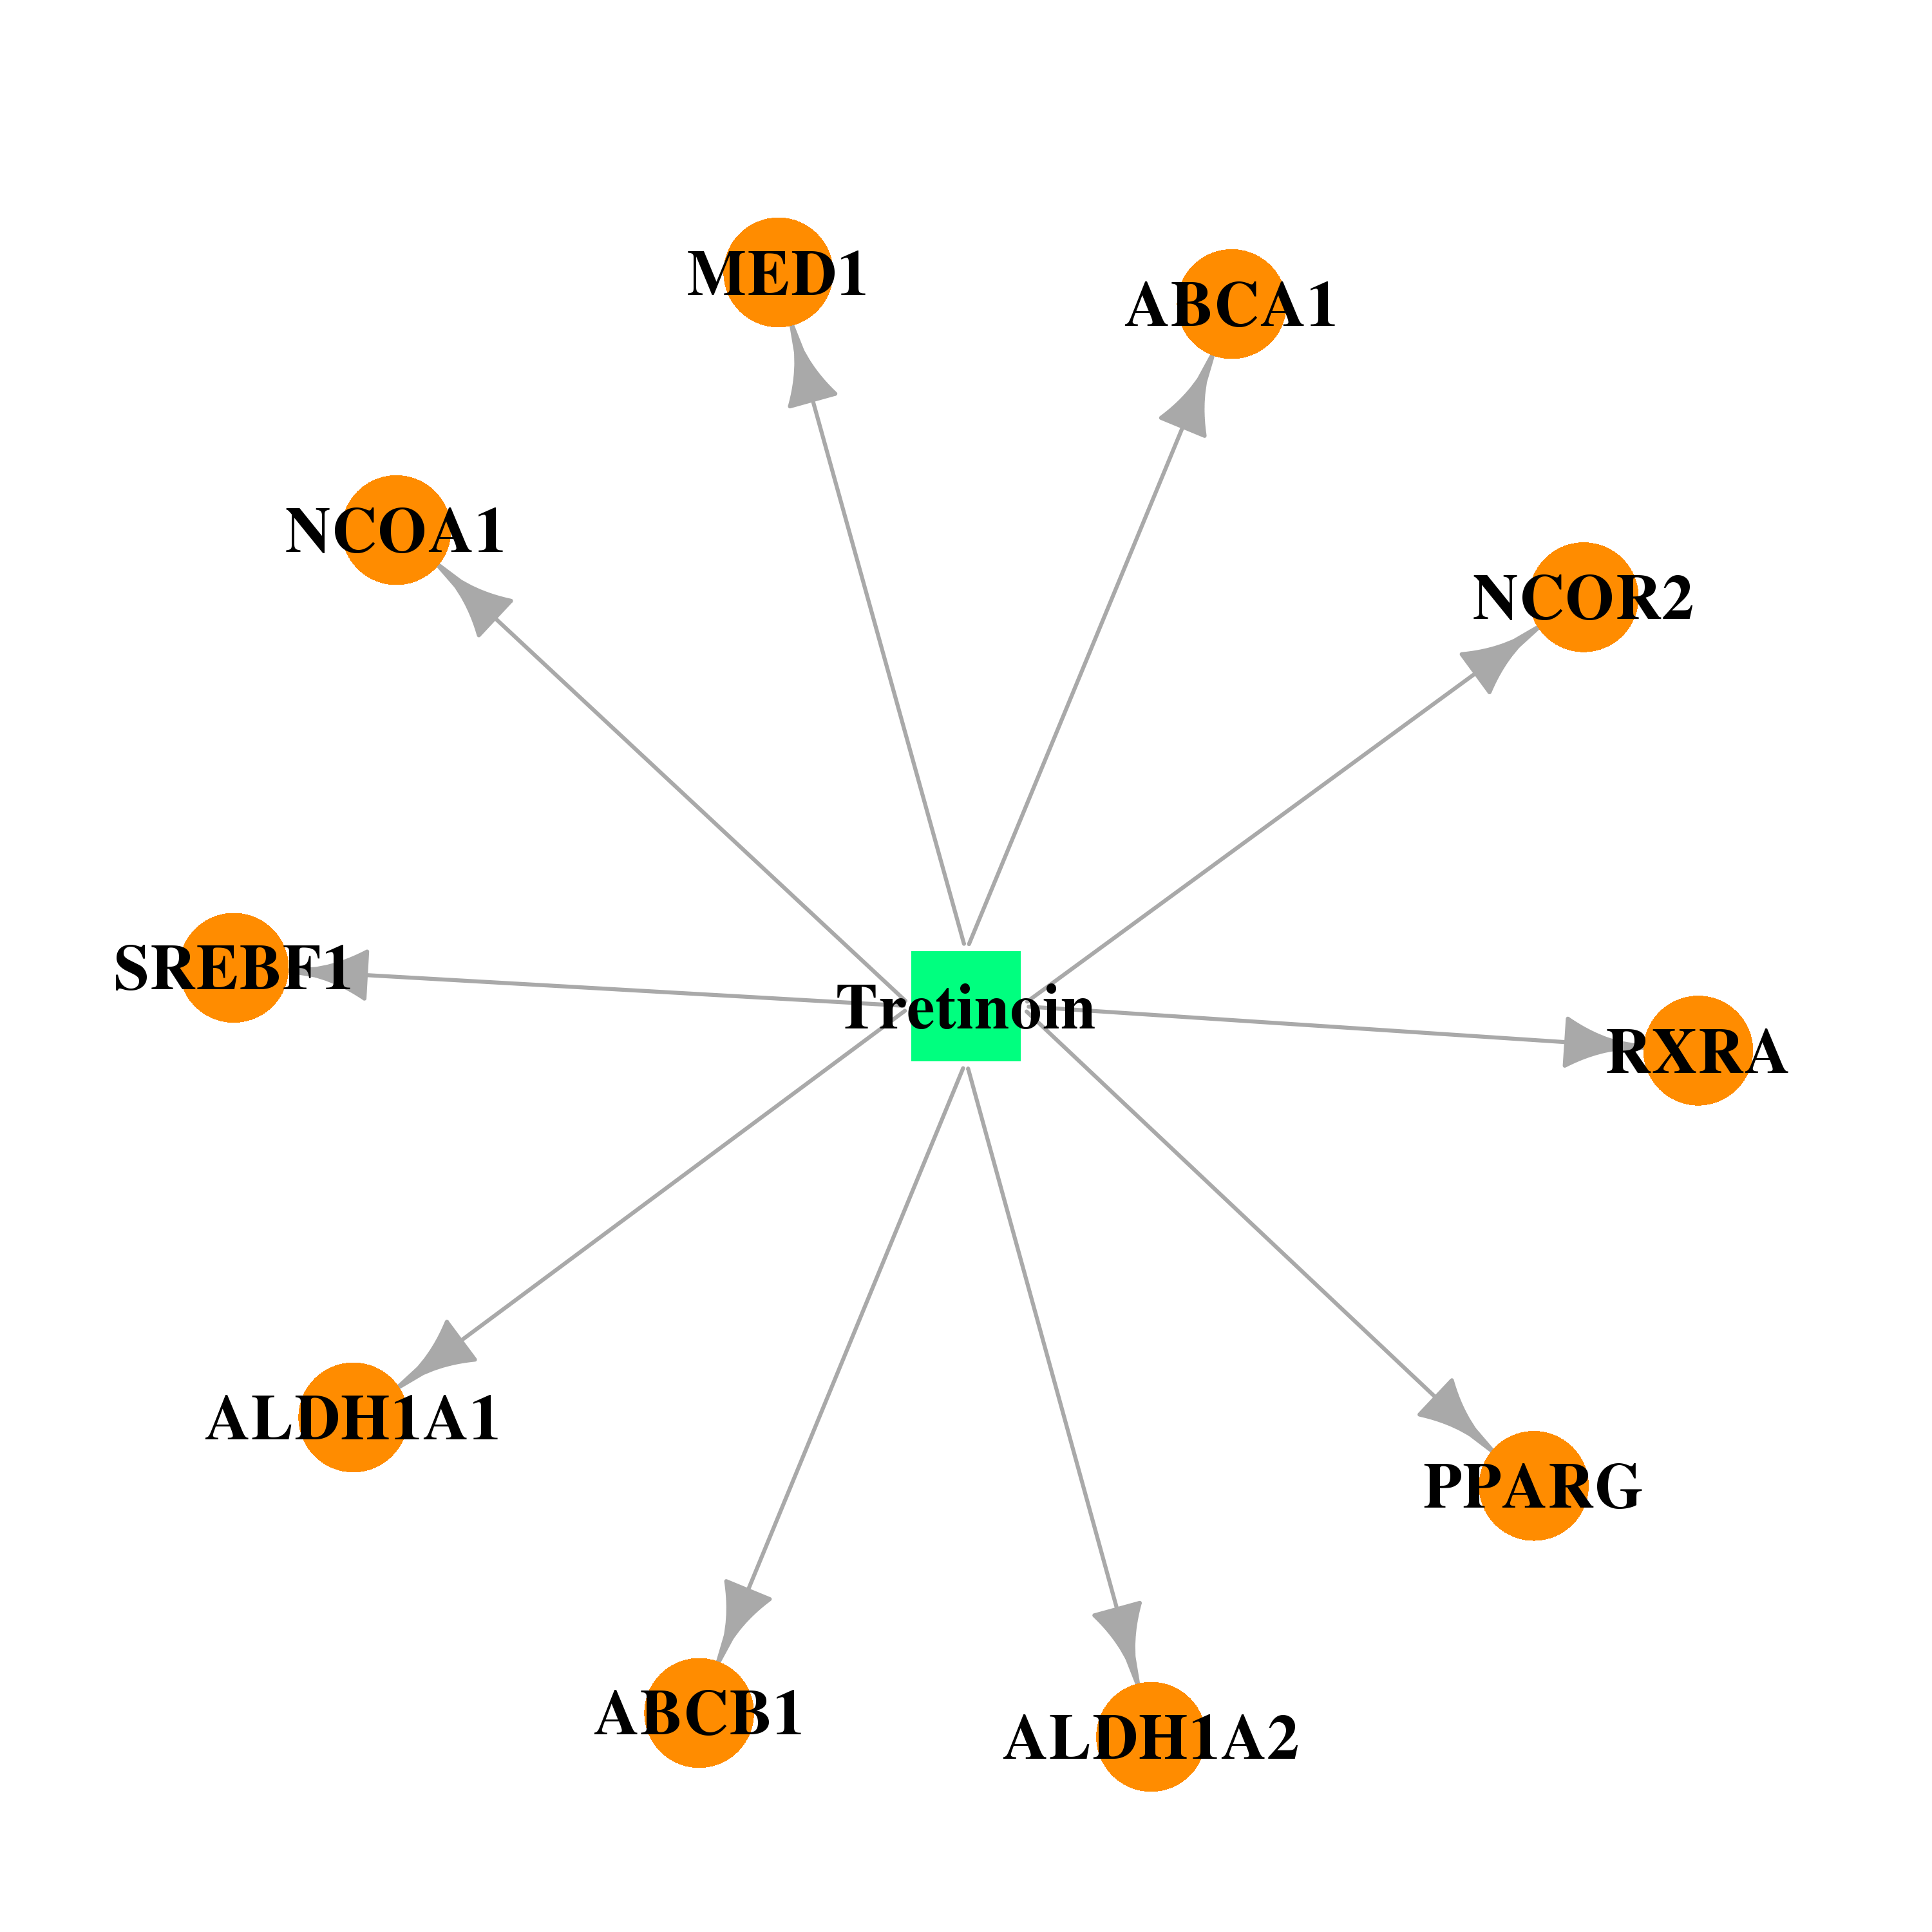 |  |
| DB01907 | aldehyde dehydrogenase 1 family, member A1 | experimental | Nicotinamide-Adenine-Dinucleotide | 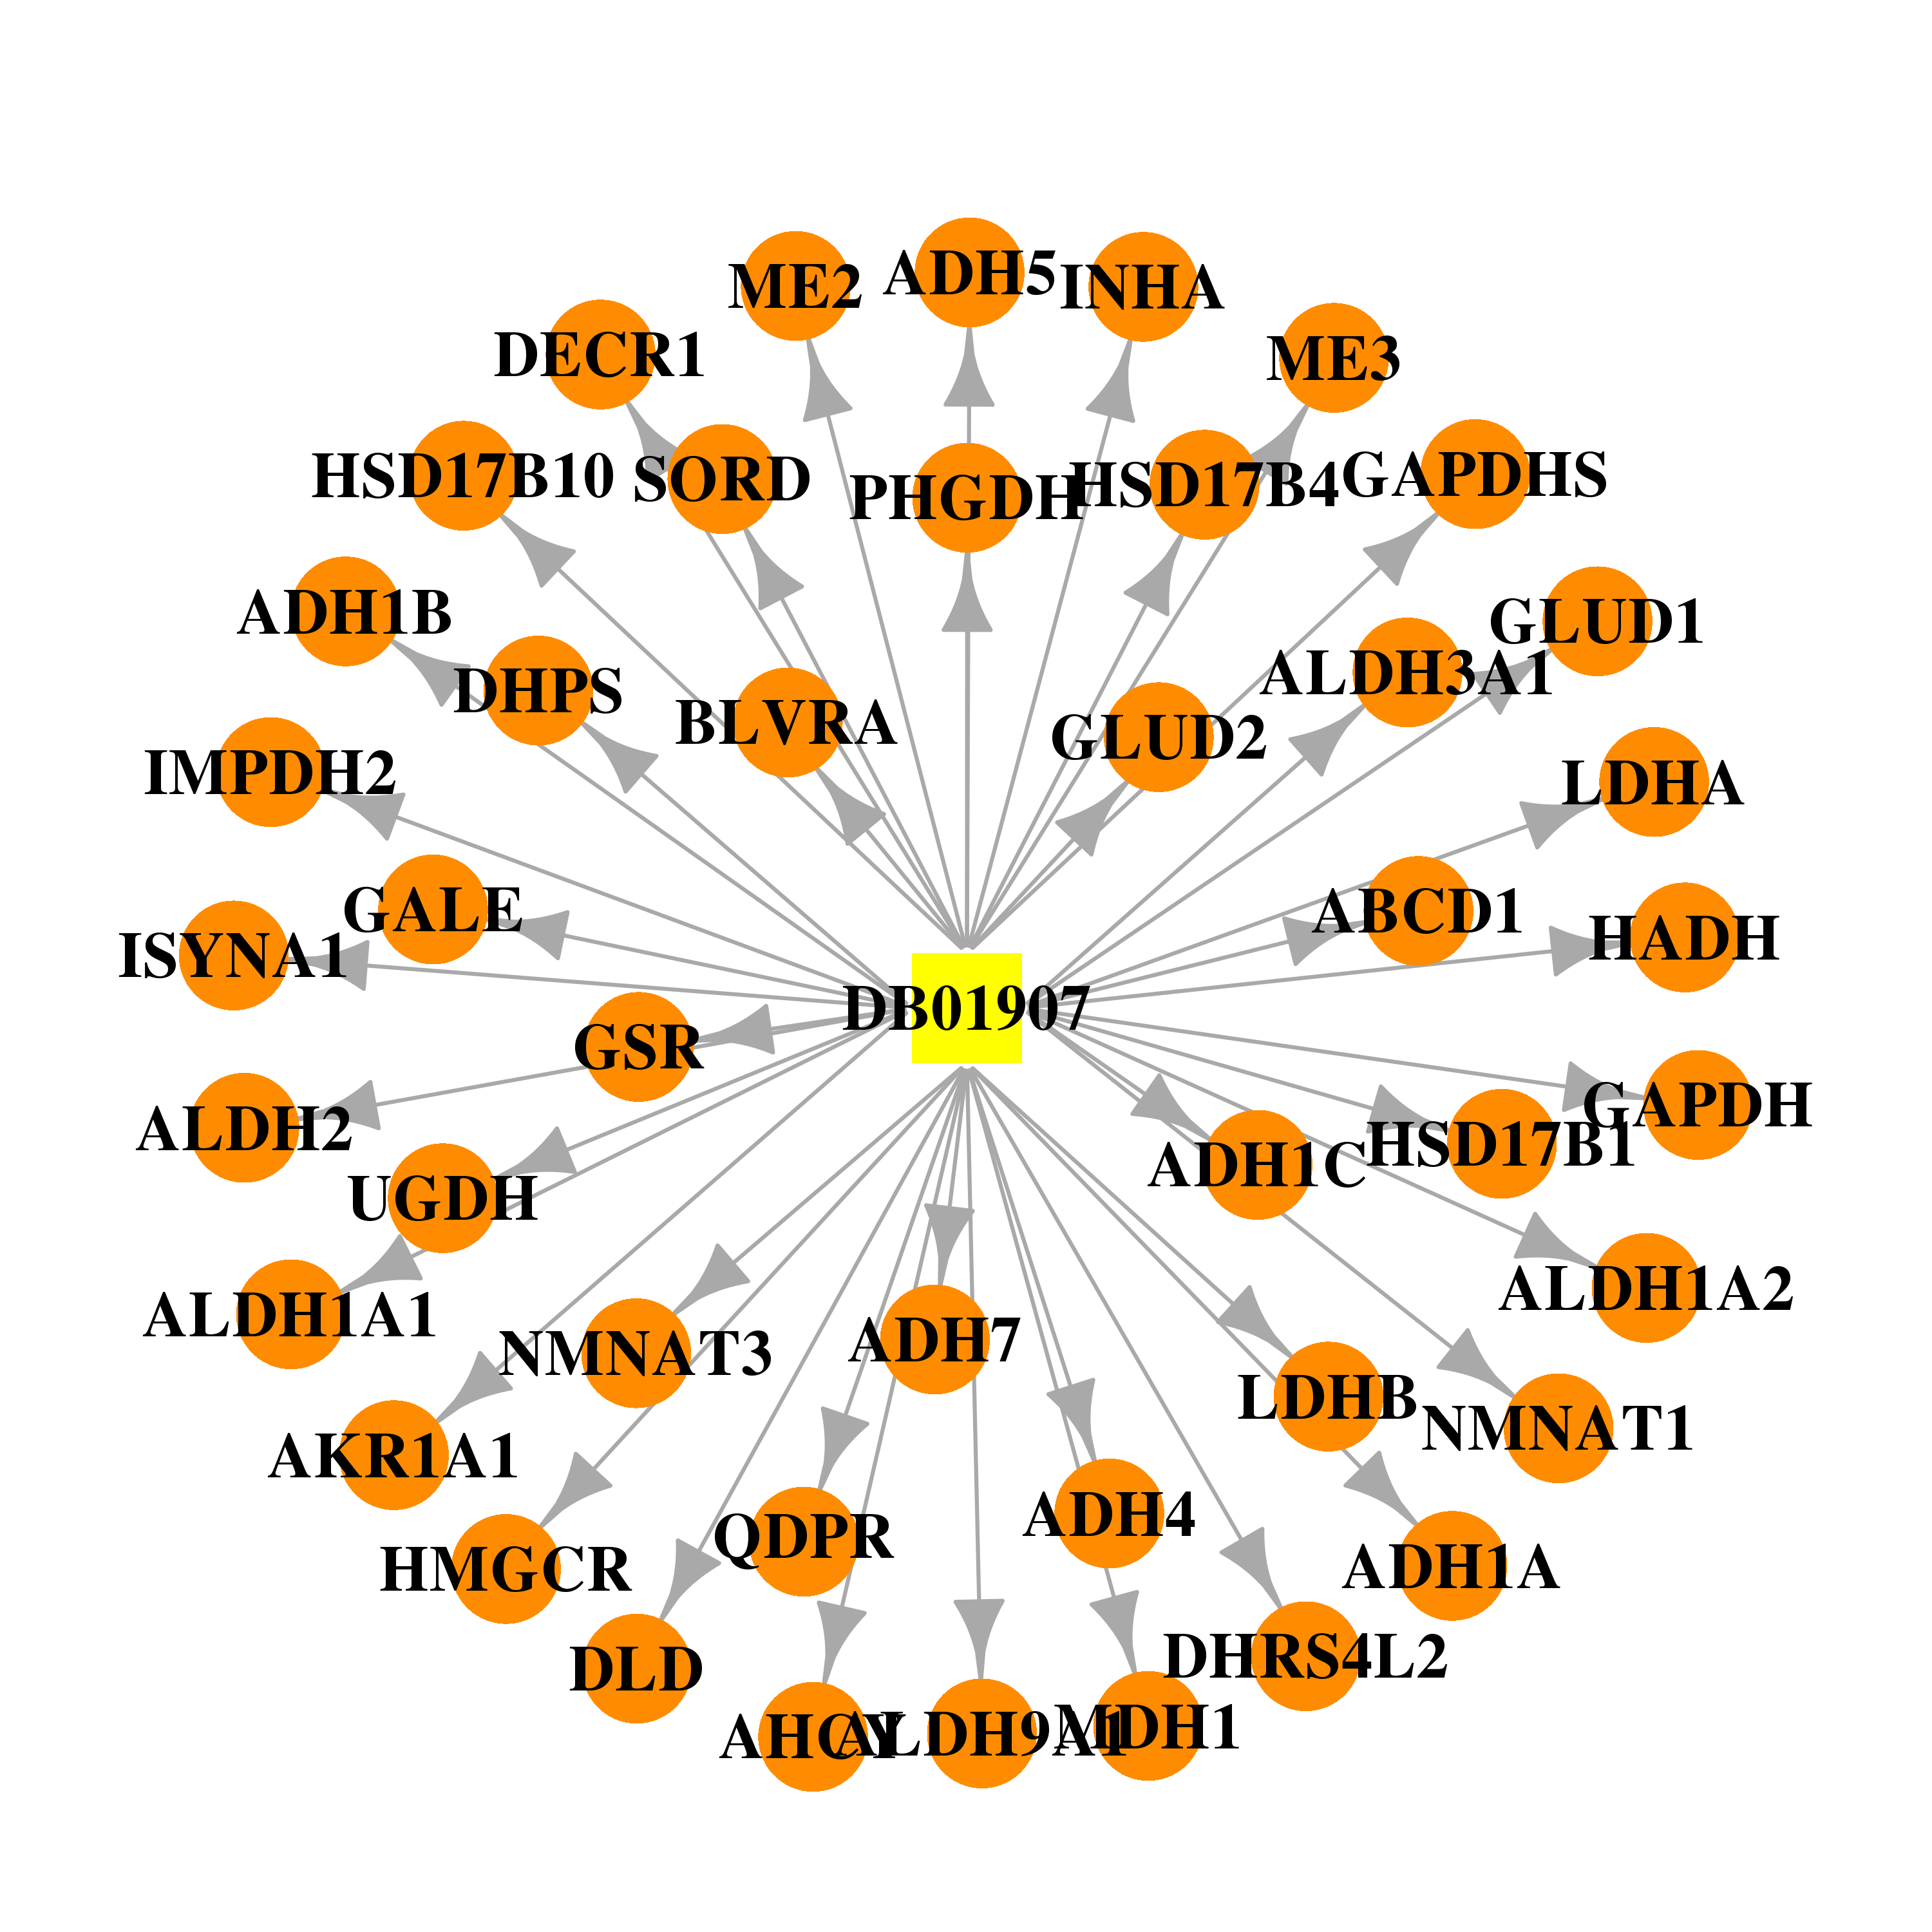 | 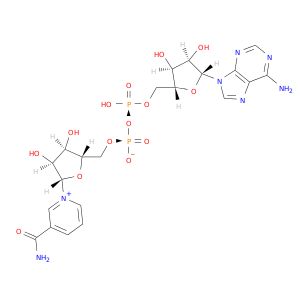 |
| DB04447 | aldehyde dehydrogenase 1 family, member A1 | experimental | 1,4-Dithiothreitol | 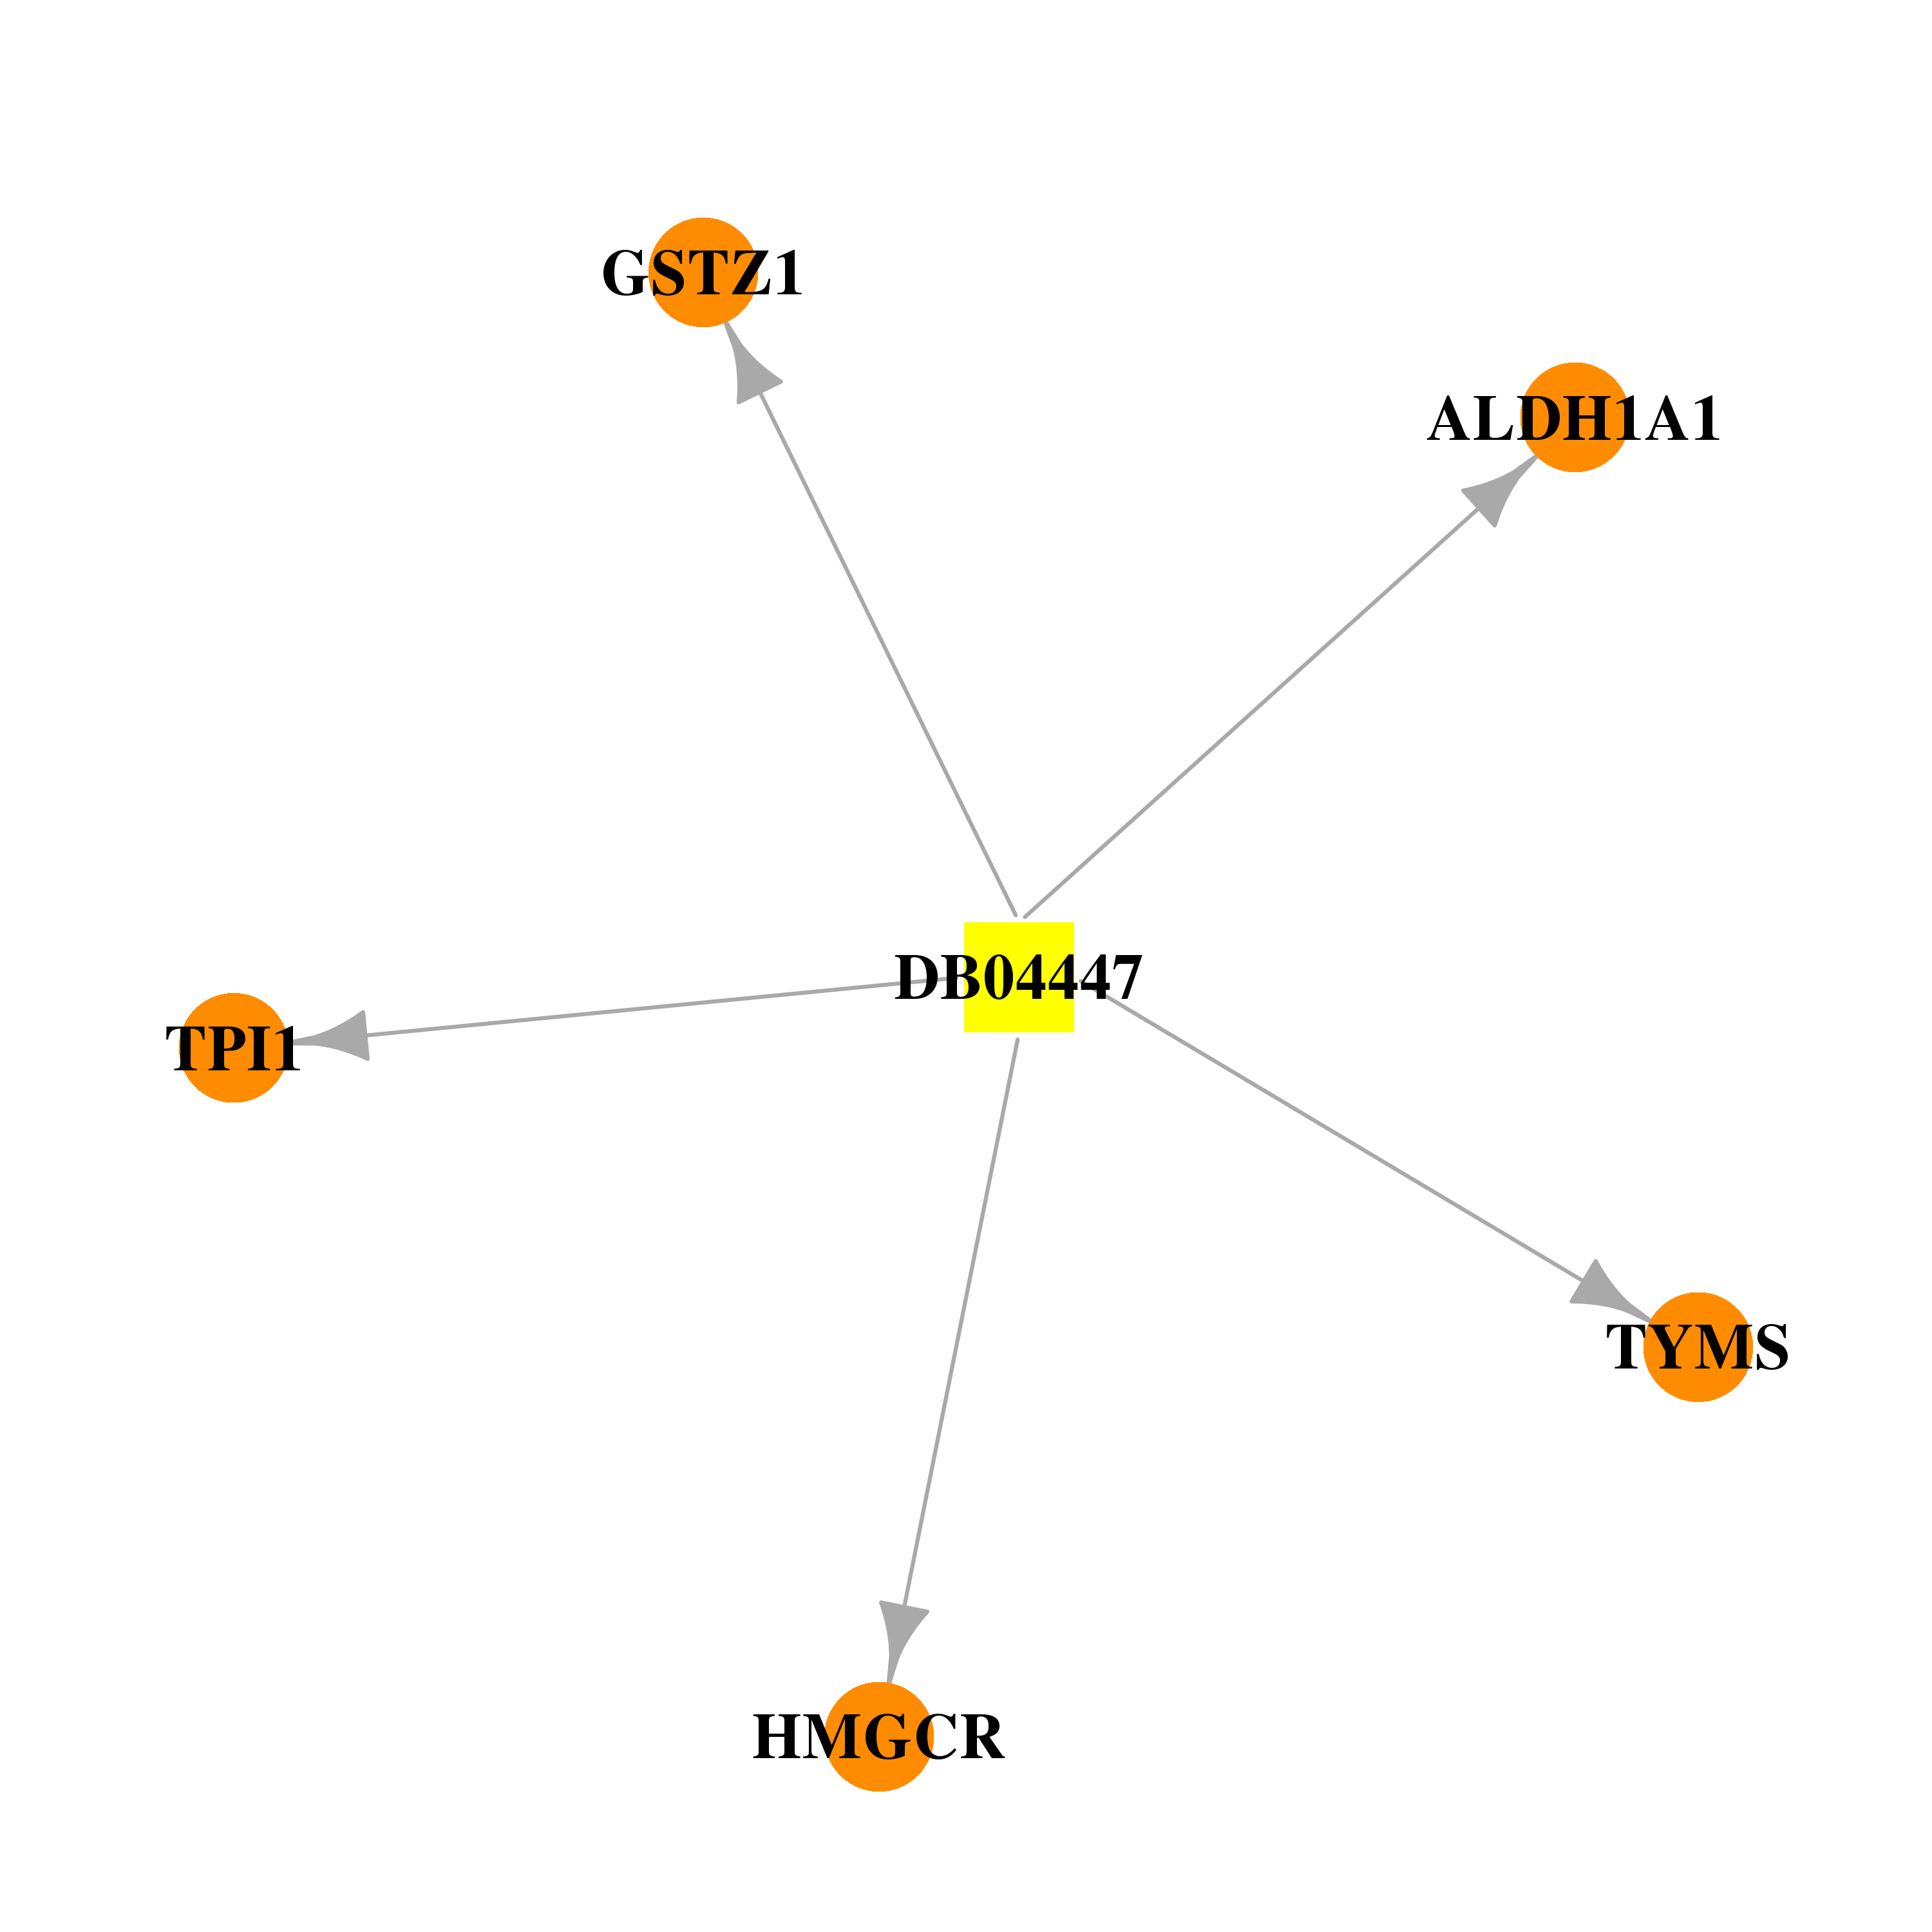 | 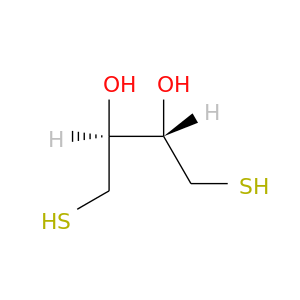 |
| DB00958 | aldehyde dehydrogenase 1 family, member A1 | approved | Carboplatin | 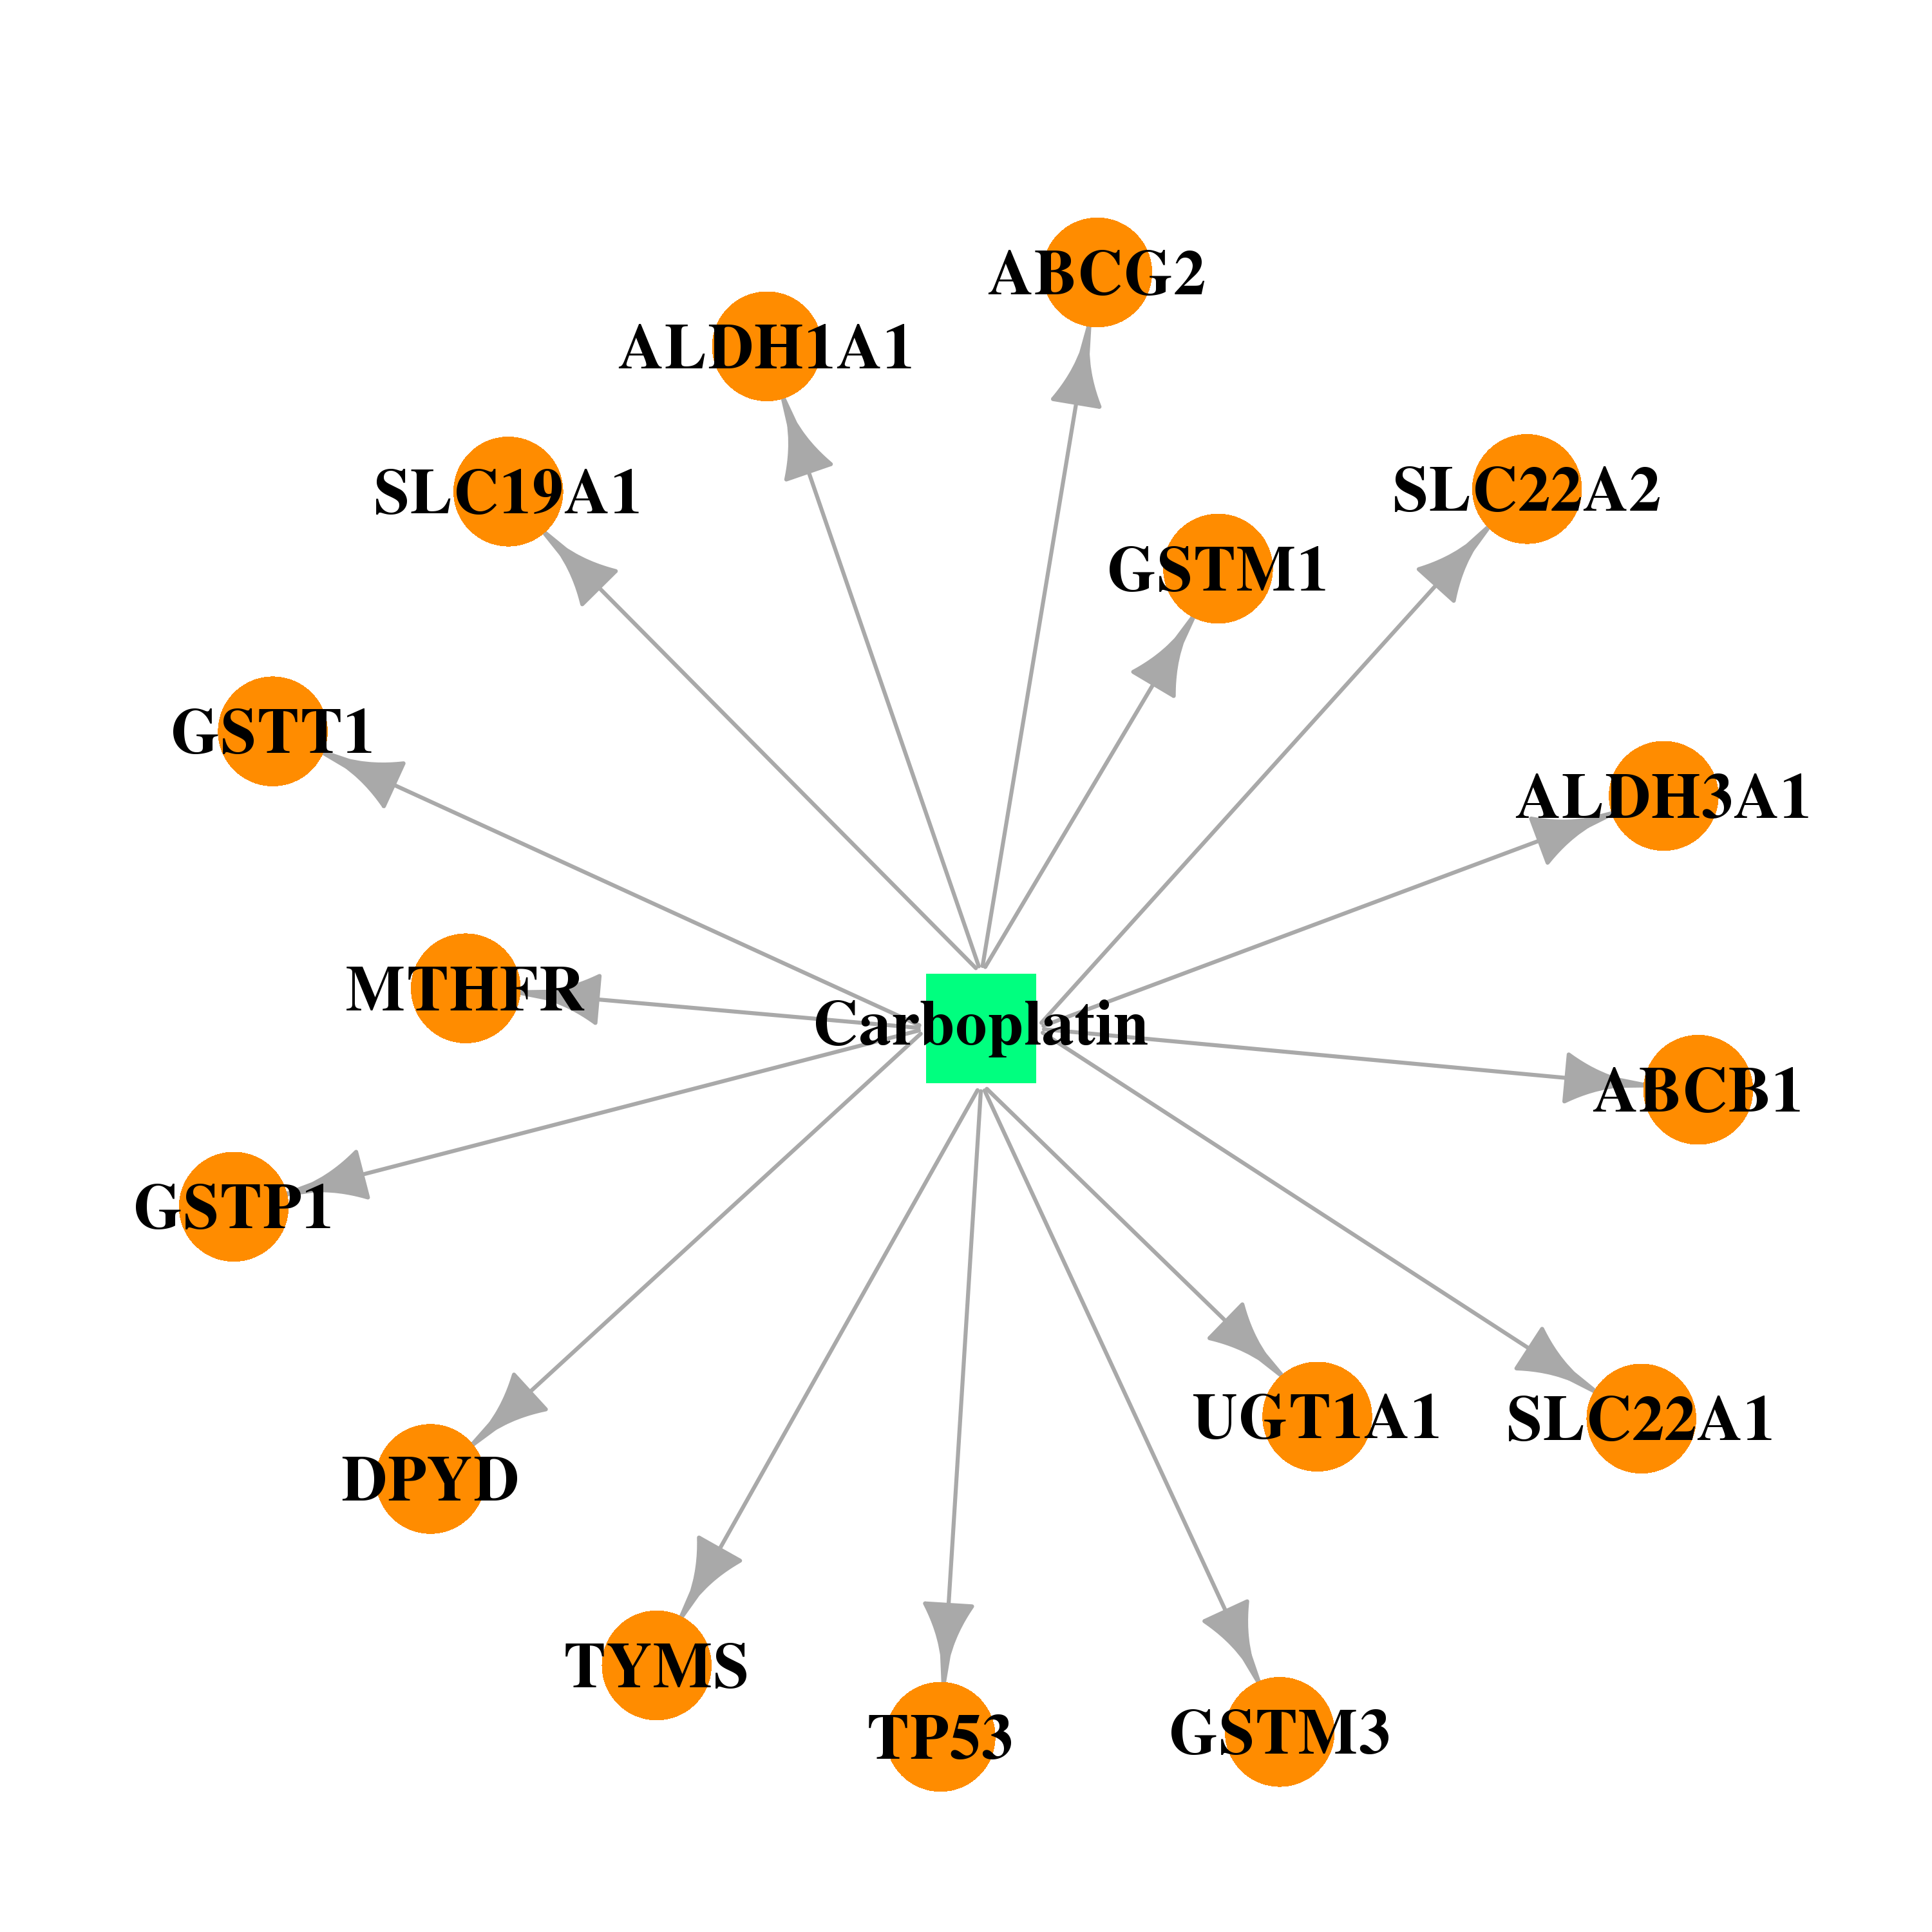 |  |
| DB04572 | aldehyde dehydrogenase 1 family, member A1 | approved | Thiotepa | 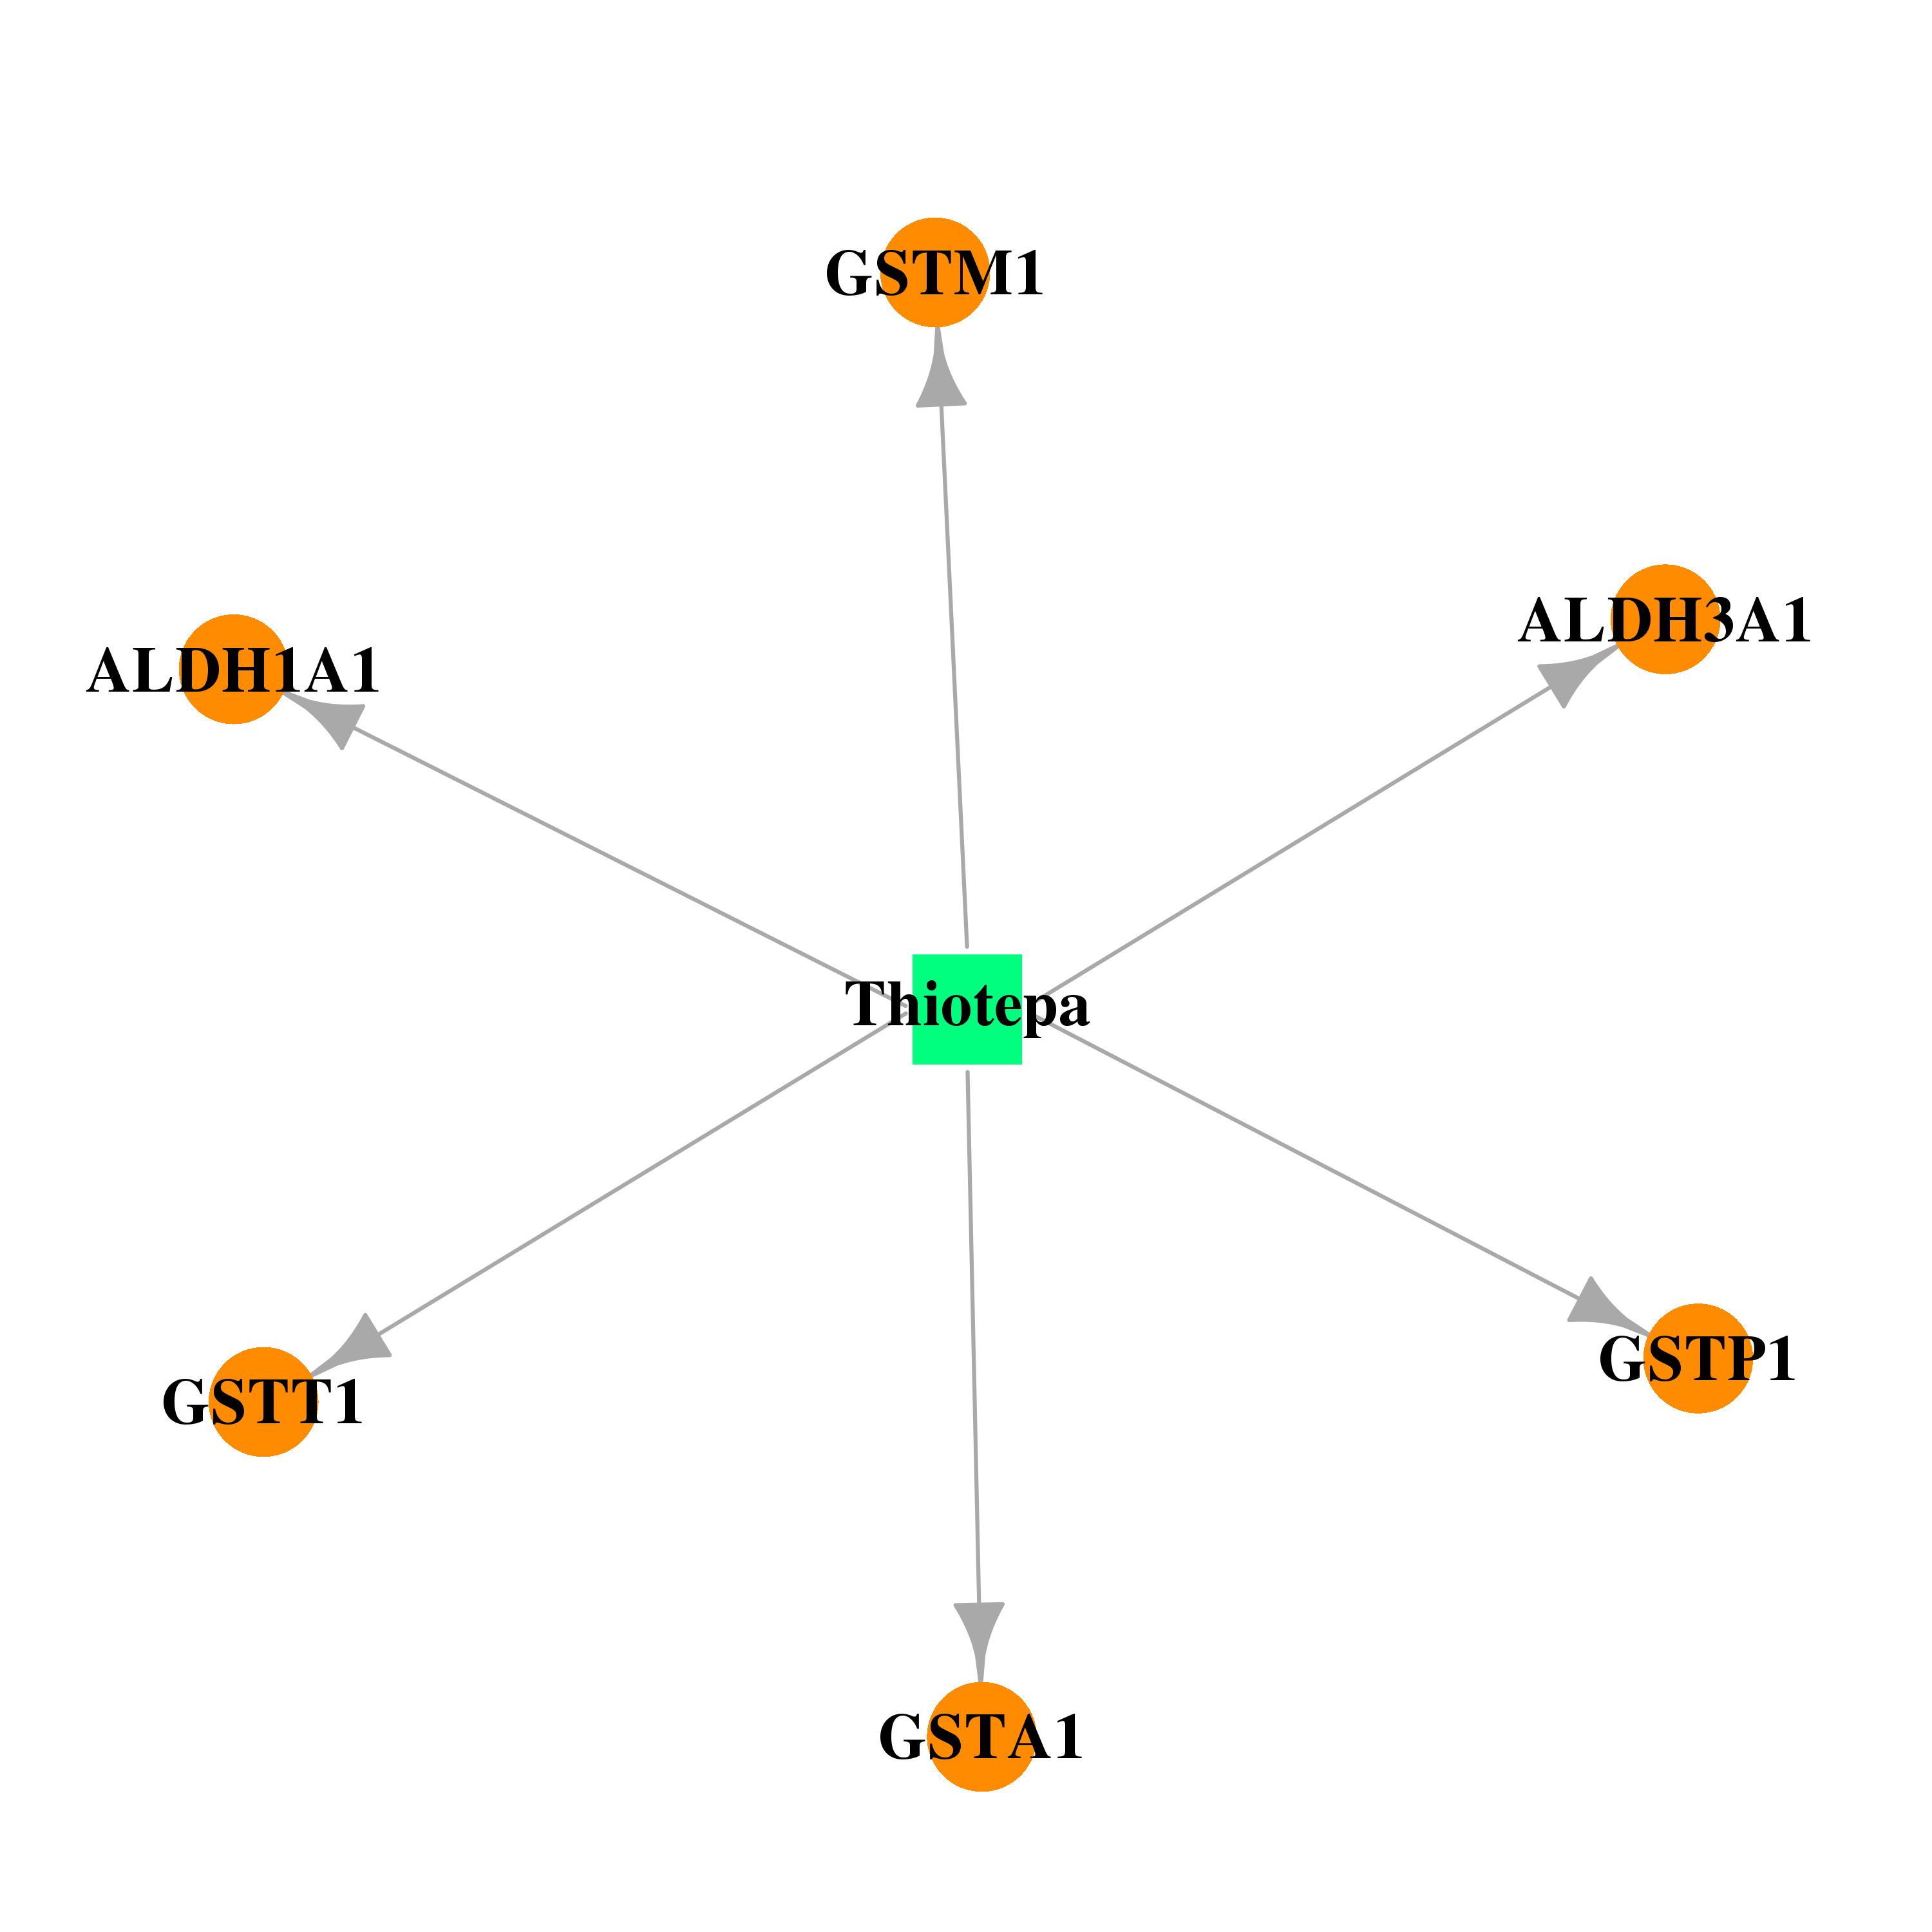 |  |
| DB00531 | aldehyde dehydrogenase 1 family, member A1 | approved; investigational | Cyclophosphamide | 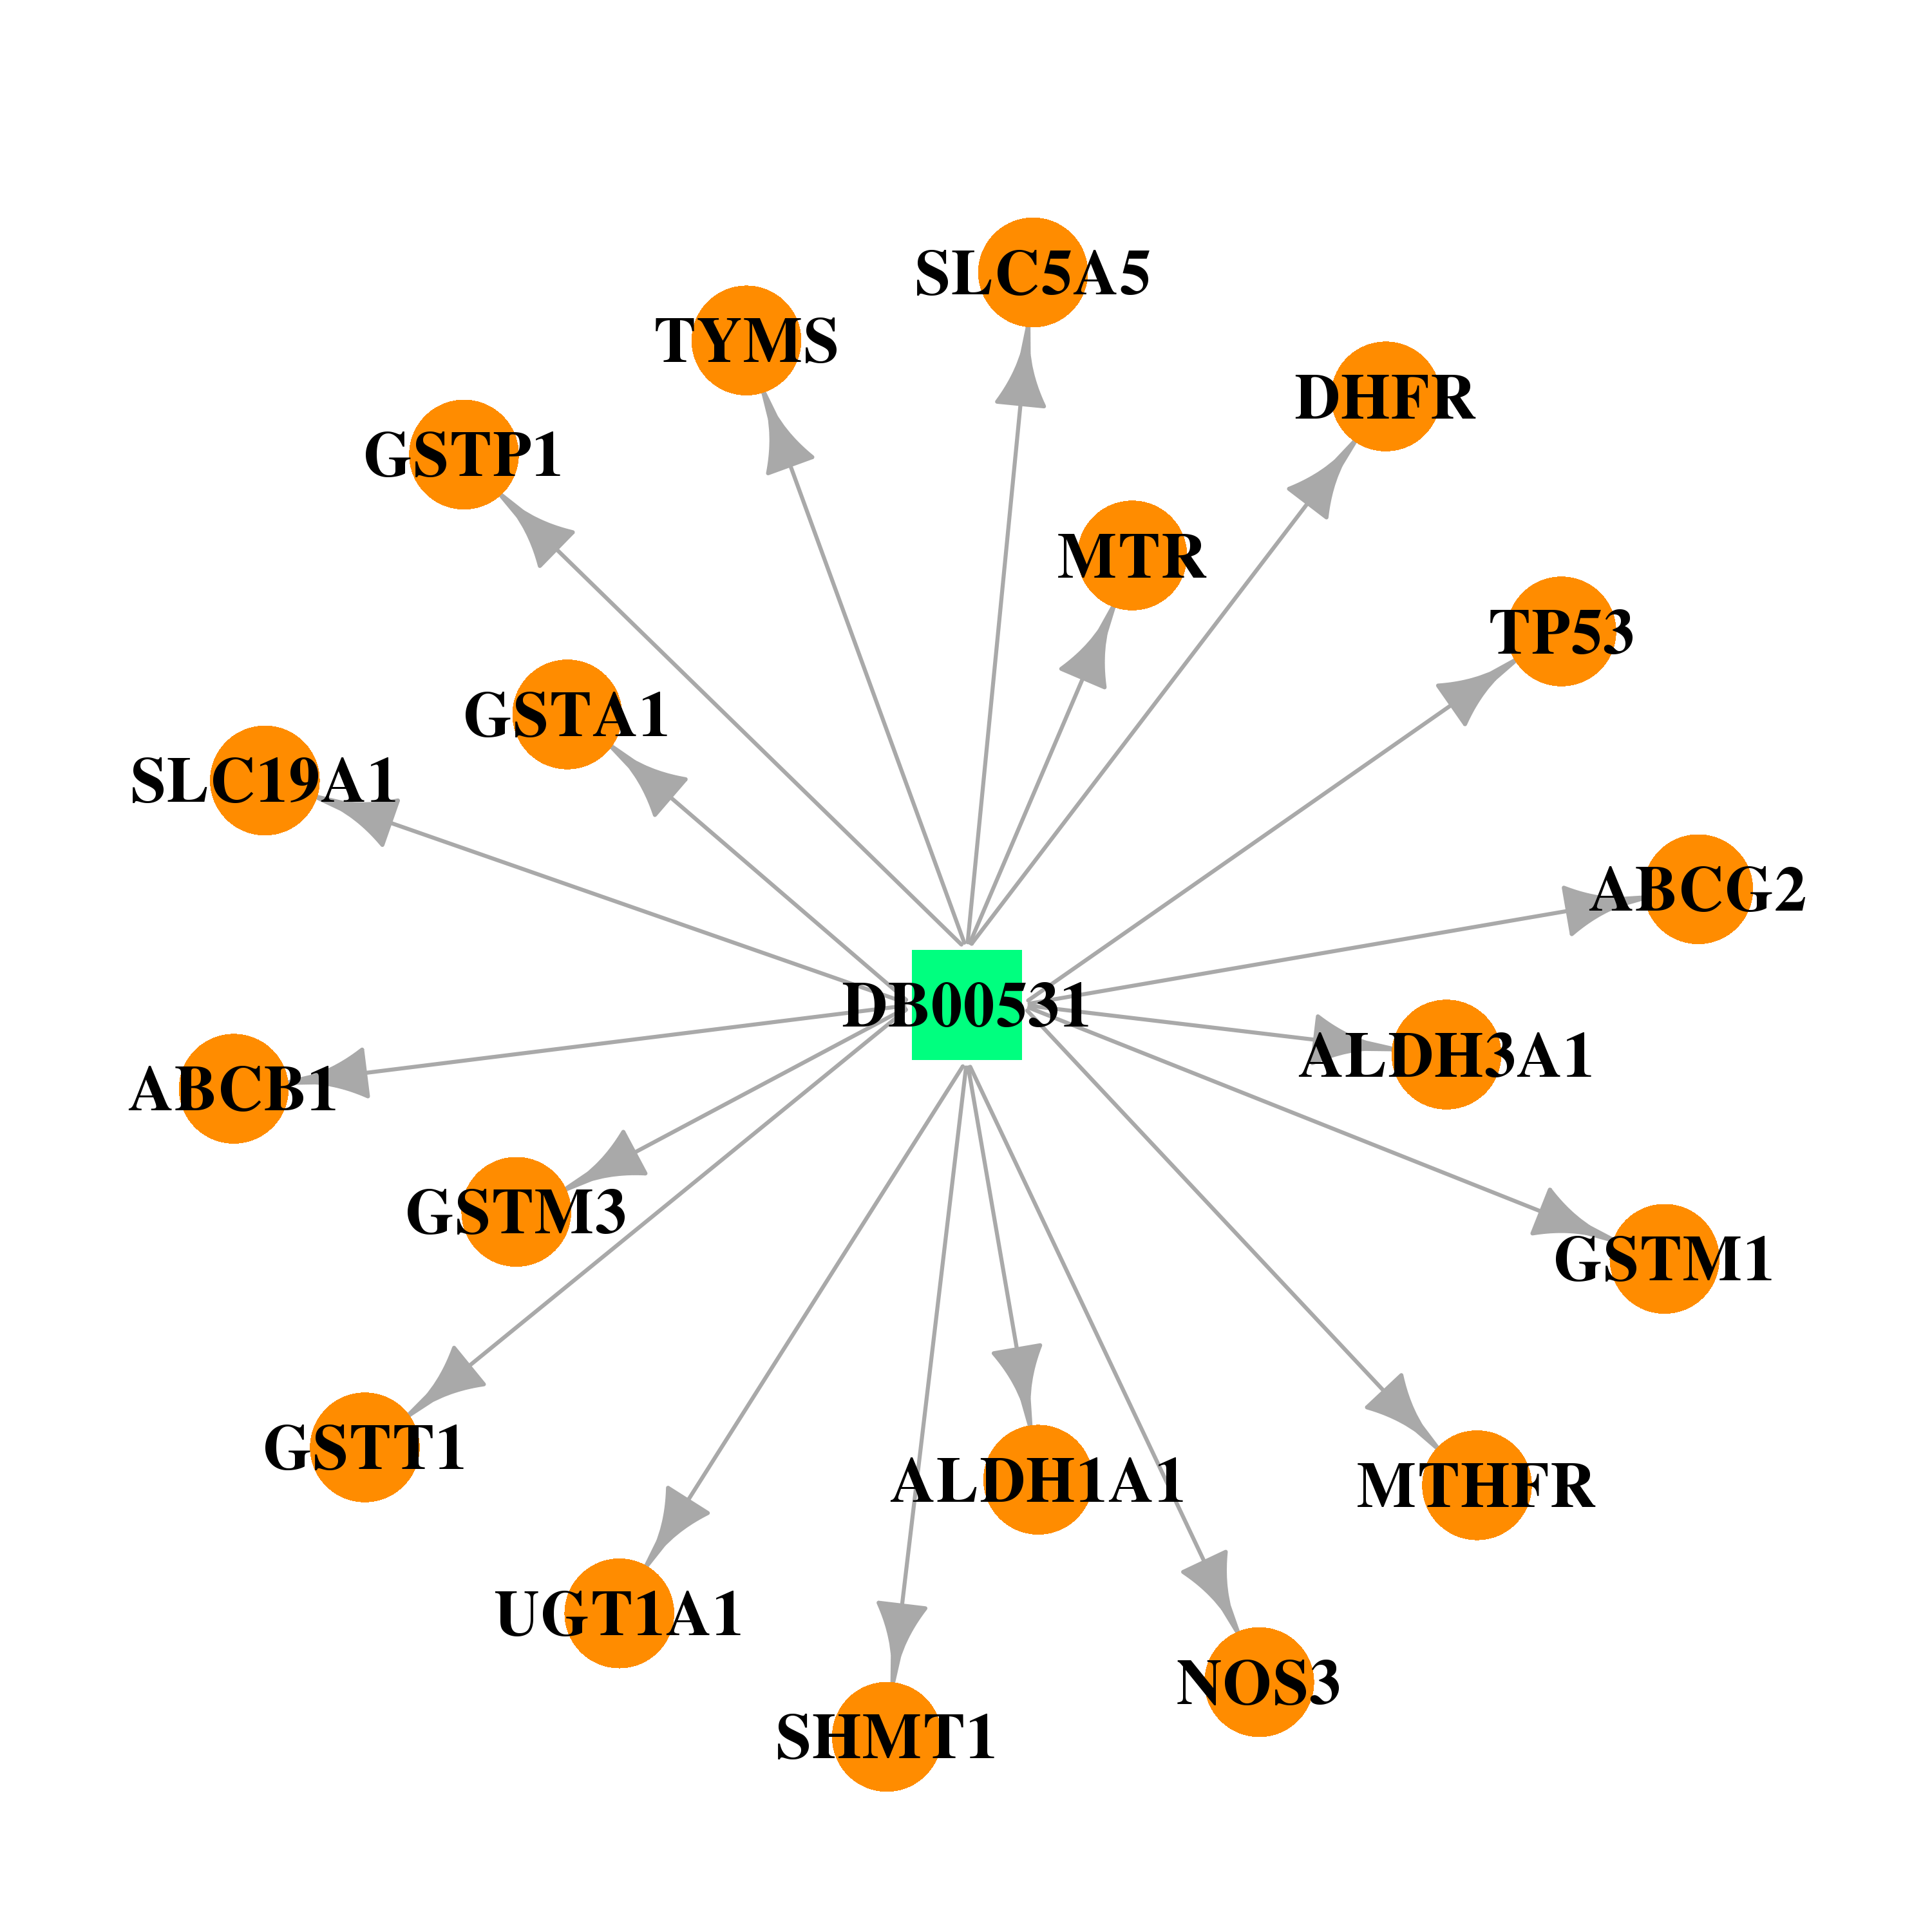 | 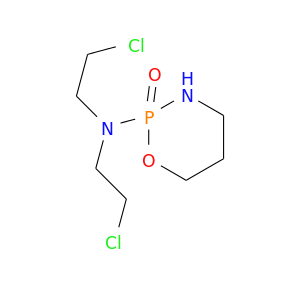 |
| Top |
| Cross referenced IDs for ALDH1A1 |
| * We obtained these cross-references from Uniprot database. It covers 150 different DBs, 18 categories. http://www.uniprot.org/help/cross_references_section |
: Open all cross reference information
|
Copyright © 2016-Present - The Univsersity of Texas Health Science Center at Houston @ |