|
|||||||||||||||||||||||||||||||||||||||||||||||||||||||||||||||||||||||||||||||||||||||||||||||||||||||||||||||||||||||||||||||||||||||||||||||||||||||||||||||||||||||||||||||||||||||||||||||||||||||||||||||||||||||||||||||||||||||||||||||||||||||||||||||||||||||||||||||||||||||||||||||||||||||||||||||||||||||
| |
| Phenotypic Information (metabolism pathway, cancer, disease, phenome) |
| |
| |
| Gene-Gene Network Information: Co-Expression Network, Interacting Genes & KEGG |
| |
|


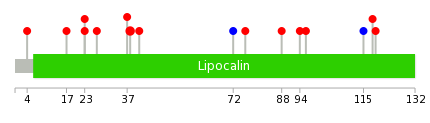
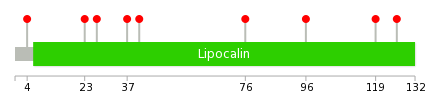
| Gene Summary for FABP4 |
| Basic gene info. | Gene symbol | FABP4 |
| Gene name | fatty acid binding protein 4, adipocyte | |
| Synonyms | A-FABP|AFABP|ALBP|HEL-S-104|aP2 | |
| Cytomap | UCSC genome browser: 8q21 | |
| Genomic location | chr8 :82390731-82395473 | |
| Type of gene | protein-coding | |
| RefGenes | NM_001442.2, | |
| Ensembl id | ENSG00000170323 | |
| Description | adipocyte lipid-binding proteinadipocyte-type fatty acid-binding proteinepididymis secretory protein Li 104fatty acid-binding protein 4fatty acid-binding protein, adipocyte | |
| Modification date | 20141222 | |
| dbXrefs | MIM : 600434 | |
| HGNC : HGNC | ||
| Ensembl : ENSG00000170323 | ||
| HPRD : 02698 | ||
| Vega : OTTHUMG00000164602 | ||
| Protein | UniProt: P15090 go to UniProt's Cross Reference DB Table | |
| Expression | CleanEX: HS_FABP4 | |
| BioGPS: 2167 | ||
| Gene Expression Atlas: ENSG00000170323 | ||
| The Human Protein Atlas: ENSG00000170323 | ||
| Pathway | NCI Pathway Interaction Database: FABP4 | |
| KEGG: FABP4 | ||
| REACTOME: FABP4 | ||
| ConsensusPathDB | ||
| Pathway Commons: FABP4 | ||
| Metabolism | MetaCyc: FABP4 | |
| HUMANCyc: FABP4 | ||
| Regulation | Ensembl's Regulation: ENSG00000170323 | |
| miRBase: chr8 :82,390,731-82,395,473 | ||
| TargetScan: NM_001442 | ||
| cisRED: ENSG00000170323 | ||
| Context | iHOP: FABP4 | |
| cancer metabolism search in PubMed: FABP4 | ||
| UCL Cancer Institute: FABP4 | ||
| Assigned class in ccmGDB | A - This gene has a literature evidence and it belongs to cancer gene. | |
| References showing role of FABP4 in cancer cell metabolism | 1. Uehara H, Takahashi T, Oha M, Ogawa H, Izumi K (2014) Exogenous fatty acid binding protein 4 promotes human prostate cancer cell progression. Int J Cancer 135: 2558-2568. doi: 10.1002/ijc.28903. go to article 2. Harjes U, Bridges E, McIntyre A, Fielding BA, Harris AL (2014) Fatty acid-binding protein 4, a point of convergence for angiogenic and metabolic signaling pathways in endothelial cells. J Biol Chem 289: 23168-23176. doi: 10.1074/jbc.M114.576512. pmid: 4132814. go to article 3. Hu J, Liu Z, Wang X (2013) Does TP53 mutation promote ovarian cancer metastasis to omentum by regulating lipid metabolism? Med Hypotheses 81: 515-520. doi: 10.1016/j.mehy.2013.06.009. go to article | |
| Top |
| Phenotypic Information for FABP4(metabolism pathway, cancer, disease, phenome) |
| Cancer | CGAP: FABP4 |
| Familial Cancer Database: FABP4 | |
| * This gene is included in those cancer gene databases. |
|
|
|
|
|
|
| |||||||||||||||||||||||||||||||||||||||||||||||||||||||||||||||||||||||||||||||||||||||||||||||||||||||||||||||||||||||||||||||||||||||||||||||||||||||||||||||||||||||||||||||||||||||||||||||||||||||||||||||||||||||||||||||||||||||||||||||||||||||||||||||||||||||||||||||||||||||||||||||||||||||||||||||||
Oncogene 1 | Significant driver gene in | ||||||||||||||||||||||||||||||||||||||||||||||||||||||||||||||||||||||||||||||||||||||||||||||||||||||||||||||||||||||||||||||||||||||||||||||||||||||||||||||||||||||||||||||||||||||||||||||||||||||||||||||||||||||||||||||||||||||||||||||||||||||||||||||||||||||||||||||||||||||||||||||||||||||||||||||||||||||
| cf) number; DB name 1 Oncogene; http://nar.oxfordjournals.org/content/35/suppl_1/D721.long, 2 Tumor Suppressor gene; https://bioinfo.uth.edu/TSGene/, 3 Cancer Gene Census; http://www.nature.com/nrc/journal/v4/n3/abs/nrc1299.html, 4 CancerGenes; http://nar.oxfordjournals.org/content/35/suppl_1/D721.long, 5 Network of Cancer Gene; http://ncg.kcl.ac.uk/index.php, 1Therapeutic Vulnerabilities in Cancer; http://cbio.mskcc.org/cancergenomics/statius/ |
| REACTOME_METABOLISM_OF_LIPIDS_AND_LIPOPROTEINS | |
| OMIM | 600434; gene. |
| Orphanet | |
| Disease | KEGG Disease: FABP4 |
| MedGen: FABP4 (Human Medical Genetics with Condition) | |
| ClinVar: FABP4 | |
| Phenotype | MGI: FABP4 (International Mouse Phenotyping Consortium) |
| PhenomicDB: FABP4 | |
| Mutations for FABP4 |
| * Under tables are showing count per each tissue to give us broad intuition about tissue specific mutation patterns.You can go to the detailed page for each mutation database's web site. |
| There's no structural variation information in COSMIC data for this gene. |
| * From mRNA Sanger sequences, Chitars2.0 arranged chimeric transcripts. This table shows FABP4 related fusion information. |
| ID | Head Gene | Tail Gene | Accession | Gene_a | qStart_a | qEnd_a | Chromosome_a | tStart_a | tEnd_a | Gene_a | qStart_a | qEnd_a | Chromosome_a | tStart_a | tEnd_a |
| BP317019 | FABP4 | 1 | 390 | 8 | 82391673 | 82395468 | PMP22 | 390 | 516 | 17 | 15143726 | 15143852 | |
| BG290021 | FABP4 | 11 | 258 | 8 | 82390927 | 82391672 | SEMA3C | 259 | 359 | 7 | 80371856 | 80371956 | |
| BG992392 | METTL17 | 1 | 105 | 14 | 21464814 | 21464977 | FABP4 | 99 | 560 | 8 | 82391102 | 82395468 | |
| Top |
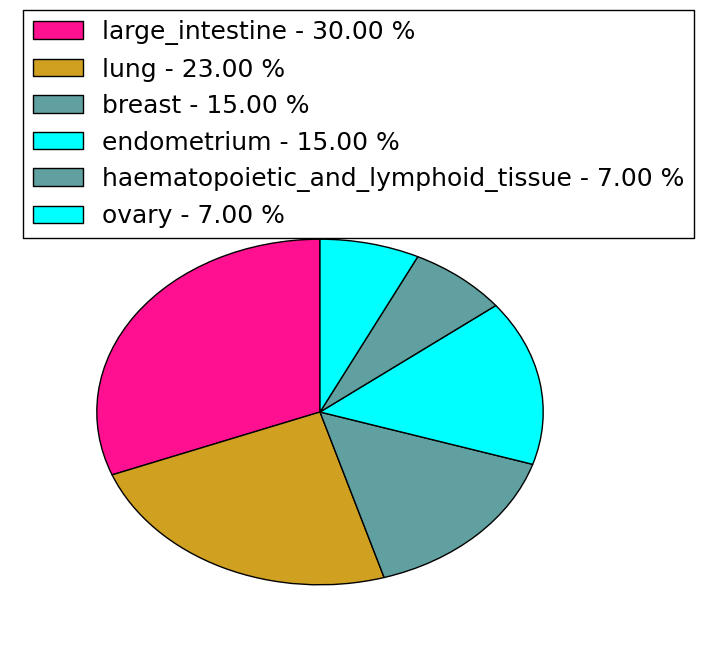
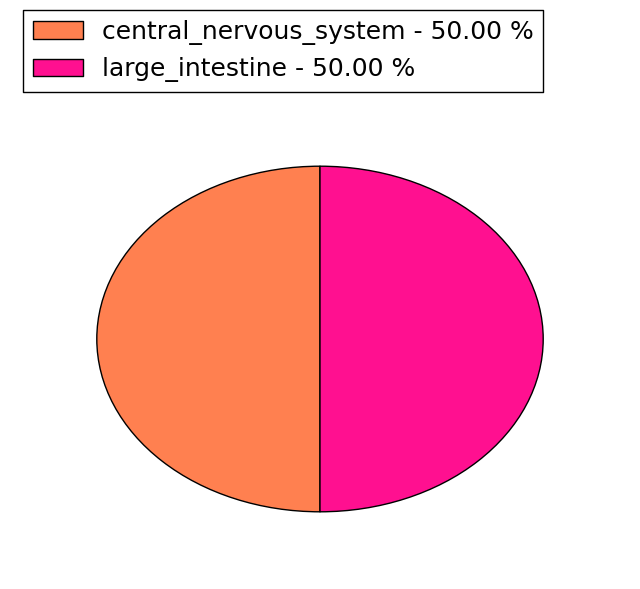
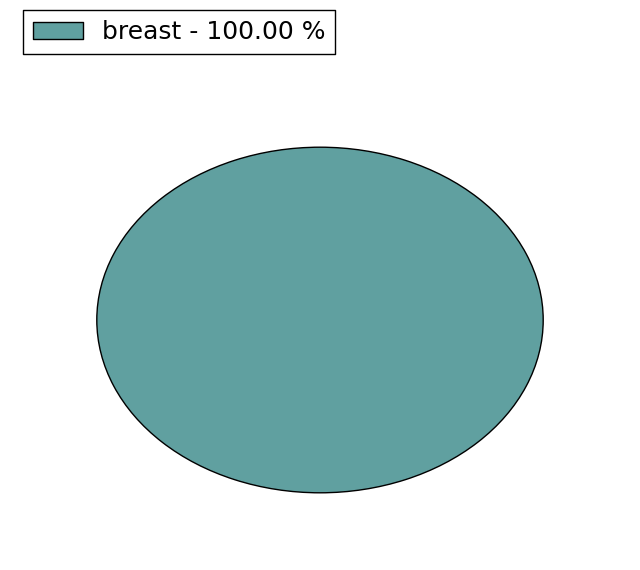
| Mutation type/ Tissue ID | brca | cns | cerv | endome | haematopo | kidn | Lintest | liver | lung | ns | ovary | pancre | prost | skin | stoma | thyro | urina | |||
| Total # sample | 1 | |||||||||||||||||||
| GAIN (# sample) | 1 | |||||||||||||||||||
| LOSS (# sample) |
| cf) Tissue ID; Tissue type (1; Breast, 2; Central_nervous_system, 3; Cervix, 4; Endometrium, 5; Haematopoietic_and_lymphoid_tissue, 6; Kidney, 7; Large_intestine, 8; Liver, 9; Lung, 10; NS, 11; Ovary, 12; Pancreas, 13; Prostate, 14; Skin, 15; Stomach, 16; Thyroid, 17; Urinary_tract) |
| Top |
|
 |
| Top |
| Stat. for Non-Synonymous SNVs (# total SNVs=13) | (# total SNVs=2) |
 |  |
(# total SNVs=1) | (# total SNVs=0) |
 |
| Top |
| * When you move the cursor on each content, you can see more deailed mutation information on the Tooltip. Those are primary_site,primary_histology,mutation(aa),pubmedID. |
| GRCh37 position | Mutation(aa) | Unique sampleID count |
| chr8:82392794-82392794 | p.K38T | 2 |
| chr8:82392784-82392784 | p.M41I | 1 |
| chr8:82391144-82391144 | p.V119I | 1 |
| chr8:82392798-82392798 | p.A37T | 1 |
| chr8:82391147-82391147 | p.C118S | 1 |
| chr8:82392828-82392828 | p.G27S | 1 |
| chr8:82391652-82391652 | p.V115V | 1 |
| chr8:82395328-82395328 | p.? | 1 |
| chr8:82391672-82391672 | p.R109* | 1 |
| chr8:82395334-82395334 | p.E23D | 1 |
| Top |
|
 |
| Point Mutation/ Tissue ID | 1 | 2 | 3 | 4 | 5 | 6 | 7 | 8 | 9 | 10 | 11 | 12 | 13 | 14 | 15 | 16 | 17 | 18 | 19 | 20 |
| # sample | 1 | 3 | 2 | 1 | 1 | 1 | ||||||||||||||
| # mutation | 1 | 3 | 2 | 1 | 1 | 1 | ||||||||||||||
| nonsynonymous SNV | 1 | 3 | 2 | 1 | 1 | 1 | ||||||||||||||
| synonymous SNV |
| cf) Tissue ID; Tissue type (1; BLCA[Bladder Urothelial Carcinoma], 2; BRCA[Breast invasive carcinoma], 3; CESC[Cervical squamous cell carcinoma and endocervical adenocarcinoma], 4; COAD[Colon adenocarcinoma], 5; GBM[Glioblastoma multiforme], 6; Glioma Low Grade, 7; HNSC[Head and Neck squamous cell carcinoma], 8; KICH[Kidney Chromophobe], 9; KIRC[Kidney renal clear cell carcinoma], 10; KIRP[Kidney renal papillary cell carcinoma], 11; LAML[Acute Myeloid Leukemia], 12; LUAD[Lung adenocarcinoma], 13; LUSC[Lung squamous cell carcinoma], 14; OV[Ovarian serous cystadenocarcinoma ], 15; PAAD[Pancreatic adenocarcinoma], 16; PRAD[Prostate adenocarcinoma], 17; SKCM[Skin Cutaneous Melanoma], 18:STAD[Stomach adenocarcinoma], 19:THCA[Thyroid carcinoma], 20:UCEC[Uterine Corpus Endometrial Carcinoma]) |
| Top |
| * We represented just top 10 SNVs. When you move the cursor on each content, you can see more deailed mutation information on the Tooltip. Those are primary_site, primary_histology, mutation(aa), pubmedID. |
| Genomic Position | Mutation(aa) | Unique sampleID count |
| chr8:82391122 | p.T126M | 1 |
| chr8:82391144 | p.V119I | 1 |
| chr8:82391709 | p.Q96H | 1 |
| chr8:82392681 | p.A76S | 1 |
| chr8:82392784 | p.M41I | 1 |
| chr8:82392798 | p.A37T | 1 |
| chr8:82392828 | p.G27R | 1 |
| chr8:82395335 | p.E23G | 1 |
| chr8:82395392 | p.A4D | 1 |
| * Copy number data were extracted from TCGA using R package TCGA-Assembler. The URLs of all public data files on TCGA DCC data server were gathered on Jan-05-2015. Function ProcessCNAData in TCGA-Assembler package was used to obtain gene-level copy number value which is calculated as the average copy number of the genomic region of a gene. |
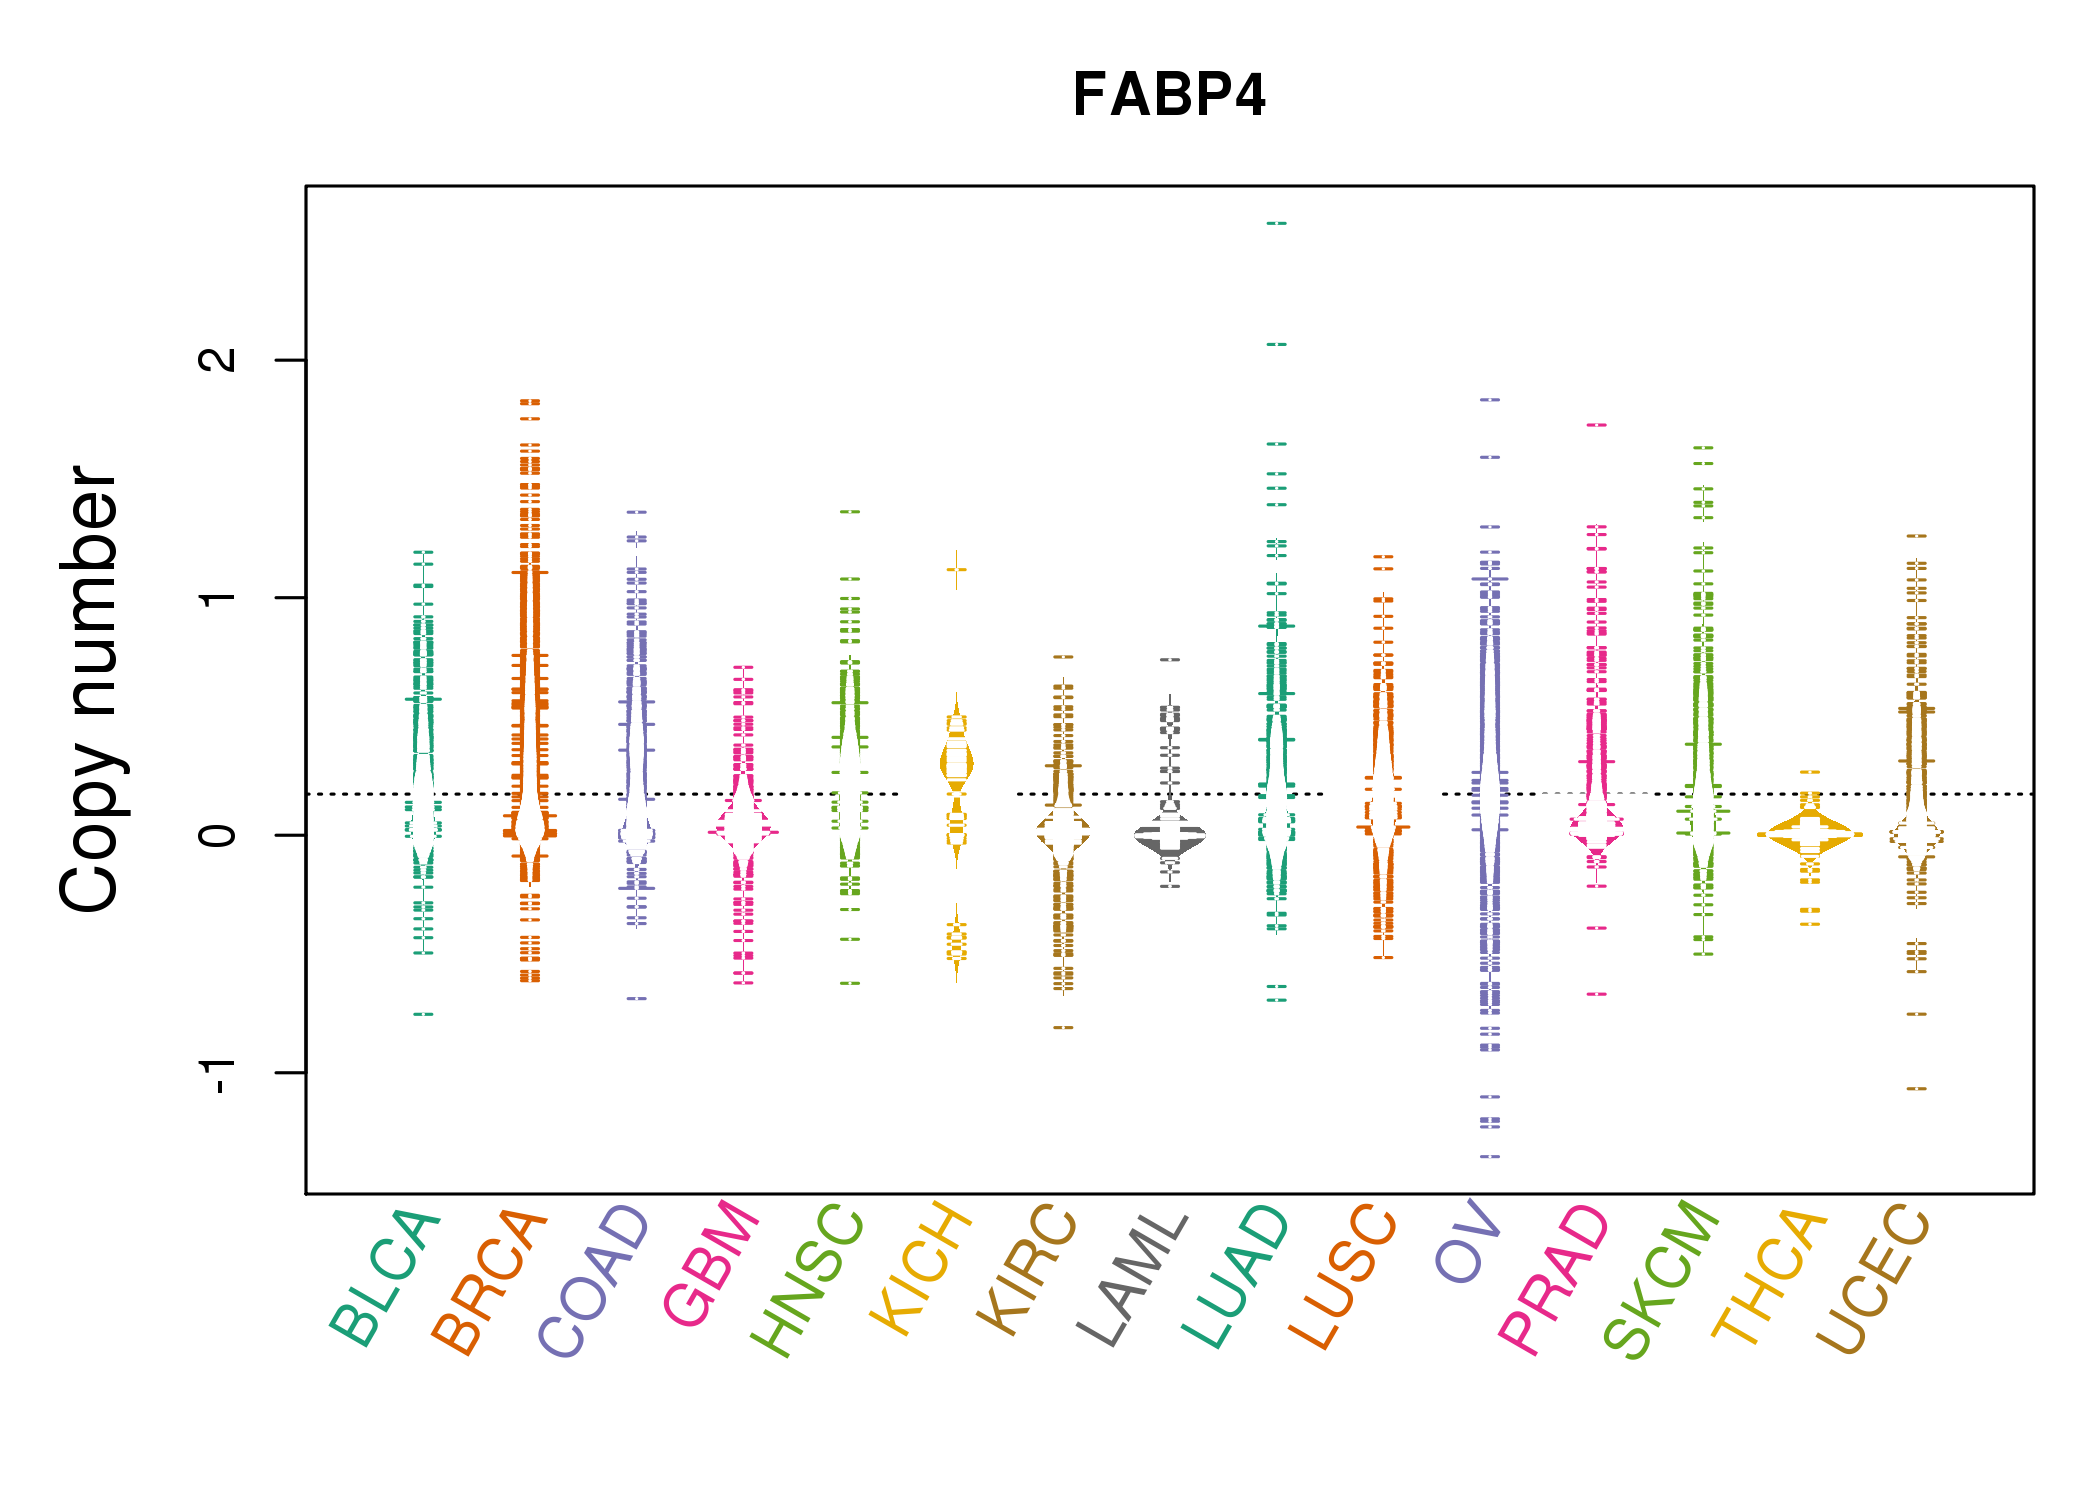 |
| cf) Tissue ID[Tissue type]: BLCA[Bladder Urothelial Carcinoma], BRCA[Breast invasive carcinoma], CESC[Cervical squamous cell carcinoma and endocervical adenocarcinoma], COAD[Colon adenocarcinoma], GBM[Glioblastoma multiforme], Glioma Low Grade, HNSC[Head and Neck squamous cell carcinoma], KICH[Kidney Chromophobe], KIRC[Kidney renal clear cell carcinoma], KIRP[Kidney renal papillary cell carcinoma], LAML[Acute Myeloid Leukemia], LUAD[Lung adenocarcinoma], LUSC[Lung squamous cell carcinoma], OV[Ovarian serous cystadenocarcinoma ], PAAD[Pancreatic adenocarcinoma], PRAD[Prostate adenocarcinoma], SKCM[Skin Cutaneous Melanoma], STAD[Stomach adenocarcinoma], THCA[Thyroid carcinoma], UCEC[Uterine Corpus Endometrial Carcinoma] |
| Top |
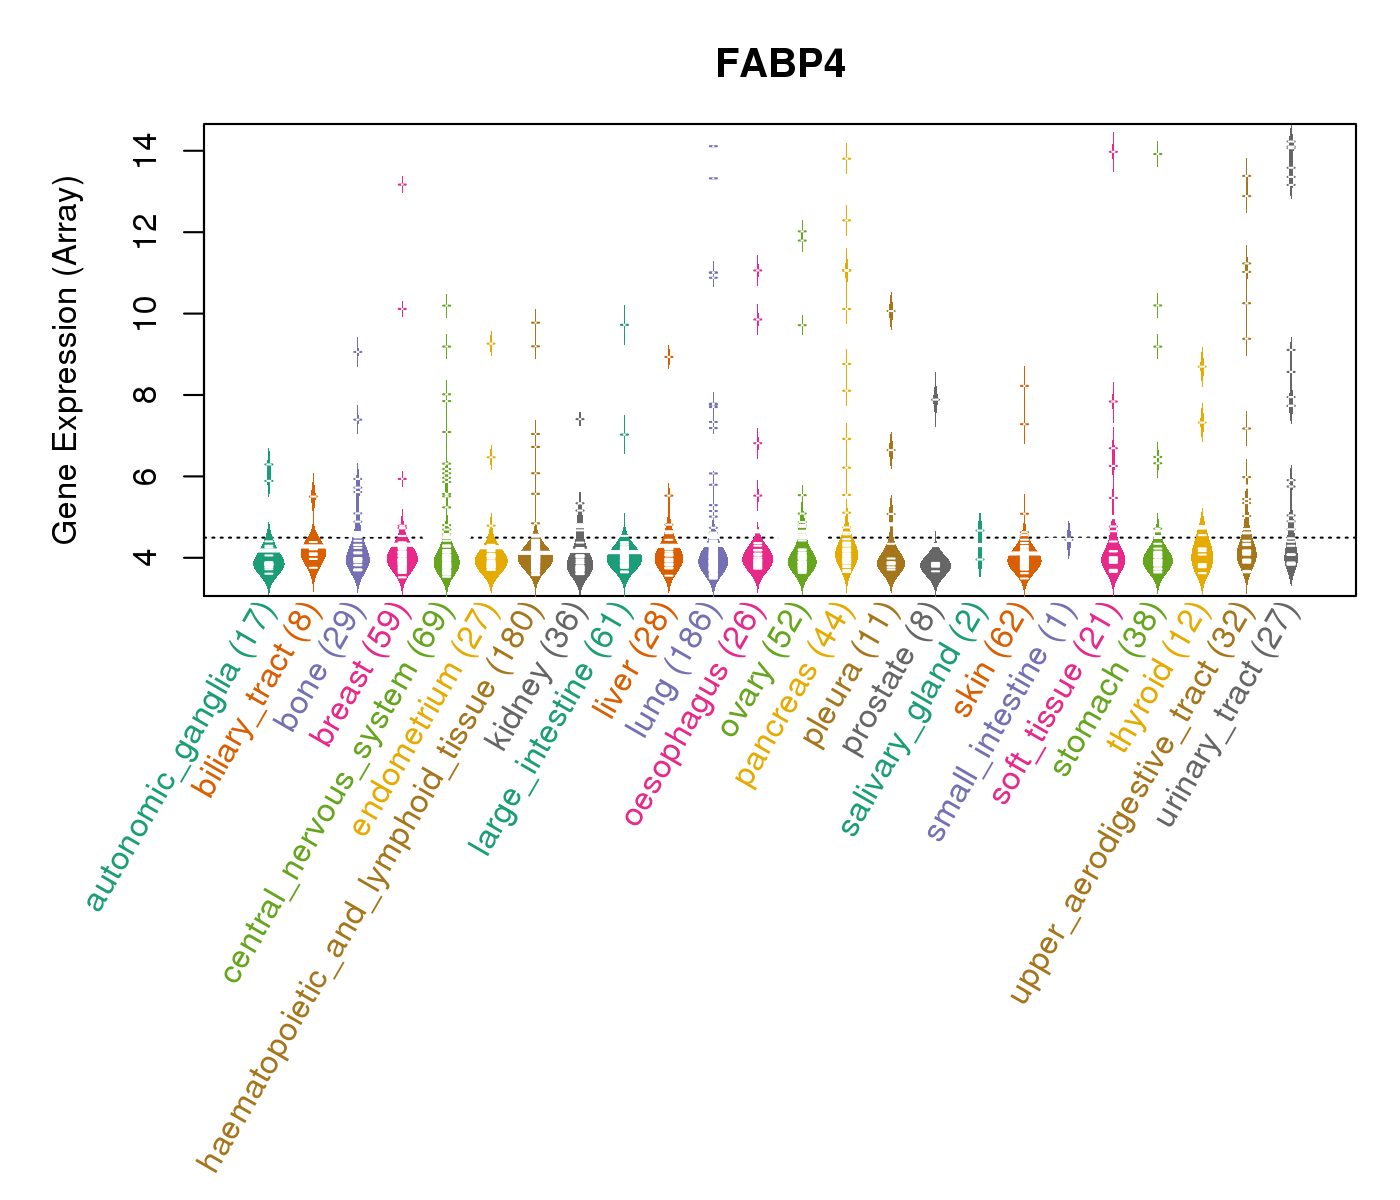
| Gene Expression for FABP4 |
| * CCLE gene expression data were extracted from CCLE_Expression_Entrez_2012-10-18.res: Gene-centric RMA-normalized mRNA expression data. |
 |
| * Normalized gene expression data of RNASeqV2 was extracted from TCGA using R package TCGA-Assembler. The URLs of all public data files on TCGA DCC data server were gathered at Jan-05-2015. Only eight cancer types have enough normal control samples for differential expression analysis. (t test, adjusted p<0.05 (using Benjamini-Hochberg FDR)) |
 |
| Top |
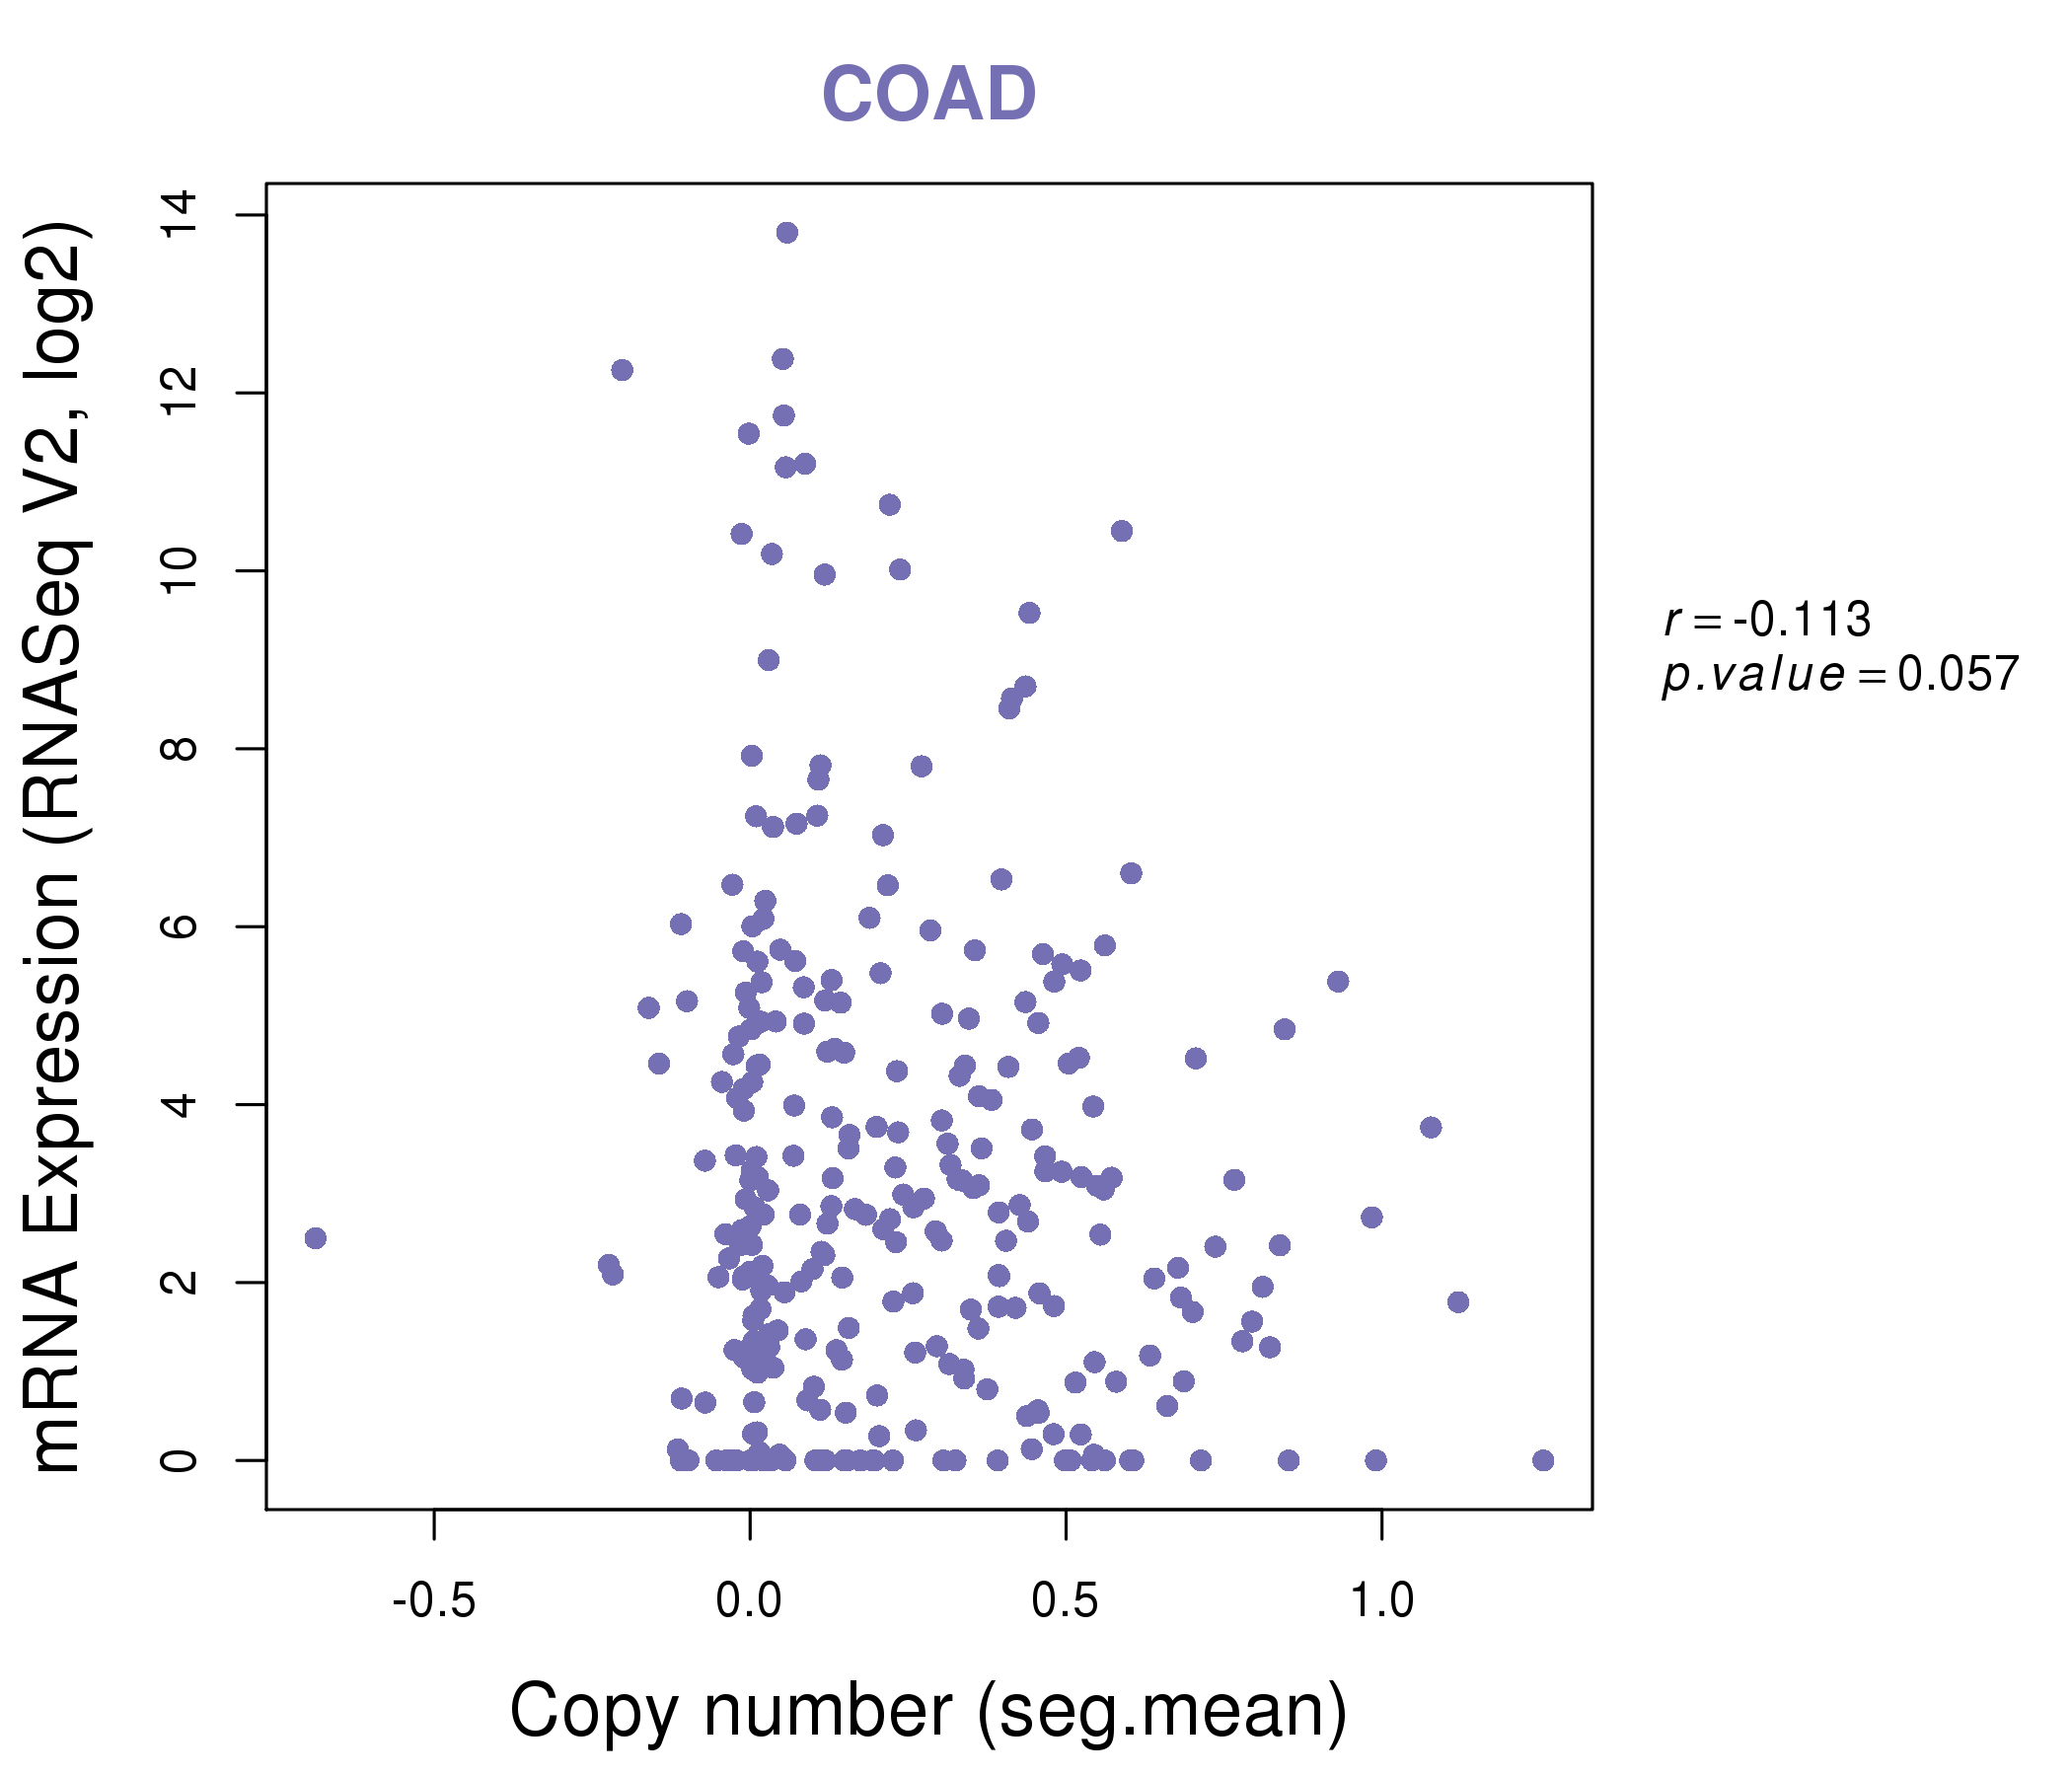
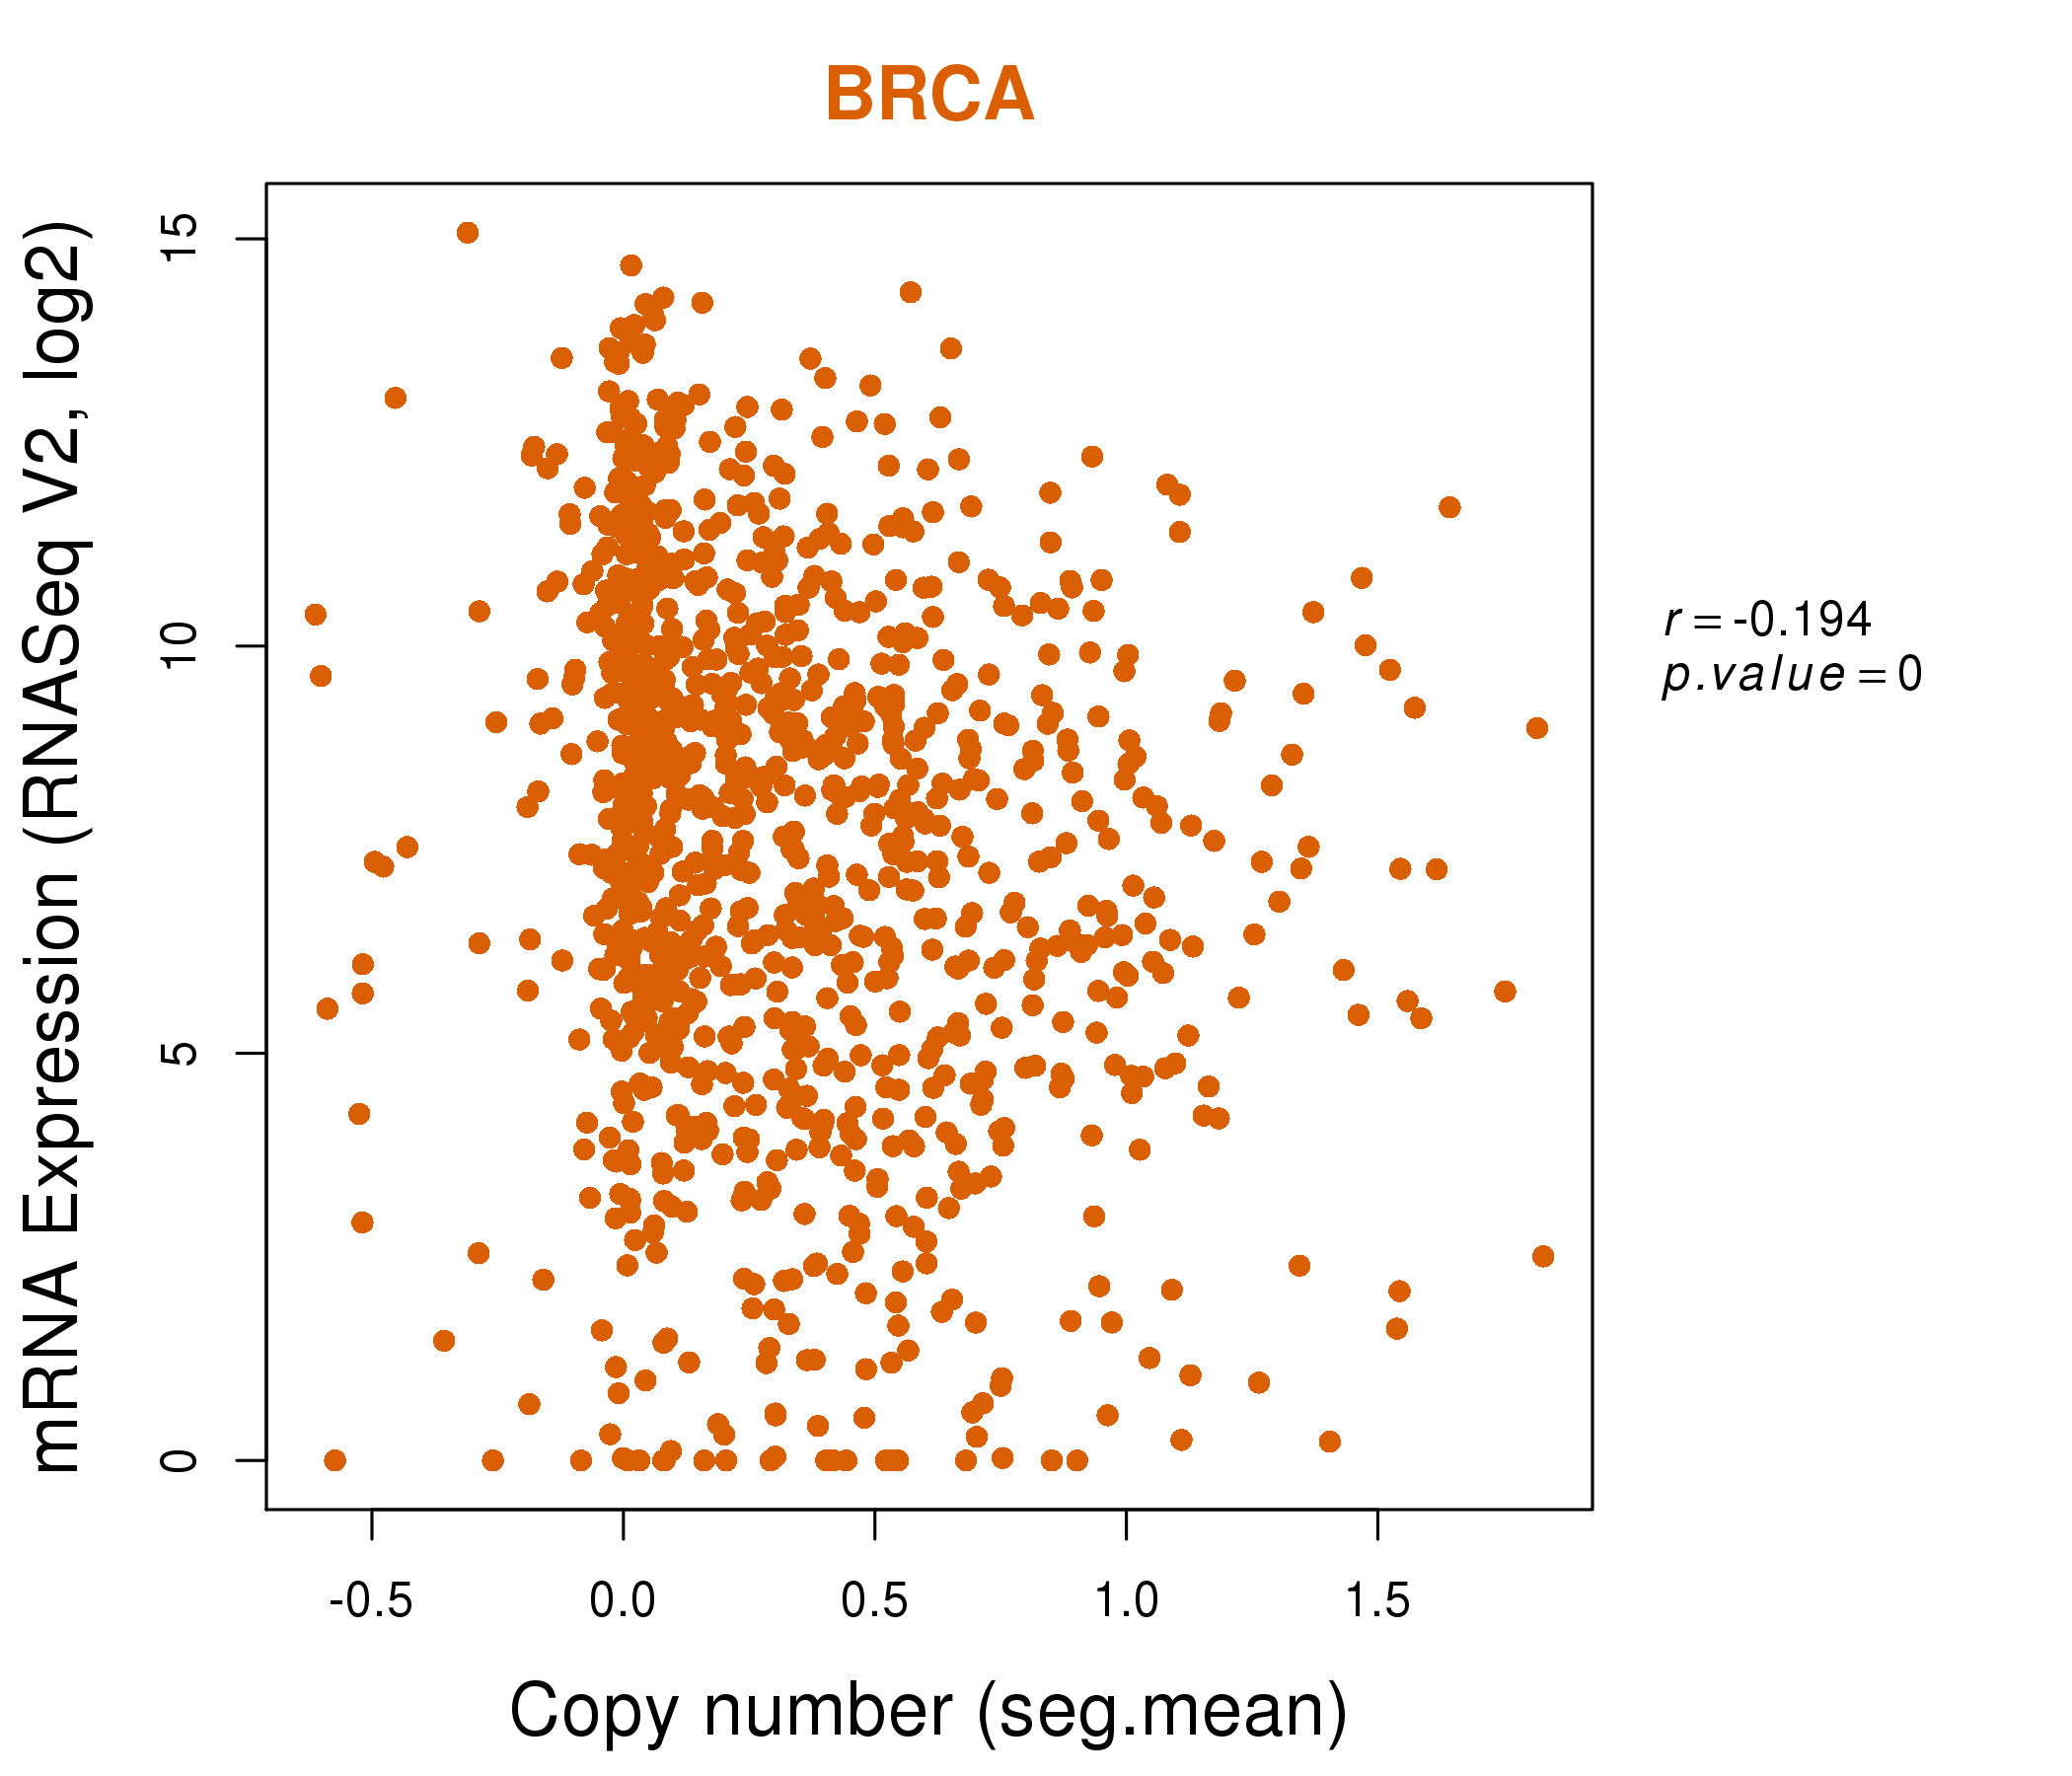
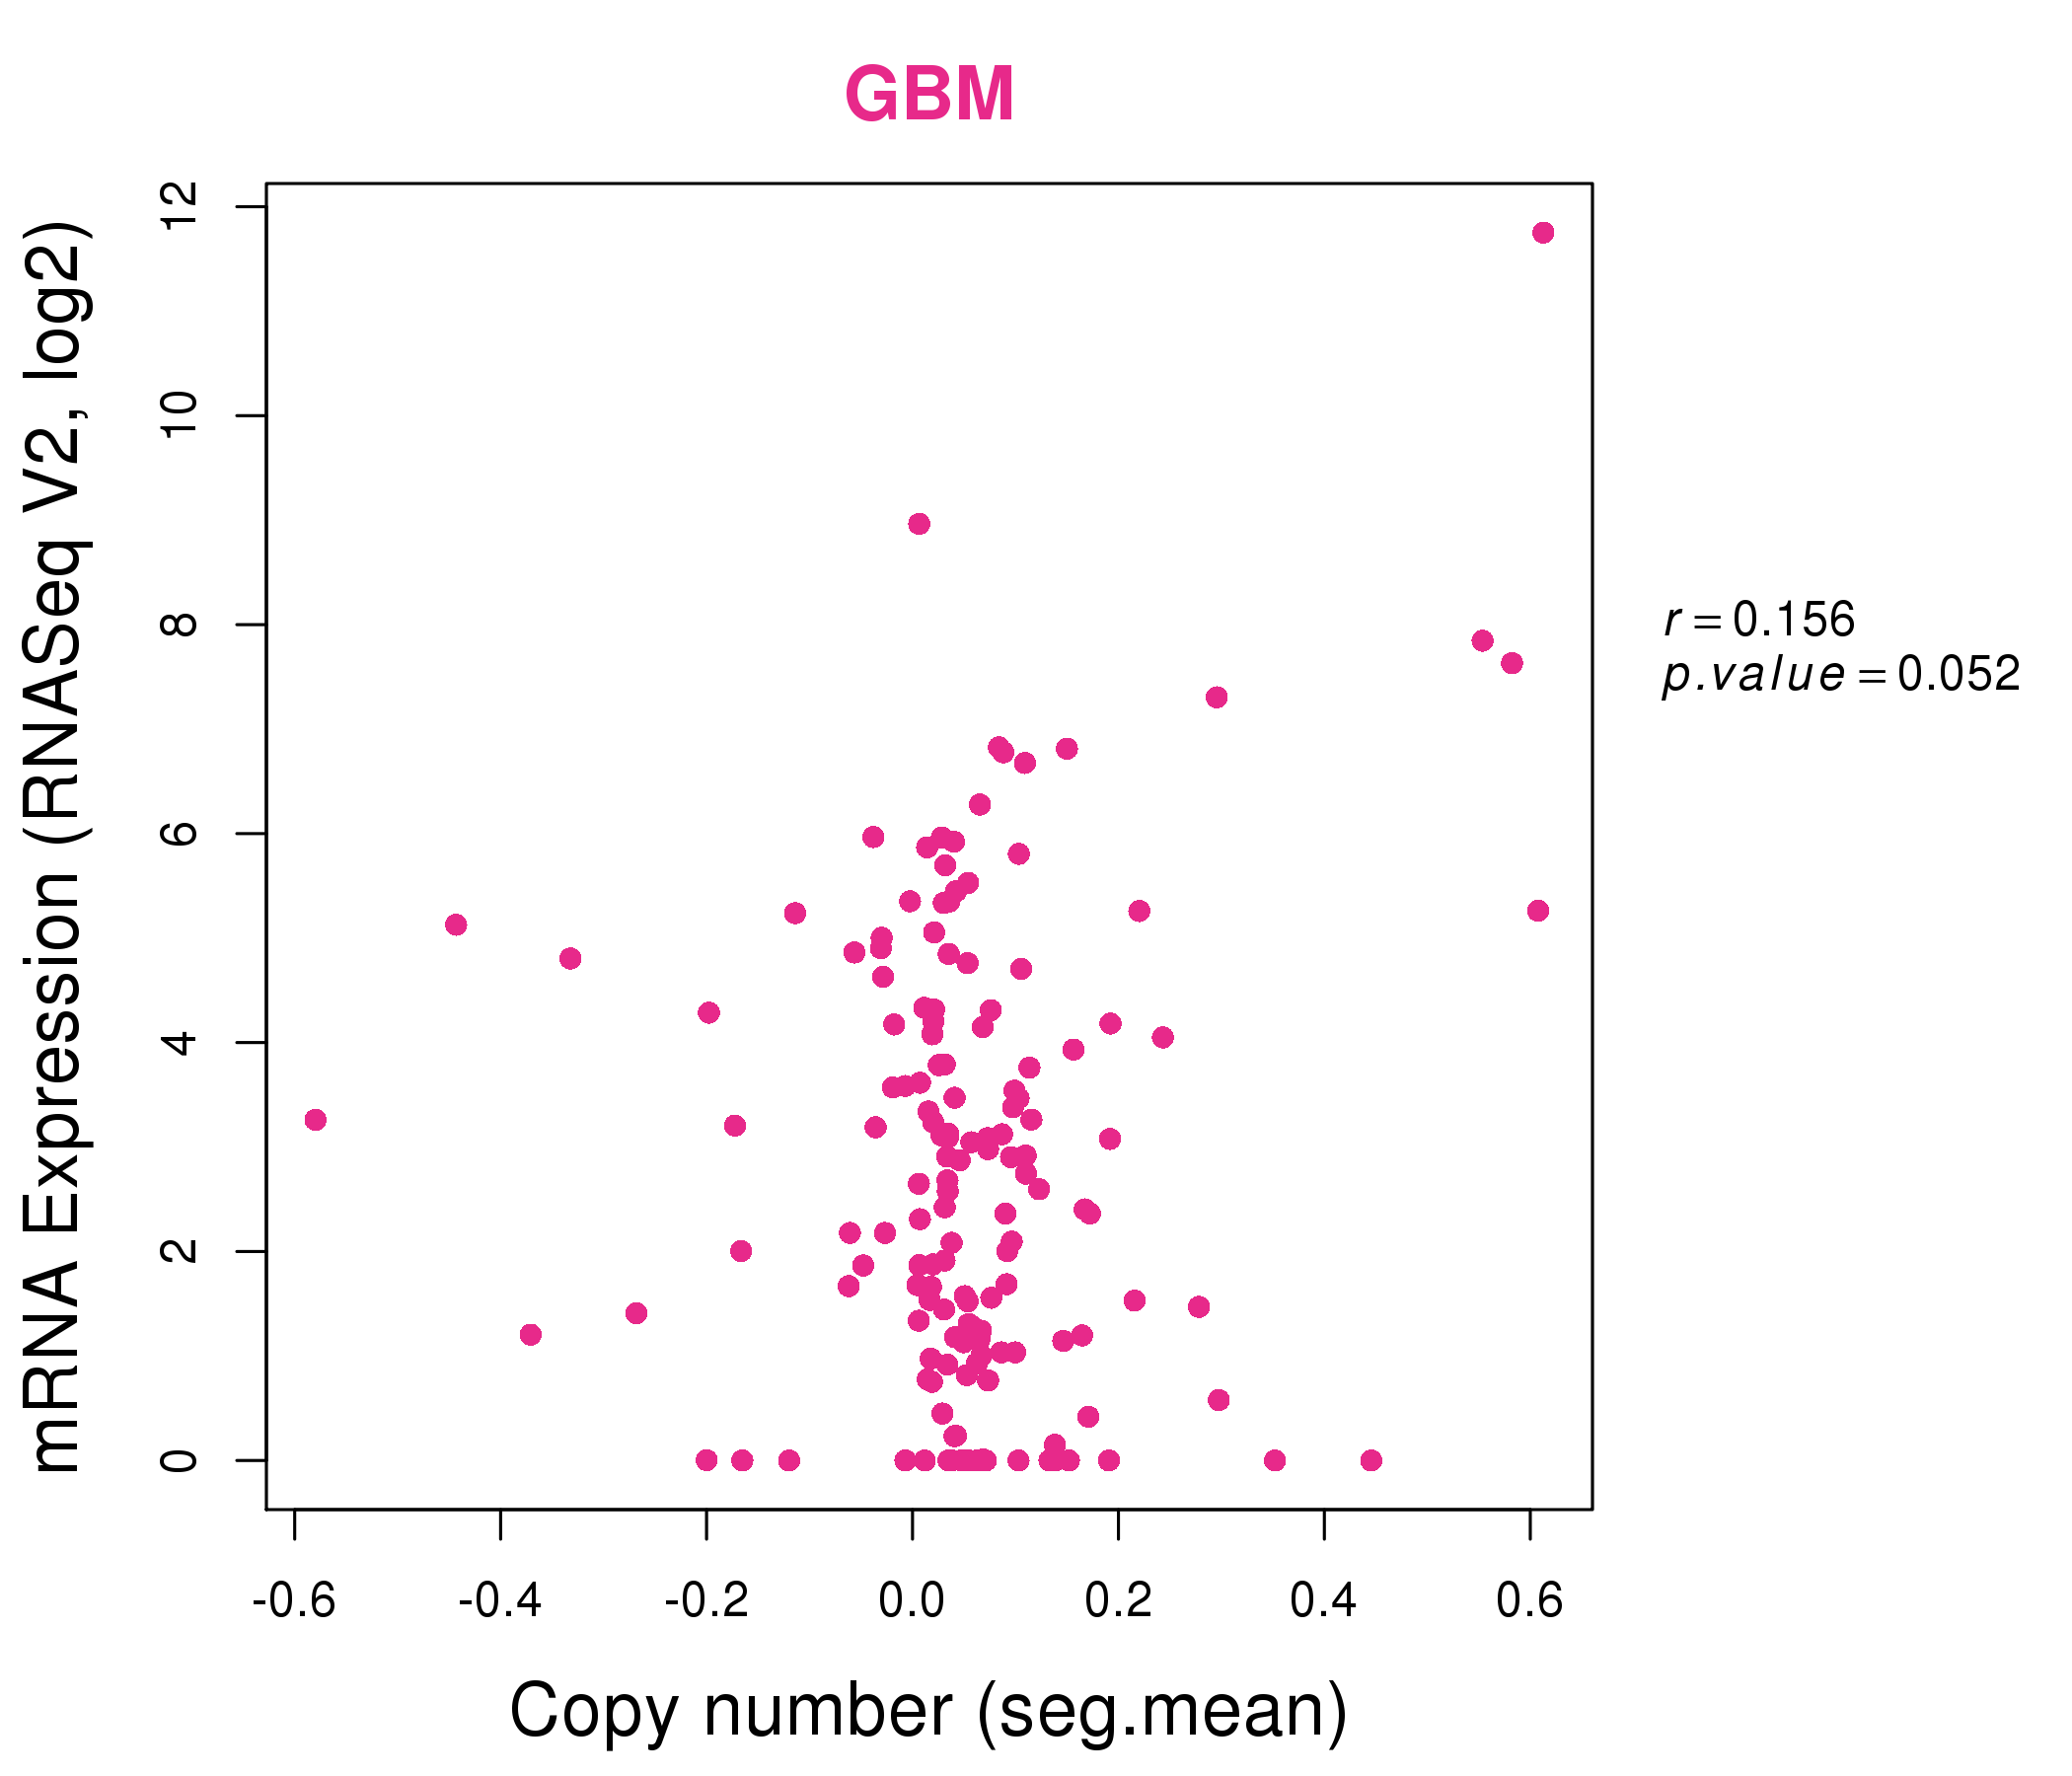
| * This plots show the correlation between CNV and gene expression. |
: Open all plots for all cancer types
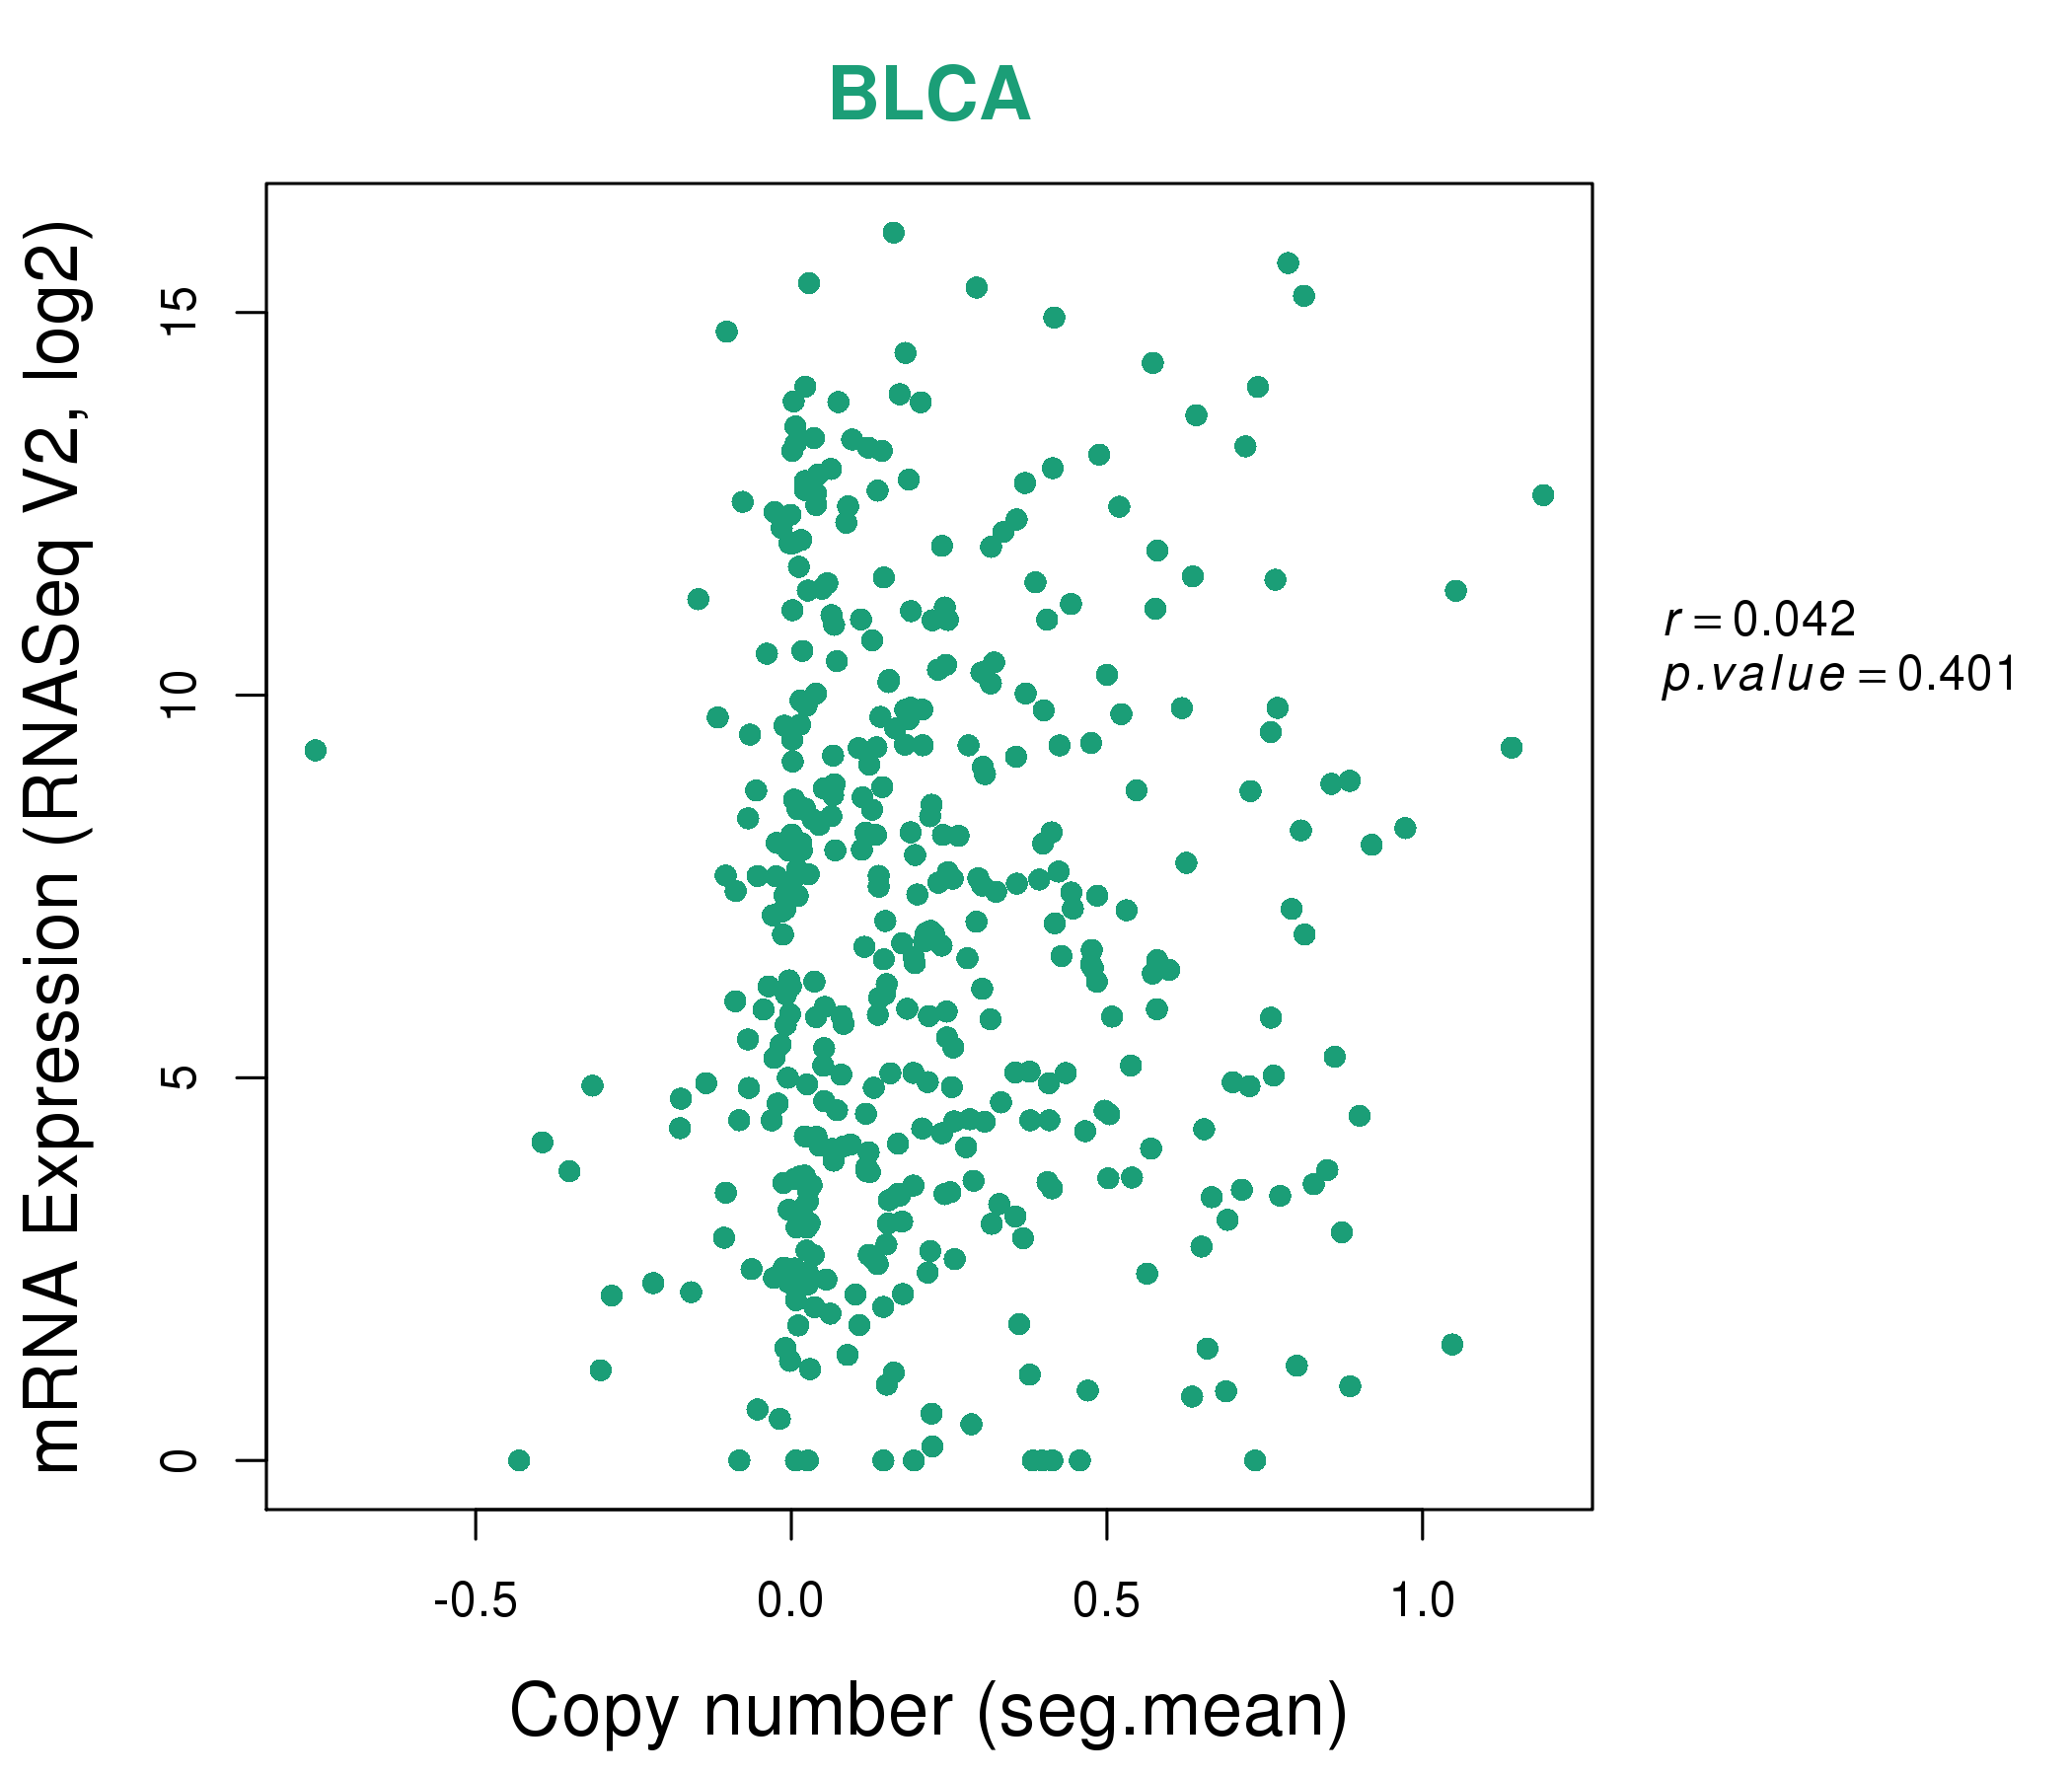 |
|
 |
|
| Top |
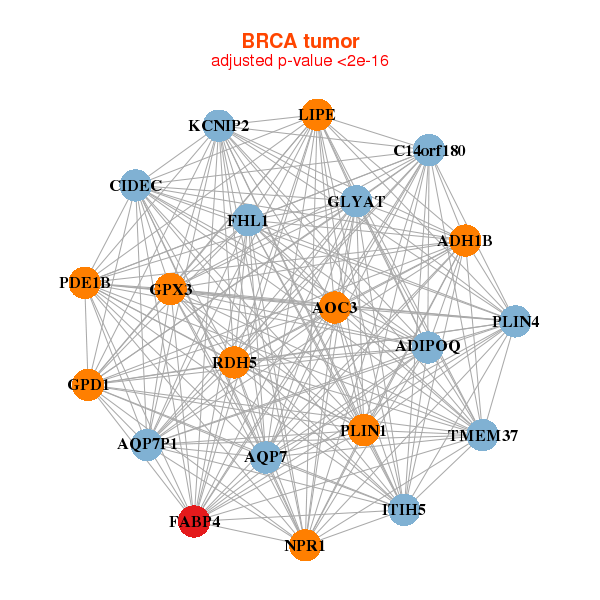
| Gene-Gene Network Information |
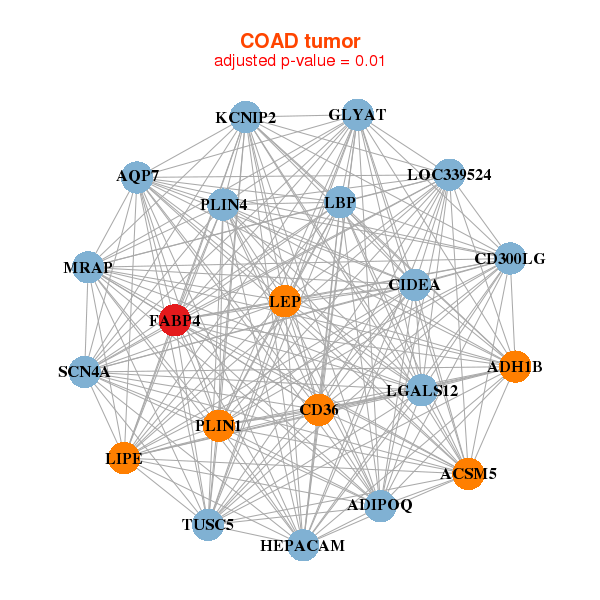
| * Co-Expression network figures were drawn using R package igraph. Only the top 20 genes with the highest correlations were shown. Red circle: input gene, orange circle: cell metabolism gene, sky circle: other gene |
: Open all plots for all cancer types
 |
|
| ADH1B,ADIPOQ,AOC3,AQP7,AQP7P1,C14orf180,CIDEC, FABP4,FHL1,GLYAT,GPD1,GPX3,ITIH5,KCNIP2, LIPE,NPR1,PDE1B,PLIN1,PLIN4,RDH5,TMEM37 | AOC3,FAM213A,CD36,CIDEC,CPM,ESYT1,FABP4, FBXO27,GABRE,GNAI1,GYG2,HRASLS5,KCNIP2,PDE8A, PEX19,PLIN1,PPARG,SH3KBP1,SLC35G2,TYRO3,VEGFB |
 |
|
| ACSM5,ADH1B,ADIPOQ,AQP7,CD300LG,CD36,CIDEA, FABP4,GLYAT,HEPACAM,KCNIP2,LBP,LEP,LGALS12, LIPE,LOC339524,MRAP,PLIN1,PLIN4,SCN4A,TUSC5 | ADIPOQ,AQP7P1,CD300LG,CD36,CIDEA,DEFB132,DGAT2, FABP4,G0S2,GPAM,KCNIP2,LGALS12,LIPE,LOC283392, LPL,MRAP,PLIN1,RBP7,SLC7A10,THRSP,TUSC5 |
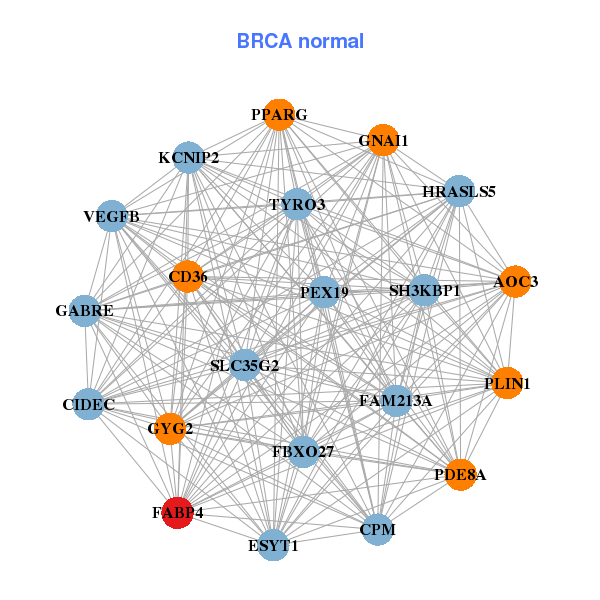
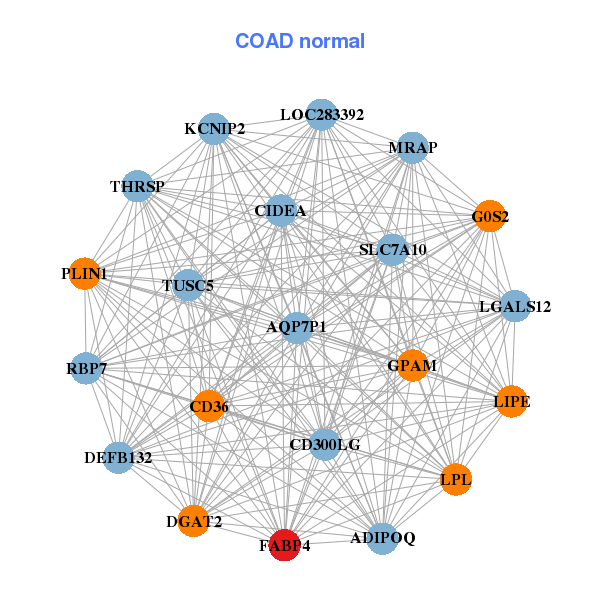
| * Co-Expression network figures were drawn using R package igraph. Only the top 20 genes with the highest correlations were shown. Red circle: input gene, orange circle: cell metabolism gene, sky circle: other gene |
: Open all plots for all cancer types
| Top |
: Open all interacting genes' information including KEGG pathway for all interacting genes from DAVID
| Top |
| Pharmacological Information for FABP4 |
| There's no related Drug. |
| Top |
| Cross referenced IDs for FABP4 |
| * We obtained these cross-references from Uniprot database. It covers 150 different DBs, 18 categories. http://www.uniprot.org/help/cross_references_section |
: Open all cross reference information
|
Copyright © 2016-Present - The Univsersity of Texas Health Science Center at Houston @ |